Embed Size (px)
Citation preview
Optimization of Whole Farm Nutrient Balance:
NN--CyCLECyCLEMichel A. Wattiaux1
1Department of Dairy Science, UW-Madison
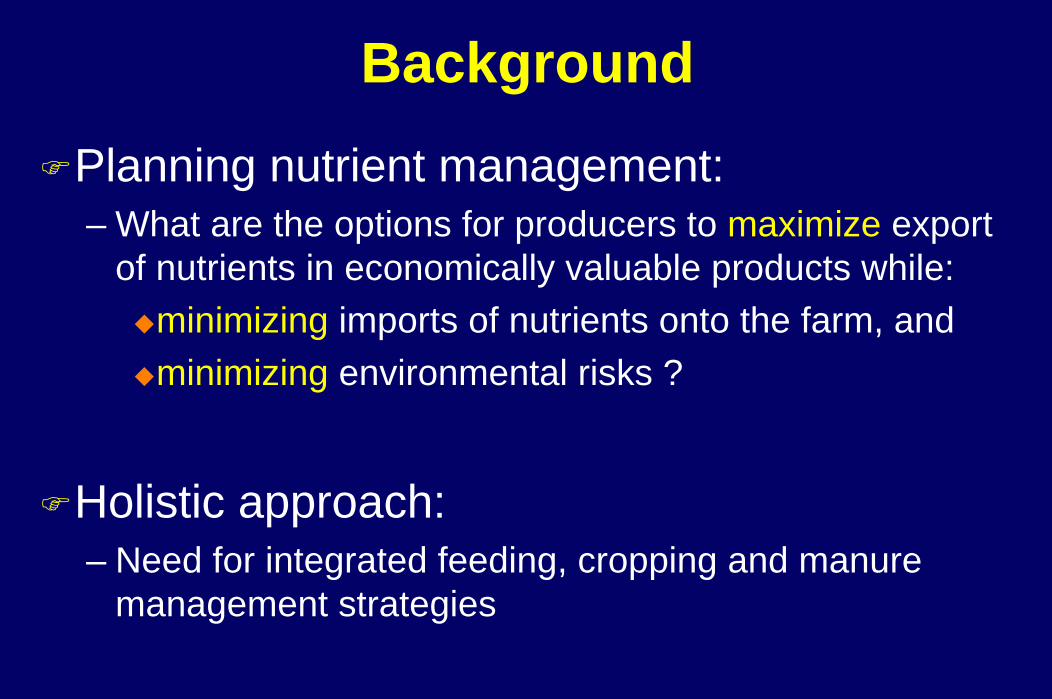
BackgroundPlanning nutrient management:– What are the options for producers to maximize export
of nutrients in economically valuable products while:minimizing imports of nutrients onto the farm, andminimizing environmental risks ?
Holistic approach:– Need for integrated feeding, cropping and manure
management strategies
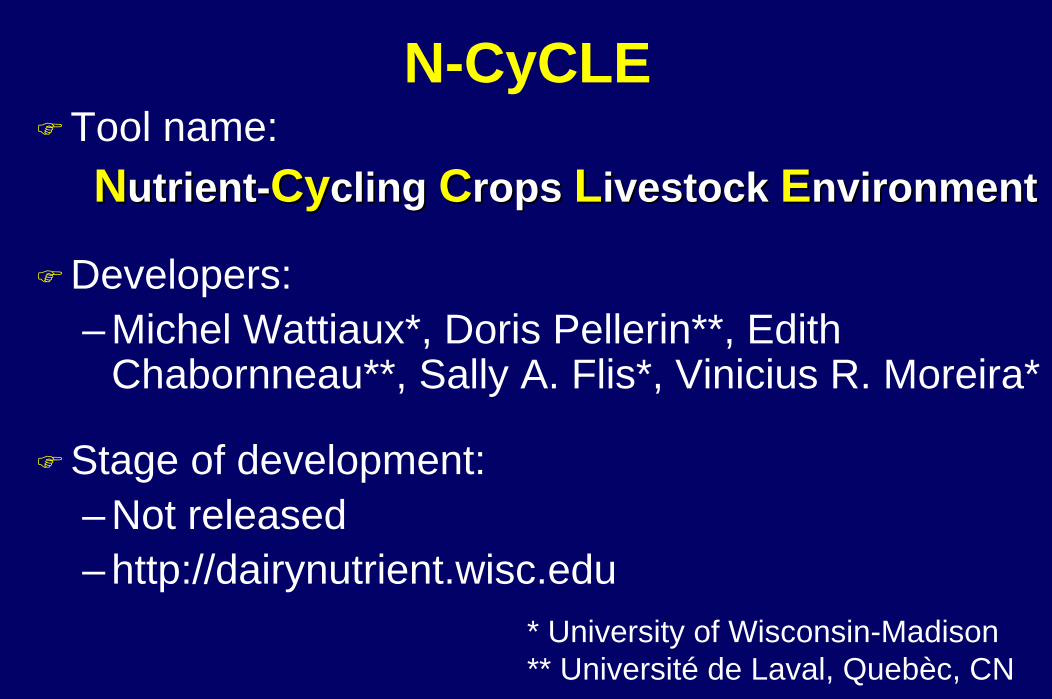
N-CyCLETool name: NNutrientutrient--CyCycling cling CCrops rops LLivestock ivestock EEnvironmentnvironment
Developers:– Michel Wattiaux*, Doris Pellerin**, Edith
Chabornneau**, Sally A. Flis*, Vinicius R. Moreira*
Stage of development:– Not released– http://dairynutrient.wisc.edu
* University of Wisconsin-Madison** Université de Laval, Quebèc, CN

Outline1. N-CyCLE v.1.0
1. Model Objectives and Description2. Strengths and Limitations
2. N-CyCLE v.2.01. Conceptual approach of the model
3. N-CyCLE v.2.51. Inputs, objective functions and constraints, and outputs2. Example
4. Vision for the future

NN--CyCLECyCLE v.1.0v.1.0
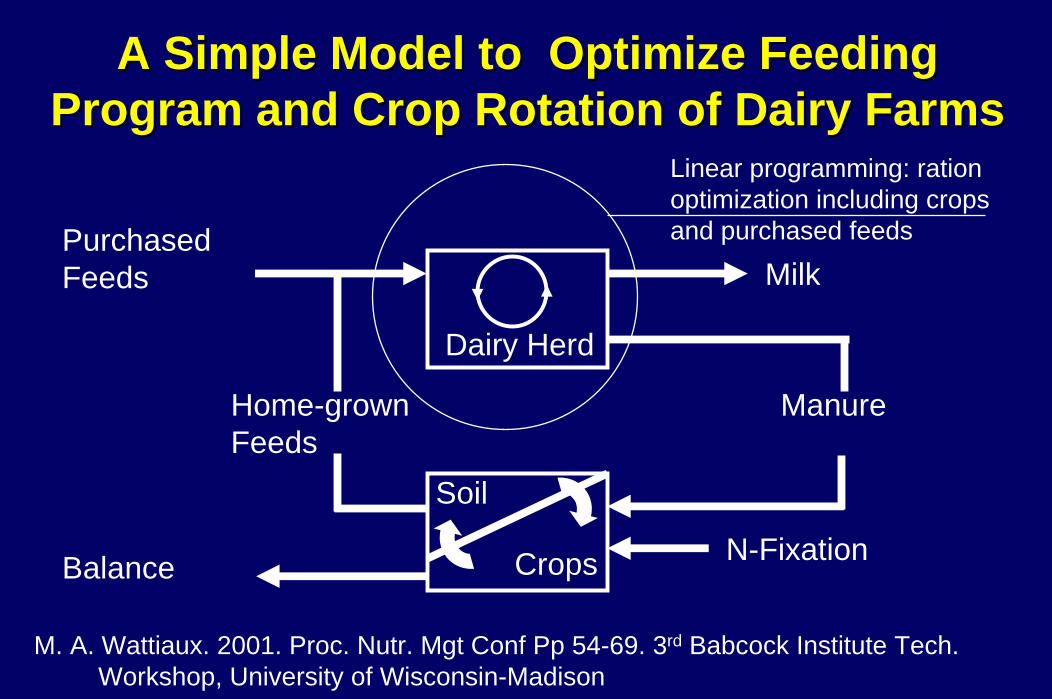
A Simple Model to Optimize Feeding A Simple Model to Optimize Feeding Program and Crop Rotation of Dairy FarmsProgram and Crop Rotation of Dairy Farms
Dairy Herd
Home-grown Feeds
Purchased Feeds Milk
Manure
Soil
Crops N-FixationBalance
Linear programming: ration optimization including crops and purchased feeds
M. A. Wattiaux. 2001. Proc. Nutr. Mgt Conf Pp 54-69. 3rd Babcock Institute Tech. Workshop, University of Wisconsin-Madison
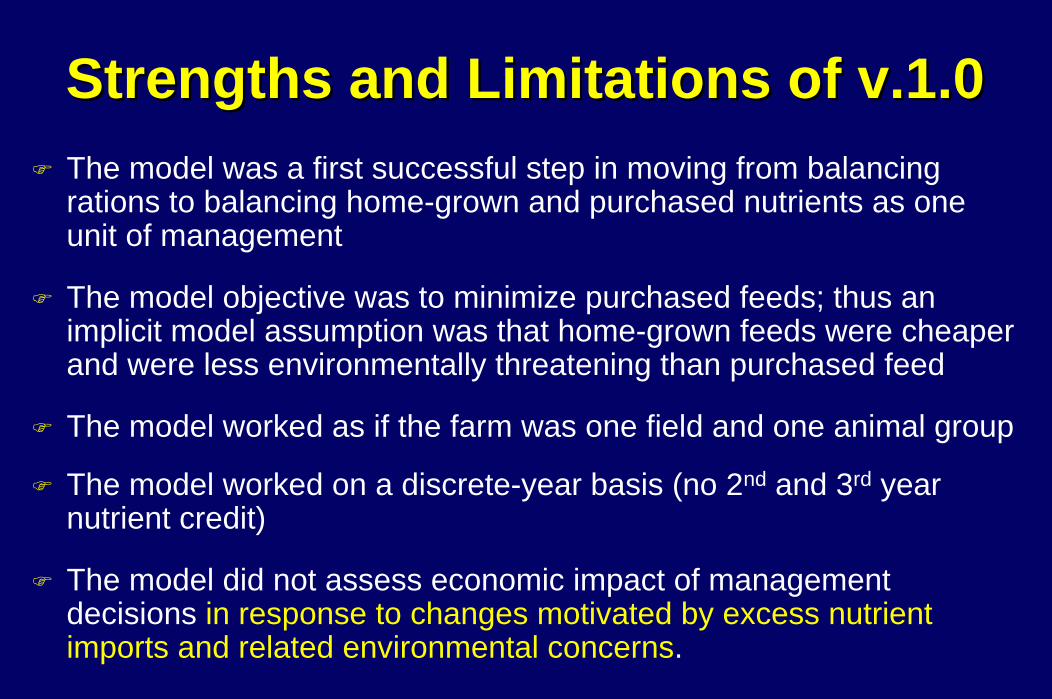
Strengths and Limitations of v.1.0Strengths and Limitations of v.1.0The model was a first successful step in moving from balancing rations to balancing home-grown and purchased nutrients as one unit of management
The model objective was to minimize purchased feeds; thus an implicit model assumption was that home-grown feeds were cheaper and were less environmentally threatening than purchased feed
The model worked as if the farm was one field and one animal group
The model worked on a discrete-year basis (no 2nd and 3rd year nutrient credit)
The model did not assess economic impact of management decisions in response to changes motivated by excess nutrient imports and related environmental concerns.
NN--CyCLECyCLE v.2.0v.2.0

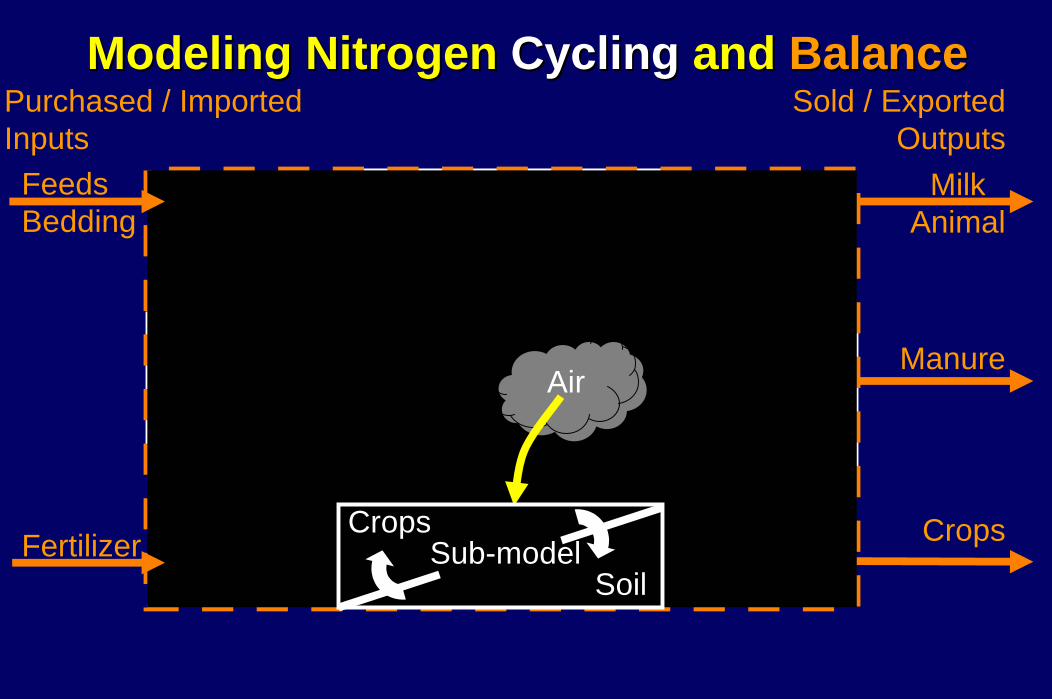
Modeling Nitrogen Modeling Nitrogen CyclingCycling and and BalanceBalance
Dairy Herd sub-model
Soil
CropsSub-model
FeedHarvesting& Storage
(Bedding)
ManureCollection
&Storage
Air
Water
Purchased / ImportedInputs
Manure
Fertilizer
MilkAnimal
Crops
FeedsBedding
Sold / ExportedOutputs
Modeling Nitrogen Modeling Nitrogen CyclingCycling and and BalanceBalance
FeedsBedding
Fertilizer
Dairy Herd sub-model
FeedHarvesting& Storage
(Bedding)
ManureCollection
&Storage
Water
Purchased / ImportedInputs
Manure
MilkAnimal
Crops
Sold / ExportedOutputs
Air
Soil
CropsSub-model

NN--CyCLECyCLE Conceptual FrameworkConceptual Framework
Dairy Herd1: Hi TMR2: Lo TMR3: Dry Cows4: Heifers <1 y
IMPORTS (t/y)
A Conc.Feed
C Fertilizer
B Forage
D N-Fixed
EXPORTS (t/y)
E Milk
B’ Crops
F Animal
G Manure
LiquidManure
SolidManure
10 Home-grownFeeds Fields in group 1
Fields in group 2Fields in group 3
Fields in group 5Fields in group 4
5: Heifers >1 y
Crops
Balance = A + B + C (+ D) - E – F – B’ (- G)

NN--CyCLECyCLE 2.0 and Above2.0 and AbovePurposes:– To describe Nitrogen, Phosphorus and Potassium (pools),
flows and balances across units of management within a farm
– Optimization of the whole-farm model:Net income (maximization)P balance (minimization)N balance (minimization)
Research and Educational tool:– Teaching, Research, Extension– Private consultants
Documentation: in progress
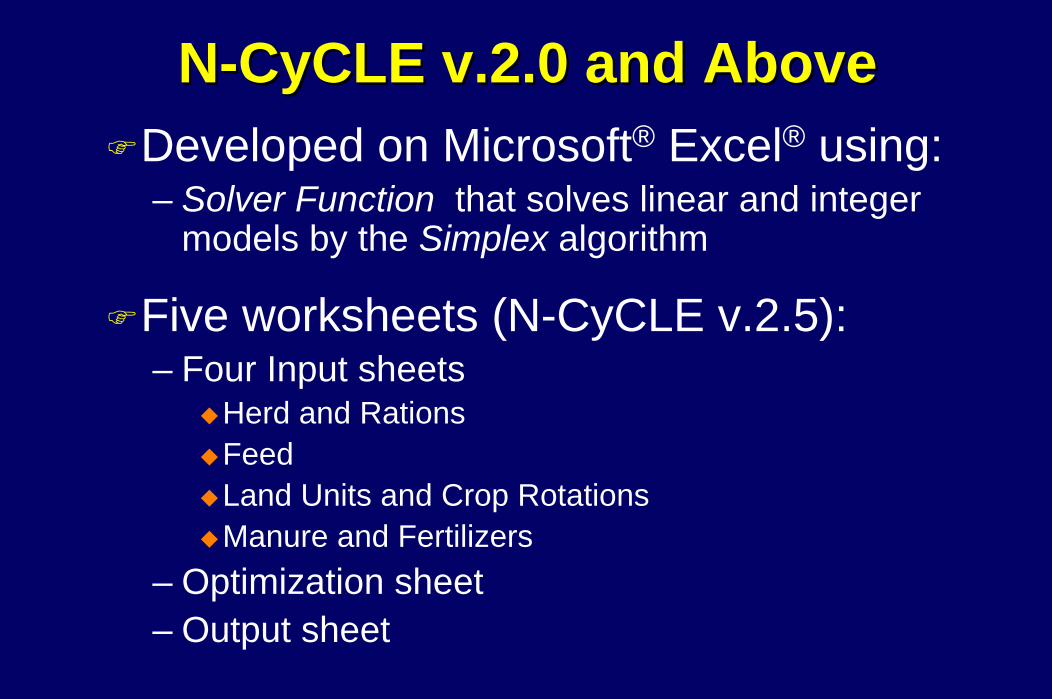
NN--CyCLECyCLE v.2.0 and Abovev.2.0 and AboveDeveloped on Microsoft® Excel® using:– Solver Function that solves linear and integer
models by the Simplex algorithm
Five worksheets (N-CyCLE v.2.5):– Four Input sheets
Herd and RationsFeedLand Units and Crop RotationsManure and Fertilizers
– Optimization sheet– Output sheet

Current versionCurrent versionNN--CyCLECyCLE v.2.5v.2.5
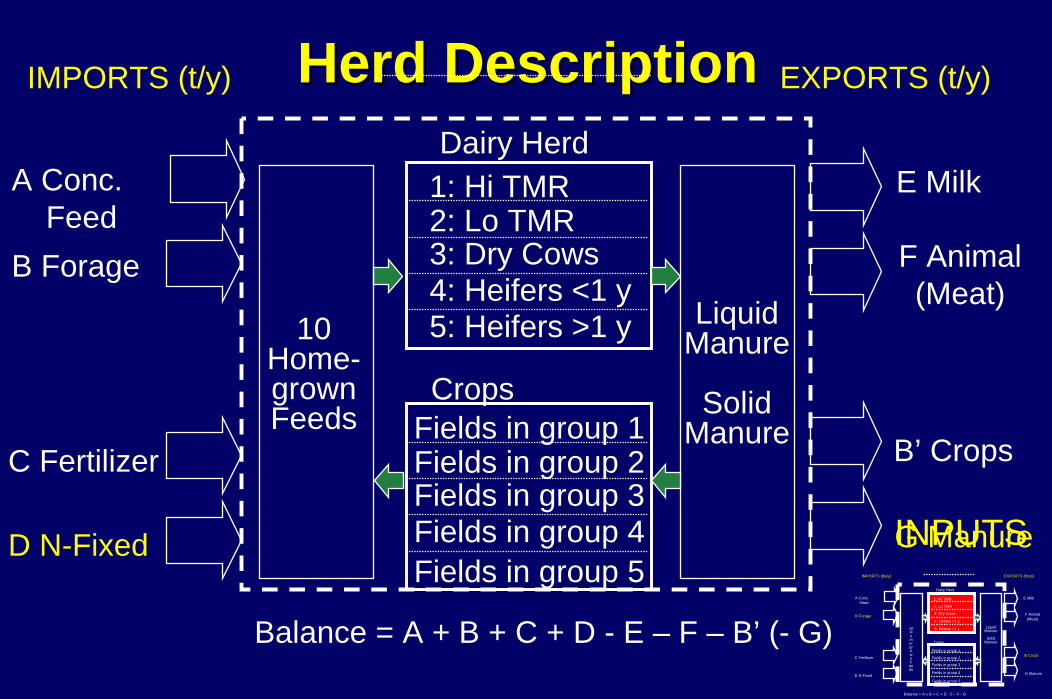
Herd DescriptionHerd DescriptionDairy Herd
1: Hi TMR2: Lo TMR3: Dry Cows4: Heifers <1 y
IMPORTS (t/y)
A Conc.Feed
C Fertilizer
B Forage
D N-Fixed
EXPORTS (t/y)
E Milk
B’ Crops
F Animal(Meat)
G Manure
LiquidManure
SolidManure
10 Home-grownFeeds Fields in group 1
Fields in group 2Fields in group 3
Fields in group 5Fields in group 4
5: Heifers >1 y
Crops
Balance = A + B + C + D - E – F – B’ (- G) Dairy Herd
1: Hi TMR
2: Lo TMR
3: Dry Cows
4: Heifers <1 y
IMPORTS (lbs/y)
A Conc.Feed
C Fertilizer
B Forage
D N-Fixed
EXPORTS (lbs/y)
E Milk
B Crops
F Animal(Meat)
G Manure
LiquidManure
SolidManure
10 Home-grownFeeds
Fields in group 1
Fields in group 2
Fields in group 3
Fields in group 5
Fields in group 4
5: Heifers >1 y
Crops
Balance = A ± B + C + D - E – F - G
INPUTS
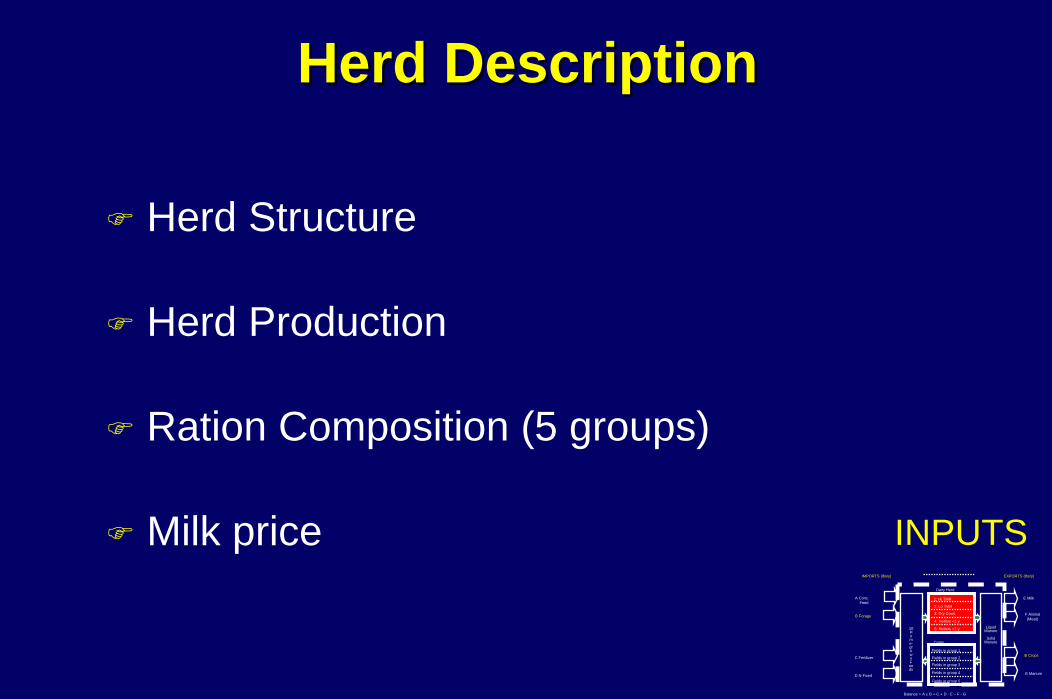
Herd DescriptionHerd Description
Herd Structure
Herd Production
Ration Composition (5 groups)
Milk priceDairy Herd
1: Hi TMR
2: Lo TMR
3: Dry Cows
4: Heifers <1 y
IMPORTS (lbs/y)
A Conc.Feed
C Fertilizer
B Forage
D N-Fixed
EXPORTS (lbs/y)
E Milk
B Crops
F Animal(Meat)
G Manure
LiquidManure
SolidManure
10 Home-grownFeeds
Fields in group 1
Fields in group 2
Fields in group 3
Fields in group 5
Fields in group 4
5: Heifers >1 y
Crops
Balance = A ± B + C + D - E – F - G
INPUTS
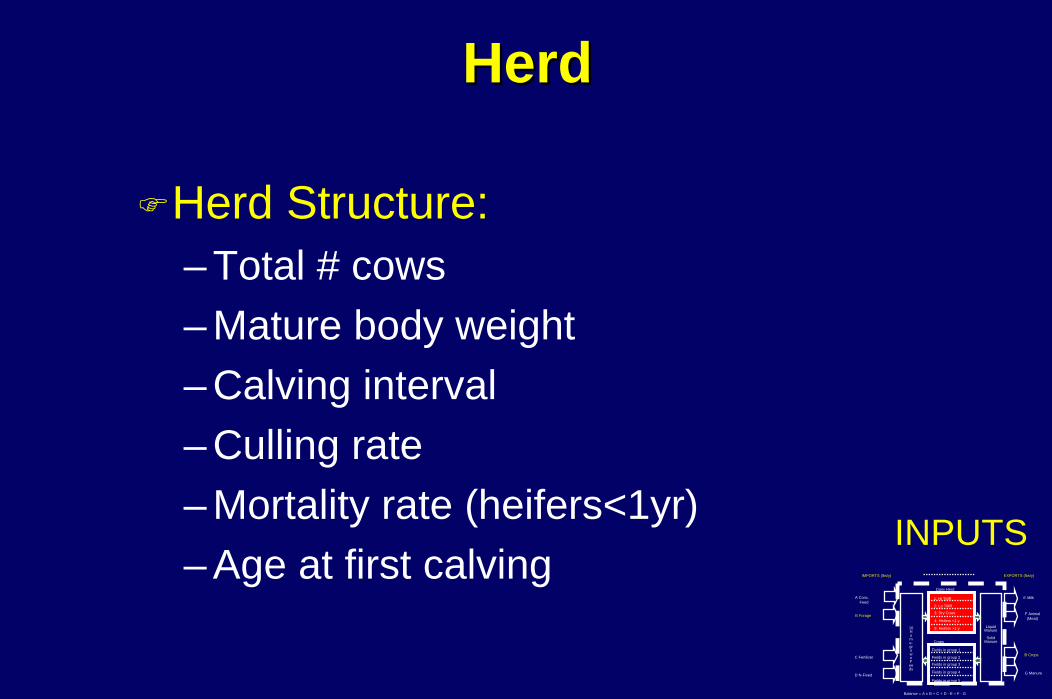
HerdHerd
Herd Structure:– Total # cows– Mature body weight– Calving interval– Culling rate– Mortality rate (heifers<1yr)– Age at first calving
Dairy Herd
1: Hi TMR
2: Lo TMR
3: Dry Cows
4: Heifers <1 y
IMPORTS (lbs/y)
A Conc.Feed
C Fertilizer
B Forage
D N-Fixed
EXPORTS (lbs/y)
E Milk
B Crops
F Animal(Meat)
G Manure
LiquidManure
SolidManure
10 Home-grownFeeds
Fields in group 1
Fields in group 2
Fields in group 3
Fields in group 5
Fields in group 4
5: Heifers >1 y
Crops
Balance = A ± B + C + D - E – F - G
INPUTS
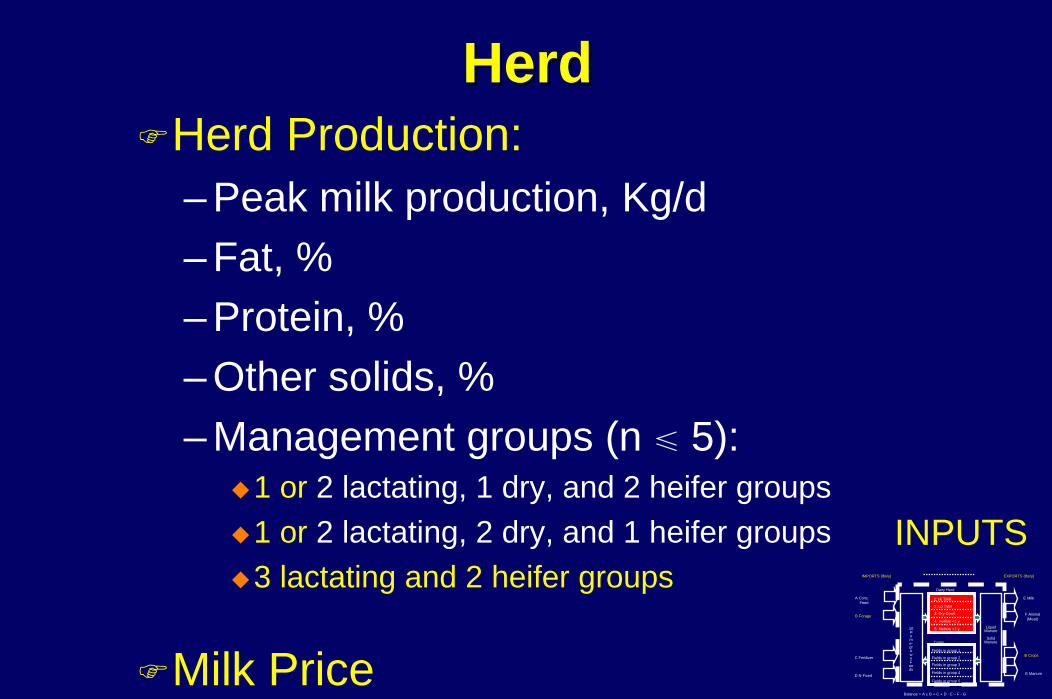
HerdHerdHerd Production:– Peak milk production, Kg/d– Fat, %– Protein, %– Other solids, %– Management groups (n ≤ 5):
1 or 2 lactating, 1 dry, and 2 heifer groups1 or 2 lactating, 2 dry, and 1 heifer groups3 lactating and 2 heifer groups
Milk Price
Dairy Herd
1: Hi TMR
2: Lo TMR
3: Dry Cows
4: Heifers <1 y
IMPORTS (lbs/y)
A Conc.Feed
C Fertilizer
B Forage
D N-Fixed
EXPORTS (lbs/y)
E Milk
B Crops
F Animal(Meat)
G Manure
LiquidManure
SolidManure
10 Home-grownFeeds
Fields in group 1
Fields in group 2
Fields in group 3
Fields in group 5
Fields in group 4
5: Heifers >1 y
Crops
Balance = A ± B + C + D - E – F - G
INPUTS

HerdHerdRation Composition:– Fiber/Energy
Neutral Detergent Fiber (NDF)Forage NDFNon Fiber Carbohydrates (NFC)
– NitrogenRumen Undegraded Protein (RUP) Rumen Degraded Protein (RDP)
– MineralsPCa(K + Na) – (Cl + S)
Dairy Herd
1: Hi TMR
2: Lo TMR
3: Dry Cows
4: Heifers <1 y
IMPORTS (lbs/y)
A Conc.Feed
C Fertilizer
B Forage
D N-Fixed
EXPORTS (lbs/y)
E Milk
B Crops
F Animal(Meat)
G Manure
LiquidManure
SolidManure
10 Home-grownFeeds
Fields in group 1
Fields in group 2
Fields in group 3
Fields in group 5
Fields in group 4
5: Heifers >1 y
Crops
Balance = A ± B + C + D - E – F - G
INPUTS

Feed Feed (and Bedding)(and Bedding) InputsInputsFeed Composition and Prices (n ≤ 20):– Home-grown feed (and bedding) defined by crop
rotation (n ≤ 10)Corn silage, alfalfa silage, grass legume mix, grass silageCorn stover, strawCorn grain, wheat (barley), Soybean (for roasting)
– Purchased feeds (n ≤ 10)Energy sources (e.g. CaFat, WCS)By-products (e.g. CoDi, CGM)RUP and RDP sources (e.g. Sbex, Sbsol, Urea)Minerals (e.g. CaCO3, Ca2PO4)
Dairy Herd
1: Hi TMR
2: Lo TMR
3: Dry Cows
4: Heifers <1 y
IMPORTS (lbs/y)
A Conc.Feed
C Fertilizer
B Forage
D N-Fixed
EXPORTS (lbs/y)
E Milk
B Crops
F Animal(Meat)
G Manure
LiquidManure
SolidManure
10 Home-grownFeeds Fields in group 1
Fields in group 2
Fields in group 3
Fields in group 5
Fields in group 4
5: Heifers >1 y
Crops
Balance = A ± B + C + D - E – F - G
INPUTS

Land Units and Crop RotationsLand Units and Crop RotationsLand Units (n ≤ 5):– Areas– (Distance from facilities)
Crop rotations (n ≤ 5): – User-defined (CCC; SCC; CCAAA; CCCSCAAA; CCCSWAAA)– Yield of each crop in each rotation– N, P, K requirements
Adjusted for Legume creditsSoil test P
– Cost of production ($/ha)Dairy Herd
1: Hi TMR
2: Lo TMR
3: Dry Cows
4: Heifers <1 y
IMPORTS (lbs/y)
A Conc.Feed
C Fertilizer
B Forage
D N-Fixed
EXPORTS (lbs/y)
E Milk
B Crops
F Animal(Meat)
G Manure
LiquidManure
SolidManure
10 Home-grownFeeds Fields in group 1
Fields in group 2
Fields in group 3
Fields in group 5
Fields in group 4
5: Heifers >1 y
Crops
Balance = A ± B + C + D - E – F - G
INPUTS

Manure (N) ManagementManure (N) Management
Type of Manure (Liquid & Solid)
Type of Storage Facility
Method of Manure Spreading
Costs Related to Manure Management INPUTSDairy Herd
1: Hi TMR
2: Lo TMR
3: Dry Cows
4: Heifers <1 y
IMPORTS (lbs/y)
A Conc.Feed
C Fertilizer
B Forage
D N-Fixed
EXPORTS (lbs/y)
E Milk
B Crops
F Animal(Meat)
G Manure
LiquidManure
SolidManure
10 Home-grownFeeds Fields in group 1
Fields in group 2
Fields in group 3
Fields in group 5
Fields in group 4
5: Heifers >1 y
Crops
Balance = A ± B + C + D - E – F - G

Manure (N) ManagementManure (N) Management
Type of Manure & Storage Facility:– Liquid
Daily HaulLiquid Storage:
– Covered– Uncov. Top Loaded– Uncov. Bottom Loaded
– SolidBedded PackStackCompost
Dairy Herd
1: Hi TMR
2: Lo TMR
3: Dry Cows
4: Heifers <1 y
IMPORTS (lbs/y)
A Conc.Feed
C Fertilizer
B Forage
D N-Fixed
EXPORTS (lbs/y)
E Milk
B Crops
F Animal(Meat)
G Manure
LiquidManure
SolidManure
10 Home-grownFeeds Fields in group 1
Fields in group 2
Fields in group 3
Fields in group 5
Fields in group 4
5: Heifers >1 y
Crops
Balance = A ± B + C + D - E – F - G
INPUTS
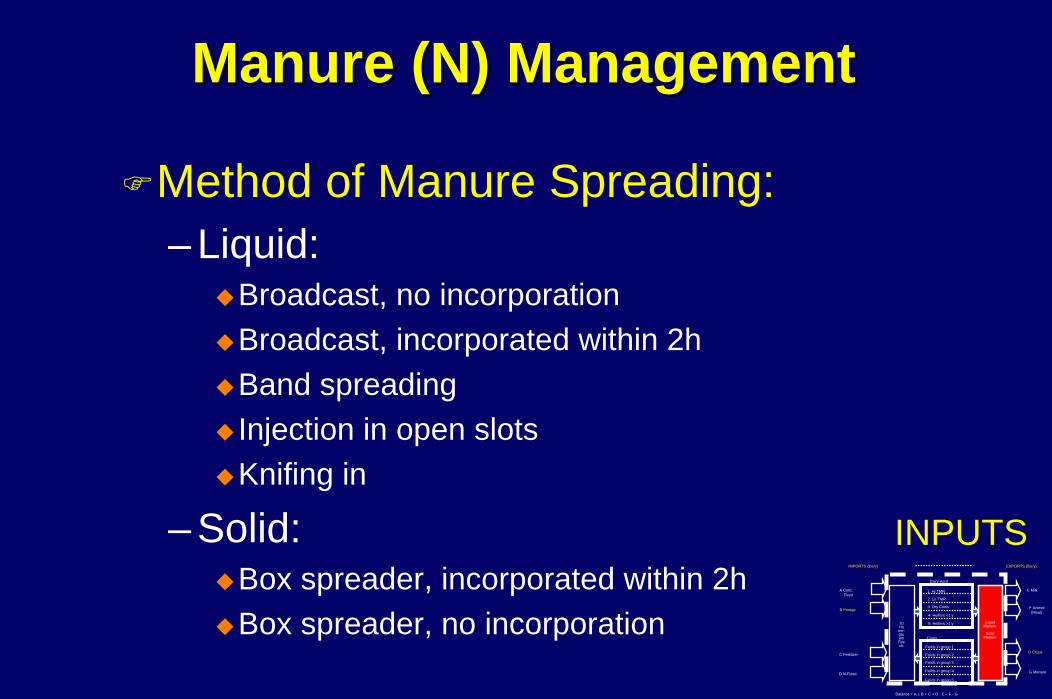
Manure (N) ManagementManure (N) Management
Method of Manure Spreading:– Liquid:
Broadcast, no incorporationBroadcast, incorporated within 2hBand spreadingInjection in open slotsKnifing in
– Solid:Box spreader, incorporated within 2hBox spreader, no incorporation
Dairy Herd
1: Hi TMR
2: Lo TMR
3: Dry Cows
4: Heifers <1 y
IMPORTS (lbs/y)
A Conc.Feed
C Fertilizer
B Forage
D N-Fixed
EXPORTS (lbs/y)
E Milk
B Crops
F Animal(Meat)
G Manure
LiquidManure
SolidManure
10 Home-grownFeeds Fields in group 1
Fields in group 2
Fields in group 3
Fields in group 5
Fields in group 4
5: Heifers >1 y
Crops
Balance = A ± B + C + D - E – F - G
INPUTS

Manure ManagementManure Management
Cost Related to Manure Management:– Cost of production ($/t 0)– Cost for exporting ($/t 100)– Cost of spreading (distance from storage)
Dairy Herd
1: Hi TMR
2: Lo TMR
3: Dry Cows
4: Heifers <1 y
IMPORTS (lbs/y)
A Conc.Feed
C Fertilizer
B Forage
D N-Fixed
EXPORTS (lbs/y)
E Milk
B Crops
F Animal(Meat)
G Manure
LiquidManure
SolidManure
10 Home-grownFeeds Fields in group 1
Fields in group 2
Fields in group 3
Fields in group 5
Fields in group 4
5: Heifers >1 y
Crops
Balance = A ± B + C + D - E – F - G
INPUTS

FertilizersFertilizers
Purchased Fertilizers (n=4):– User-defined (e.g.: 18-46-0; 27-0-0; 0-46-0; 0-0-60)
– Nutrient contents (N, P & K)
– Market prices– Variable spreading costs per Land Unit
Dairy Herd
1: Hi TMR
2: Lo TMR
3: Dry Cows
4: Heifers <1 y
IMPORTS (lbs/y)
A Conc.Feed
C Fertilizer
B Forage
D N-Fixed
EXPORTS (lbs/y)
E Milk
B Crops
F Animal(Meat)
G Manure
LiquidManure
SolidManure
10 Home-grownFeeds Fields in group 1
Fields in group 2
Fields in group 3
Fields in group 5
Fields in group 4
5: Heifers >1 y
Crops
Balance = A ± B + C + D - E – F - G
INPUTS
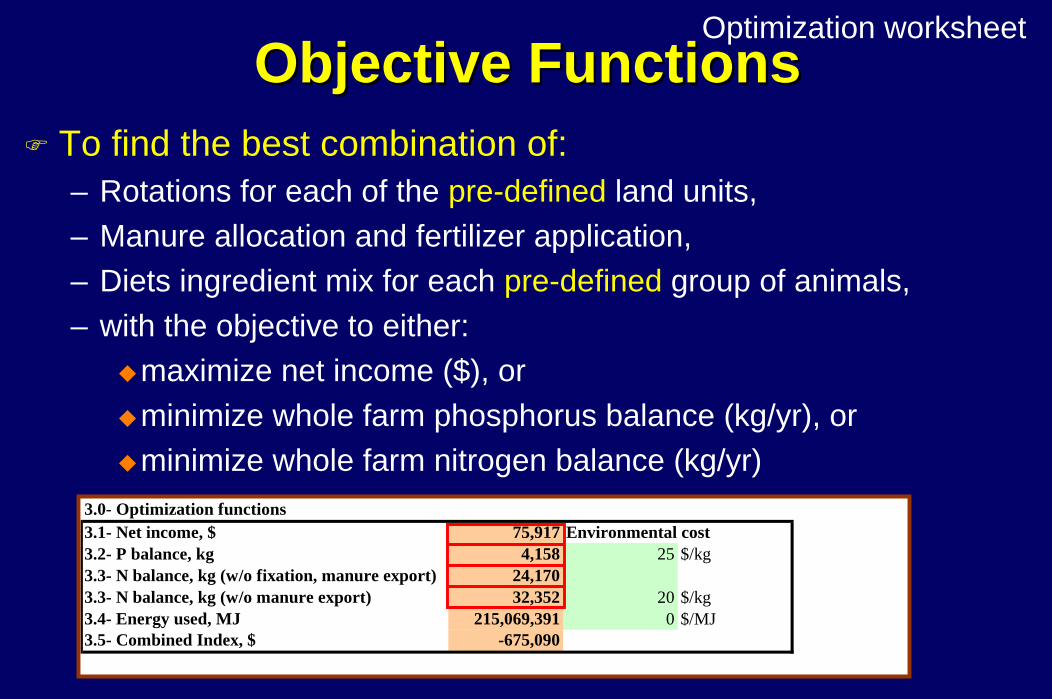
Objective FunctionsObjective FunctionsTo find the best combination of:– Rotations for each of the pre-defined land units, – Manure allocation and fertilizer application, – Diets ingredient mix for each pre-defined group of animals, – with the objective to either:
maximize net income ($), or minimize whole farm phosphorus balance (kg/yr), or minimize whole farm nitrogen balance (kg/yr)
3.0- Optimization functions3.1- Net income, $ 75,917 Environmental cost3.2- P balance, kg 4,158 25 $/kg3.3- N balance, kg (w/o fixation, manure export) 24,1703.3- N balance, kg (w/o manure export) 32,352 20 $/kg3.4- Energy used, MJ 215,069,391 0 $/MJ3.5- Combined Index, $ -675,090
Optimization worksheet
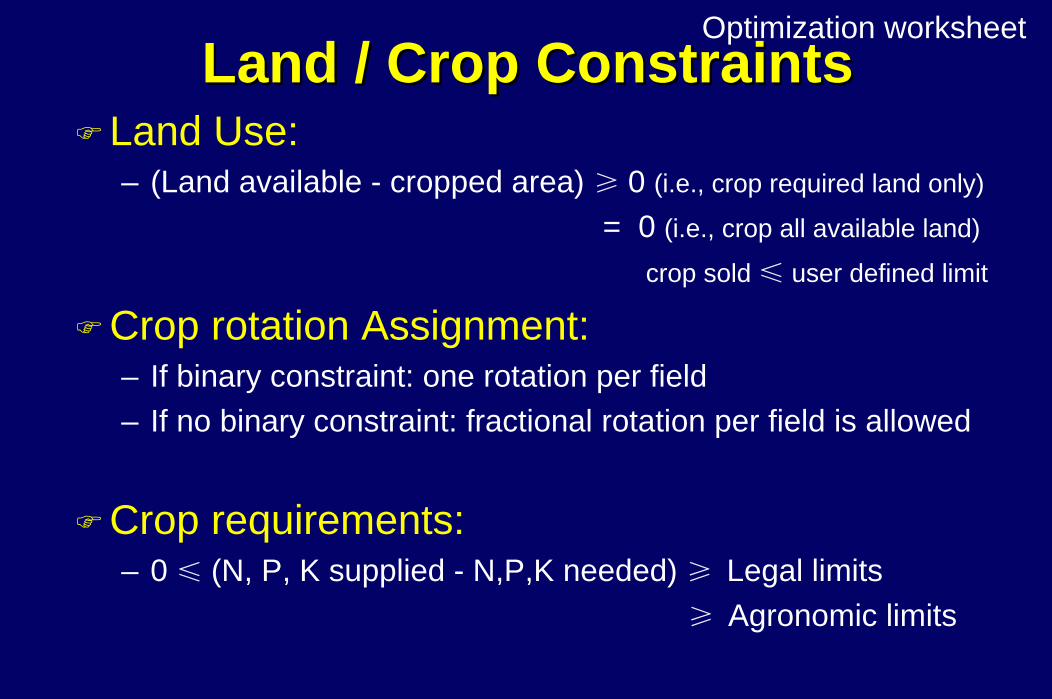
Land / Crop Constraints Land / Crop Constraints Land Use:– (Land available - cropped area) ≥ 0 (i.e., crop required land only)
= 0 (i.e., crop all available land)
crop sold ≤ user defined limit
Crop rotation Assignment:– If binary constraint: one rotation per field– If no binary constraint: fractional rotation per field is allowed
Crop requirements:– 0 ≤ (N, P, K supplied - N,P,K needed) ≥ Legal limits
≥ Agronomic limits
Optimization worksheet
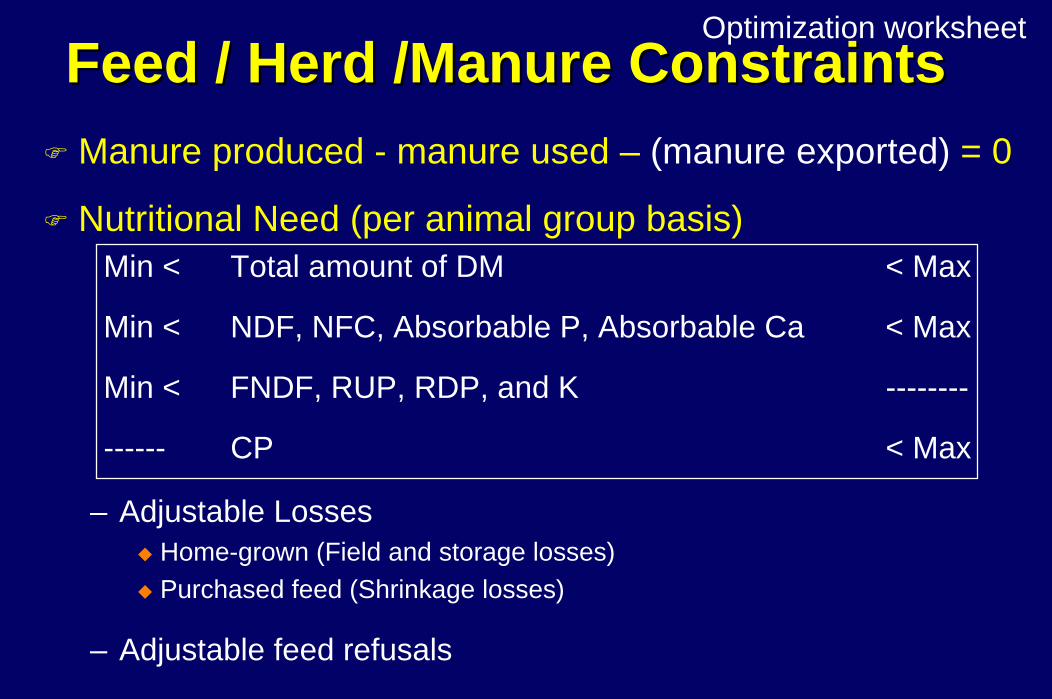
Feed / Herd /Manure ConstraintsFeed / Herd /Manure ConstraintsManure produced - manure used – (manure exported) = 0
Nutritional Need (per animal group basis)Min < Total amount of DM < Max
Min < NDF, NFC, Absorbable P, Absorbable Ca < Max
Min < FNDF, RUP, RDP, and K --------
------ CP < Max
– Adjustable LossesHome-grown (Field and storage losses)Purchased feed (Shrinkage losses)
– Adjustable feed refusals
Optimization worksheet
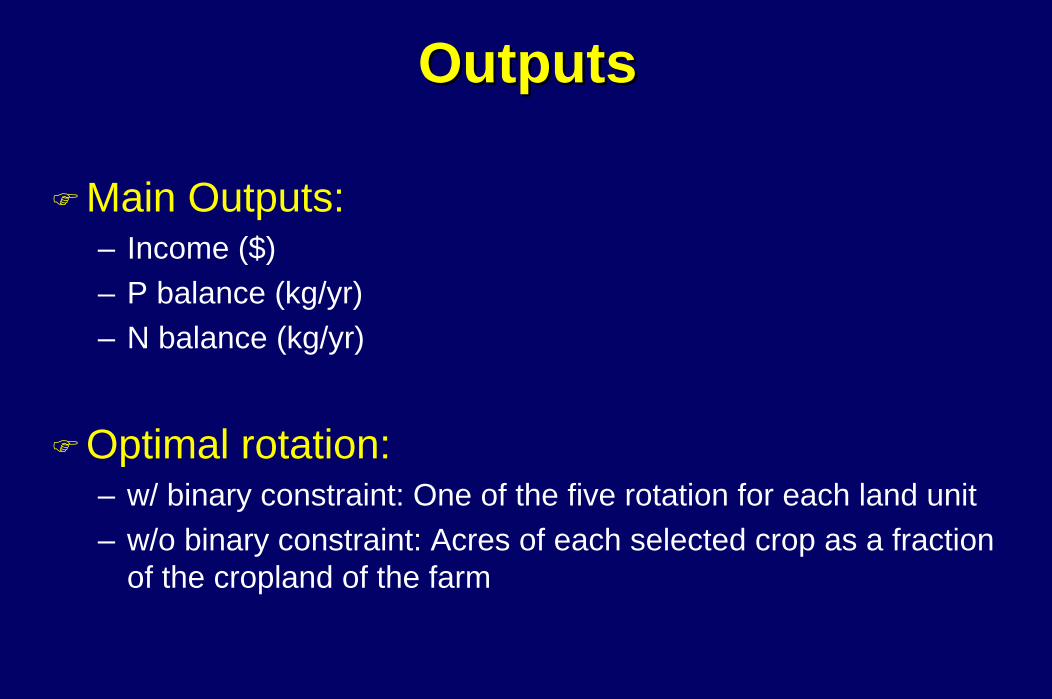
Outputs Outputs
Main Outputs:– Income ($)– P balance (kg/yr)– N balance (kg/yr)
Optimal rotation:– w/ binary constraint: One of the five rotation for each land unit– w/o binary constraint: Acres of each selected crop as a fraction
of the cropland of the farm

Model OutputsModel Outputs
Crop Fertilization plan:– Type and amount of purchased fertilizer and manure to apply on
each land unit– Amount of manure to export (if allowed)
Feeding program:– Type and amount of purchased feed and home-grown feed to
offer each animal group– Amount of home grown feed to sell (if allowed)

N-CyCLE 2.5Example

ScenarioScenario– 192.4 ha (50; 50; 50; 42.4 ha) with high soil P test– 190-cow herd producing 10,000kg/lactation
Hi groupLo groupFar-offPre-fresh153 Heifers
– RotationsCS-CG-CGSoybean-CS-CGCS-CG-Alfalfa-Alfalfa-AlfalfaCS-CG-CS-Soybean-CG-Alfalfa-Alfalfa-AlfalfaCS-CG-CS-Soybean-Wheat-Alfalfa-Alfalfa-Alfalfa
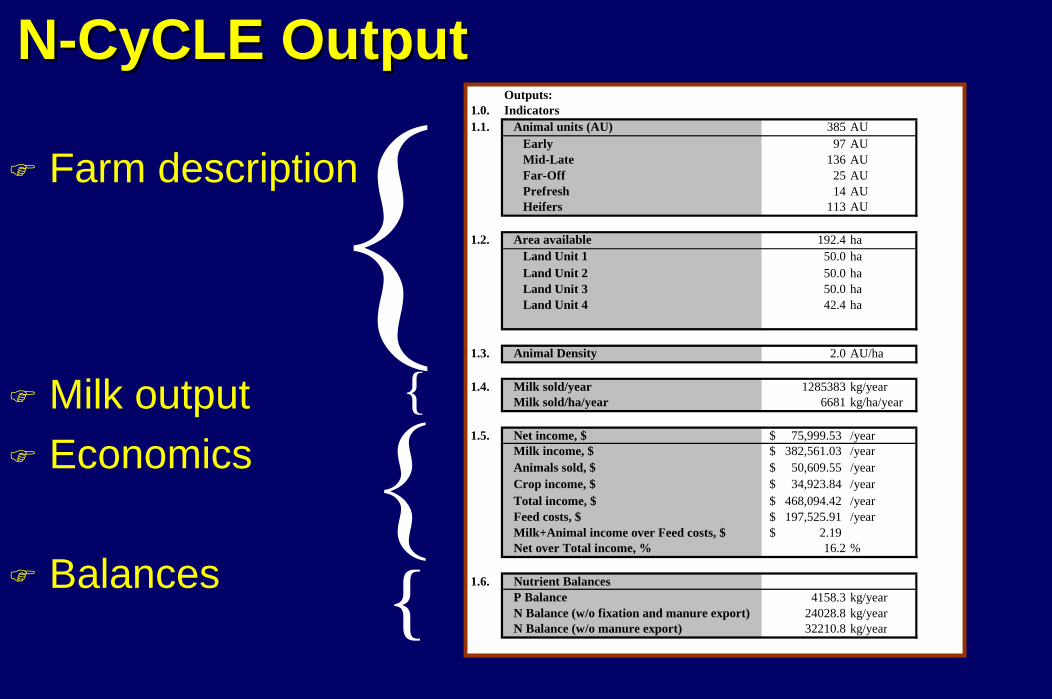
Outputs:1.0. Indicators1.1. Animal units (AU) 385 AU
Early 97 AUMid-Late 136 AUFar-Off 25 AUPrefresh 14 AUHeifers 113 AU
1.2. Area available 192.4 haLand Unit 1 50.0 haLand Unit 2 50.0 haLand Unit 3 50.0 haLand Unit 4 42.4 ha
1.3. Animal Density 2.0 AU/ha
1.4. Milk sold/year 1285383 kg/yearMilk sold/ha/year 6681 kg/ha/year
1.5. Net income, $ 75,999.53$ /yearMilk income, $ 382,561.03$ /yearAnimals sold, $ 50,609.55$ /yearCrop income, $ 34,923.84$ /yearTotal income, $ 468,094.42$ /yearFeed costs, $ 197,525.91$ /yearMilk+Animal income over Feed costs, $ 2.19$ Net over Total income, % 16.2 %
1.6. Nutrient BalancesP Balance 4158.3 kg/yearN Balance (w/o fixation and manure export) 24028.8 kg/yearN Balance (w/o manure export) 32210.8 kg/year
NN--CyCLECyCLE OutputOutput
Farm description
Milk outputEconomics
Balances
{
{
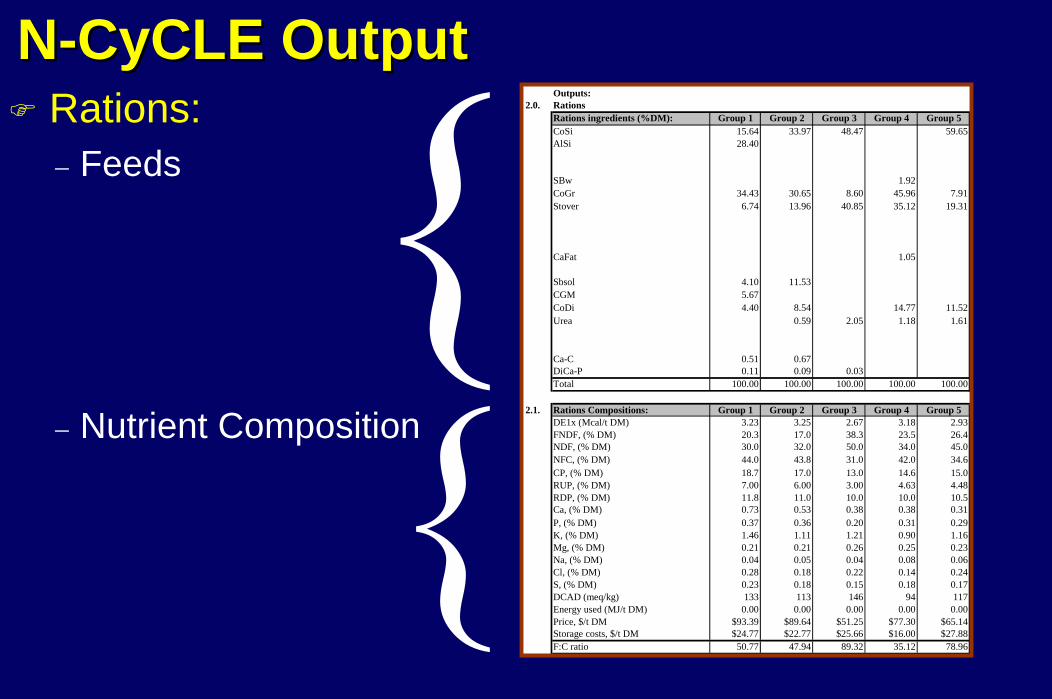
Outputs:2.0. Rations
Rations ingredients (%DM): Group 1 Group 2 Group 3 Group 4 Group 5CoSi 15.64 33.97 48.47 59.65AlSi 28.40
SBw 1.92CoGr 34.43 30.65 8.60 45.96 7.91Stover 6.74 13.96 40.85 35.12 19.31
CaFat 1.05
Sbsol 4.10 11.53CGM 5.67CoDi 4.40 8.54 14.77 11.52Urea 0.59 2.05 1.18 1.61
Ca-C 0.51 0.67DiCa-P 0.11 0.09 0.03Total 100.00 100.00 100.00 100.00 100.00
2.1. Rations Compositions: Group 1 Group 2 Group 3 Group 4 Group 5DE1x (Mcal/t DM) 3.23 3.25 2.67 3.18 2.93FNDF, (% DM) 20.3 17.0 38.3 23.5 26.4NDF, (% DM) 30.0 32.0 50.0 34.0 45.0NFC, (% DM) 44.0 43.8 31.0 42.0 34.6CP, (% DM) 18.7 17.0 13.0 14.6 15.0RUP, (% DM) 7.00 6.00 3.00 4.63 4.48RDP, (% DM) 11.8 11.0 10.0 10.0 10.5Ca, (% DM) 0.73 0.53 0.38 0.38 0.31P, (% DM) 0.37 0.36 0.20 0.31 0.29K, (% DM) 1.46 1.11 1.21 0.90 1.16Mg, (% DM) 0.21 0.21 0.26 0.25 0.23Na, (% DM) 0.04 0.05 0.04 0.08 0.06Cl, (% DM) 0.28 0.18 0.22 0.14 0.24S, (% DM) 0.23 0.18 0.15 0.18 0.17DCAD (meq/kg) 133 113 146 94 117Energy used (MJ/t DM) 0.00 0.00 0.00 0.00 0.00Price, $/t DM $93.39 $89.64 $51.25 $77.30 $65.14Storage costs, $/t DM $24.77 $22.77 $25.66 $16.00 $27.88F:C ratio 50.77 47.94 89.32 35.12 78.96
NN--CyCLECyCLE OutputOutputRations:− Feeds
− Nutrient Composition
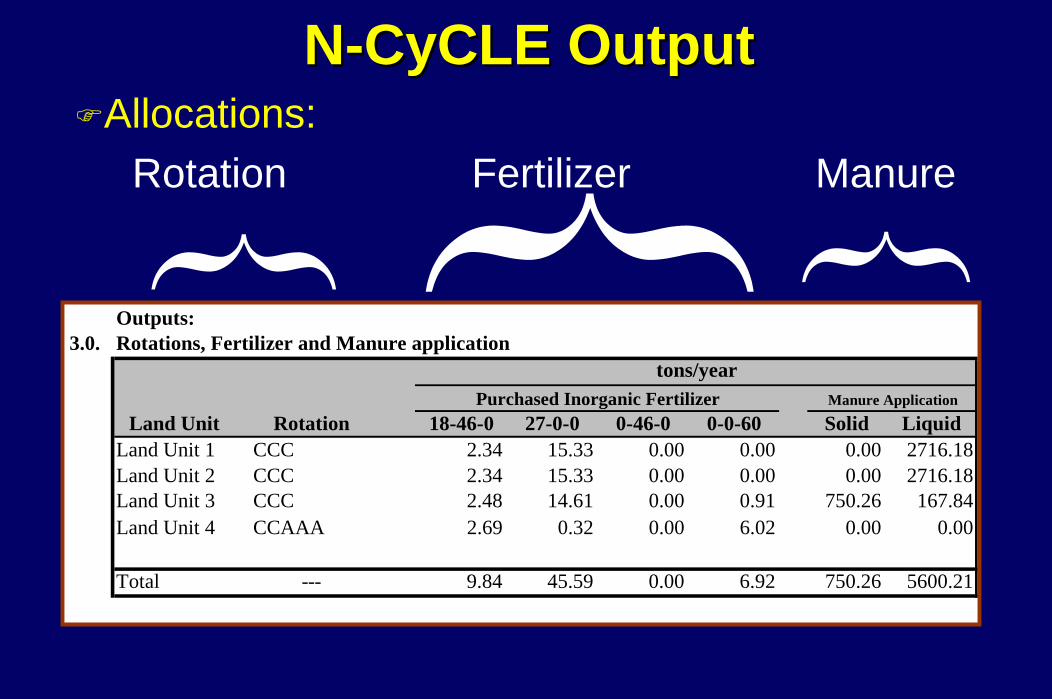
Outputs:3.0. Rotations, Fertilizer and Manure application
Land Unit Rotation 18-46-0 27-0-0 0-46-0 0-0-60 Solid LiquidLand Unit 1 CCC 2.34 15.33 0.00 0.00 0.00 2716.18Land Unit 2 CCC 2.34 15.33 0.00 0.00 0.00 2716.18Land Unit 3 CCC 2.48 14.61 0.00 0.91 750.26 167.84Land Unit 4 CCAAA 2.69 0.32 0.00 6.02 0.00 0.00
Total --- 9.84 45.59 0.00 6.92 750.26 5600.21
Purchased Inorganic Fertilizer Manure Application
tons/year
NN--CyCLECyCLE OutputOutputAllocations:
Rotation Fertilizer Manure
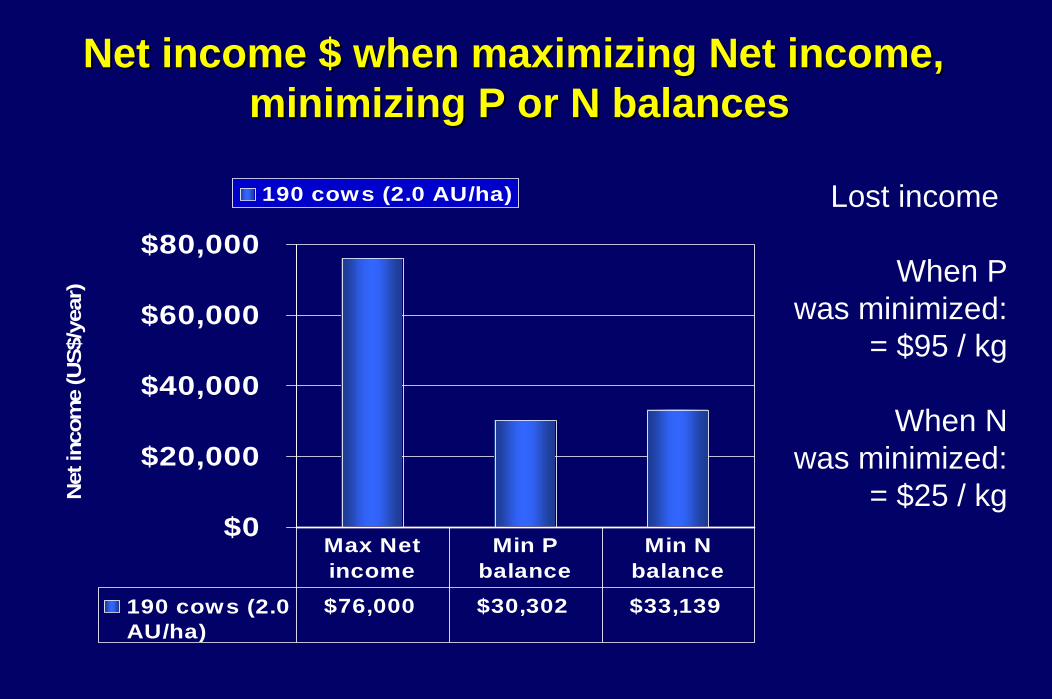
Net income $ when maximizing Net income,Net income $ when maximizing Net income,minimizing P or N balancesminimizing P or N balances
$0
$20,000
$40,000
$60,000
$80,000
Net
inco
me
(US$
/yea
r)
190 cows (2.0 AU/ha)
190 cows (2.0AU/ha)
$76,000 $30,302 $33,139
Max Net income
Min P balance
Min N balance
Lost income
When Pwas minimized:
= $95 / kg
When Nwas minimized:
= $25 / kg
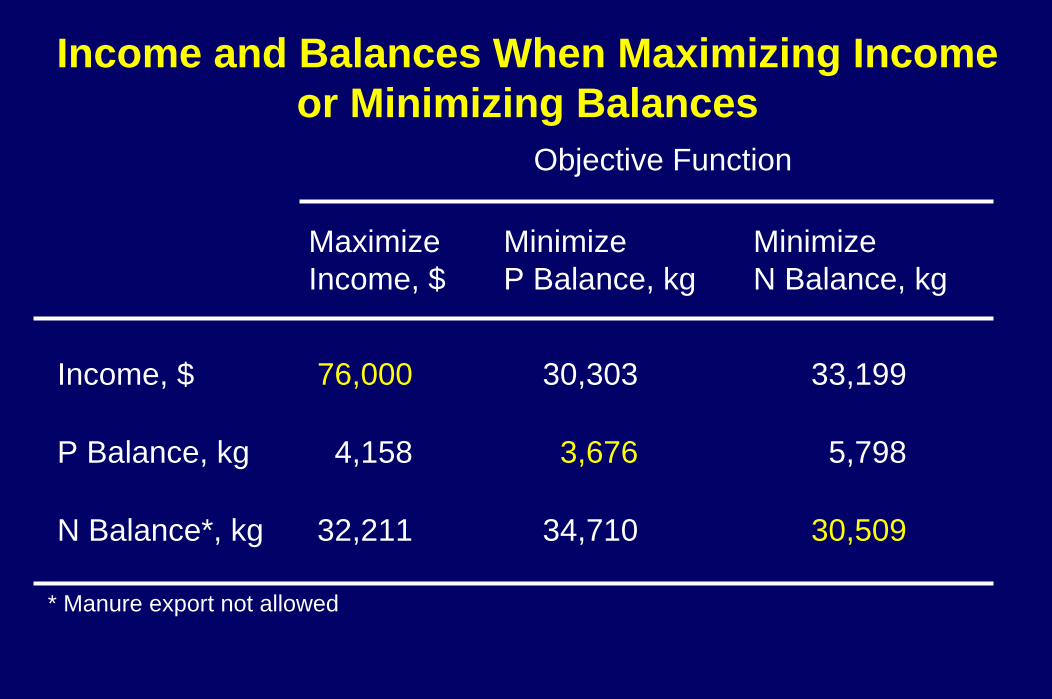
Income and Balances When Maximizing Income or Minimizing Balances
Income, $
P Balance, kg
N Balance*, kg
Maximize Income, $
MinimizeP Balance, kg
MinimizeN Balance, kg
76,000
4,158
32,211
30,303
3,676
34,710
33,199
5,798
30,509
Objective Function
* Manure export not allowed
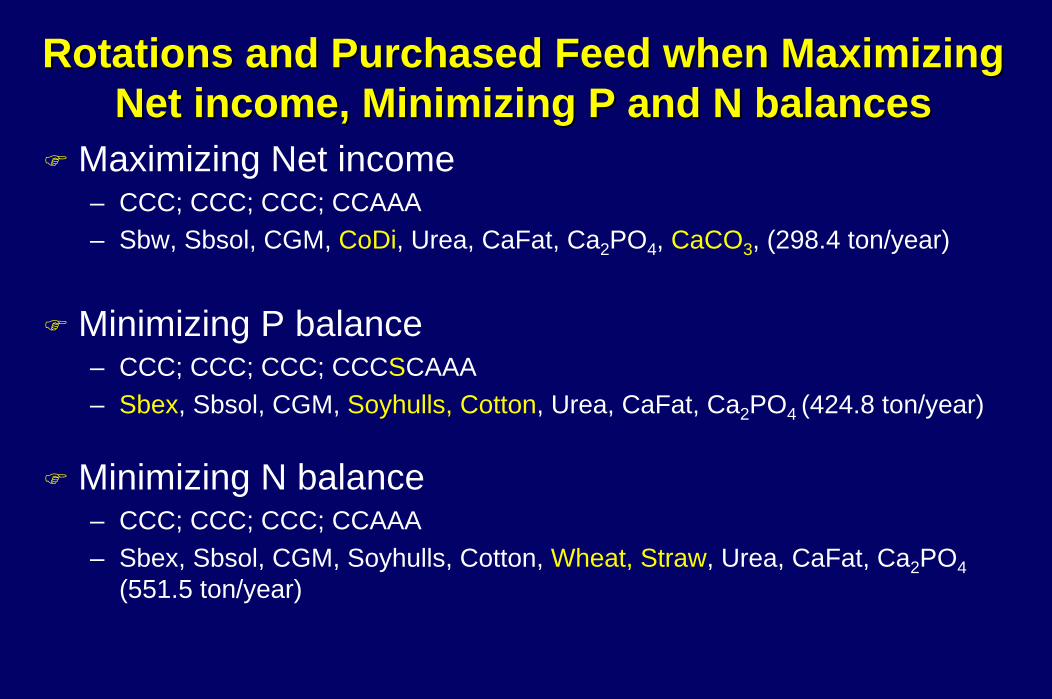
Rotations and Purchased Feed when Maximizing Rotations and Purchased Feed when Maximizing Net income, Minimizing P and N balancesNet income, Minimizing P and N balances
Maximizing Net income– CCC; CCC; CCC; CCAAA– Sbw, Sbsol, CGM, CoDi, Urea, CaFat, Ca2PO4, CaCO3, (298.4 ton/year)
Minimizing P balance– CCC; CCC; CCC; CCCSCAAA– Sbex, Sbsol, CGM, Soyhulls, Cotton, Urea, CaFat, Ca2PO4 (424.8 ton/year)
Minimizing N balance– CCC; CCC; CCC; CCAAA– Sbex, Sbsol, CGM, Soyhulls, Cotton, Wheat, Straw, Urea, CaFat, Ca2PO4
(551.5 ton/year)

SummarySummary
N-CyCLE v.2.5 provides an economic evaluation of management practices including those related to “environmental management” of farms– What is the cost/benefit of reducing N balance?– What is the cost/benefit of reduction P balance?
N-CyCLE v.2.5 provides a mean to compare current practices to an “optimal” set of “Best Management Practices”
Summary and (near) FutureSummary and (near) FutureN-Cycle allows:– Land use studies
Land requirement for different crop rotation systemsLand requirement for farm of increasing animal density
– Sensitivity analysesChange in feed or fertilizer market prices on feeding and cropping strategiesChange in BMP to maintain high N/P ratio in manureForage quality
– Quantify losses and soil build-upLong term change in Soil test PAmmonia-N losses
– Evaluation of the economic impact of regulatory policies
Limit P balanceLimit Ammonia Loss

LimitationsLimitationsInput intensive/knowledge intensive– Not (yet) user friendly
Limited usage– Require additional validation
Inherent limitation of Linear programming– “Everything” is linear– How can economies of scale be built in a linear programming?
Incomplete estimates of environmental losses– N leaching
“Garbage in, Garbage out”

Nutrient - Cycling Crops - Livestock - Environment
Environment(air & water)
Purchased Fertilizer/Manure
CropSold
FixedN
SoilCrops
Pasture
Purchased Feed
Livestock
Milk/LivestockSold
ManureSold
Stored Feed