Embed Size (px)
Citation preview

1
Feedforward Response in Anticipation of Physical
Activity
Kelly Danek, Kelly Loberger, Sam Miller, Abby Schabel
University of Wisconsin-Madison, Department of Physiology
Physiology 435
Lab 603, Group 12
Key Words: blood pressure, clench force, feedforward, heart rate, physical activity, respiration
rate, stress
Word count: 3,447
2
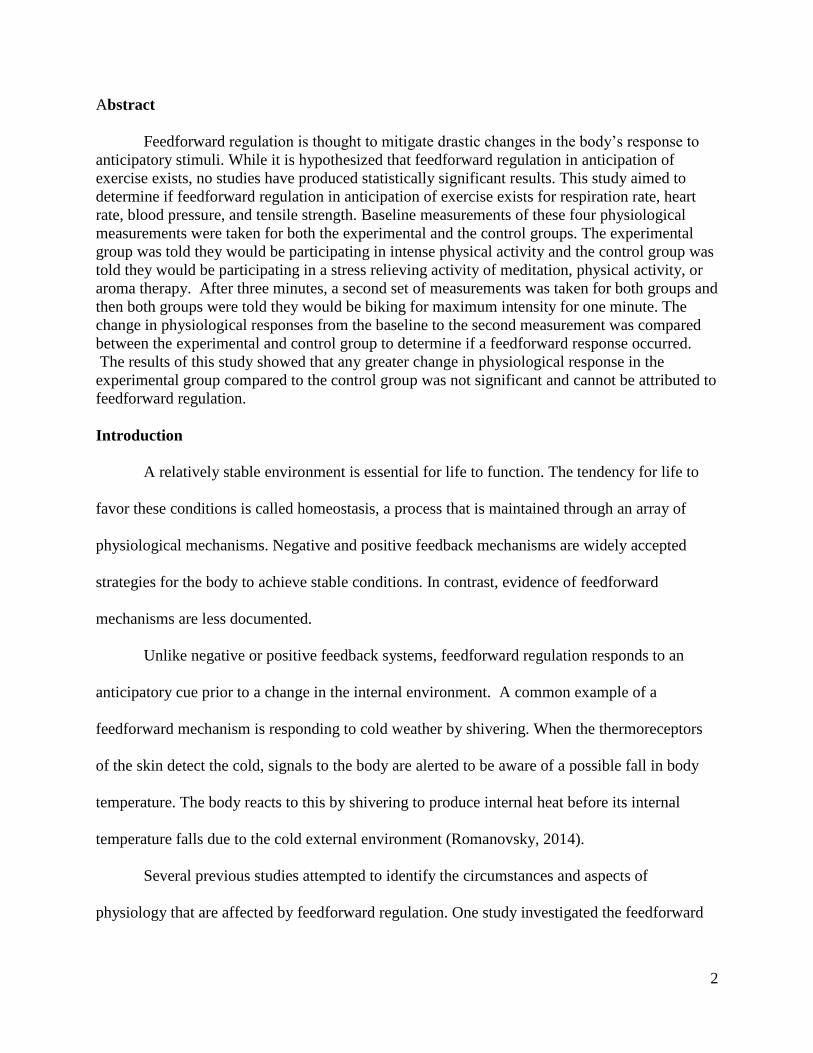
Abstract
Feedforward regulation is thought to mitigate drastic changes in the body’s response to
anticipatory stimuli. While it is hypothesized that feedforward regulation in anticipation of
exercise exists, no studies have produced statistically significant results. This study aimed to
determine if feedforward regulation in anticipation of exercise exists for respiration rate, heart
rate, blood pressure, and tensile strength. Baseline measurements of these four physiological
measurements were taken for both the experimental and the control groups. The experimental
group was told they would be participating in intense physical activity and the control group was
told they would be participating in a stress relieving activity of meditation, physical activity, or
aroma therapy. After three minutes, a second set of measurements was taken for both groups and
then both groups were told they would be biking for maximum intensity for one minute. The
change in physiological responses from the baseline to the second measurement was compared
between the experimental and control group to determine if a feedforward response occurred.
The results of this study showed that any greater change in physiological response in the
experimental group compared to the control group was not significant and cannot be attributed to
feedforward regulation.
Introduction
A relatively stable environment is essential for life to function. The tendency for life to
favor these conditions is called homeostasis, a process that is maintained through an array of
physiological mechanisms. Negative and positive feedback mechanisms are widely accepted
strategies for the body to achieve stable conditions. In contrast, evidence of feedforward
mechanisms are less documented.
Unlike negative or positive feedback systems, feedforward regulation responds to an
anticipatory cue prior to a change in the internal environment. A common example of a
feedforward mechanism is responding to cold weather by shivering. When the thermoreceptors
of the skin detect the cold, signals to the body are alerted to be aware of a possible fall in body
temperature. The body reacts to this by shivering to produce internal heat before its internal
temperature falls due to the cold external environment (Romanovsky, 2014).
Several previous studies attempted to identify the circumstances and aspects of
physiology that are affected by feedforward regulation. One study investigated the feedforward
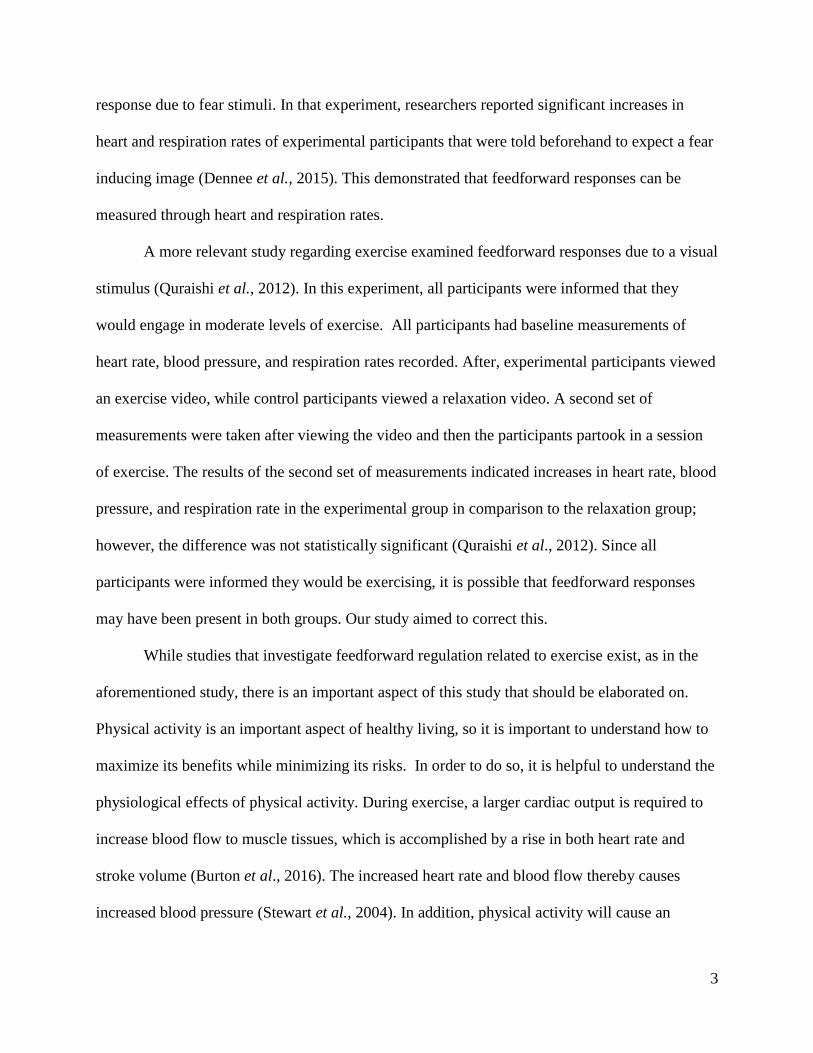
3
response due to fear stimuli. In that experiment, researchers reported significant increases in
heart and respiration rates of experimental participants that were told beforehand to expect a fear
inducing image (Dennee et al., 2015). This demonstrated that feedforward responses can be
measured through heart and respiration rates.
A more relevant study regarding exercise examined feedforward responses due to a visual
stimulus (Quraishi et al., 2012). In this experiment, all participants were informed that they
would engage in moderate levels of exercise. All participants had baseline measurements of
heart rate, blood pressure, and respiration rates recorded. After, experimental participants viewed
an exercise video, while control participants viewed a relaxation video. A second set of
measurements were taken after viewing the video and then the participants partook in a session
of exercise. The results of the second set of measurements indicated increases in heart rate, blood
pressure, and respiration rate in the experimental group in comparison to the relaxation group;
however, the difference was not statistically significant (Quraishi et al., 2012). Since all
participants were informed they would be exercising, it is possible that feedforward responses
may have been present in both groups. Our study aimed to correct this.
While studies that investigate feedforward regulation related to exercise exist, as in the
aforementioned study, there is an important aspect of this study that should be elaborated on.
Physical activity is an important aspect of healthy living, so it is important to understand how to
maximize its benefits while minimizing its risks. In order to do so, it is helpful to understand the
physiological effects of physical activity. During exercise, a larger cardiac output is required to
increase blood flow to muscle tissues, which is accomplished by a rise in both heart rate and
stroke volume (Burton et al., 2016). The increased heart rate and blood flow thereby causes
increased blood pressure (Stewart et al., 2004). In addition, physical activity will cause an
4
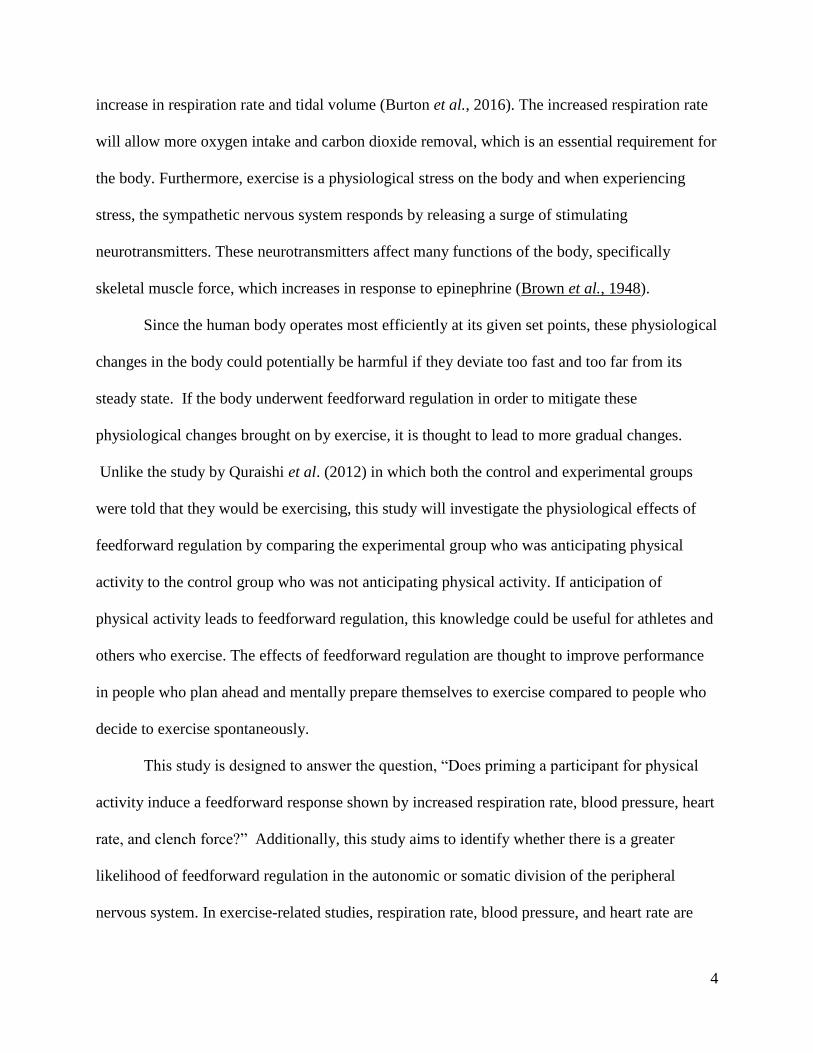
increase in respiration rate and tidal volume (Burton et al., 2016). The increased respiration rate
will allow more oxygen intake and carbon dioxide removal, which is an essential requirement for
the body. Furthermore, exercise is a physiological stress on the body and when experiencing
stress, the sympathetic nervous system responds by releasing a surge of stimulating
neurotransmitters. These neurotransmitters affect many functions of the body, specifically
skeletal muscle force, which increases in response to epinephrine (Brown et al., 1948).
Since the human body operates most efficiently at its given set points, these physiological
changes in the body could potentially be harmful if they deviate too fast and too far from its
steady state. If the body underwent feedforward regulation in order to mitigate these
physiological changes brought on by exercise, it is thought to lead to more gradual changes.
Unlike the study by Quraishi et al. (2012) in which both the control and experimental groups
were told that they would be exercising, this study will investigate the physiological effects of
feedforward regulation by comparing the experimental group who was anticipating physical
activity to the control group who was not anticipating physical activity. If anticipation of
physical activity leads to feedforward regulation, this knowledge could be useful for athletes and
others who exercise. The effects of feedforward regulation are thought to improve performance
in people who plan ahead and mentally prepare themselves to exercise compared to people who
decide to exercise spontaneously.
This study is designed to answer the question, “Does priming a participant for physical
activity induce a feedforward response shown by increased respiration rate, blood pressure, heart
rate, and clench force?” Additionally, this study aims to identify whether there is a greater
likelihood of feedforward regulation in the autonomic or somatic division of the peripheral
nervous system. In exercise-related studies, respiration rate, blood pressure, and heart rate are
5
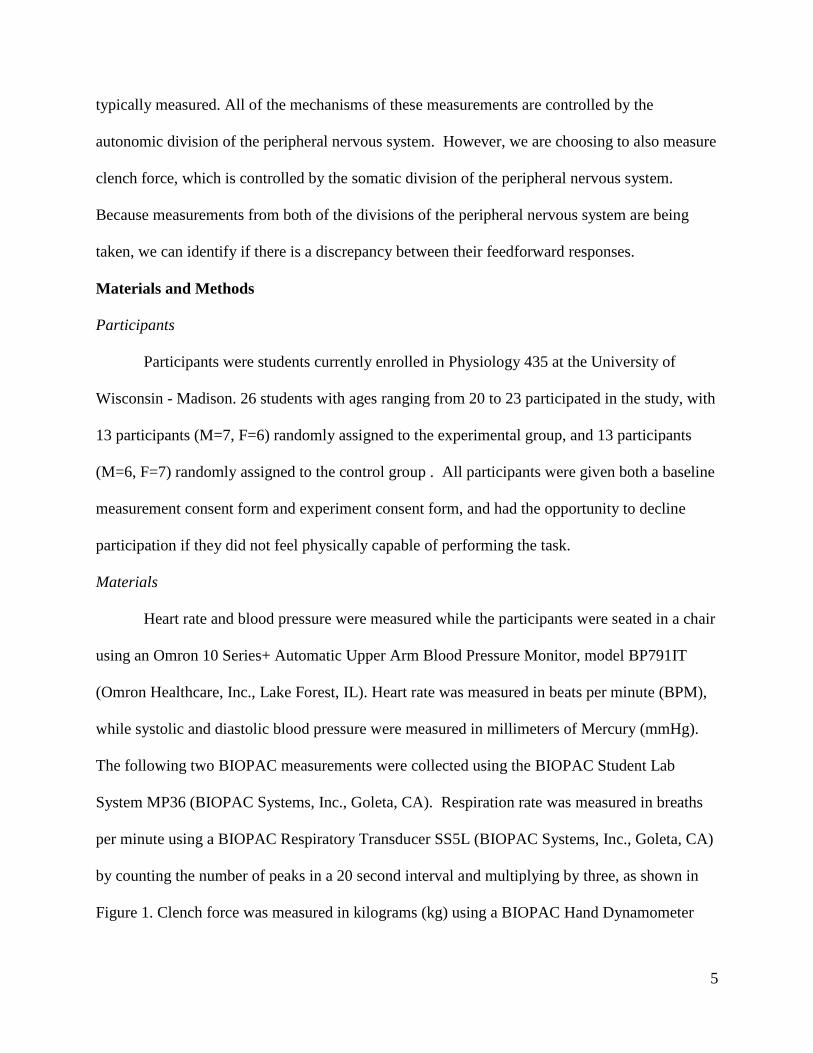
typically measured. All of the mechanisms of these measurements are controlled by the
autonomic division of the peripheral nervous system. However, we are choosing to also measure
clench force, which is controlled by the somatic division of the peripheral nervous system.
Because measurements from both of the divisions of the peripheral nervous system are being
taken, we can identify if there is a discrepancy between their feedforward responses.
Materials and Methods
Participants
Participants were students currently enrolled in Physiology 435 at the University of
Wisconsin - Madison. 26 students with ages ranging from 20 to 23 participated in the study, with
13 participants (M=7, F=6) randomly assigned to the experimental group, and 13 participants
(M=6, F=7) randomly assigned to the control group . All participants were given both a baseline
measurement consent form and experiment consent form, and had the opportunity to decline
participation if they did not feel physically capable of performing the task.
Materials
Heart rate and blood pressure were measured while the participants were seated in a chair
using an Omron 10 Series+ Automatic Upper Arm Blood Pressure Monitor, model BP791IT
(Omron Healthcare, Inc., Lake Forest, IL). Heart rate was measured in beats per minute (BPM),
while systolic and diastolic blood pressure were measured in millimeters of Mercury (mmHg).
The following two BIOPAC measurements were collected using the BIOPAC Student Lab
System MP36 (BIOPAC Systems, Inc., Goleta, CA). Respiration rate was measured in breaths
per minute using a BIOPAC Respiratory Transducer SS5L (BIOPAC Systems, Inc., Goleta, CA)
by counting the number of peaks in a 20 second interval and multiplying by three, as shown in
Figure 1. Clench force was measured in kilograms (kg) using a BIOPAC Hand Dynamometer
6
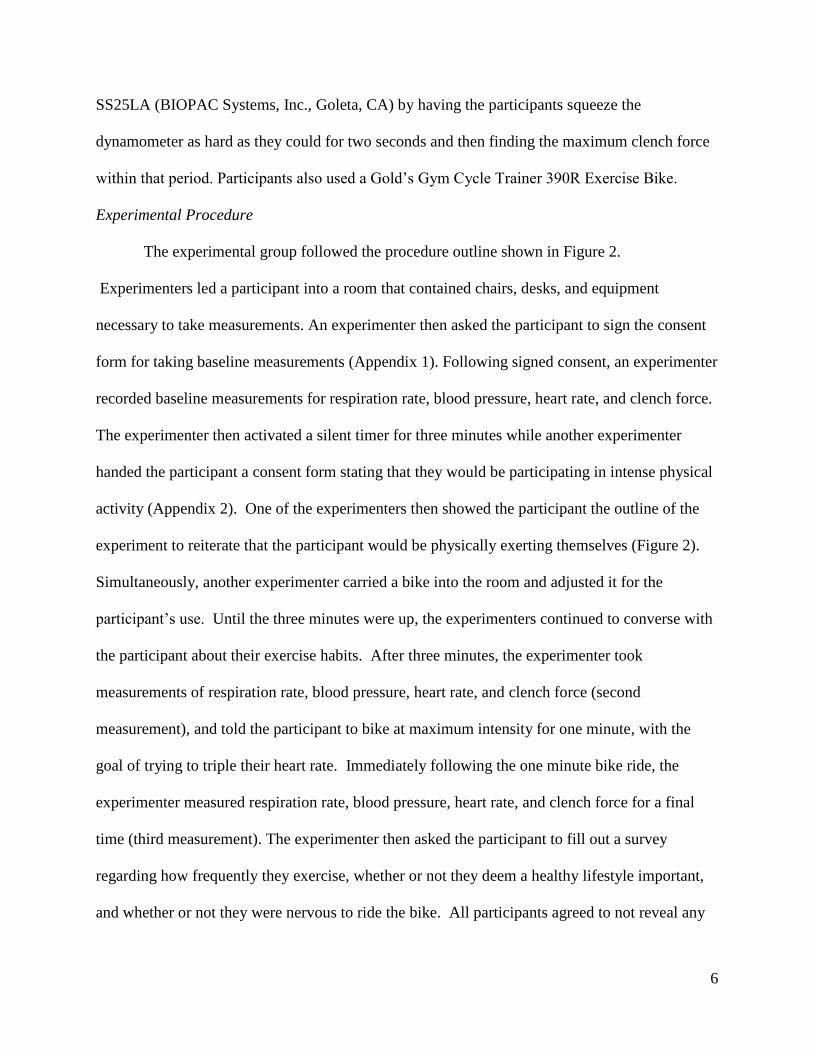
SS25LA (BIOPAC Systems, Inc., Goleta, CA) by having the participants squeeze the
dynamometer as hard as they could for two seconds and then finding the maximum clench force
within that period. Participants also used a Gold’s Gym Cycle Trainer 390R Exercise Bike.
Experimental Procedure
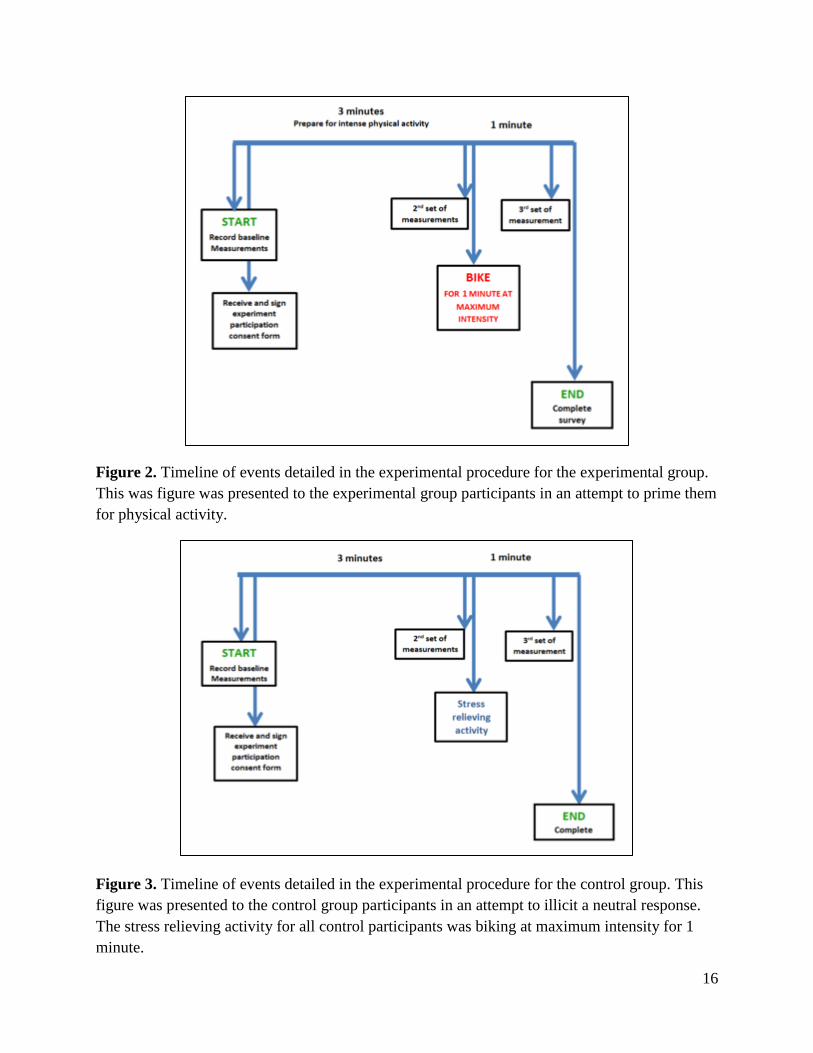
The experimental group followed the procedure outline shown in Figure 2.
Experimenters led a participant into a room that contained chairs, desks, and equipment
necessary to take measurements. An experimenter then asked the participant to sign the consent
form for taking baseline measurements (Appendix 1). Following signed consent, an experimenter
recorded baseline measurements for respiration rate, blood pressure, heart rate, and clench force.
The experimenter then activated a silent timer for three minutes while another experimenter
handed the participant a consent form stating that they would be participating in intense physical
activity (Appendix 2). One of the experimenters then showed the participant the outline of the
experiment to reiterate that the participant would be physically exerting themselves (Figure 2).
Simultaneously, another experimenter carried a bike into the room and adjusted it for the
participant’s use. Until the three minutes were up, the experimenters continued to converse with
the participant about their exercise habits. After three minutes, the experimenter took
measurements of respiration rate, blood pressure, heart rate, and clench force (second
measurement), and told the participant to bike at maximum intensity for one minute, with the
goal of trying to triple their heart rate. Immediately following the one minute bike ride, the
experimenter measured respiration rate, blood pressure, heart rate, and clench force for a final
time (third measurement). The experimenter then asked the participant to fill out a survey
regarding how frequently they exercise, whether or not they deem a healthy lifestyle important,
and whether or not they were nervous to ride the bike. All participants agreed to not reveal any
7
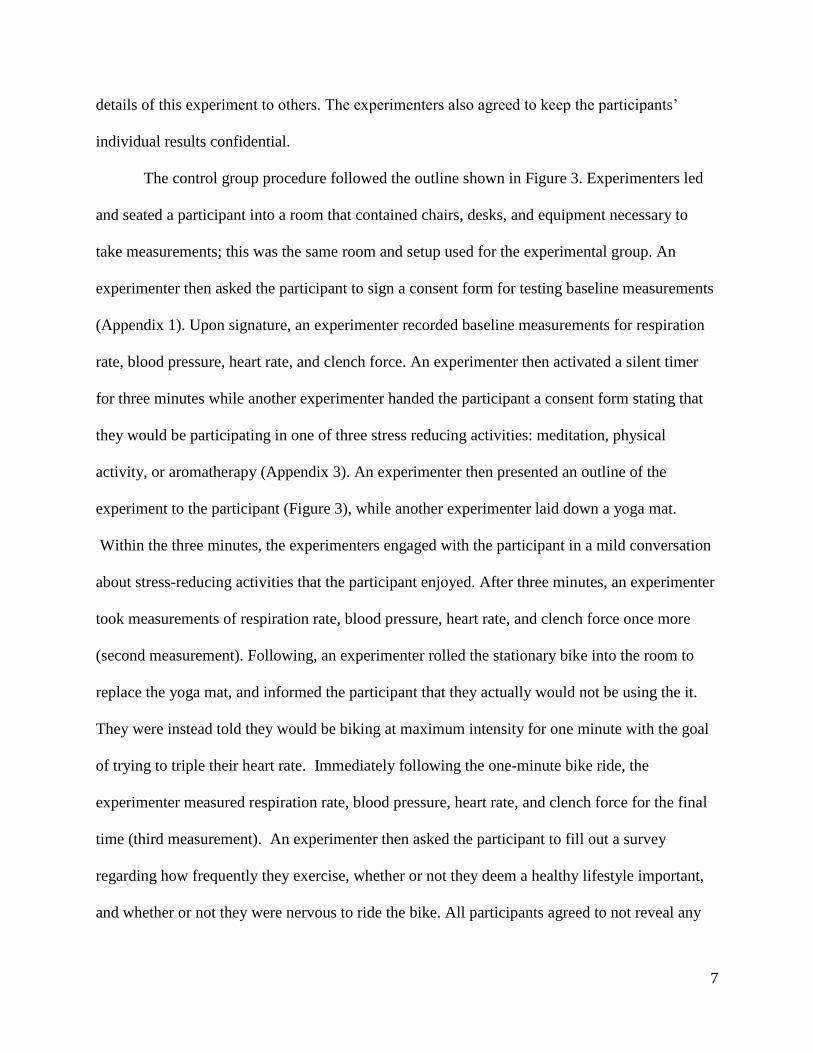
details of this experiment to others. The experimenters also agreed to keep the participants’
individual results confidential.
The control group procedure followed the outline shown in Figure 3. Experimenters led
and seated a participant into a room that contained chairs, desks, and equipment necessary to
take measurements; this was the same room and setup used for the experimental group. An
experimenter then asked the participant to sign a consent form for testing baseline measurements
(Appendix 1). Upon signature, an experimenter recorded baseline measurements for respiration
rate, blood pressure, heart rate, and clench force. An experimenter then activated a silent timer
for three minutes while another experimenter handed the participant a consent form stating that
they would be participating in one of three stress reducing activities: meditation, physical
activity, or aromatherapy (Appendix 3). An experimenter then presented an outline of the
experiment to the participant (Figure 3), while another experimenter laid down a yoga mat.
Within the three minutes, the experimenters engaged with the participant in a mild conversation
about stress-reducing activities that the participant enjoyed. After three minutes, an experimenter
took measurements of respiration rate, blood pressure, heart rate, and clench force once more
(second measurement). Following, an experimenter rolled the stationary bike into the room to
replace the yoga mat, and informed the participant that they actually would not be using the it.
They were instead told they would be biking at maximum intensity for one minute with the goal
of trying to triple their heart rate. Immediately following the one-minute bike ride, the
experimenter measured respiration rate, blood pressure, heart rate, and clench force for the final
time (third measurement). An experimenter then asked the participant to fill out a survey
regarding how frequently they exercise, whether or not they deem a healthy lifestyle important,
and whether or not they were nervous to ride the bike. All participants agreed to not reveal any
8
details about the experiment to others, and the experimenters also agreed to keep the
participants’ individual results confidential.
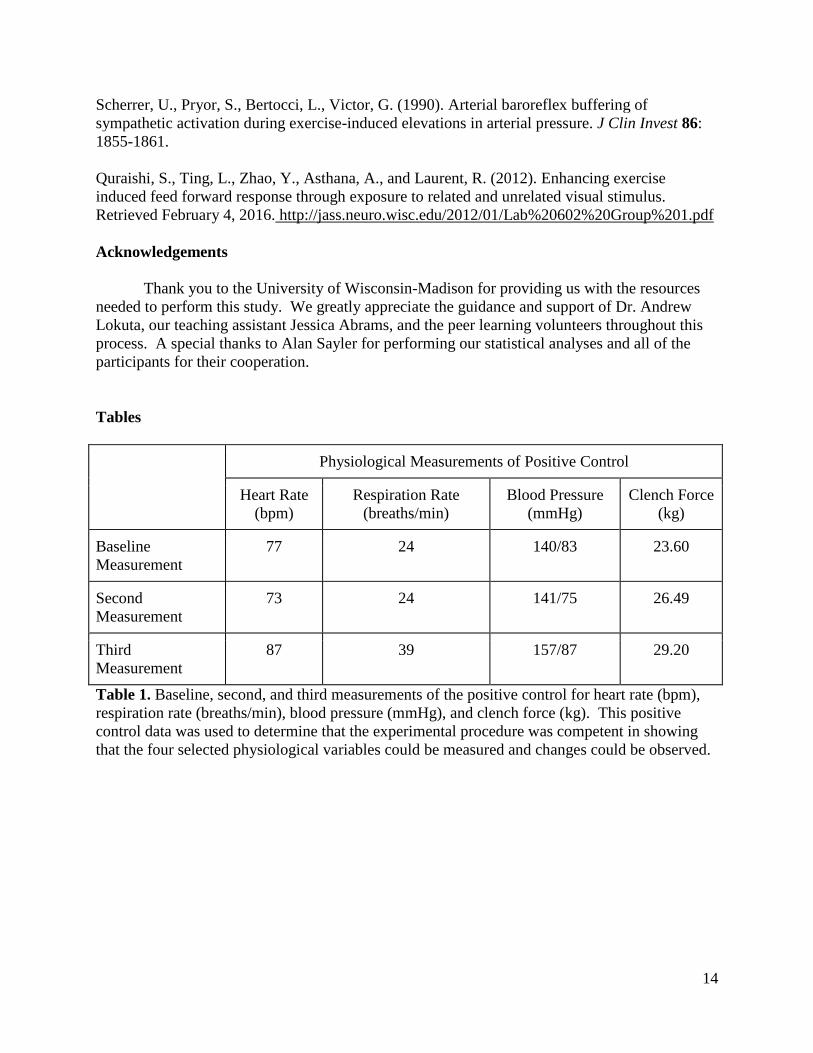
A positive control test validated that the experimental procedure was competent to show
that the four selected physiological variables could be measured and changes could be observed.
The outcome of the positive control run is shown in Table 1.
Data and Statistical Analysis
Statistical changes in respiration rate, blood pressure, heart rate and clench force between
the baseline measurement and the second measurement were compared between participants of
the experimental group and the control group to determine if there was a feedforward response
present in the experimental group by using a two factor t-test and ANOVA test. The change for
each physiological measurement was calculated by subtracting the baseline measurement value
from the second measurement value for each participant. The calculated changes for each
participant were then averaged with the other participants’ changes in each group to find the
overall average changes in respiration rate, blood pressure, heart rate, and clench force. In
addition, changes between the baseline measurements and second measurements of respiration
rate, blood pressure, and heart rate were compared to changes in clench force to determine if
feedforward regulation was more prominent in the autonomic or somatic division of the
peripheral nervous system. The third set of measurements that were recorded after biking, while
not relevant to the results of the study, was used to incentivize participants to give maximum
effort in case participants disclosed details of the experiment to others.
Results
All data collected from baseline and second measurements were analyzed using a two-
factor ANOVA test for each physiological measurement. Increases in physiological
9
measurements from the baseline to the second measurements were indicated by (+) signs and
decreases in physiological measurements from the baseline to the second measurements were
indicated by (-) signs. No trials were discarded from the results. We measured these vital signs
in attempt to detect feedforward responses in anticipation of exercise. Comparing those
measurements before and after the idea of physical activity was introduced showed no significant
differences, as observed by p-values greater than 0.05, between a group of students told they
would be doing intense activity and a group of students which was prepared for a relaxation
activity.
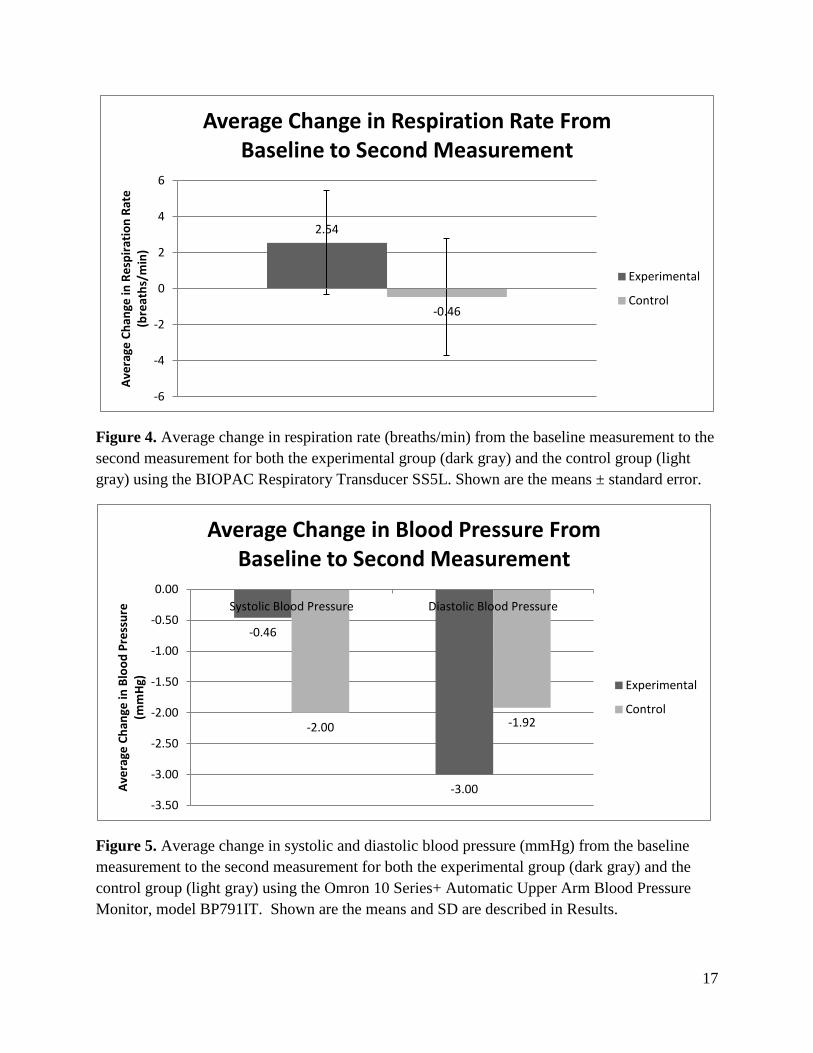
Respiration Rate
The average change in respiration rate measured +2.53 breaths/min (SD 5.32) for the
experimental group and -0.46 breaths/min (SD 5.98) for the control group, as shown in Figure 4.
The results for respiration were deemed statistically insignificant (F=1.734, P=0.189).
Blood Pressure
The average change in systolic blood pressure in the experimental group was -0.46
mmHg (SD 13.04). The average change in systolic blood pressure in the control group was -2.00
mmHg (SD 6.14). For diastolic blood pressure, the average change in the experimental group
was -3.00 mmHg (SD 13.75) and in control group was -1.92 mmHg (SD 11.2), as shown in
Figure 5. The results were deemed statistically insignificant for both systolic blood pressure
(F=0.8582, P=0.4767) and for diastolic blood pressure (F= 1.087, P=0.3742).
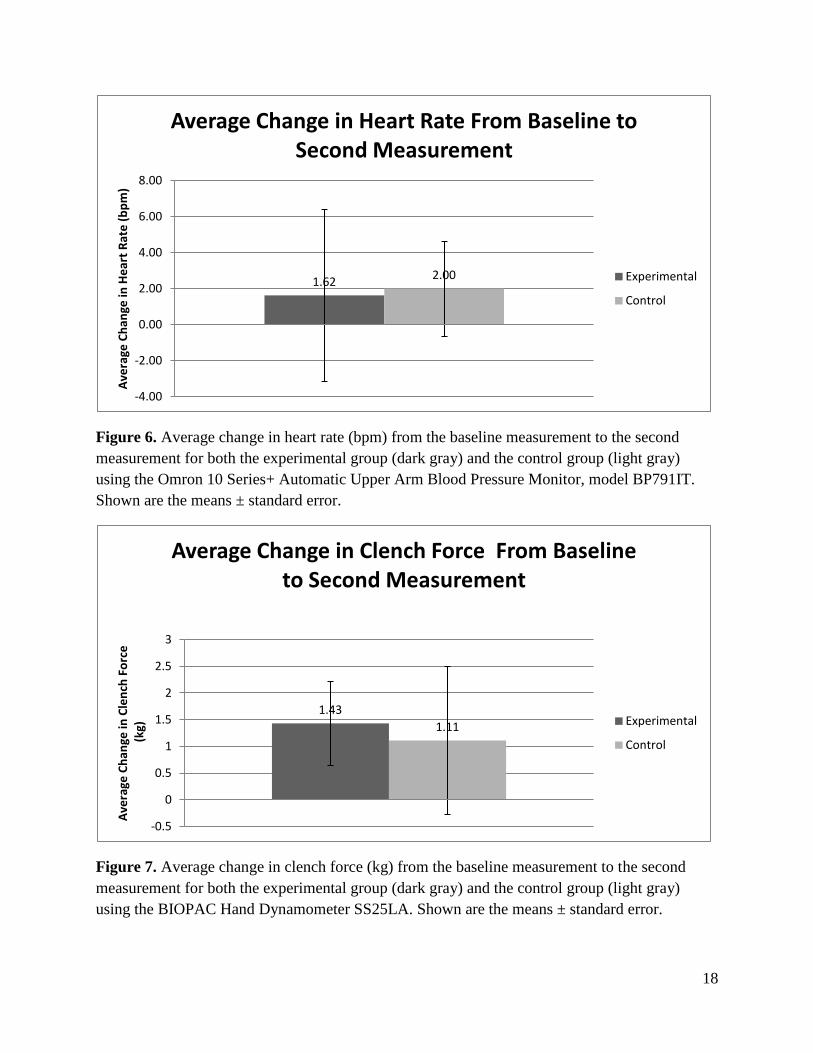
Heart Rate
The average change in heart rate for the experimental group was +1.62 bpm (SD 8.67)
and the average change in the control group was +2.00 bpm (SD 4.68), as shown in Figure 6. The
results for change in heart rate were statistically insignificant (F= 0.2898, P=0.8323).
10
Clench Force
The average change in clench force was +1.43Kg (SD 1.44) in the experimental group
and +1.11Kg (SD 2.55) in the control group, as shown in Figure 7. The results for change in
clench force were statistically insignificant (F=0.1344, P=0.9385).
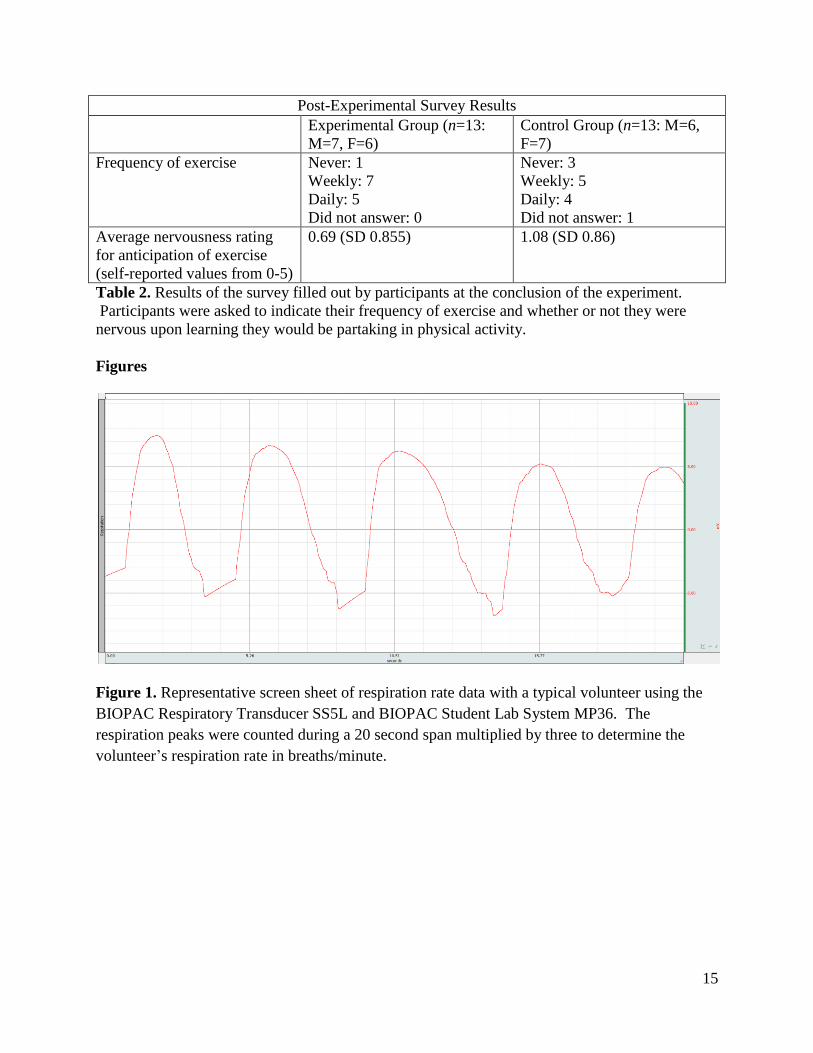
Post-Experimental Survey
Neither group showed high levels of nervousness when presented with anticipation of
exercise. Both groups also reported similar levels of physical activity, as indicated in Table 2.
Discussion
While the trends observed with respiration rate and heart rate suggest the study’s
hypothesis of induced feedforward response to physical activity, they failed to yield statistically
significant results. Therefore, we cannot attribute the cause of these trends to feedforward
regulation. Perhaps participants had developed high respiration rates prior to recording baseline
measurements, due to increased oxygen from walking to the experimental room. Because their
respiration rates were already increased, it is possible the feedforward response of the
experimental group was mitigated by oxygen levels being close to the level needed for the
anticipated physical activity. Perhaps the participants’ heart rates were also increased before
recording the baseline measurements because their bodies needed increased blood circulation for
walking and standing prior to entering the room. This could have had a similar effect as seen
with the high respiration rates, causing a decreased difference in change between baseline and
second measurements, leading to insignificant results.
Our results for blood pressure showed different trends when compared to the other two
autonomic physiological measurements. In both the experimental and control groups, there were
decreases in both systolic and diastolic blood pressure. This result did not follow our
11
hypothesized trend, which was deduced from previous studies (Quraishi et al., 2012). We
expected that the blood pressure would show a trend similar to the increases observed in
respiration and heart rate because an increased heart rate would increase cardiac output. We
hypothesized that this cardiac output would lead to increased blood flow in the systemic
circulation, which would lead to increased blood pressure in the periphery. We did not account
for compensation caused by vasodilation in response to increased blood pressure. Arterial
baroreceptors buffer sympathetic effects by signaling to decrease inhibition on the vasomotor
center in the medulla which results in vasodilation (Scherrer et al., 1990). It is possible that the
feedforward response acts to dilate blood vessels to increase flow to skeletal muscle. If so, this
may explain our observed trends in decreased blood pressure. Future studies must be conducted
to determine how blood pressure might be impacted by a feedforward response in anticipation to
physical activity.
The change in clench force of both the experimental and control groups was positive;
however the comparative change between the two groups was insignificant. It could be
hypothesized that the participants had a slightly increased clench force for the second
measurement due to the unfamiliarity of the dynamometer resulting in a low scoring baseline
measurement. Future studies should account for this confounder by running a preliminary
practice trial with the dynamometer before taking recorded measurements. Significant results in
change of clench force would have provided information relevant to the differences between the
autonomic and somatic peripheral nervous systems, and whether the feedforward regulation
mechanism is controlled differently by each division. However, due to insignificant results, we
forfeit the ability to measure and attribute these changes to feedforward regulation.
12
Limited space may have also posed confounding effects on the experiment. A small room
with four experimenters may have caused participants to feel anxious, increasing their
sympathetic responses. To amend this, future experiments should be conducted in a larger space
to create a stress-free environment. Due to this small room, the logistics for concealing the
exercise bike were limited. Participants were unintentionally exposed to the bike while walking
to the experimental room. This visual cue may have induced a premature feedforward response
measured by the baseline measurement. If this was the case, the change between the baseline and
second measurements of the experimental group would have been weaker. In future studies, the
exercise bike should be completely hidden until after the second set of measurements are taken.
In our study, participants waited three minutes in between baseline and second
measurements. This may have been too long of a waiting period causing experimenters to miss
the window in which the feedforward response was taking place. In a previous study that utilized
the feedforward response of increased heart rate, only one minute was allowed for the response
to occur (Burbridge et al., 2005). Future studies could investigate if there is an optimal time to
measure and observe a feedforward response. Furthermore, since all of the study participants
learned about the concept of feedforward regulation in lecture, they may have been more
inclined to suspect that it was being tested. In future studies, it would be preferable if the
participants were not aware of the concept of feedforward regulation.
A small sample size (n=26) allowed for the possibility of random error in measurement
values, which could have contributed to the statistically insignificant results. It is recommended
that the sample size be increased in future studies. Also, the conversations during the three
minute time period may have altered the participants’ physiological responses. More research
13
should be done in order to determine what conversations are likely to elicit neutral physiological
responses.
Overall our results were inconclusive, meaning that a spike in physiological
measurements cannot be attributed to a feedforward response. If further studies fail to prove this
feedforward response, then perhaps these results could suggest that a “pump-up” routine prior to
exercise or athletic competitions is not as necessary as previously thought to increase
performance. While this could be a potential take-away from this study, our trends in data
suggest that with a more structured procedure to reduce error, along with a larger sample size,
there is potential for results that support priming the body prior to exercise could have
physiological benefits. Although the results of our study alone cannot prove the existence of
feedforward regulation in anticipation of exercise, further investigation may lead to conclusive
results.
References
Brown, G. L., Bülbring, E., Burns,B. D. (1948). The action of adrenaline on mammalian skeletal
muscle. J Physiol 107:115–128.
Burbridge, J. A., Larsen, R. J. & Barch, D. M. (2005). Affective Reactivity in Language: The
Role of Psychophysiological Arousal. Emotion. 5: 145-153.
Burton, D.A., Hall, G. & Stokes, K. (2004). Physiological Effects of Exercise. Contin Educ
Anaesth Crit Care Pain. 4: 185-188.
Dennee, A., Gunderson, D., Le Gros, G., Sarazen, M., and Stieve, B. (2015). Feed-forward
mitigation of physiological fear response to a visual and auditory startle stimulus. Retrieved
February 4, 2016. http://jass.neuro.wisc.edu/2015/01/Lab%20601%20Group%2010.pdf
Romanovsky, Andrej A. (2014). Skin Temperature: Its Role in Thermoregulation. Acta physiol
(Ox) 210: 498–507.
Stewart, K., Sung, J., Silber, A., Fleg, J., Kelemen, M., Turner, K., Bacher, K., Dobrosielski, D.,
DeRegis, K., Shapiro, E., and Ouyang, P. (2004). Exaggerated Exercise Blood Pressure is
Related to Impaired Endothelial Vasodilator Function. Am J of Hypertens 17: 314-320.
14
Scherrer, U., Pryor, S., Bertocci, L., Victor, G. (1990). Arterial baroreflex buffering of
sympathetic activation during exercise-induced elevations in arterial pressure. J Clin Invest 86:
1855-1861.
Quraishi, S., Ting, L., Zhao, Y., Asthana, A., and Laurent, R. (2012). Enhancing exercise
induced feed forward response through exposure to related and unrelated visual stimulus.
Retrieved February 4, 2016. http://jass.neuro.wisc.edu/2012/01/Lab%20602%20Group%201.pdf
Acknowledgements
Thank you to the University of Wisconsin-Madison for providing us with the resources
needed to perform this study. We greatly appreciate the guidance and support of Dr. Andrew
Lokuta, our teaching assistant Jessica Abrams, and the peer learning volunteers throughout this
process. A special thanks to Alan Sayler for performing our statistical analyses and all of the
participants for their cooperation.
Tables
Physiological Measurements of Positive Control
Heart Rate
(bpm)
Respiration Rate
(breaths/min)
Blood Pressure
(mmHg)
Clench Force
(kg)
Baseline
Measurement
77 24 140/83 23.60
Second
Measurement
73 24 141/75 26.49
Third
Measurement
87 39 157/87 29.20
Table 1. Baseline, second, and third measurements of the positive control for heart rate (bpm),
respiration rate (breaths/min), blood pressure (mmHg), and clench force (kg). This positive
control data was used to determine that the experimental procedure was competent in showing
that the four selected physiological variables could be measured and changes could be observed.
15
Post-Experimental Survey Results
Experimental Group (n=13:
M=7, F=6)
Control Group (n=13: M=6,
F=7)
Frequency of exercise Never: 1
Weekly: 7
Daily: 5
Did not answer: 0
Never: 3
Weekly: 5
Daily: 4
Did not answer: 1
Average nervousness rating
for anticipation of exercise
(self-reported values from 0-5)
0.69 (SD 0.855) 1.08 (SD 0.86)
Table 2. Results of the survey filled out by participants at the conclusion of the experiment.
Participants were asked to indicate their frequency of exercise and whether or not they were
nervous upon learning they would be partaking in physical activity.
Figures
Figure 1. Representative screen sheet of respiration rate data with a typical volunteer using the
BIOPAC Respiratory Transducer SS5L and BIOPAC Student Lab System MP36. The
respiration peaks were counted during a 20 second span multiplied by three to determine the
volunteer’s respiration rate in breaths/minute.
16
Figure 2. Timeline of events detailed in the experimental procedure for the experimental group.
This was figure was presented to the experimental group participants in an attempt to prime them
for physical activity.
Figure 3. Timeline of events detailed in the experimental procedure for the control group. This
figure was presented to the control group participants in an attempt to illicit a neutral response.
The stress relieving activity for all control participants was biking at maximum intensity for 1
minute.
17
Figure 4. Average change in respiration rate (breaths/min) from the baseline measurement to the
second measurement for both the experimental group (dark gray) and the control group (light
gray) using the BIOPAC Respiratory Transducer SS5L. Shown are the means ± standard error.
Figure 5. Average change in systolic and diastolic blood pressure (mmHg) from the baseline
measurement to the second measurement for both the experimental group (dark gray) and the
control group (light gray) using the Omron 10 Series+ Automatic Upper Arm Blood Pressure
Monitor, model BP791IT. Shown are the means and SD are described in Results.
2.54
-0.46
-6
-4
-2
0
2
4
6
Ave
rage
Ch
ange
in R
esp
irat
ion
Rat
e
(bre
ath
s/m
in)
Average Change in Respiration Rate From Baseline to Second Measurement
Experimental
Control
-0.46
-3.00
-2.00 -1.92
-3.50
-3.00
-2.50
-2.00
-1.50
-1.00
-0.50
0.00
Systolic Blood Pressure Diastolic Blood Pressure
Ave
rage
Ch
ange
in B
loo
d P
ress
ure
(m
mH
g)
Average Change in Blood Pressure From Baseline to Second Measurement
Experimental
Control
18
Figure 6. Average change in heart rate (bpm) from the baseline measurement to the second
measurement for both the experimental group (dark gray) and the control group (light gray)
using the Omron 10 Series+ Automatic Upper Arm Blood Pressure Monitor, model BP791IT.
Shown are the means ± standard error.
Figure 7. Average change in clench force (kg) from the baseline measurement to the second
measurement for both the experimental group (dark gray) and the control group (light gray)
using the BIOPAC Hand Dynamometer SS25LA. Shown are the means ± standard error.
1.62 2.00
-4.00
-2.00
0.00
2.00
4.00
6.00
8.00
Ave
rage
Ch
ange
in H
ear
t R
ate
(b
pm
) Average Change in Heart Rate From Baseline to
Second Measurement
Experimental
Control
1.43
1.11
-0.5
0
0.5
1
1.5
2
2.5
3
Ave
rage
Ch
ange
in C
len
ch F
orc
e
(kg
)
Average Change in Clench Force From Baseline to Second Measurement
Experimental
Control
19
Appendix 1 UNIVERSITY OF WISCONSIN-MADISON
Research Participant Information and Consent Form Title of the Study: (Not yet finalized)
Principal Investigators: Kelly Danek, Kelly Loberger, Sam Miller, Abby Schabel
DESCRIPTION OF THE RESEARCH
You are invited to participate in a research study about human physiology.
You have been asked to participate because you are enrolled in Physiology 435.
This study will invite the participation of all students enrolled in Physiology 435.
This research will take place within Physiology 435 laboratory sections.
WHAT WILL MY PARTICIPATION INVOLVE?
If you decide to participate in this research you will get measurements taken of your heart rate, blood
pressure, respiration rate, and muscle strength.
Your participation will last approximately ten minutes.
After the semester is completed, results of this study will be analyzed and published.
No credit will be assigned for your complete and voluntary participation. If you do not wish to
participate, simply return this blank consent form.
.ARE THERE ANY RISKS TO ME? No overt risks are anticipated, provided that the volunteer is of normal health and adequate physical
status.
ARE THERE ANY BENEFITS TO ME?
None
HOW WILL MY CONFIDENTIALITY BE PROTECTED?
While there may be printed reports as a result of this study, your name will not be used. Only group
characteristics will be reported – that is results with no identifying information about individuals will be
used in any reported or publicly presented work.
WHOM SHOULD I CONTACT IF I HAVE QUESTIONS?
If you are not satisfied with response of research team, have more questions, or want to talk with someone
about your rights as a research participant, you should contact Dr. Andrew Lokuta, 608-263-7488,

20
Your participation is completely voluntary. If you decide not to participate or to withdraw from the study
it will have no effect on your grade in this class.
Your signature indicates that you have read this consent form, had an opportunity to ask any questions
about your participation in this research and voluntarily consent to participate.
Name of Participant (please print):___________________________________________
_________________________________________ __________________ Signature Date

21
Appendix 2 UNIVERSITY OF WISCONSIN-MADISON
Research Participant Information and Consent Form Title of the Study: Feedforward Response in Anticipation of Physical Activity
Principal Investigators: Kelly Danek, Kelly Loberger, Sam Miller, Abby Schabel
DESCRIPTION OF THE RESEARCH
You are invited to participate in a research study about feedforward response as a result of anticipation of
physical activity.
You have been asked to participate because you are enrolled in Physiology 435.
This study will invite the participation of all students enrolled in Physiology 435.
This research will take place within Physiology 435 laboratory sections.
WHAT WILL MY PARTICIPATION INVOLVE?
If you decide to participate in this research you will be asked to ride a bike with maximum intensity and
effort for one minute. You will give your best effort to triple your heart rate during this one minute
period.
Your participation will last approximately ten minutes.
After the semester is completed, results of this study will be analyzed and published.
No credit will be assigned for your complete and voluntary participation. If you do not wish to
participate, simply return this blank consent form.
ARE THERE ANY RISKS TO ME? There are possible risks associated with intense physical activity.
ARE THERE ANY BENEFITS TO ME?
None
HOW WILL MY CONFIDENTIALITY BE PROTECTED?
While there may be printed reports as a result of this study, your name will not be used. Only group
characteristics will be reported – that is results with no identifying information about individuals will be
used in any reported or publicly presented work.
WHOM SHOULD I CONTACT IF I HAVE QUESTIONS?
If you are not satisfied with response of research team, have more questions, or want to talk with someone
about your rights as a research participant, you should contact Dr. Andrew Lokuta, 608-263-7488,

22
Your participation is completely voluntary. If you decide not to participate or to withdraw from the study
it will have no effect on your grade in this class.
Your signature indicates that you have read this consent form, had an opportunity to ask any questions
about your participation in this research and voluntarily consent to participate.
Name of Participant (please print):___________________________________________
_________________________________________ __________________ Signature Date
23
Appendix 3 UNIVERSITY OF WISCONSIN-MADISON
Research Participant Information and Consent Form Title of the Study: (Not yet finalized)
Principal Investigators: Kelly Danek, Kelly Loberger, Sam Miller, Abby Schabel
DESCRIPTION OF THE RESEARCH
You are invited to participate in a research study about human physiology.
You have been asked to participate because you are enrolled in Physiology 435.
This study will invite the participation of all students enrolled in Physiology 435.
This research will take place within Physiology 435 laboratory sections.
WHAT WILL MY PARTICIPATION INVOLVE?
If you decide to participate in this research you will be asked to partake in one of three stress reducing
events: meditation, physical activity, or aroma therapy.
Your participation will last approximately ten minutes.
After the semester is completed, results of this study will be analyzed and published.
No credit will be assigned for your complete and voluntary participation. If you do not wish to
participate, simply return this blank consent form.
.ARE THERE ANY RISKS TO ME? No overt risks are anticipated, provided that the volunteer is of normal health and adequate physical
status.
ARE THERE ANY BENEFITS TO ME?
None
HOW WILL MY CONFIDENTIALITY BE PROTECTED?
While there may be printed reports as a result of this study, your name will not be used. Only group
characteristics will be reported – that is results with no identifying information about individuals will be
used in any reported or publicly presented work.
WHOM SHOULD I CONTACT IF I HAVE QUESTIONS?
Sam Miller, 874-477-0462, [email protected]
If you are not satisfied with response of research team, have more questions, or want to talk with someone
about your rights as a research participant, you should contact Dr. Andrew Lokuta, 608-263-7488,
24
Your participation is completely voluntary. If you decide not to participate or to withdraw from the study
it will have no effect on your grade in this class.
Your signature indicates that you have read this consent form, had an opportunity to ask any questions
about your participation in this research and voluntarily consent to participate.
Name of Participant (please print):___________________________________________
_________________________________________ ___________________ Signature Date