Embed Size (px)
Citation preview
Feedback-induced instability in tapping mode atomic force microscopy: theory and experiment
by O. Payton, A. R. Champneys, M. E. Homer, L. Picco, and M. J. Miles
Proceedings AVolume 467(2130):1801-1822
June 8, 2011
©2011 by The Royal Society
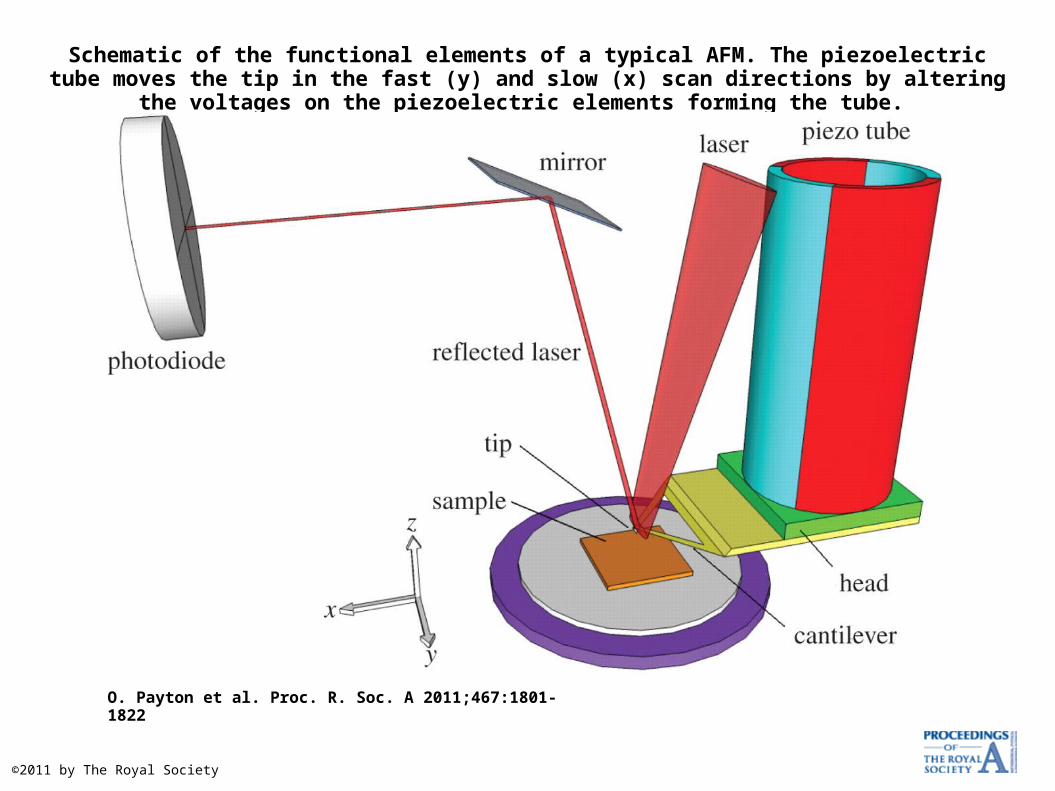
Schematic of the functional elements of a typical AFM. The piezoelectric tube moves the tip in the fast (y) and slow (x) scan directions by altering the voltages on the piezoelectric elements
forming the tube.
O. Payton et al. Proc. R. Soc. A 2011;467:1801-1822
©2011 by The Royal Society
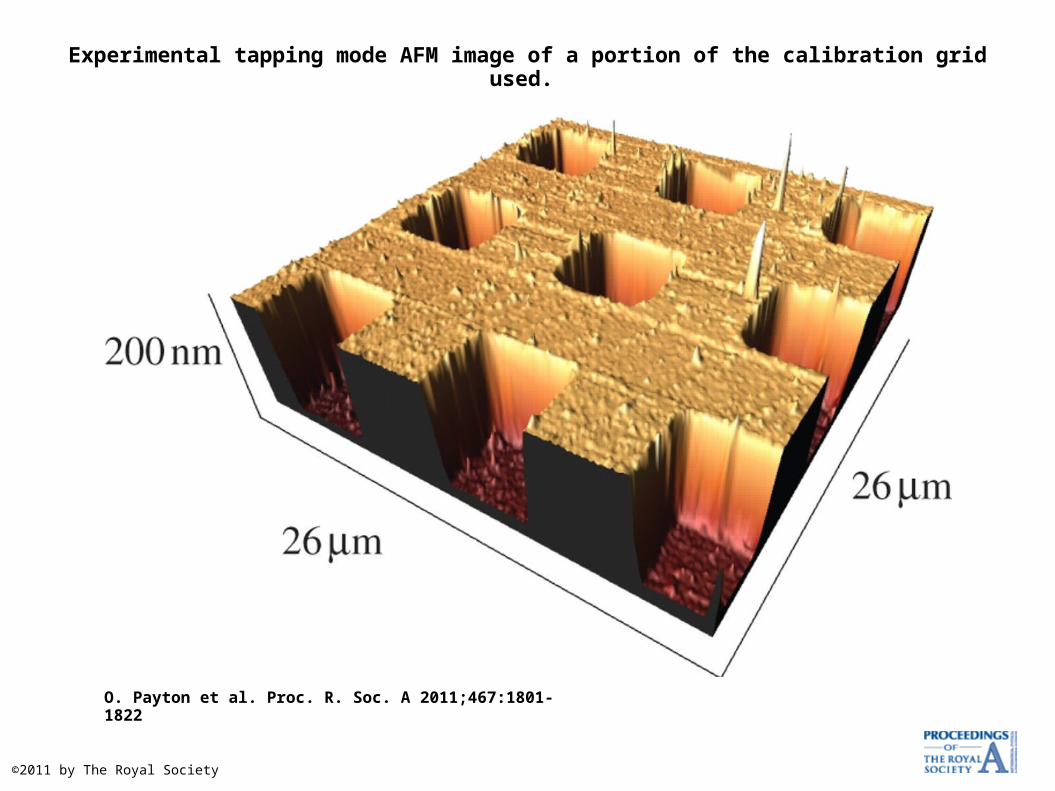
Experimental tapping mode AFM image of a portion of the calibration grid used.
O. Payton et al. Proc. R. Soc. A 2011;467:1801-1822
©2011 by The Royal Society
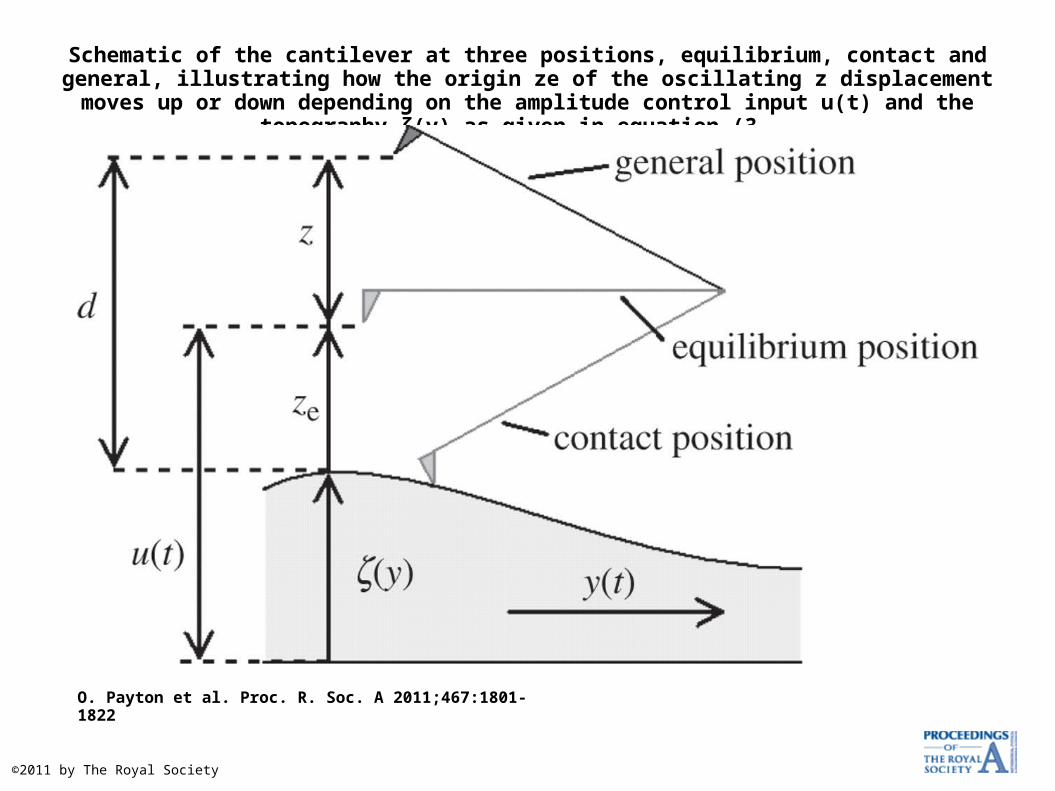
Schematic of the cantilever at three positions, equilibrium, contact and general, illustrating how the origin ze of the oscillating z displacement moves up or down depending on the amplitude
control input u(t) and the topography ζ(y) as given in equation (3...
O. Payton et al. Proc. R. Soc. A 2011;467:1801-1822
©2011 by The Royal Society
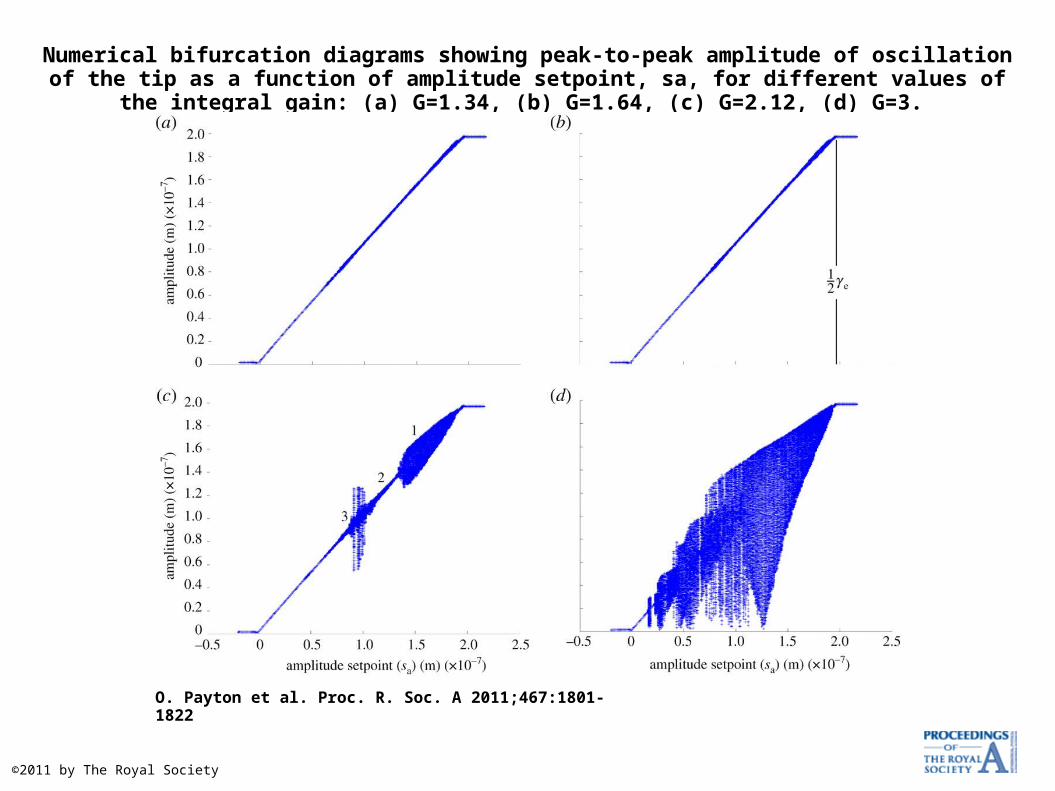
Numerical bifurcation diagrams showing peak-to-peak amplitude of oscillation of the tip as a function of amplitude setpoint, sa, for different values of the integral gain: (a) G=1.34, (b) G=1.64,
(c) G=2.12, (d) G=3.
O. Payton et al. Proc. R. Soc. A 2011;467:1801-1822
©2011 by The Royal Society
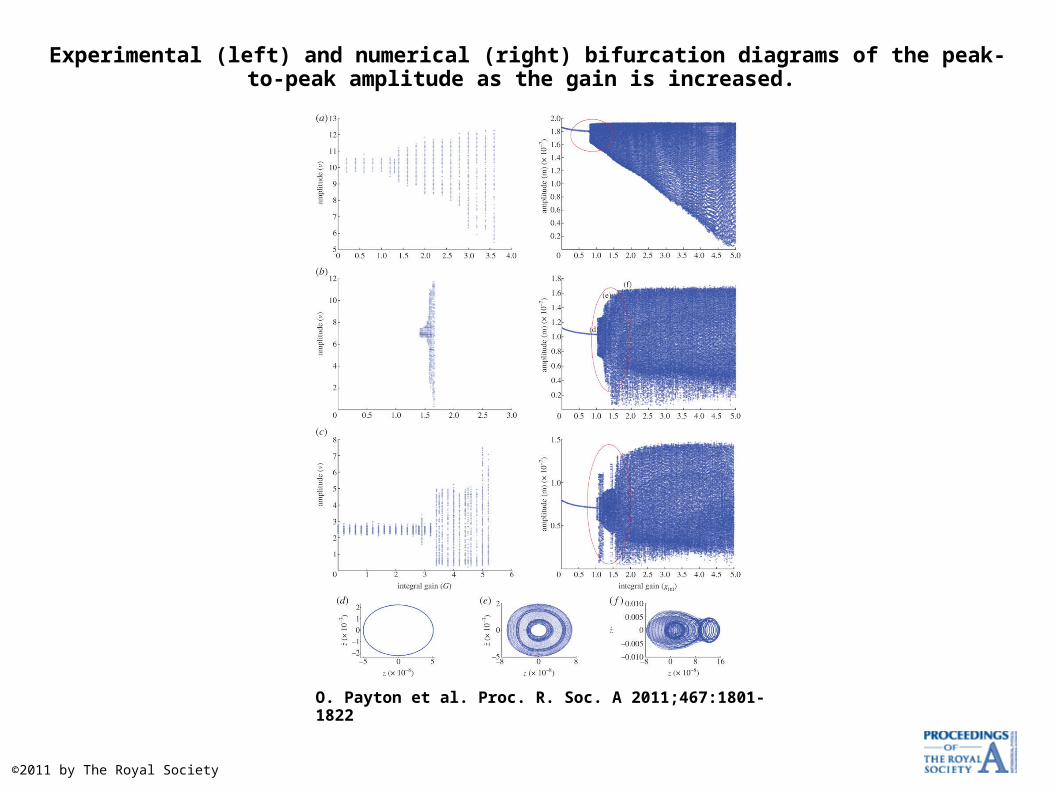
Experimental (left) and numerical (right) bifurcation diagrams of the peak-to-peak amplitude as the gain is increased.
O. Payton et al. Proc. R. Soc. A 2011;467:1801-1822
©2011 by The Royal Society
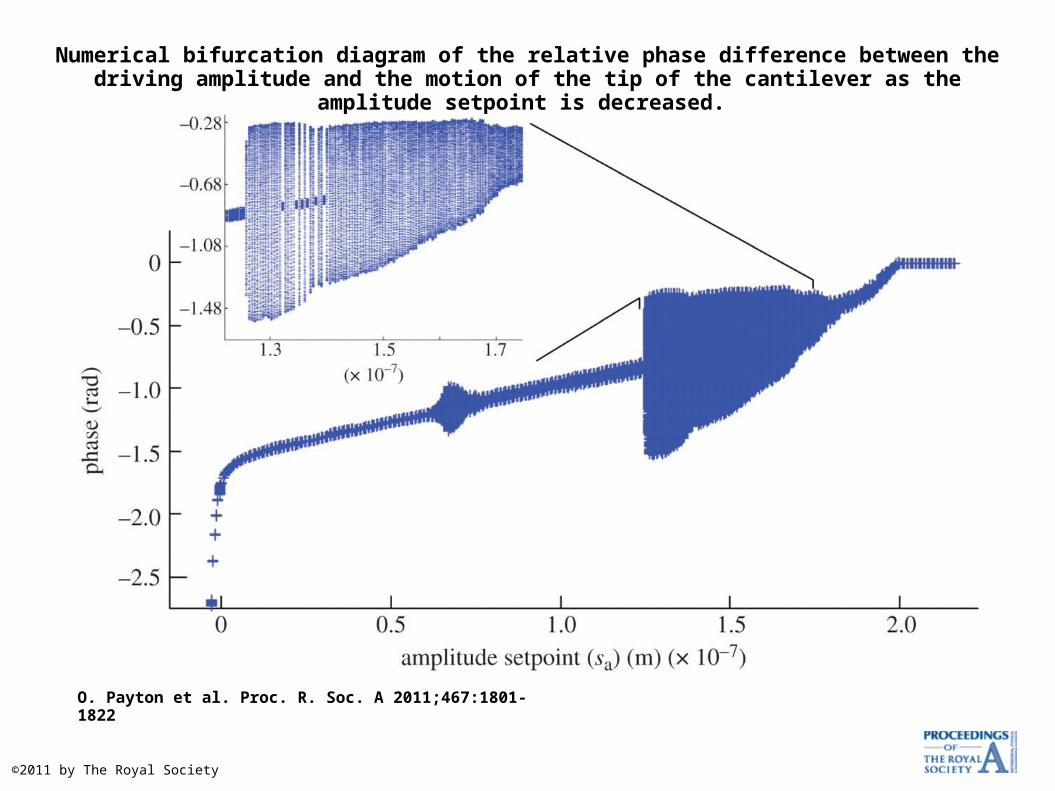
Numerical bifurcation diagram of the relative phase difference between the driving amplitude and the motion of the tip of the cantilever as the amplitude setpoint is decreased.
O. Payton et al. Proc. R. Soc. A 2011;467:1801-1822
©2011 by The Royal Society
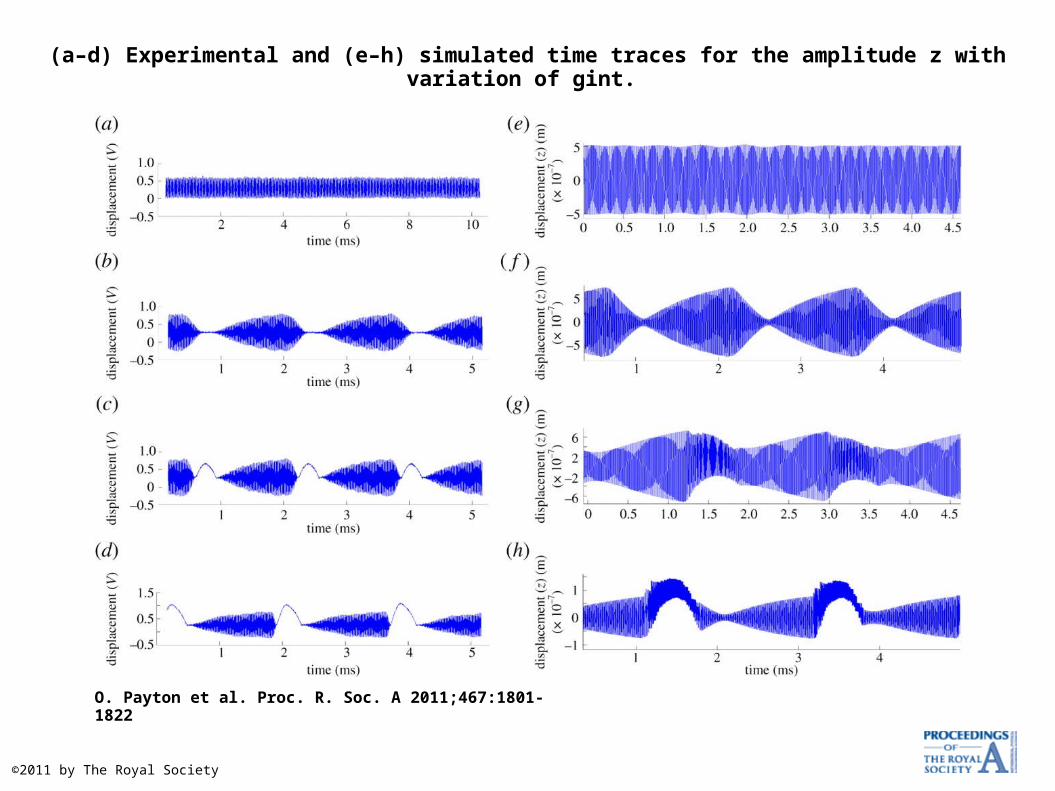
(a–d) Experimental and (e–h) simulated time traces for the amplitude z with variation of gint.
O. Payton et al. Proc. R. Soc. A 2011;467:1801-1822
©2011 by The Royal Society
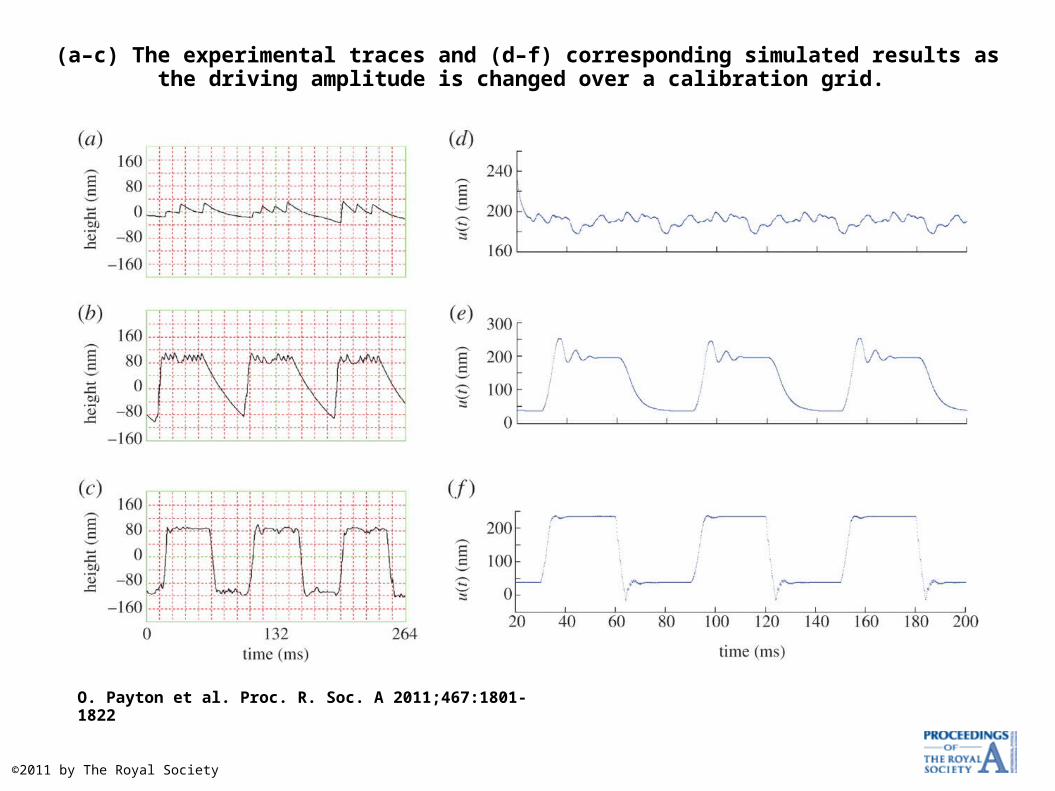
(a–c) The experimental traces and (d–f) corresponding simulated results as the driving amplitude is changed over a calibration grid.
O. Payton et al. Proc. R. Soc. A 2011;467:1801-1822
©2011 by The Royal Society
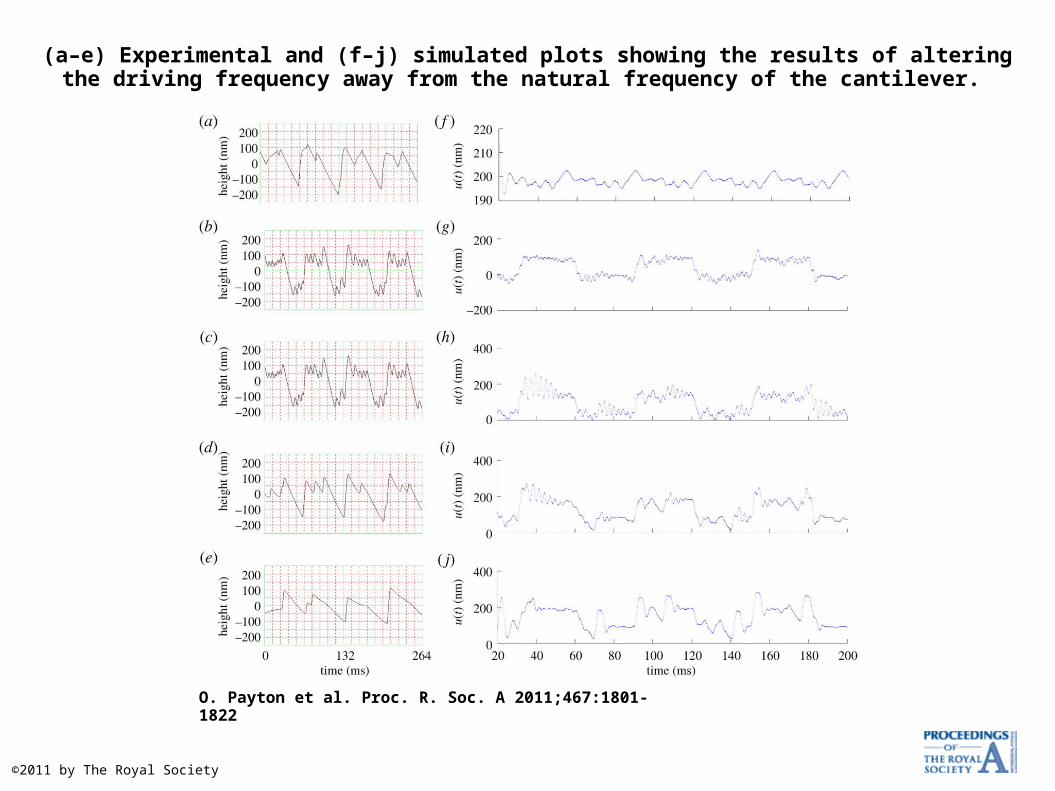
(a–e) Experimental and (f–j) simulated plots showing the results of altering the driving frequency away from the natural frequency of the cantilever.
O. Payton et al. Proc. R. Soc. A 2011;467:1801-1822
©2011 by The Royal Society
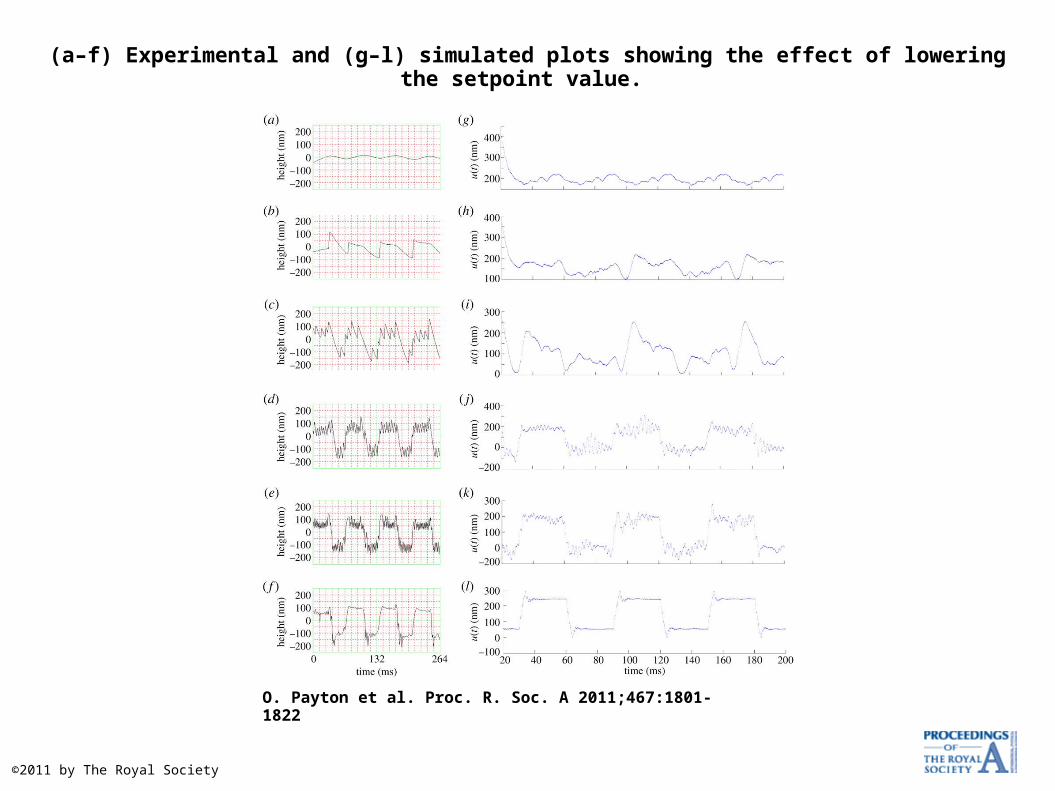
(a–f) Experimental and (g–l) simulated plots showing the effect of lowering the setpoint value.
O. Payton et al. Proc. R. Soc. A 2011;467:1801-1822
©2011 by The Royal Society