Embed Size (px)
Citation preview
NO
RW
EGIA
N U
NIV
ERSITY O
F LIFE SCIEN
CES
DEPA
RTMEN
T OF IN
TERN
ATION
AL ENVIR
ON
MEN
T and DEVELO
PMEN
T STUD
IES (NO
RAG
RIC)
MASTER
THESIS 30 C
RED
ITS 2006
Adoption of Soil Fertility Improvement Techologies AmongSmallholder Farmers in Southern Malawi Linda Lindizgani Robert Chinangwa
The Department of International Environment and Development Studies, Noragric, is the international gateway for the Norwegian University of Life Sciences (UMB), eight departments, associated research institutions and the Norwegian College of Veterinary Medicine in Oslo. Established in 1986, Noragric’s contribution to international development lies in the interface between research, education (Bachelor, Master and PhD programmes) and assignments. The Noragric Master theses are the final theses submitted by students in order to fulfil the requirements under the Noragric Master programme “Management of Natural Resources and Sustainable Agriculture” (MNRSA), “Development Studies” and other Master programmes. The findings in this thesis do not necessarily reflect the views of Noragric. Extracts from this publication may only be reproduced after prior consultation with the author and on condition that the source is indicated. For rights of reproduction or translation contact Noragric. © Linda Lindizgani Robert Chinangwa, May 2006. e-mail: [email protected] Noragric Department of International Environment and Development Studies P.O. Box 5003 N-1432 Ås Norway Tel.: +47 64 96 52 00 Fax: +47 64 96 52 01 Internet: http://www.umb.no/noragric
i
DECLARATION
This thesis has not previously been accepted for any degree and is not being concurrently
submitted in candidature of any other degree. This work is the result of my own investigation.
All other sources of information are acknowledged and a reference list appended.
Linda Lindizgani Robert Chinangwa
Signature…………………………….
Date………………………………......

ii
DEDICATION
To my mother, for giving me the wings to fly; to my father for giving me the
reason to fight. You hold a special place in my heart.
Parents, because of you I can!!
iii
ACKNOWLEDGEMENT I would like to thank Dr Jens Aune, my supervisor for the encouragement, technical assistance,
advice and guidance from the early stages of proposal formulation to write up of the thesis.
I’m grateful to Dr Wilkson Makumba, for his input in the formulation of the questionaire and
his technical assistance during my research in Malawi.
Special thanks go to Noragric staff for your contribution to my studies in one way or the other
and to NORAD-Nowergian Agency for Development for granting me the scholarship to carry
out my Msc studies. I am grateful for the support given to me by my Director, Mr Mlenga and
all the staff of the Department of Land Resources Conservation, Minisrty of Agriculture
Malawi.
To my bothers; Kondani, Tonda, Robert and Walter, my sister Ruth and my nephew
Tikondayani, the times I share with you, I cherish, now and always (Mukanozga kuwako). To
my friends, thank you for the friendship, I am grateful for the times we have come to know
each other and the times we have shared during the course of my study.
To God, I can never thank you enough you for all you have done in my life. Am forever
grateful.
Finally to You, I say thank you for the love, friendship and support. I love you.
iv
ABSTRACT
Land degradation and soil erosion are significant environmental problems affecting
agricultural productivity and livelihood in Malawi. A number of soil fertility improvement
technologies are being promoted by the Ministry of Agriculture and non governmental
organization, in order to improve agricultural productivity and food security. The thesis
examines farmer’s perception of the current level of soil fertility and factors effecting farmers
use of different soil fertility improvement technologies. The study was carried in Machinga
Agriculture Development Division, Machinga and Zomba districts. Household questionnaire,
key informants interview and literature review were used as tools for data collection. A total of
97 households were interviewed. About 73% of farmers perceive that the current level of soil
fertility as low and 62%, perceived that soil fertility will continue to decline. The overall
reason for using different soil fertility improvement technology is to improve crop yield for
household consumption and cash income. Farmers use inorganic and organic fertilizers for
soil fertility improvement. The majority of farmers (83%) prefer to use inorganic fertilizers.
High price was mentioned as the main factor limiting use of inorganic fertilizer. Therefore,
percentage farmer’s use of inorganic fertilizer increased with increase in income level. Labor
demand limits farmer’s use of agroforestry practices. Increase in the number of farmers
inheriting land will reduce the use of agro forestry technologies (p≤ 0.01). Most female headed
families (55%) use compost manure. Use of compost manure decreased with increase in off
farm income (p≤ 0.01). Livestock manure use is affected by livestock holding sizes. Use of
livestock manure increased with increase in livestock holding size (p≤ 0.01). Farmer
participation in farmer groups also increased use of compost and livestock manure, p≤ 0.01
and p≤ 0.05, respectively. About 39% of farmers combine organic and inorganic fertilizer for
soil fertility improvement. Farmer use of different soil fertility improvement technologies is
affected by technology characteristics and different socio- economic factors.
v
LIST OF ACRONYMS AND ABBREVIATIONS ADD Agricultural Development Division
ADMARC Agricultural Development Marketing Cooperation
CTA Technical Centre for Agroforestry and Rural Development
DLRC Department of Land Resources Conservation
DREA Department of Research and Environmental Affairs
EIU Economic Intelligence Unit (USA)
EPA Extension Planning Area
FAO Food Agricultural Organisation
ICRAF International Centre for Agroforestry Research
MADD Machinga Agricultural Development Division
MAFE Malawi Agroforestry Extension
MK Malawi Kwacha
MoFFEA Ministry of Forestry Fisheries and Environmental Affairs
NGO Non Governmental Organisation
SER State of Environmental Report
SFFRF Smallholder Farmer Fertilizer Revolving Fund
SPSS Statistical Package for Social Scientists
US$ United States Dollar
vi
TABLE OF CONTENTS
DECLARATION...................................................................................................................i
DEDICATION................................................................................................................... .. ii
ACKNOWLEDGEMENT…………………………………………………………….….. iii
ABSTRACT ........................................................................................................................ . iv
LIST OF ACRONYMS AND ABBREVIATIONS……………………………………... v
TABLE OF CONTENTS....................................................................................................................... vi
LIST OF TABLES ………………………………………………………………………viii
LIST OF FIGURES………………………………………………………………………..ix
1 INTRODUCTION........................................................................................................ 1
1.1 BACKGROUND ......................................................................................................... 1
1.2 PROBLEM STATEMENT............................................................................................. 2
1.3 RATIONALE OF THE STUDY...................................................................................... 3
1.4 RESEARCH QUESTIONS............................................................................................. 4
2 LITERATURE REVIEW............................................................................................ 5
2.1 SOIL FERTILITY IN MALAWI..................................................................................... 5
2.2 POLICY BACKGROUND ON SOIL FERTILTY IMPROVEMENT INITIATIVES ................... 6
2.3 SOIL FERTILITY IMPROVEMENT METHODS............................................................... 8
2.3.1Inorganic fertilizers .................................................................................... 9
2.3.2Agroforestry practices ................................................................................ 9
2.3.2.1Intercropping of Glicidia sepium and maize ................................. 10
2.3.2.2. Improved fallow .......................................................................... 11
2.3.2.3Annual relay fallow cropping........................................................ 13
2.3.3Livestock manure ..................................................................................... 14
2.3.4Compost manure....................................................................................... 15
2.3.5Early ploughing and crop residue management ....................................... 15
2.4 FARMER TECHNOLOGY ADOPTION ......................................................................... 16
vii
3 METHODOLOGY..................................................................................................... 19
3.1 DESCRIPTION OF STUDY AREA............................................................................... 19
3.1.1Location and demography ........................................................................ 19
3.1.2 Livilihoods in the research area............................................................... 21
3.1.3Soils and climate ...................................................................................... 21
3.1.4Farming practices ..................................................................................... 22
3.2 SURVEY METHODS................................................................................................. 22
3.3 DATA COLLECTION METHODS ............................................................................... 23
3.3.1Household Questionnaire ......................................................................... 23
3.3.2Key Informants interviews ....................................................................... 23
3.4 DATA WEAKNESS.................................................................................................. 24
3.5 METHODS OF ANALYSIS......................................................................................... 24
4 RESULTS AND DISCUSSION................................................................................. 25
4.1 FARMER’S PERCEPTION OF SOIL FERTILITY PROBLEMS .......................................... 25
4.2 ADAPTATION TO DECLINING SOIL FERTILITY ......................................................... 27
4.3 FACTORS INFLUENCING USE OF SOIL FERTILTY IMRPOVEMENT TECHNOLOGY ..... 35
4.3.1Inorganic fertilizer .................................................................................... 36
4.3.2Agroforestry ............................................................................................. 38
4.3.3Compost manure....................................................................................... 41
4.3.4Livestock Manure..................................................................................... 44
4.3.5Integration soil fertility Improvement method ......................................... 46
4.4 ACCESS TO TECHNICAL SUPPORT……………………………...……….48
5 CONCLUSION........................................................................................................... 49
6 REFERENCE ............................................................................................................. 51
7 APPENDIX 1: HOUSEHOLD SURVEY QUESTIONNAIRE.............................. 57
viii
List of Tables
Table 1: Financial Analysis of Gliricidia system in Net benefits ....................................... 11
Table 2: Financial profitability of maize production systems under improved fallow per .....
hectare over a five-year cycle .............................................................................. 13
Table 3: Maize yields at Songani Watershed, Machinga, 1998 ........................................... 14
Table 4: Logistic regression showing factors affecting farmer use of Inorganic fertilizer 36
Table 5: Inorganic fertilizer use by access to credit ............................................................ 37
Table 6: Logistic regression showing factor affecting farmer use of agroforestry technologies
...................................................................................................................................... 38
Table 7: Compost manure use by gender ............................................................................ 42
Table 8: Logistic regression showing factors affecting farmer use of compost manure ..... 42
Table 9: Logistic regression showing factors affecting farmer use of livestock manure..…44 Table 10: Logistic regression showing factors affecting use of integrated methods .......... 46
ix
List of Figures
Figure 1: Inorganic fertilizer prices, Kwacha/ metric ton, in Malawi.................................... 7
Figure 2: Farmers perception of the current soil fertility level ............................................ 26
Figure 3: Farmer’s perceived future changes in soil fertility levels..................................... 26
Figure 4: Percentage of farmers using different of soil fertility improvement technologies 27
Figure 5: Farmers preference of different agroforestry tree species .................................... 30
Figure 6: Percentage of farmers practicing agroforestry technologies according to years of
practice ............................................................................................................ 31
Figure 7: Preference of farmers soil fertility improvement technology use depending on crop
type ................................................................................................................... 33
Figure 8: Preference of farmers soil fertility improvement technology use according to terrain
category ............................................................................................................. 34
Figure 9: Percentage of farmers using inorganic fertilizer at different estimated annual labour
income levels..................................................................................................... 37
Figure 10: Percentage of farmers practicing agroforestry according to levels of education 40
Figure 11: Percentage of farmers practicing agroforestry according to months they experience
food shortage ....................................................................................................................... 41
List of Maps
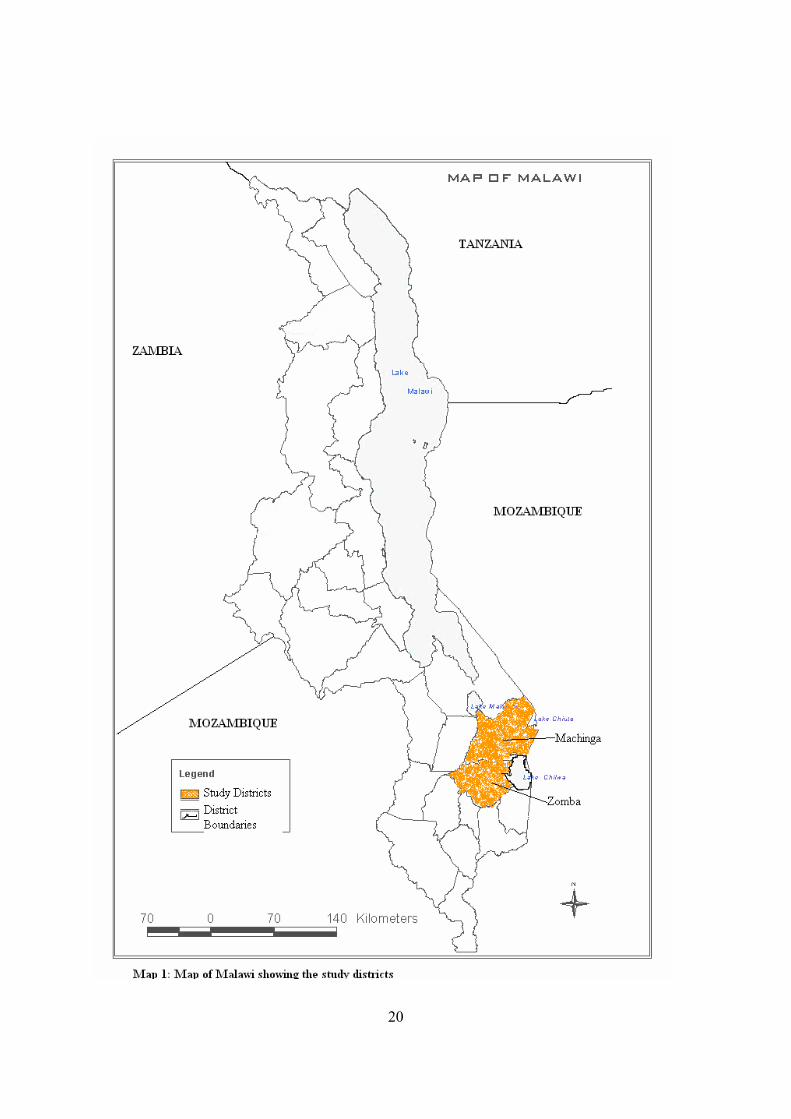
Map 1: Map of Malawi showing the study districts ……………………………………….20
1
1 INTRODUCTION
1.1 Background
Land degradation and soil nutrient depletion have become serious threats to agricultural
productivity in sub- Saharan Africa. Most arable lands have been affected by degradation thereby
reducing agricultural productivity, which in turn results in poor economic growth of countries
(Bekele, 2003).Ultimately this results in abject poverty and high incidences of food insecurity
among the population that depend on agriculture for livelihood. The continued threat to land
resources is exacerbated by the need to reduce poverty and poor farming practices, especially
among smallholder farmers.
The National Environment Action Plan for Malawi isolates soil degradation as the most serious
environmental problem facing modern Malawi (Malawi Government, 1994). Agriculture
dominates the economy, with about 80% of Malawians reliant on subsistence farming as an
income source (Malawi Government, 2002). Therefore, land degradation and soil erosion may be
the most significant environmental issues affecting livelihoods in Malawi, because they
undermine the foundation of the economy.
Malawi’s population is growing at a rate of 2% (EIU, 2004), leading to land shortages and
continuous arable cultivation without fallowing. About 55% of the smallholder farmers have less
than one hectare land to cultivate (Bunderson and Hayes, 1995), which is insufficient to meet the
basic food needs of the family. The result is intense pressure on available land and natural
resources leading to soil erosion and fertility loss. This leads to more insecure households and
stagnating economic growth. The present soil fertility loss will affect not only the yield level
today, but also the yield of succeeding years (Bekele, 2003). Hence, this will affect agricultural
productivity and the economy in the succeeding years. Therefore, ensuring high levels of
agriculture productivity, improved economic status and household food security remains a major
challenge for smallholder farmers in Malawi.
To improve agriculture production, the government of Malawi, has been promoting soil fertility
replenishing technologies through nutrient inputs from organic and inorganic sources. However,
2
the replenishment of soil fertility from inorganic fertilizers is constrained by prohibitive purchase
prices (Phiri et al., 1999). In response to this challenge, the government of Malawi aims at
maintaining soil’s productive capacity, by increasing the area under low cost soil fertility
improvement technologies (Malawi Government, 2002). Research has lead to recommendation of
a range of low external input technologies, of proven effectiveness, for soil fertility improvement
(Whiteside and Carr, 1997) like agroforestry. The adoption of such technologies on the other
hand is depended on the technology requirements and farmers resource endowments.
1.2 Problem statement
One of the biophysical constraints to increasing agriculture productivity is the low fertility of the
soils (Bekunda et al., 1997). Improving soil fertility levels has become an important issue in
development agendas because of its linkage to food insecurity and economic well being of the
population (Ajayi et al., 2003).
The use of inorganic fertilizers is an option for replenishing soil fertility for increased agriculture
production. However, the replenishment of soil fertility with inorganic fertilizers at the
recommended rate and appropriate time is constrained by high price of fertilizer and delivery
delays. Transport and other costs like duties and taxes, double the international price of fertilizer
by the time it reaches Malawi (Donovan, 1996). In order to address the fertilizer price problem
and enhance smallholder agricultural productivity, the government of Malawi used to subsidize
agriculture production inputs. Due to the structural adjustment programs required by the World
Bank and other donors, Malawi removed inorganic fertilizer subsidies (Sahn et al., 1990).
Therefore, inorganic fertilizer option remains unattainable to most of the smallholder farmers.
This has led to a reduction in the use of inorganic fertilizers that were commonly used by farmers
to replenish soil fertility. This is a challenging situation given the increase in population and low
adoption rates of low cost organic fertilizer. Therefore, government policies have a significant
influence in farmer’s decisions regarding soil fertility improvement technologies.
Most farmers in Malawi have options for modifying their farming practices in response to
declining soil fertility. Depending upon site and other local conditions and nature of technology,
3
a given technology maybe profitable and others not. Thus, it is difficult to draw general
conclusion about the overall attractiveness of adopting soil fertility improvement technologies.
The use of inorganic fertilizers as an option for improving soil fertility and productivity, has
immediate results, but is unaffordable for most farmers. In spite of the growing awareness of low
cost soil fertility technologies, the rate of adoption and continued use of the technologies remain
limited. Experiences of agroforestry show that, though there is much interest in agro forestry
among farmers, adoption rates are still low (CTA/MAFE, 2002). The study seeks to understand
factors that influence farmer’s choices of the different soil fertility improvement technologies.
1.3 Rationale of the study Research to date has predominantly focused on the biophysical aspects, with attention given
mainly to yield benefits from researcher-managed plots. Studies have been done on biological
aspects of soil fertility replenishment technologies and number of users of the different
technologies separately in Malawi. However, few studies have been conducted on the socio-
economic aspects of farming households and how they affect household choice of soil fertility
improvement methods. Therefore the purpose of this study will be to add knowledge to the
existing literature on agriculture technology adoption among small scale farmers in Malawi.
Uptake of soil fertility improvement technologies, such as agroforestry technologies by farmers is
usually based on certain social (including acceptance rather than coercion) and economic benefits
in addition to the biophysical aspects of the technologies (Thangata et al., 2001). In order to scale
up the use and promote wider adoption of improved agriculture technologies, it is important to
identify factors that influence technology use and adoption by farm household; what category of
farmers will use a given technology; why other farmers continue to use technologies and others
do not. It is also important to establish the various constraints as regards to the use of a particular
technology. Farmer perception of technology characteristics significantly affects adoption
decisions (Adesina and Baidu-Forson, 1995). Therefore, in order to explain farmer’s adoption of
soil fertility improvement technologies, it is important to understand the constraints of the
technology.
4
Inorganic fertilizers and organic fertilizers are the available options for improving soil fertility for
smallholder farmers in Malawi. In the study, the conditions that make farmers to use a
combination of inorganic fertilizer and organic materials were studied. Further more, farmer’s
perception on use of inorganic and organic fertilizers as whether competitive or complimentary,
was studied.
Adoption of technologies can not take place in a policy vacuum, but needs to be facilitated by
appropriate policy and institutional incentives (Ajayi et al., 2003). Therefore, the study tries to
establish the impact of policy changes on farmer’s use of different soil fertility improvement
technologies and agriculture productivity. Understanding these factors, will provide insights for
designing appropriate strategies, policies and programs that will promote adoption of soil fertility
improvement technologies. The knowledge gained could be used by policy makers, researchers,
extension providers and farmers to enhance relevance of technology use and likelihood of
adoption with regard to farmer’s environment and situations.
1.4 Research questions
In order to achieve the objectives of the research, the following research questions will guide the
research:
1. What is the farmer’s perception of current soil fertility levels?
2. What are the factors that influence smallholder farmer’s use and adoption of the soil
fertility improvement technologies?
3. Is there a complementary or competitive relationship in farmer use of inorganic fertilizers
and organic soil fertility improvement methods?
5
2 LITERATURE REVIEW
2.1 Soil fertility in Malawi
Soil fertility is mainly related to top soil characteristics. Soil fertility largely depends on soil
organic matter content, which besides supplying nutrients, ensures good physical conditions
necessary for water infiltration, supply of soil moisture, aeration and plant root development
(MoFFEA, 1998). Soil erosion and declining soil fertility ranks as serious environmental
problems in Malawi, contributing to low crop yields (DREA, 1994). Although crop yields are not
directly correlated to the amount of organic matter in the soil, the lack of it will cause the
breakdown of soil structure, increased runoff, accelerate erosion and increase soil compaction
that will prevent the development of a healthy root system and cause a reduction in nutrient and
water availability to the plant (FAO, 1999 as in Environmental Affairs Department, 2002).
Therefore, low crop yields are no longer attributed just to lack of rains, but also to declining soil
fertility.
In Malawi, as in most developing countries, harsh climatic conditions, population pressure, land
constraints, and the decline of traditional soil management practices have led to reduced soil
fertility (Gruhn, 2000). Most soils in Malawi are deficient either in nitrogen (N), phosphorous (P)
and sulphur (S) and micro nutrients or a combination of two or more nutrient elements
(Mughogho, 1989 as in Environmental Affairs Department, 2002). However, N is the most
deficient nutrient nearly in all soils in Malawi (Bundersons and Hayes, 1995) and P is the second
limiting nutrient (Makumba, 2003).
The high population growth rate, create an imbalance between population and the natural
resource base, significantly impacting on the overall context of the Malawi economy and the
environment (MoFFEA, 1998). Since land is a constant natural resource, with increased
population in Malawi, land holding sizes are small to meet food requirement. This has led to
opening of new farm lands in marginal areas and continuous cultivation to meet consumption
needs, resulting in loss of regenerative capacity of the soils in essential nutrients and
environmental degradation, which in turn have resulted in declining agriculture production.
The majority of smallholder farmers in Malawi practice unimproved traditional methods of
cultivation, leading to soil exhaustion, and increasing need for inputs. Most farmers apply no or
6
minimum improved inputs, soil and water conservation technologies are not practiced, and
generally, the adoption rate for most land husbandry technologies is low (MoFFEA, 1998). Most
farmers are poor in resources, hence though the use of inorganic fertilizer may be recommended;
most smallholder farmers cannot afford to use inorganic fertilizer. The organic matter from the
crop residues and nutrients that are present in the crop residues can be used to improve the soil
structure and fertility but these are also lost during the burning of the crop residues during land
preparation (Environmental Affairs Department, 2002). Poor policy environment and lack of
capacity by extension service with regard to soil fertility, has been highlighted as one
contributing factor to declining soil fertility (DLRC, annual report 2004). These factors have
resulted in acute soil fertility problems under smallholder farm conditions (Saka et al., 1998).
The prevention of the degradation of the environment (including land) is enshrined under the new
Constitution of Malawi adopted in 1994 and the government will ensure that measures are in
place to reduce land degradation (Malawi Government, 2002). Several Malawian organizations
are engaged in implementing activities that strengthen the capacity of communities to manage
their natural resources (MoFFEA, 1998).
2.2 Policy background on soil fertility improvement initiatives
Policies provide guide and an environment for farmer decision making process. Farmers’
decision for uptake and use of the soil fertility improvement technologies is to an extent
influenced by the policy environment, goals and strategies in the country. Pre-independence
agriculture in Malawi was based on colonial administration. The population was low and there
were few estates. Shifting cultivation was a way of restoring soil fertility. Malawi gained
independence in 1964 and the focus for a food secure country was a priority of the government.
The government recommended the use of inorganic fertilizers for smallholders in order to
improve crop production and to restore soil fertility. The government worked at promoting better
land management system and increasing access to agriculture inputs, through subsidized fertilizer
and credit. There was a parastatal monopoly on maize and fertilizer marketing (ADMARC).
Subsidies for inorganic fertilizer prices and credit enabled both smallholder and commercial
farmers to use inorganic fertilizers.
7
In the 1980’s through the 90’s structural adjustment, slowly led to the gradual removal of
subsidies and breakdown of credit programs. This was a requirement by the World Bank and
other donors (Sahn et al., 1990). April 1995, all input and output prices were set free except for a
maize price band (Kherallah and Govindan, 1997). The Smallholder farmers buy their fertilizer in
local currency (Kwacha), and therefore devaluation has had a major impact on the price (Carr,
1997), since all fertilizers used in Malawi are imported. Public sector used to have monopoly in
procurement and distribution of fertilizer till 1994, when fertilizer market was liberalized, since
then any firm can import and sell to the smallholder or estate (Øygard et al., 2003). Removal of
fertilizer subsidies, liberalized fertilizer markets and devaluation of the Malawi Kwacha, (in mid
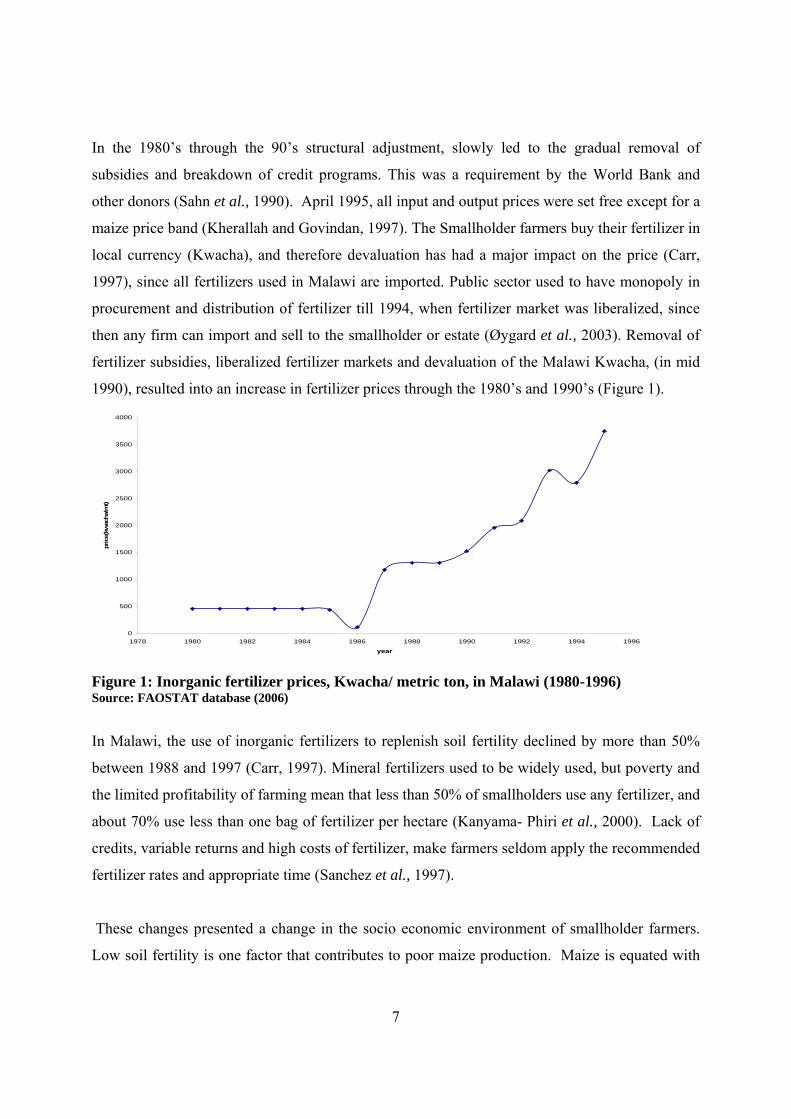
1990), resulted into an increase in fertilizer prices through the 1980’s and 1990’s (Figure 1).
0
500
1000
1500
2000
2500
3000
3500
4000
1978 1980 1982 1984 1986 1988 1990 1992 1994 1996
year
pric
e(kw
acha
/mt)
Figure 1: Inorganic fertilizer prices, Kwacha/ metric ton, in Malawi (1980-1996) Source: FAOSTAT database (2006)
In Malawi, the use of inorganic fertilizers to replenish soil fertility declined by more than 50%
between 1988 and 1997 (Carr, 1997). Mineral fertilizers used to be widely used, but poverty and
the limited profitability of farming mean that less than 50% of smallholders use any fertilizer, and
about 70% use less than one bag of fertilizer per hectare (Kanyama- Phiri et al., 2000). Lack of
credits, variable returns and high costs of fertilizer, make farmers seldom apply the recommended
fertilizer rates and appropriate time (Sanchez et al., 1997).
These changes presented a change in the socio economic environment of smallholder farmers.
Low soil fertility is one factor that contributes to poor maize production. Maize is equated with
8
food, therefore, government and farmers had to find a way for soil fertility improvement in order
to improve conditions for subsistence household. The government put in place a number of
programmes to increase use of inorganic fertilizers for poor smallholder farmers. For example, in
the seasons 2000/01 to 2001/2002 the government distributed free agriculture input packs in the
Targeted Input Programme (TIP), which included inorganic fertilizer (Øygard, 2005). The input
pack targeted the poorest smallholder households. The input packet comprised a free pack of
inorganic fertilizer and hybrid maize seed for cultivating 0.1 ha, a small amount of legume seeds
for intercropping. This was accompanied by an extension message to help farmer to try the
technologies under their own conditions and appreciating their results and adopting them. This
contributed to an increase in fertilizer consumption in 2002. Currently, the government is running
a rationed fertilizer subsidy program for smallholder farmers. Every smallholder household, for
the 2005/06 season, is supposed to be allowed to buy at a heavily subsidized price, a limited
amount of fertilizer (100 kg per maize growing household, plus 150 kg in addition for those who
also grow tobacco) through two parastatals, ADMARC and SFFRF (Øygard, 2005). Therefore,
fertilizer consumption is expected to increase and in turn improve agriculture production and
food security in the country.
Despite the Government programmes to improve farmers’ access of inorganic fertilizers, a large
part of the population can not afford the cost therefore, still faced with declining crop yield due to
declining soil fertility. In response to these challenges, the Government of Malawi is promoting
use of alternative low cost soil fertility improvement technologies. Research has lead to the
recommendation of a range of low external soil fertility input technologies, of proven
effectiveness, for soil fertility improvement.
2.3 Soil fertility improvement methods
A number of soil fertility improvement technologies are being promoted by the government arm
in the Ministry of Agriculture and non governmental organization, in order to improve
agricultural sustainability and livelihood security. The soil fertility improvement technologies
include inorganic fertilizer, livestock and compost manure, agroforestry and legumes, especially
Soya beans, groundnuts and pigeon peas. Agroforestry include, simultaneous intercropping with
9
Gliricidia, undersowing and improved fallows of Tephrosia vogelii and Sesbania sesban,
systematic inter-planting of Faidherbia albida and other soil improving trees.
2.3.1 Inorganic fertilizers All fertilizers used in Malawi are imported and the government has been encouraging the use of
high analysis fertilizer to save on transport and foreign exchange costs (Kherallah and Govindan,
1997). Use of inorganic fertilizers is one way of overcoming soil fertility depletion and increase
crop yield. Biophysically there is nothing wrong with proper use of inorganic fertilizers, as they
provide the same nutrients as organic sources (Sanchez et al., 1997). However, if no organic
matter is applied, continuous application of inorganic fertilizers may lead to reduction in
productivity of clay soils which dominates Africa (Akinnifesi and Kwesinga, 2002).
In Malawi, new area-specific fertilizer recommendation have been developed considering
profitability and soil texture (Waddington et al., 2004), however, the majority of farmers use the
blanket fertilizer recommendation which is 92 kg N/ha, 40 kg P and 20 kg K/ha for the hybrid
maize in Malawi (Makumba, personal communication, 2006). Inorganic has to be applied twice,
as a basal and top dressing. Application of basal and top dressing inorganic fertilizers ensures that
crops have enough nutrients throughout their growth. Time of application is important because
crops need to have sufficient nutrients at the right stages of growth. Fertilizer applied at tasseling
is not fully utilized and results in low yield (Kumwenda et al., 1996). Agronomic nitrogen use
efficiency depends, among other things, on crop and crop variety, climatic factors, soil fertility,
weed pressure, methods of application and rates of application (Kamanga et al., 2001).
2.3.2 Agroforestry practices
Agroforestry involves deliberate growing of the trees, shrubs and grasses in and around crop
fields in various ways to provide overall resource benefits. Agroforestry trees have great potential
for improving soil fertility in areas dominated by N deficiency (Kwesiga et al., 1999). In areas
where P is also a major limiting factor, inorganic sources of P should be used. Besides
improving soil fertility, agroforestry technologies provide benefits such as fuelwood, poles,
fodder, and help reduce soil erosion (MoFFEA, 1998). The fuelwood from agroforestry systems
is a highly valued added advantage in an area with an acute shortage of fuelwood (Maghembe et
10
al., 1997 as in Ngugi 2002). Impact assessment of the agroforestry technologies in the ICRAF
Zambezi Basin Agroforestry Project, showed that, the supply of firewood increased by 90% for
farmers in Malawi and 26% reported to have spent less time on collecting firewood (Akinnifesi et
al., 2005).
Agroforestry was introduced in Malawi in 1984 by the Department of Agricultural Research of
the Ministry of Agriculture (Makumba, 2003). In the study area, agroforestry technologies were
predominantly introduced and promoted by ICRAF since 1994. Agroforestry technologies for
soil fertility improvement being promoted include, intercropping of Glicidia sepium and maize,
improved fallow and annual relay cropping.
2.3.2.1 Intercropping of Glicidia sepium and maize
Gliricidia sepium is a nitrogen-fixing tree from Central America which can tolerate continuous
cutting back, can be mixed in and grown with crops in the field (Böhringer, 2001). Maize and
Gliricidia sepium are established concurrently on the same plot. The maize is grown in row
between the tree rows. The Glicidia sepium is established in every second furrow, spaced at a
distance of 1.5m between tree rows and the trees are spaced at 90cm within row (Makumba,
2003). There are two maize ridges at a distance of 75 cm, between the Glicidia sepium tree rows.
The tree growth is kept in check by pruning back at the beginning of the season and at regular
intervals during the growing season to prevent maize shading (Ngugi, 2002). The nitrogen rich
tree prunings are left on the plot to provide organic matter, which help to improve the soil’s
fertility and structure. Gliricidia sepium has coppicing ability therefore farmers can maintain the
trees on farm without replanting for over 15year (Kwesinga el at., 2003). The main objective is to
achieve household food security in situations where the availability of land is limited, such as
parts of southern Malawi, where population densities are over 100 persons/km2 (Böhringer,
2001). Gliricidia sepium is termite resistant, drought tolerant and generally not grazed although it
can be used for fodder if dried (MoFFEA, 1998).
In the Shire Highlands in Malawi, as many as 2–4 pruning are obtained each year, giving 2–7 t/ha
of biomass( Ngugi, 2002). The nitrogen equivalent that is added to the soil through the biomass
ranges from 60 to 120 kg/ha/yr (Ikerra et al., 1999). Maize yield in Gliricidia sepium plots during
the first and second year of establishment are similar to those from non-fertilized plots (Ngugi,
11
2002). Yields from the third year onwards, however, are markedly increased by Gliricidia sepium
manuring to an average of 1800–2500 kg/ha. Therefore, one limitation of the technology is the
three year lag period before its benefits become visible (Böhringer, 2001). Gliricidia and
Leucaena coppicing fallows at Chipata, Zambia, have maintained maize yields at 3.5t/ha over six
seasons without fertilizer applications (Mafongoya et al., 2001). Research at Makoka and
application of the technology at nearby farms has shown that Gliricidia sepium intercropping
helps to rejuvenate the soil and to improve soil fertility, without the use of fertilizer (ICRAF,
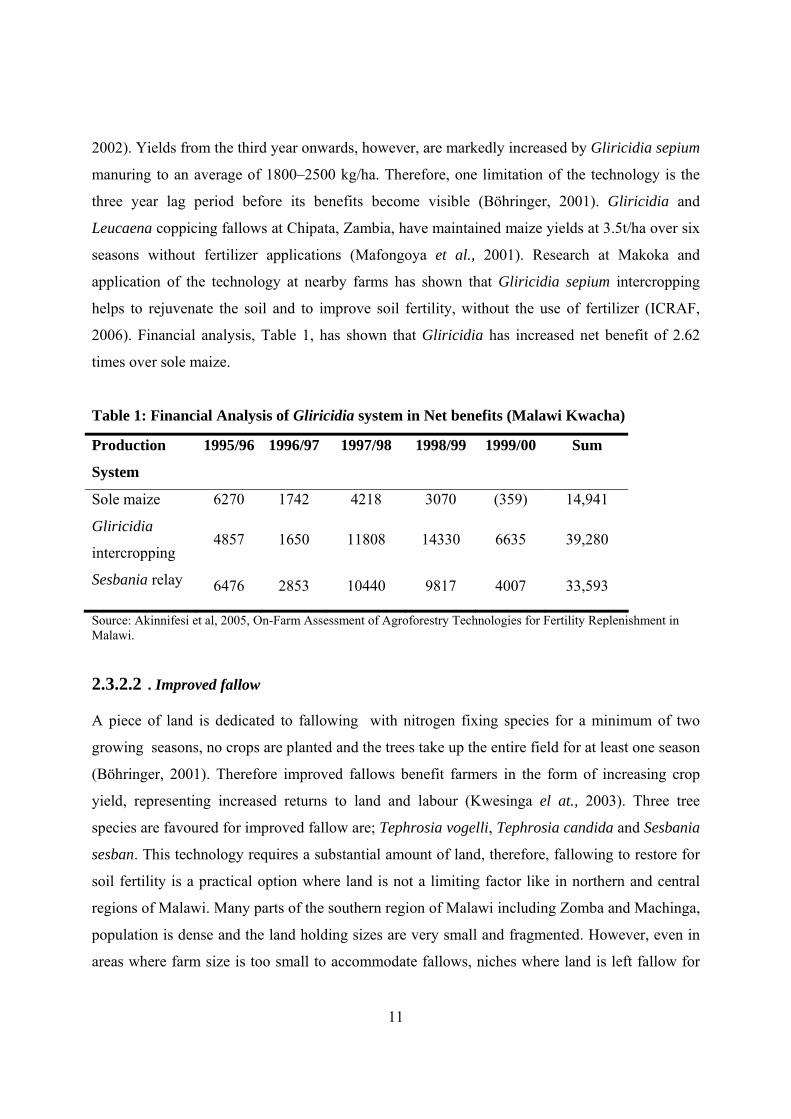
2006). Financial analysis, Table 1, has shown that Gliricidia has increased net benefit of 2.62
times over sole maize.
Table 1: Financial Analysis of Gliricidia system in Net benefits (Malawi Kwacha)
Production
System
1995/96 1996/97 1997/98 1998/99 1999/00 Sum
Sole maize 6270 1742 4218 3070 (359) 14,941
Gliricidia
intercropping 4857 1650 11808 14330 6635 39,280
Sesbania relay 6476 2853 10440 9817 4007 33,593
Source: Akinnifesi et al, 2005, On-Farm Assessment of Agroforestry Technologies for Fertility Replenishment in Malawi.
2.3.2.2 . Improved fallow
A piece of land is dedicated to fallowing with nitrogen fixing species for a minimum of two
growing seasons, no crops are planted and the trees take up the entire field for at least one season
(Böhringer, 2001). Therefore improved fallows benefit farmers in the form of increasing crop
yield, representing increased returns to land and labour (Kwesinga el at., 2003). Three tree
species are favoured for improved fallow are; Tephrosia vogelli, Tephrosia candida and Sesbania
sesban. This technology requires a substantial amount of land, therefore, fallowing to restore for
soil fertility is a practical option where land is not a limiting factor like in northern and central
regions of Malawi. Many parts of the southern region of Malawi including Zomba and Machinga,
population is dense and the land holding sizes are very small and fragmented. However, even in
areas where farm size is too small to accommodate fallows, niches where land is left fallow for
12
one reason or another can be used for the improved fallow technology (CTA/MAFE, 2002).
Farmers have also intensified improved fallows by intercropping during the first year when the
trees are being established (Böhringer, 2001).
Two and three-year Sesbania sesban-based fallows have proved highly effective in soil fertility
restoration in the region, particularly in Zambia (Ngugi, 2002). For example, maize grain yield
following a 3-year Sesbania sesban fallow without N fertilizer in Chipata, Zambia was 2.27, 5.59
and 6.02 t/ha after 1, 2 and 3 years fallow respectively, compared with the control plots with 1.6,
1.2, 1.8t/ha after 1, 2 and 3 years of continuous cropping (Kwesiga et al., 1994 as in Ngugi,
2002). Over a six year period from 1988 to 1993, sebania improved fallows showed that they
required less than half the amount of labour needed for one hectare of continuously cropped
maize (Kwesinga el at, 2003).
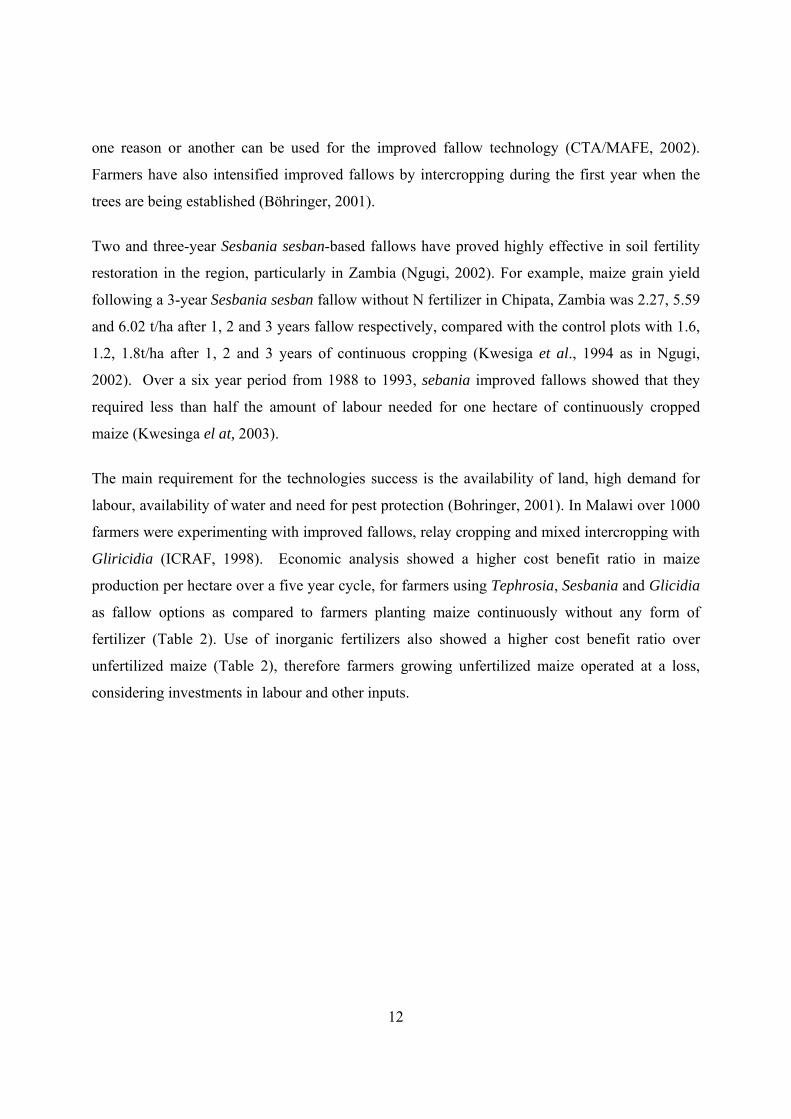
The main requirement for the technologies success is the availability of land, high demand for
labour, availability of water and need for pest protection (Bohringer, 2001). In Malawi over 1000
farmers were experimenting with improved fallows, relay cropping and mixed intercropping with
Gliricidia (ICRAF, 1998). Economic analysis showed a higher cost benefit ratio in maize
production per hectare over a five year cycle, for farmers using Tephrosia, Sesbania and Glicidia
as fallow options as compared to farmers planting maize continuously without any form of
fertilizer (Table 2). Use of inorganic fertilizers also showed a higher cost benefit ratio over
unfertilized maize (Table 2), therefore farmers growing unfertilized maize operated at a loss,
considering investments in labour and other inputs.
13
Table 2: Financial profitability of maize production systems under improved fallow per
hectare over a five-year cycle
Enterprise /Land use
subsystem
Net present value (US$) (US$) per year Benefit Cost ratio
maize without fertilizer 130 26 2.01
maize with fertilizer 499 100 2.65
Glicidia sepium fallow 269 54 2.91
Sesbania fallow 309 62 3.31
Tephrosia Vogelli fallow 233 47 2.77
Source: Ajayi, O. 2004 ‘Regional Highlights: Economics, Policy & Characterization for Scaling up Agroforestry options’ (Akinnifesi et al., 2005).
2.3.2.3 Annual relay fallow cropping
Nitrogen fixing trees are planted into a field at a time when crops, preferably maize, have already
been established (Kwesinga el at., 2003). This reduces competition between crop and tree shrub
for resources. Tephrosia vogelli, T. Candida, Sesbania sesban and Sesbania macrantha and
Crotalia spicies agroforestry species are preferred for this technology. The tree rows are spaced
at a distance 4.5m and the intra row trees spacing is 30 cm (Makumba, 2003). Planting of trees is
delayed for about two weeks after maize has been planted at the onset of the season. After
harvesting the maize crop, the trees are left to grow during the ensuing dry season, utilizing
residual moisture. At the beginning of the next season, these trees are chopped and woody parts
removed before incorporating all the leaves and litters into the soil as green manure. The process
is repeated annually (ICRAF, 2006). The technology would be suitable for the densely populated
southern Malawi, where farm sizes are too small to accommodate normal rotational fallows. The
advantage of this system is that farmers do not have to wait for the fallow phase of 2 years in the
sequential system, or for the initial period of tree establishment for coppicing fallows (Akinnifesi
et al., 2005). Limitations of the technology include labour for establishing the trees every year
and dependency on late rainfall for trees to become established (Böhringer, 2001). During drier
years, the trees produces less biomass hence its residual benefits to the maize crop diminishes
(Kwesinga et al., 2003).
14
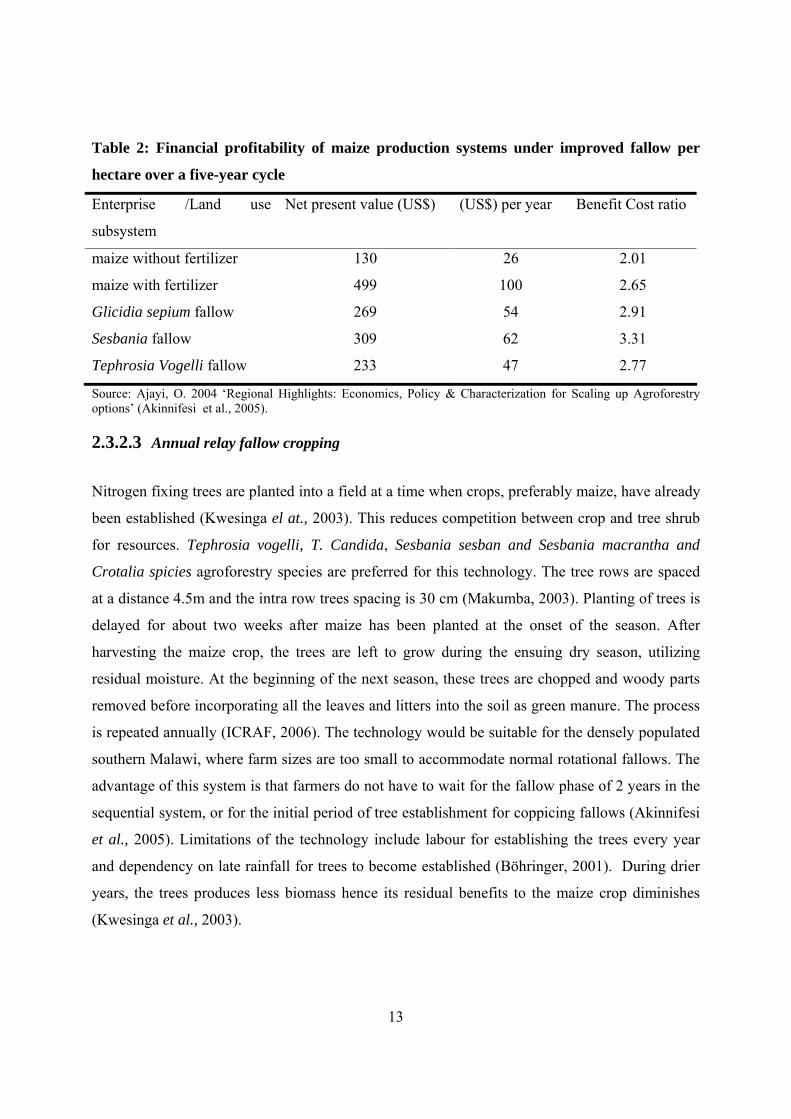
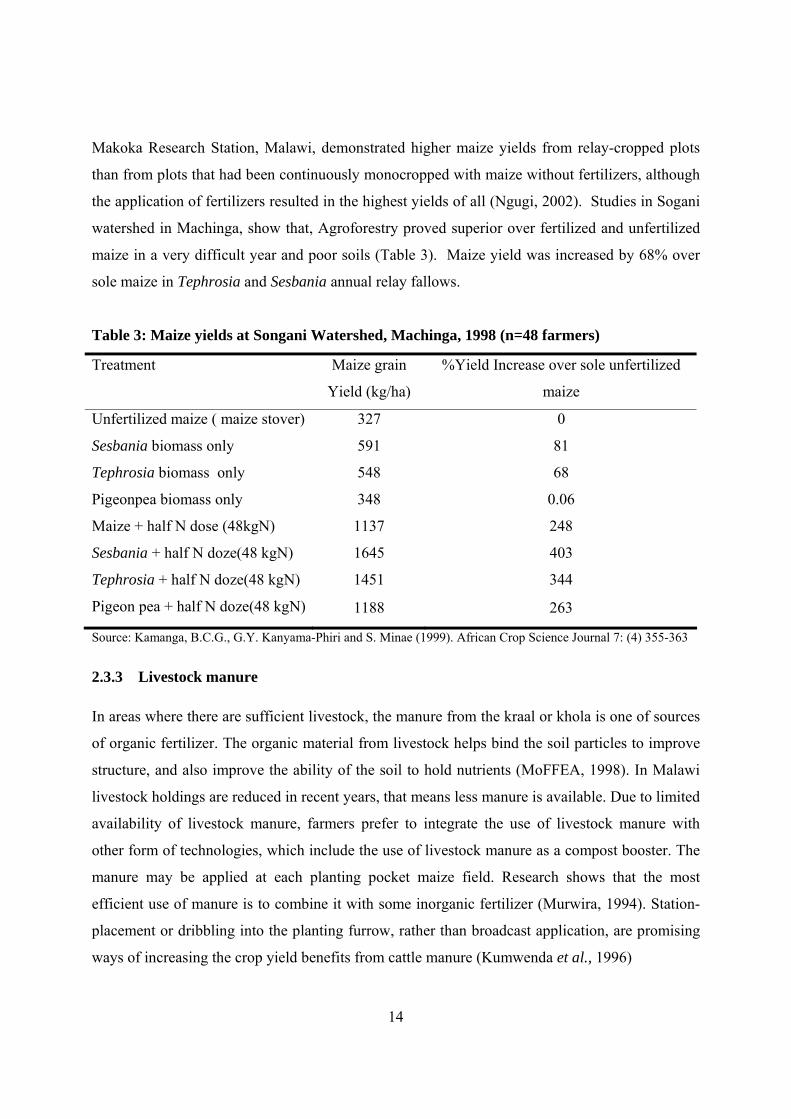
Makoka Research Station, Malawi, demonstrated higher maize yields from relay-cropped plots
than from plots that had been continuously monocropped with maize without fertilizers, although
the application of fertilizers resulted in the highest yields of all (Ngugi, 2002). Studies in Sogani
watershed in Machinga, show that, Agroforestry proved superior over fertilized and unfertilized
maize in a very difficult year and poor soils (Table 3). Maize yield was increased by 68% over
sole maize in Tephrosia and Sesbania annual relay fallows.
Table 3: Maize yields at Songani Watershed, Machinga, 1998 (n=48 farmers)
Treatment Maize grain
Yield (kg/ha)
%Yield Increase over sole unfertilized
maize
Unfertilized maize ( maize stover) 327 0
Sesbania biomass only 591 81
Tephrosia biomass only 548 68
Pigeonpea biomass only 348 0.06
Maize + half N dose (48kgN) 1137 248
Sesbania + half N doze(48 kgN) 1645 403
Tephrosia + half N doze(48 kgN) 1451 344
Pigeon pea + half N doze(48 kgN) 1188 263
Source: Kamanga, B.C.G., G.Y. Kanyama-Phiri and S. Minae (1999). African Crop Science Journal 7: (4) 355-363
2.3.3 Livestock manure In areas where there are sufficient livestock, the manure from the kraal or khola is one of sources
of organic fertilizer. The organic material from livestock helps bind the soil particles to improve
structure, and also improve the ability of the soil to hold nutrients (MoFFEA, 1998). In Malawi
livestock holdings are reduced in recent years, that means less manure is available. Due to limited
availability of livestock manure, farmers prefer to integrate the use of livestock manure with
other form of technologies, which include the use of livestock manure as a compost booster. The
manure may be applied at each planting pocket maize field. Research shows that the most
efficient use of manure is to combine it with some inorganic fertilizer (Murwira, 1994). Station-
placement or dribbling into the planting furrow, rather than broadcast application, are promising
ways of increasing the crop yield benefits from cattle manure (Kumwenda et al., 1996)
15
2.3.4 Compost manure
Compost manure is affordable and easy to make, using maize stalks and other biodegradable
substances. Use of compost can help soils to retain both water and nutrients hence an alternative
to inorganic fertilizers. The most common practice for composting in Malawi involves use of pit
which is dug, 1 m deep and 1.5 in widths. The composting materials which include crop residue,
dry leaves, grass or municipal wastes and manure, are moistened and left in a pit for varying
lengths of time to decompose. The composting time vary from 3 to 6 months before the compost
is mature and ready to use.
The fertilizer value and other benefits of the material will depend on the source materials, the
conditions under which it was made and the maturity of the compost when it is applied (Canadian
Organic growers, 1992). In general, however, the process results in a net improvement in soil
fertility, and crop yield (ibid).
The use of compost manure has been relatively low over the years, since 1994. However, the
launch of compost manure by the State President in 2002/ 2003 boosted use of compost manure
by smallholder farmer. The involvement of the State president portrayed the importance of the
technology and governments commitment in promotion of low cost soil fertility improvement
technologies agriculture production.
2.3.5 Early ploughing and crop residue management Undertaken soon after harvest while the soil is still moist, allows incorporation and
decomposition of trash and crop residues which improves the organic matter status of the soil and
reduces the fertilizer requirement of the next crop. Although the nutrient content of maize stover
is relatively low, stover can contribute to the productivity of the soil (Kumwenda et al., 1996).
Early ploughing also removes transpiring plants/weeds and leaves a broken soil layer which helps
conserve the moisture in the soil for the next crop (MoFFEA, 1998). Therefore unless crop
residues have to be destroyed to prevent diseases or pest as in tobacco or cotton, crop residues
have to be incorporated into the soil for maintenance of soil fertility and structure. However, it is
noted that improperly managed crop wastes can reduce plant growth in the following season
(ibid).
16
2.4 Farmer technology adoption
Farmers make decisions about adopting new technologies as part of the overall strategy for
ensuring subsistence and cash income needs. Farmers will invest in improving land and fertility if
it is a critical part of their livelihood strategy. The different livelihood strategies pursued by
farmers have significant implications for the types of technologies they adopt (Thangata et al.,
2001).
Adoption potential, from farmer’s perspective can be considered to have three components:
feasibility, profitability and acceptability (Swinkles and Franzel, 1997). Feasibility is the capacity
of the farmer to manage technology. The farmer should have the required information and
resource to maintain the soil fertility improvement technology (ibid). Technologies that are
promoted should therefore take into account the resource limited farm households. Technology
characteristics plays a role in influencing diffusion process and farmers decision making of
adoption of technologies (Vedeld and Krogh, 2001), as regards to farmers resources and
capability to manage the technology. The economic constraints of a household to access
resources influence the ability and willingness to adopt technological innovations (Vedeld 1990).
Higher income farmers may be less risk averse, have more access to information, and have
greater capacity to mobilize resources including information hence a high level of
innovativeness can be expected from them (Reij and Waters- Bayer 2001). However, for soil
fertility improvement technologies, poor farmers may be more willing to adopt low cost
technologies, like organic fertilizers. Farmers’ knowledge of the usefulness of improving their
soil fertility will enhance their willingness to substitute inorganic fertilizer, which is expensive,
with low cost technologies.
Profitability is concerned with the financial benefit obtained from using the technology. The
benefits should be higher than the use of an alternative technology as well as the current practice
(Franzel, 1999). Innovations should have relative advantage compared to others such as saving
time, reducing drudgery or improving income level (Vedeld and Krogh, 2001). However
sometimes agricultural innovations fail to meet expected benefit due to: unpredictable climatic
17
conditions, which are very crucial for agricultural innovations; and poor implementation if farmer
does not understand how the technology works, or the complexity of the technology.
Acceptability of technologies depends on willingness of the farmer in using a certain technology
depending on household characteristic and goals. In addition to profitability and feasibility farmer
will consider certain criteria as such as risk, gender aspects, cultural acceptance and compatibility
with the enterprise in order to accept a technology (Vanclay and Lawrence, 1994). Farmers will
adopt technologies that do not require major changes in the management system of the farm,
cultural and social values. Add-on technologies are likely to be adopted than practices that
require major land use change, even where significant economic advantages can be demonstrated
in the case of the latter. Therefore to increase acceptability of technology it is important to
identify and analyze the factors that affect adoption in differing households.
Transfer of technology to the farmers has an important influence on adoption of technology.
Farmers lack information and knowledge about innovations, hence the innovation diffusion
model, by Negatu and Parikh (1999), argues that a technology has to be transmitted from a
researcher to farmers through competent extension services (Rogers, 1995). The dynamics of
transfer of knowledge is partly a political issue (Scoones, 1994). To make extension more
effective in serving farmers needs and institutionally more sustainable, the Government of
Malawi and its partners in the agricultural sector have formulated a demand driven extension
service (Malawi Government, 2002). This approach allows farmer participation in the delivery
system by providing a forum for multidirectional communication between farmers and extension
staff. This integrates local knowledge in the system of extension service, therefore fostering the
adoption of agricultural technologies including soil fertility improvement technologies. For
efficient service delivery, the extension worker pre-service and in-service training is essential for
technical preparation and dissemination of extension messages.
Agricultural research has developed technologies that have not been fully adopted by smallholder
farmers because of high cost of the technologies and inadequate linkage between the research,
extension and farmers needs (Malawi government, 2002). This requires enhancing the partnership
between research and farmers. Researchers and farmers together need to understand the
18
circumstances, problems, and preferences of rural households and how these vary among
different types of farmers. Participatory techniques are available to ensure that farmers take the
lead in this diagnostic process (Chambers et al., 1989).
Communities are heterogeneous in socio economic characters, including gender, age, sex, marital
status, occupation and education levels. These characteristics reflect differences in decision
making related to preferences and utility of resources (Vedeld, 1990). Those who are prompted to
adopt innovations have similar characteristics, they have frequent contact with extension workers,
have higher levels of education, have positive attitude to change and relative income and standard
living (Ban and Hawkin, 1988).
19
3 METHODOLOGY
3.1 Description of study area
3.1.1 Location and demography
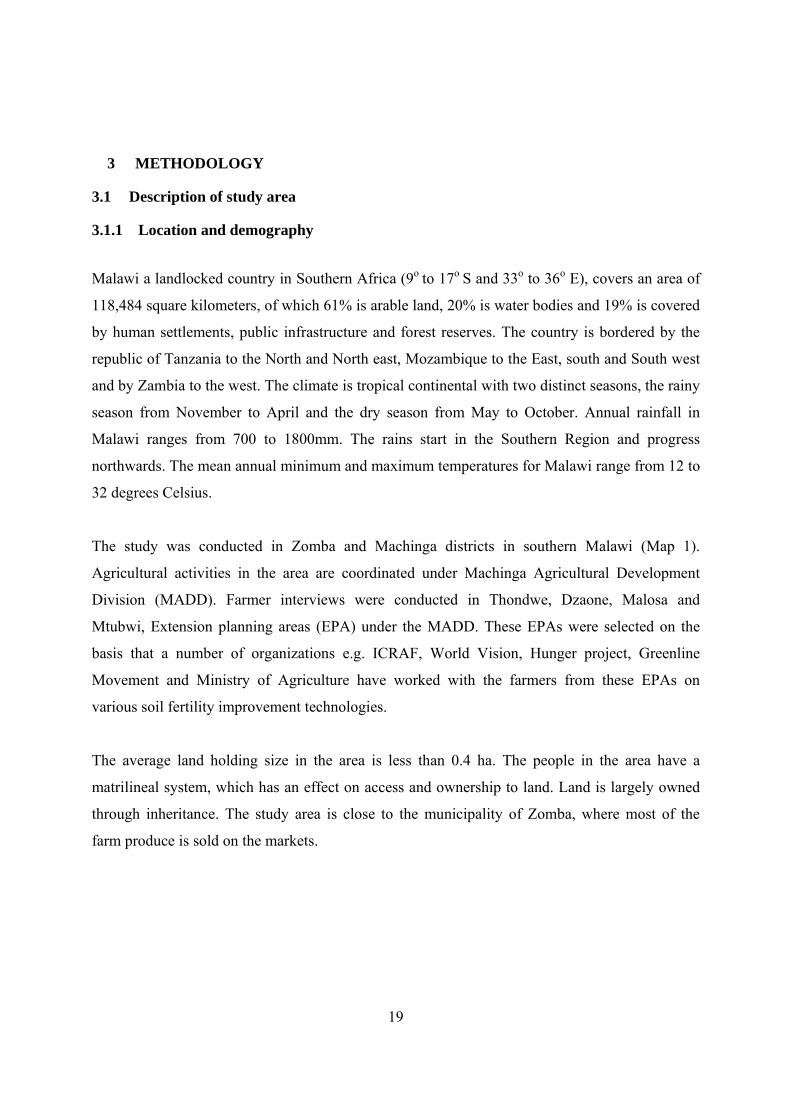
Malawi a landlocked country in Southern Africa (9o to 17o S and 33o to 36o E), covers an area of
118,484 square kilometers, of which 61% is arable land, 20% is water bodies and 19% is covered
by human settlements, public infrastructure and forest reserves. The country is bordered by the
republic of Tanzania to the North and North east, Mozambique to the East, south and South west
and by Zambia to the west. The climate is tropical continental with two distinct seasons, the rainy
season from November to April and the dry season from May to October. Annual rainfall in
Malawi ranges from 700 to 1800mm. The rains start in the Southern Region and progress
northwards. The mean annual minimum and maximum temperatures for Malawi range from 12 to
32 degrees Celsius.
The study was conducted in Zomba and Machinga districts in southern Malawi (Map 1).
Agricultural activities in the area are coordinated under Machinga Agricultural Development
Division (MADD). Farmer interviews were conducted in Thondwe, Dzaone, Malosa and
Mtubwi, Extension planning areas (EPA) under the MADD. These EPAs were selected on the
basis that a number of organizations e.g. ICRAF, World Vision, Hunger project, Greenline
Movement and Ministry of Agriculture have worked with the farmers from these EPAs on
various soil fertility improvement technologies.
The average land holding size in the area is less than 0.4 ha. The people in the area have a
matrilineal system, which has an effect on access and ownership to land. Land is largely owned
through inheritance. The study area is close to the municipality of Zomba, where most of the
farm produce is sold on the markets.
20
21
3.1.2 Livelihoods in the study area The main source of livelihoods in the study area is agriculture. Most of the farmers have
fragmented farm plots and face food shortages on an average of two to three months of the year.
Farmers sell their agriculture produce like maize, bean and groundnut for cash income, and
supplement with vegetables. Selling is done within the village and near by market points which
are at an average distance of 2km. To diversify their income sources, farmers take up seasonal
wage labour on other farms and own small scale business. Labour for the household farms largely
depends on household size and members.
Though farmers are aware of different credit institutions, few farmers take credit for their
agricultural activities and small scale business. The main reason for not taking on loans was the
fear of not being able to pay back with interest and not meeting the criteria which include
collateral. Few tobacco farmers however, access credit in the form of agriculture inputs, like
fertilizer and seed. To enhance social capital, farmers belong to different farmer and village
development groups.
3.1.3 Soils and climate
The soils in the area are alfisols and ultisols of moderate fertility, with clay loam occurring in the
lower slopes and sandy loam in the upper slopes (Kamanga, 2002). Most of the fields in the
upper slopes are characterized by rock outcrops. Annual rainfall range from 800 to 1,200 mm and
the mean annual temperature is 22.5 o C. The rainfall season normally begins in October and
finishes in April. However, experience has shown that when maize is planted in October it suffers
at least two weeks of dry spell between end of October and beginning of November (Makumba,
2003). The rainfall season is followed by little rains in June / July, known as Chiperoni rains.
These rains are of great importance as they provide moisture to enhance decomposition of the
semi buried crop residues incorporated at the time of ridge making.
22
3.1.4 Farming practices
Maize is the most important crop in the study area as it is the staple food. Maize based
intercropping dominates in the southern part of Malawi (Makumba 2003). Other important crops
are cassava, pigeon peas, groundnuts, beans, soybeans and pumpkins. Smallholder farmers also
own vegetable gardens in the dambo areas, for cash income as well as household nutritional
supplements. Tobacco and rice are also grown for cash income. Due to small land holding sizes
and the urge to satisfy basic household consumption needs, smallholder intercrop maize with two
or more other crops. Pulses like pigeon pea and beans are always intercropped with maize.
Farming activities for the growing seasons starts in July for smallholder farmers in southern
Malawi (Makumba, 2003). Land clearing which involves; removal and partial burying of crop
residues and weeds, takes place from July to August. Pulses intercropped with maize (e.g. pigeon
peas) and cassava, are harvested in September and October. This is followed by ridge making by
breaking old ridges from previous cropping season in October and November. New ridges spaced
at 75cm apart, are made every growing season. Previously the ridges were spaced at 90cm apart,
but the new recommendation is 75 cm (Min. of Agriculture, 1996). Maize and groundnuts are
planted first followed by pulses (e.g pigeon peas, common beans, and cow beans) from late
November through January. Maize is planted in planting pockets that are 75cm apart within the
row and pigeon peas planted between these pockets. The first weeding is done 3-4 weeks after
planting, from December to January, followed by the second weeding, 6-8 weeks later, in
February. Harvesting of the common beans begins in March through to April, while maize and
groundnuts are harvested in May and June.
3.2 Survey methods
The research team which comprised of five people was trained on a number of relevant aspects of
the research prior to the interviews. This was meant to help the team on understanding the
objectives of the research. A draft questionnaire was pre-tested on ten farm household in
Lilongwe district, a different area from the study area. The results of the pretest helped in the
restructuring of the final questionnaire by paraphrasing or rephrasing questions that were unclear
23
to both the respondent and interviewer, incorporating missing variables and omitting irrelevant
questions. During the survey, 97 farmers mostly heads of households were interviewed. However
in their absence, a household member conversant with farm activities was interviewed.
3.3 Data collection methods
3.3.1 Household questionnaire
A structured questionnaire composed of both open and closed ended questions was used to
collect data. The sample was stratified according to farmers that practice agroforestry and those
that don’t practice agroforestry in an Agriculture Extension Planning Area (EPA). A total of 25
households were interviewed per EPA, 10 household practicing agroforestry that were attached to
ICRAF project and 15 households that were not attached to ICRAF and hence assumed not to be
practicing agroforestry. However, some of the 15 none agroforestry households were found to
have adopted some agroforestry technologies in their crop production. This then increased the
number of farmers actually practicing agroforestry in some EPAs. The sample for the structured
questionnaire was randomly selected to make sampling suitable for statistical testing and
representative.
The questionnaire consisted of general questions, which included demographic and socio
economic characteristics of the respondents and their household. The questions also focused on
the different soil fertility improvement technologies that respondents are aware of, are trying or
have adopted, factors influencing use, and constraint associated with use of the technologies. The
questionnaire was also used to capture information on use of inorganic fertilizers and organic
fertilizers.
3.3.2 Key informants interviews
In addition to the questionnaire, interviews with key informants such as local leaders and elder
farmers (above 45 years age) were conducted using a checklist to supplement the questionnaire.
This was done to establish farmer’s perception with regards to the policy changes and its impacts
on agriculture productivity over the years. A questionnaire targeted at policy makers, was also
24
used as a tool to relate farmers’ experiences and the actual Government policies on land use and
management. The questionnaire was in the form of a checklist.
3.4 Data weakness Considering the time of research coincided with farm land preparations for the next growing
season, it was difficult to find household heads, hence some spouses might have been giving
different information. Conducting the interview in the presence of other household members, like
older children, minimized the problem. In understanding farmer decision making process, income
flows and crop yields are critical. However, collection of this data was difficult since data was
based on recall and not records. Farmers do not record their income inflows and outflows,
therefore income levels used are estimated annual income levels. The farmers however, were able
to describe changes in yield qualitatively but could not quantify the changes. The study did not
collect enough data on labour allocation of household for different agricultural activities. This has
made it difficult to calculate the labour productivity in use of a particular soil fertility
improvement technology in their farming practice. Labour productivity of an agricultural
technology is important for continuity in use of a particular technology.
3.5 Methods of analysis
The data was analyzed in Statistical Package for Social Science (SPSS) and STATA software.
Descriptive statistics such as, percentages were used to describe farmer perception of the current
level of soil fertility and farmers use and constraints of different soil fertility improvement
technologies. Logistic regression was used to analyze factors affecting adoption of different soil
fertility improvement technologies. Chi-square-test was also used to analyze the effect of
different variables on use of different soil fertility improvement technologies.
25
4 RESULTS AND DISCUSSION
4.1 Farmer’s perception of soil fertility problems
Understanding the soil fertility problems from farmer’s point of view is crucial in analysis of the
adoption potential of soil fertility improvement technologies. Farmers will adopt technologies
that contribute positively to their livelihood. Hence, if soil fertility problems are viewed critical
for their livelihood; farmer’s likelihood for adoption is enhanced. Farmers possess a lot of
knowledge about the trend of soil fertility in Malawi. Farmers over 40 years of age were asked to
describe the soil fertility changes over the years, 90% described the soil fertility levels as low as
compared to 20 years ago. About 10% of the farmers describe that the soil fertility levels are
improving with the introduction of new technologies, such as, agroforestry.
Farmers attributed these change to a number of factor including the social and economic changes.
In early years of 1950 to 60s, there were very few estates and the population was manageable,
hence fallowing was used to restore soil fertility. Population grew over the years and hand
holding sizes declined and fallowing became impossible. The soils were being over mined due to
continuous cultivation leading to declining soil fertility. Decline in soil fertility caused low
agriculture production. Fertilizer was introduced to increase agriculture production to meet the
consumption needs of the growing population, which was making extensive agriculture practice
impossible. However over the years, fertilizer prices have become costly for smallholder farmers,
making it difficult for farmers to apply the recommended rate, at the appropriate time and
annually. Therefore farmers continue to cultivate on the plots leading to continued decline in soil
fertility. Farmers also claim that continued use of inorganic fertilizer reduce the soil fertility and
agriculture production. This could be attributed to the decline in organic matter in the soil, which
besides supplying nutrients, ensures good soil conditions necessary for plant growth.
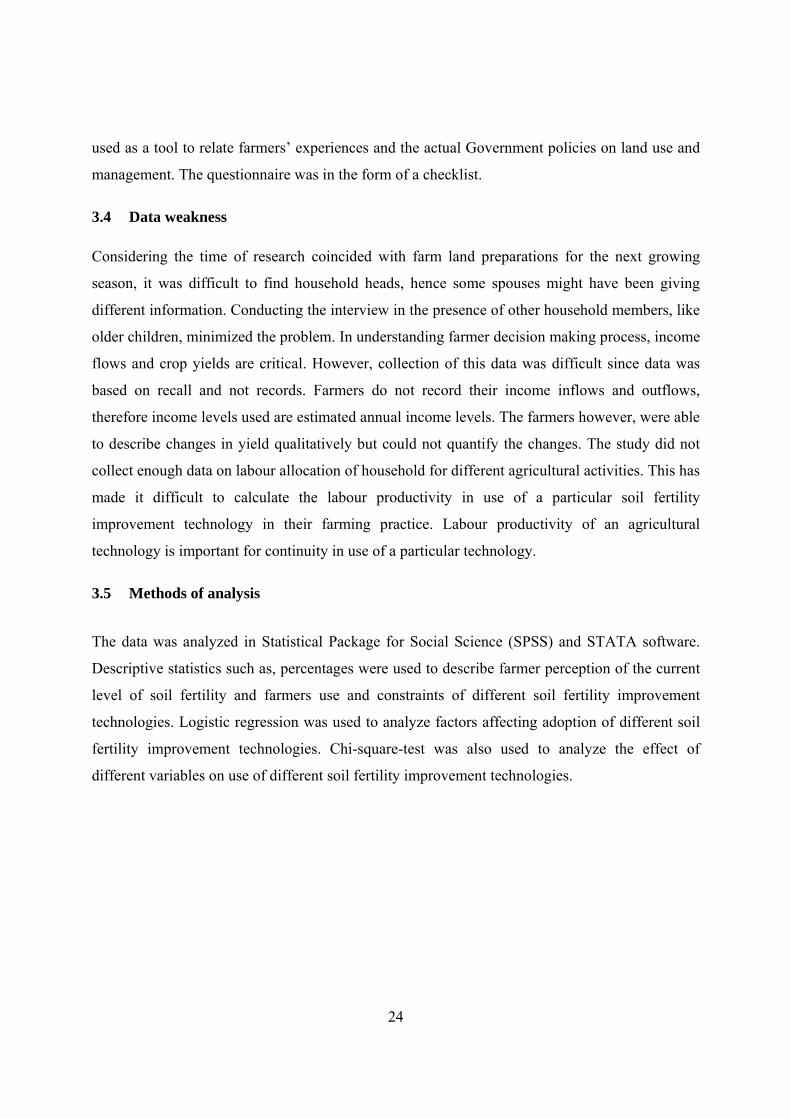
The majority of farmers are aware of the soil fertility problems, as 73 % of the interviewed
farmers perceive the current level of soil fertility as low, while 20 % believe that the soil fertility
is still manageable whilst only 7% perceive the fertility in their farms as still high ( Figure 2).
Farmers that perceive soil fertility levels as high have either access to inorganic fertilizer or just
reallocated and open a new farming plot.
26
0
10
20
30
40
50
60
70
80
low soil fertility managable high soil fertility
Level of Soil fertility
Perc
enta
ge o
f far
mer
s
Figure 2: Farmers perception of the current soil fertility level
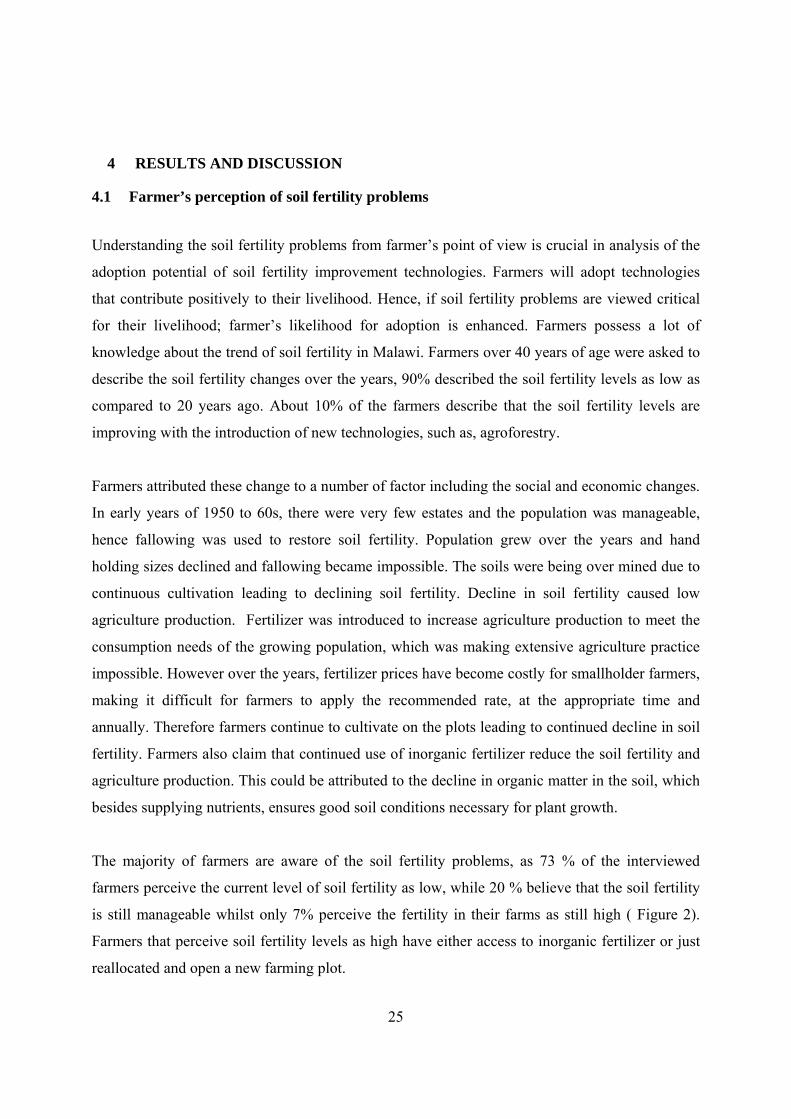
According to the farmers, continued cultivation on the same piece of land without fallowing over
the years has led to declining soil fertility for most farm plots. Although farmers are aware of the
soil fertility problems in the area, farmers continue to cultivate and overexploit the available
natural resources with little input, in order to meet household consumption needs. Most farmers
(62%), therefore, perceived that soil fertility will continue to decline. However, 21 % of the
farmers perceive that soil fertility will increase whilst 17% perceive that there will be no changes
at all (Figure 3). Introduction of the low cost, organic soil fertility improvement technologies
gives farmers an option for resorting soil organic matter and improve fertility levels.
0
10
20
30
40
50
60
70
Declining Increasing No change
Changes in soil fertility levels
Perc
enta
ge o
f far
mer
s
Figure 3: Farmer’s perceived future changes in soil fertility levels
27
Continuous cropping with little or no mineral inputs was expressed as one of the causes for
declining soil fertility by 67% of the farmers. Farmers have been cultivating on the same farm
land continuously for years without fallowing, therefore soils have been mined of the nutrients
and the soils ability to produce high crop yield has declined. Soil erosion and deforestation and
increase in population, were other factors that farmers noted that contributed to loss of soil
fertility. This shows that farmers are knowledgeable of the soil fertility problems, the causes and
the resulting effect on agriculture production and food security. Hence, farmers are willing to
invest in measures that will maintain and improve soil fertility.
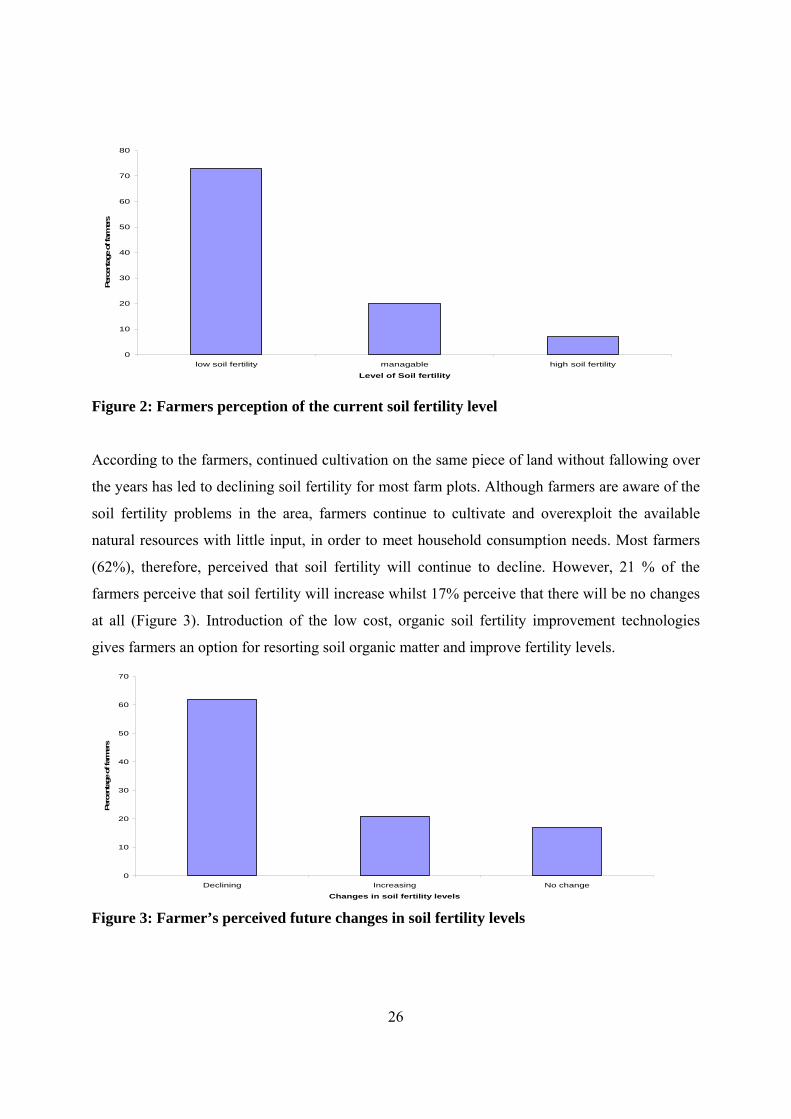
4.2 Adaptation to declining soil fertility
In order to improve agriculture production and food security with regard to the existing soil
fertility problems, farmers have adapted a range of soil fertility improvement technologies.
Figure 4, shows the percentage use for various technologies.
0
10
20
30
40
50
60
70
80
90
Inorganic fertilizer Agroforestry Livestock manure Compost manure intergrated soil fertility
Soil fertility improvement technologies
Perc
enta
ge U
se
Figure 4: Percentage of farmers using different of soil fertility improvement
technologies
Inorganic fertilizers are used by 85 % of the farmers interviewed. Farmers mainly apply urea and
ammonium nitrate to maize and phosphate fertilizers to tobacco. Inorganic fertilizers are easy to
use, not bulky and have immediate effect on crop production, therefore farmers prefer to use
inorganic fertilizer as compared to organic fertilizer. Smallholder farmers have to feed
28
themselves as well as the soil, principally they will be interested to use soil fertility technologies
that raises crop yields and provide food in short term (Weddington et al., 2004).
High prices are a major constraint for farmer use of inorganic fertilizers. Farmers are unable to
apply the recommended rate, at appropriate time and to the whole farm. Only 25% of the farmers
interviewed were able to apply the recommended rates and 38% managed to apply to the whole
farm. Inorganic has to be applied twice, as a basal and top dressing; however, farmers prefer to
apply inorganic fertilizer only for top dressing. Though the country has a number of agro
products selling points, most markets were at an average distance of 5 km from a farmer, making
it difficult for farmers to travel, especially in the local area where transport systems are
undeveloped and inaccessible during rainy season. Therefore, farmers tend to apply inorganic
fertilizer late and fertilizer application becomes unproductive.
According to farmers, use of inorganic fertilizer is risky because; first, yields and output prices
can vary widely on a year-to-year basis, so farmers fear that in any given year their crop income
will not be able to cover their costs. Second, since crop yields depend on rainfall patterns, in dry
years the crop response to fertilizer can be poor
About, 22% of farmers use livestock manure. Use of livestock manure was related to ownership
of livestock. Most farmers in Zomba and Machinga do not own livestock, hence the limited use
of livestock manure. In the study area, farmers use extensive methods for feeding their livestock,
hence manure is collected at night. If farmers change their livestock system, then more manure
can be collected. Due to limited availability of livestock manure, farmers prefer to integrate the
use of livestock manure with other technologies. Livestock manure is used as a compost booster
by 64% of the farmers. Livestock manure is also applied at each planting pocket as a basal
dressing in maize field and later top dressed by inorganic fertilizers and mixed in agro forestry
plots. Since inorganic fertilizer use is limited, application of livestock manure as a basal dressing,
compliments inorganic fertilizer. This makes nutrient, from livestock manure, available for plants
during vegetative stage, and nutrients from inorganic fertilizer, during the productive stage.
Therefore, the crucial growth stages of the crop are synchronized with available nutrients in the
field. Most farmers have fragmented farming plots, and 78% of farmers using livestock manure
described transporting the manure to distant plots is a major constraint in use of livestock
29
manure. This is because transporting the manure requires a lot of labour and time. Hence,
livestock manure is mostly applied around homestead and dimbas (vegetable gardens).
Compost is affordable and easy to make from a combination of maize stalks and other
biodegradable substances. However, only 46% percent of the interviewed farmers used compost
manure as a soil fertility improvement technology option. About 60 % of the farmers using
compost manure described time as one limiting factor in using compost manure. The composting
time vary from 3 to 6months before the compost is mature and ready to use, therefore it is time
consuming to make adequate manure for farm plots. Compost is described as bulky, by 64% of
the farmers using compost manure. Labour and transportation are the major constraints in the use
of compost as described by 95% of the farmers using compost manure. Therefore, distance to
farming plot is an important aspect in use of compost.
Since farmers use materials with low nutrient levels, the effectiveness of compost on crop
production is heavily compromised. Therefore, farmers prefer to add inorganic fertilizers or
combine compost with other fertilizer in order to increase crop yields. Farmers expressed
ignorance on the recommended technique for application of the compost manure.
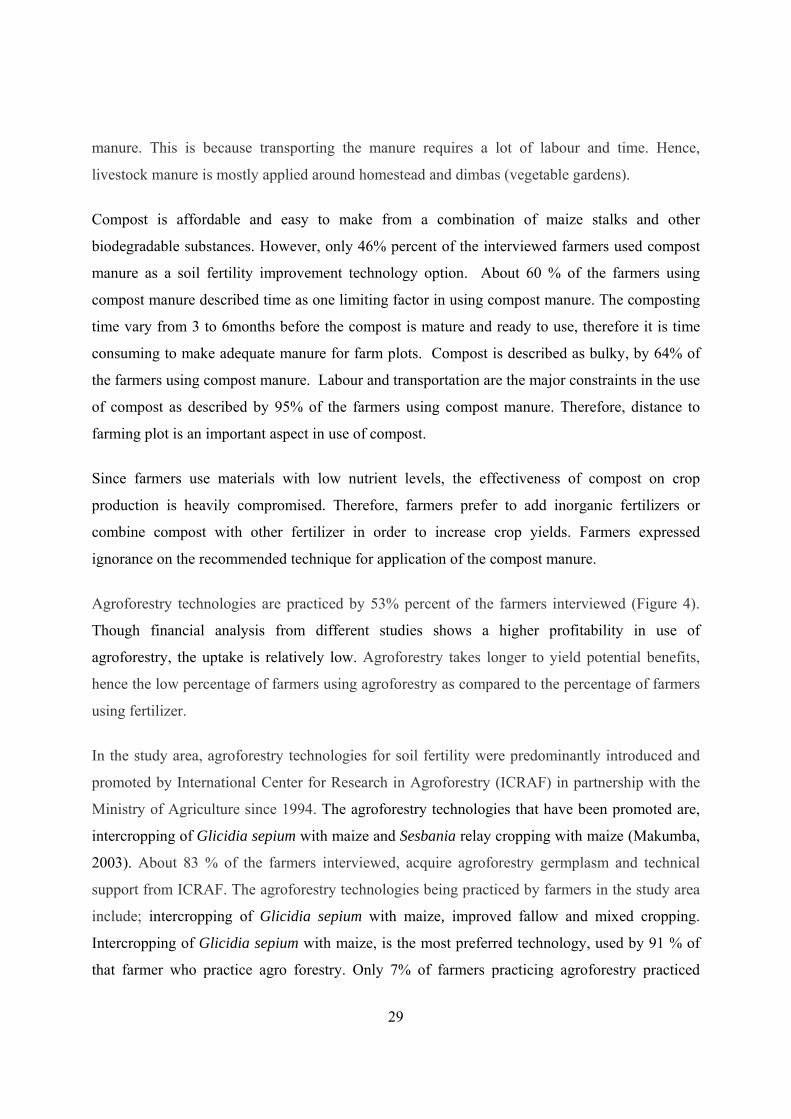
Agroforestry technologies are practiced by 53% percent of the farmers interviewed (Figure 4).
Though financial analysis from different studies shows a higher profitability in use of
agroforestry, the uptake is relatively low. Agroforestry takes longer to yield potential benefits,
hence the low percentage of farmers using agroforestry as compared to the percentage of farmers
using fertilizer.
In the study area, agroforestry technologies for soil fertility were predominantly introduced and
promoted by International Center for Research in Agroforestry (ICRAF) in partnership with the
Ministry of Agriculture since 1994. The agroforestry technologies that have been promoted are,
intercropping of Glicidia sepium with maize and Sesbania relay cropping with maize (Makumba,
2003). About 83 % of the farmers interviewed, acquire agroforestry germplasm and technical
support from ICRAF. The agroforestry technologies being practiced by farmers in the study area
include; intercropping of Glicidia sepium with maize, improved fallow and mixed cropping.
Intercropping of Glicidia sepium with maize, is the most preferred technology, used by 91 % of
that farmer who practice agro forestry. Only 7% of farmers practicing agroforestry practiced
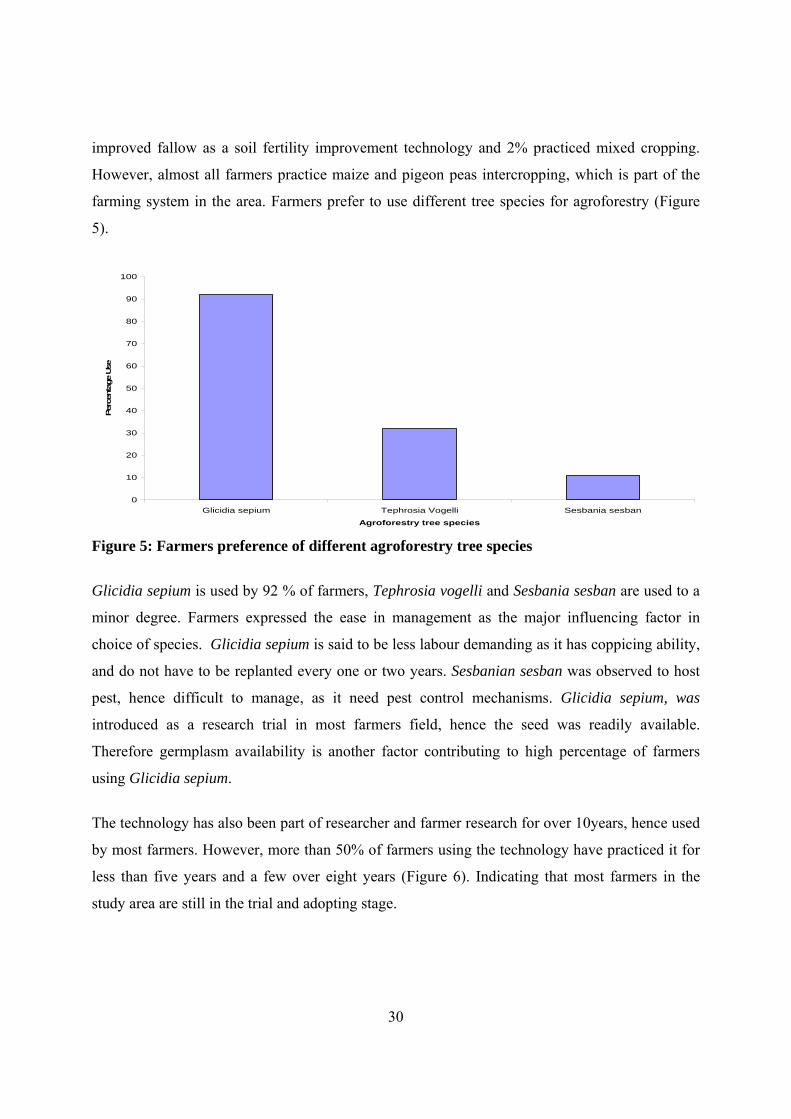
30
improved fallow as a soil fertility improvement technology and 2% practiced mixed cropping.
However, almost all farmers practice maize and pigeon peas intercropping, which is part of the
farming system in the area. Farmers prefer to use different tree species for agroforestry (Figure
5).
0
10
20
30
40
50
60
70
80
90
100
Glicidia sepium Tephrosia Vogelli Sesbania sesban
Agroforestry tree species
Perc
enta
ge U
se
Figure 5: Farmers preference of different agroforestry tree species
Glicidia sepium is used by 92 % of farmers, Tephrosia vogelli and Sesbania sesban are used to a
minor degree. Farmers expressed the ease in management as the major influencing factor in
choice of species. Glicidia sepium is said to be less labour demanding as it has coppicing ability,
and do not have to be replanted every one or two years. Sesbanian sesban was observed to host
pest, hence difficult to manage, as it need pest control mechanisms. Glicidia sepium, was
introduced as a research trial in most farmers field, hence the seed was readily available.
Therefore germplasm availability is another factor contributing to high percentage of farmers
using Glicidia sepium.
The technology has also been part of researcher and farmer research for over 10years, hence used
by most farmers. However, more than 50% of farmers using the technology have practiced it for
less than five years and a few over eight years (Figure 6). Indicating that most farmers in the
study area are still in the trial and adopting stage.
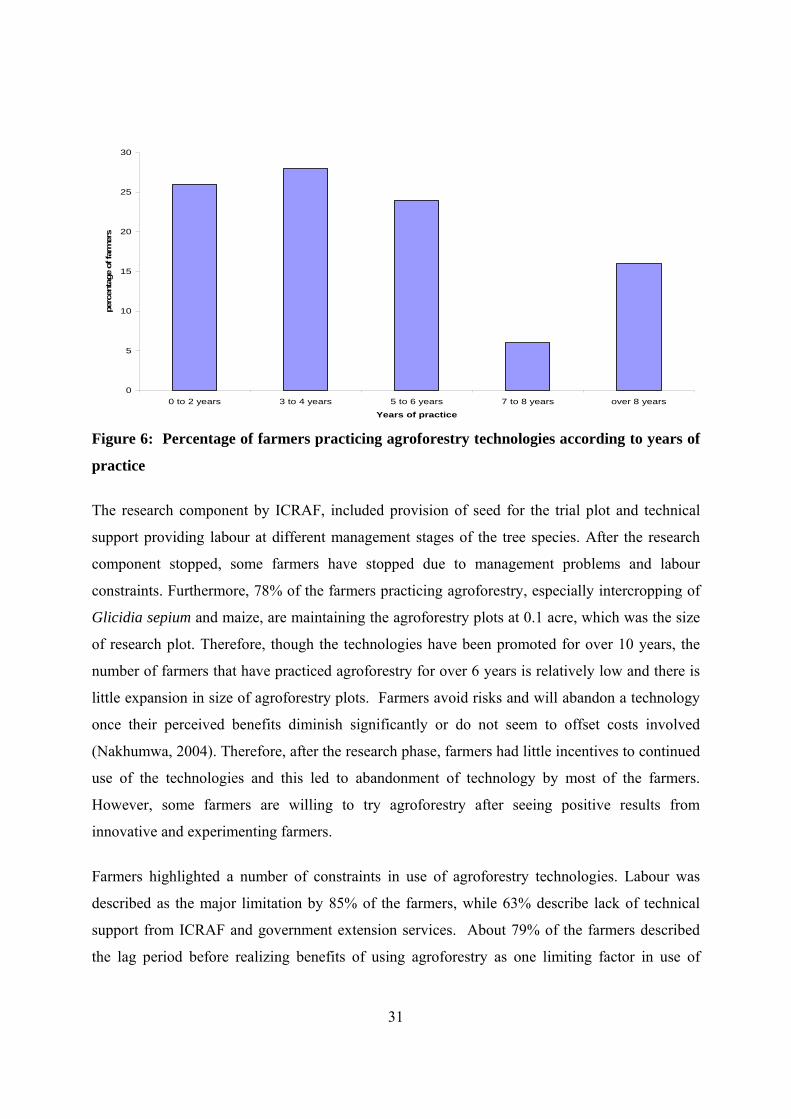
31
0
5
10
15
20
25
30
0 to 2 years 3 to 4 years 5 to 6 years 7 to 8 years over 8 years
Years of practice
perc
enta
ge o
f far
mer
s
Figure 6: Percentage of farmers practicing agroforestry technologies according to years of
practice
The research component by ICRAF, included provision of seed for the trial plot and technical
support providing labour at different management stages of the tree species. After the research
component stopped, some farmers have stopped due to management problems and labour
constraints. Furthermore, 78% of the farmers practicing agroforestry, especially intercropping of
Glicidia sepium and maize, are maintaining the agroforestry plots at 0.1 acre, which was the size
of research plot. Therefore, though the technologies have been promoted for over 10 years, the
number of farmers that have practiced agroforestry for over 6 years is relatively low and there is
little expansion in size of agroforestry plots. Farmers avoid risks and will abandon a technology
once their perceived benefits diminish significantly or do not seem to offset costs involved
(Nakhumwa, 2004). Therefore, after the research phase, farmers had little incentives to continued
use of the technologies and this led to abandonment of technology by most of the farmers.
However, some farmers are willing to try agroforestry after seeing positive results from
innovative and experimenting farmers.
Farmers highlighted a number of constraints in use of agroforestry technologies. Labour was
described as the major limitation by 85% of the farmers, while 63% describe lack of technical
support from ICRAF and government extension services. About 79% of the farmers described
the lag period before realizing benefits of using agroforestry as one limiting factor in use of
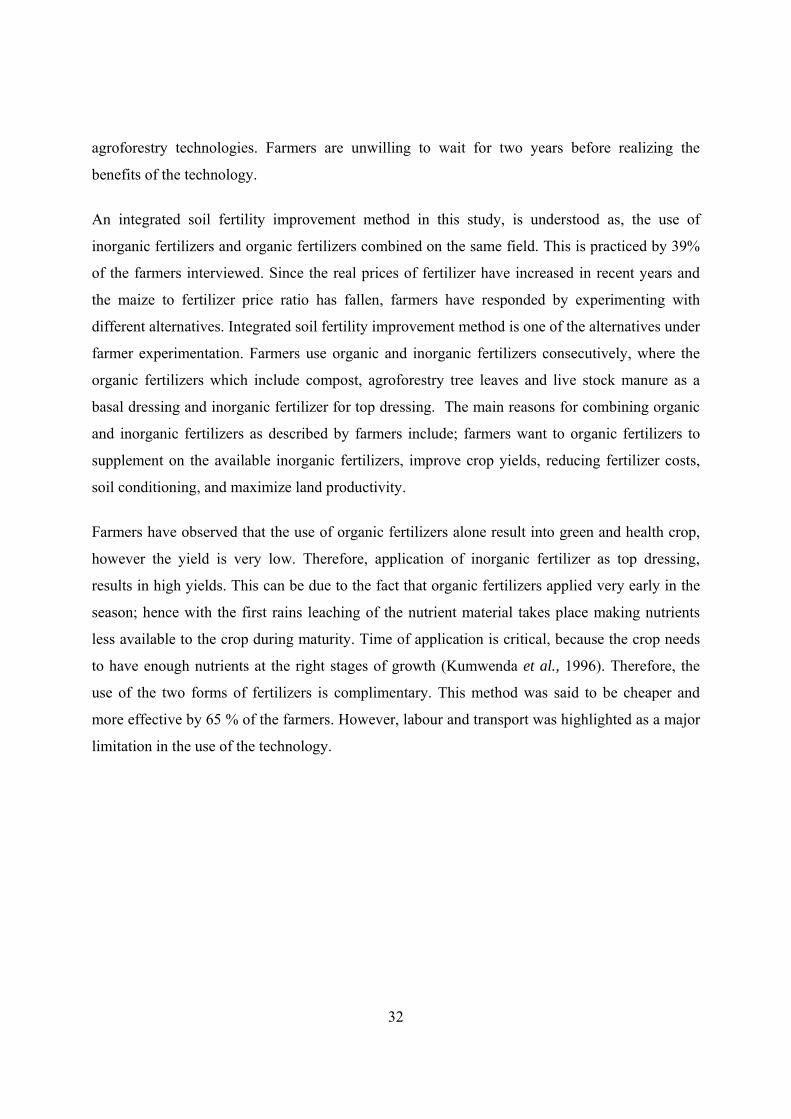
32
agroforestry technologies. Farmers are unwilling to wait for two years before realizing the
benefits of the technology.
An integrated soil fertility improvement method in this study, is understood as, the use of
inorganic fertilizers and organic fertilizers combined on the same field. This is practiced by 39%
of the farmers interviewed. Since the real prices of fertilizer have increased in recent years and
the maize to fertilizer price ratio has fallen, farmers have responded by experimenting with
different alternatives. Integrated soil fertility improvement method is one of the alternatives under
farmer experimentation. Farmers use organic and inorganic fertilizers consecutively, where the
organic fertilizers which include compost, agroforestry tree leaves and live stock manure as a
basal dressing and inorganic fertilizer for top dressing. The main reasons for combining organic
and inorganic fertilizers as described by farmers include; farmers want to organic fertilizers to
supplement on the available inorganic fertilizers, improve crop yields, reducing fertilizer costs,
soil conditioning, and maximize land productivity.
Farmers have observed that the use of organic fertilizers alone result into green and health crop,
however the yield is very low. Therefore, application of inorganic fertilizer as top dressing,
results in high yields. This can be due to the fact that organic fertilizers applied very early in the
season; hence with the first rains leaching of the nutrient material takes place making nutrients
less available to the crop during maturity. Time of application is critical, because the crop needs
to have enough nutrients at the right stages of growth (Kumwenda et al., 1996). Therefore, the
use of the two forms of fertilizers is complimentary. This method was said to be cheaper and
more effective by 65 % of the farmers. However, labour and transport was highlighted as a major
limitation in the use of the technology.
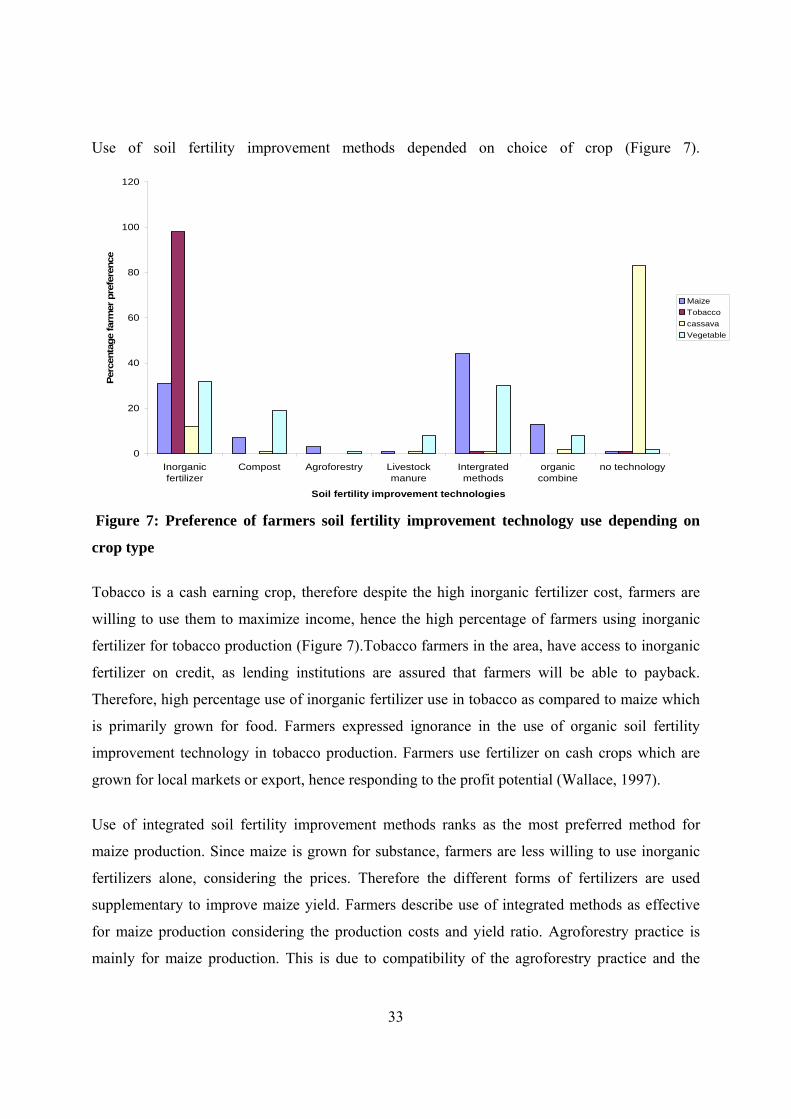
33
Use of soil fertility improvement methods depended on choice of crop (Figure 7).
0
20
40
60
80
100
120
Inorganicfertilizer
Compost Agroforestry Livestockmanure
Intergratedmethods
organiccombine
no technology
Soil fertility improvement technologies
Perc
enta
ge fa
rmer
pre
fere
nce
MaizeTobaccocassavaVegetable
Figure 7: Preference of farmers soil fertility improvement technology use depending on
crop type
Tobacco is a cash earning crop, therefore despite the high inorganic fertilizer cost, farmers are
willing to use them to maximize income, hence the high percentage of farmers using inorganic
fertilizer for tobacco production (Figure 7).Tobacco farmers in the area, have access to inorganic
fertilizer on credit, as lending institutions are assured that farmers will be able to payback.
Therefore, high percentage use of inorganic fertilizer use in tobacco as compared to maize which
is primarily grown for food. Farmers expressed ignorance in the use of organic soil fertility
improvement technology in tobacco production. Farmers use fertilizer on cash crops which are
grown for local markets or export, hence responding to the profit potential (Wallace, 1997).
Use of integrated soil fertility improvement methods ranks as the most preferred method for
maize production. Since maize is grown for substance, farmers are less willing to use inorganic
fertilizers alone, considering the prices. Therefore the different forms of fertilizers are used
supplementary to improve maize yield. Farmers describe use of integrated methods as effective
for maize production considering the production costs and yield ratio. Agroforestry practice is
mainly for maize production. This is due to compatibility of the agroforestry practice and the
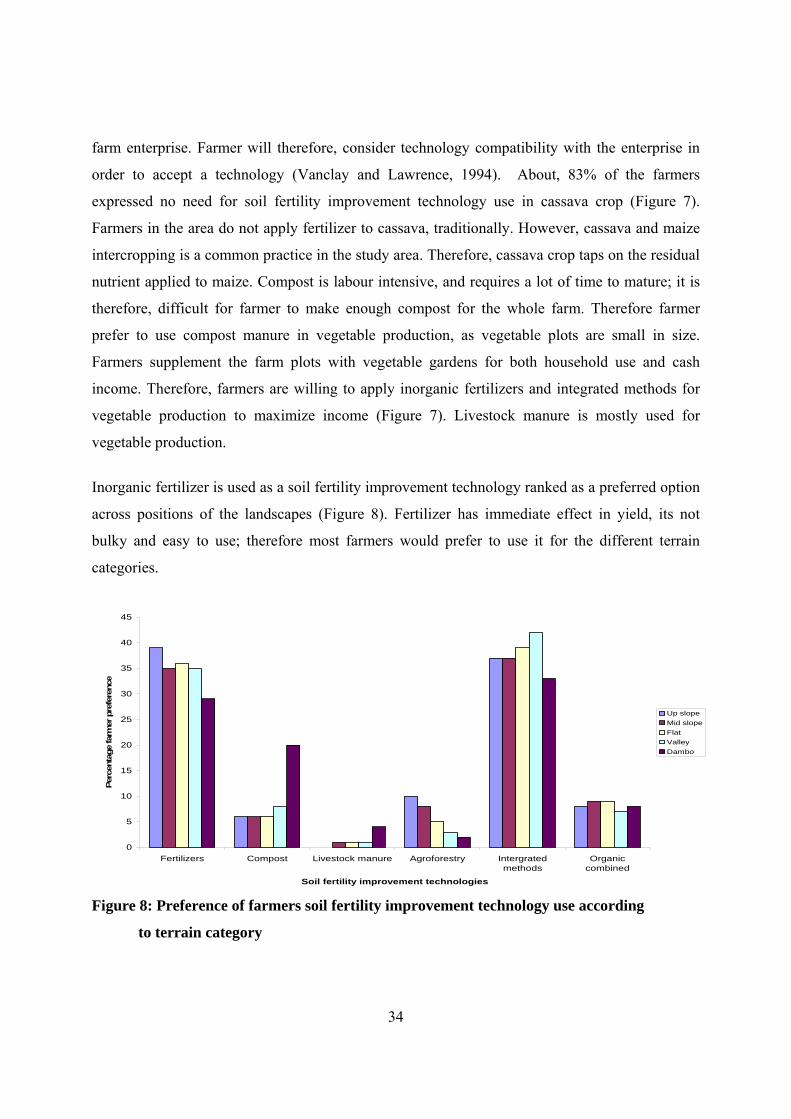
34
farm enterprise. Farmer will therefore, consider technology compatibility with the enterprise in
order to accept a technology (Vanclay and Lawrence, 1994). About, 83% of the farmers
expressed no need for soil fertility improvement technology use in cassava crop (Figure 7).
Farmers in the area do not apply fertilizer to cassava, traditionally. However, cassava and maize
intercropping is a common practice in the study area. Therefore, cassava crop taps on the residual
nutrient applied to maize. Compost is labour intensive, and requires a lot of time to mature; it is
therefore, difficult for farmer to make enough compost for the whole farm. Therefore farmer
prefer to use compost manure in vegetable production, as vegetable plots are small in size.
Farmers supplement the farm plots with vegetable gardens for both household use and cash
income. Therefore, farmers are willing to apply inorganic fertilizers and integrated methods for
vegetable production to maximize income (Figure 7). Livestock manure is mostly used for
vegetable production.
Inorganic fertilizer is used as a soil fertility improvement technology ranked as a preferred option
across positions of the landscapes (Figure 8). Fertilizer has immediate effect in yield, its not
bulky and easy to use; therefore most farmers would prefer to use it for the different terrain
categories.
0
5
10
15
20
25
30
35
40
45
Fertilizers Compost Livestock manure Agroforestry Intergratedmethods
Organiccombined
Soil fertility improvement technologies
Perc
enta
ge fa
rmer
pre
fere
nce
Up slopeMid slopeFlatValleyDambo
Figure 8: Preference of farmers soil fertility improvement technology use according
to terrain category
35
Integrated soil fertility methods are highly preferred for flat and valley areas. Organic fertilizers
are bulky and labour intensive, hence it is easy to use in the lower areas as compared to uplands.
Farmers still practice the organic methods in upland, for restoration of organic matter, since
farmers claim that continued use of inorganic fertilizer alone degrade the soil and reduce soil
fertility. The most common organic method in the uplands is agro forestry, as it serves a dual
purpose for soil fertility improvement as well as control of soil erosion. Livestock manure is the
least preferred method for soil fertility improvement. The collection of droppings from free
ranged system of feeding is difficult. Use of livestock manure and compost are ranked high in
dambo areas as compared to the other terrain categories. This is because farmers use dambo for
vegetable gardens which are usually small in size.
4.3 Factors influencing use of soil fertility improvement technology Farmers make decisions about adopting new technologies as part of the overall strategy for
ensuring improved livelihoods. In the study, 99% of the farmers use different technologies to
improve soil fertility. The overall reason for using soil fertility improvement technologies was to
improve crop yield. However the choice of a particular soil fertility improvement technology
depended on a number of factors, including physical and socio economic factors. Technology
characteristics largely influence the household decision making of use and adoption of a
technology. Farmers weigh the household capacity and potential in relation technology
characteristics before use and adoption of technologies. Household characteristics vary in a
community hence different households adopt different soil fertility improvement technologies
depending on the household characteristic.
4.3.1 Inorganic fertilizer
Inorganic fertilizer has immediate effects on crop production, therefore a good option for
improving soil fertility. Household use of inorganic fertilizers however is determined by their
capacity to meet the increasing inorganic fertilizer prices. Logistic regression show a number of
socio economic factors will significanlty affect household use of inorganic fertilizer. These
factors are inherited land, farmers growing vegetables and access to credit (Table 4).
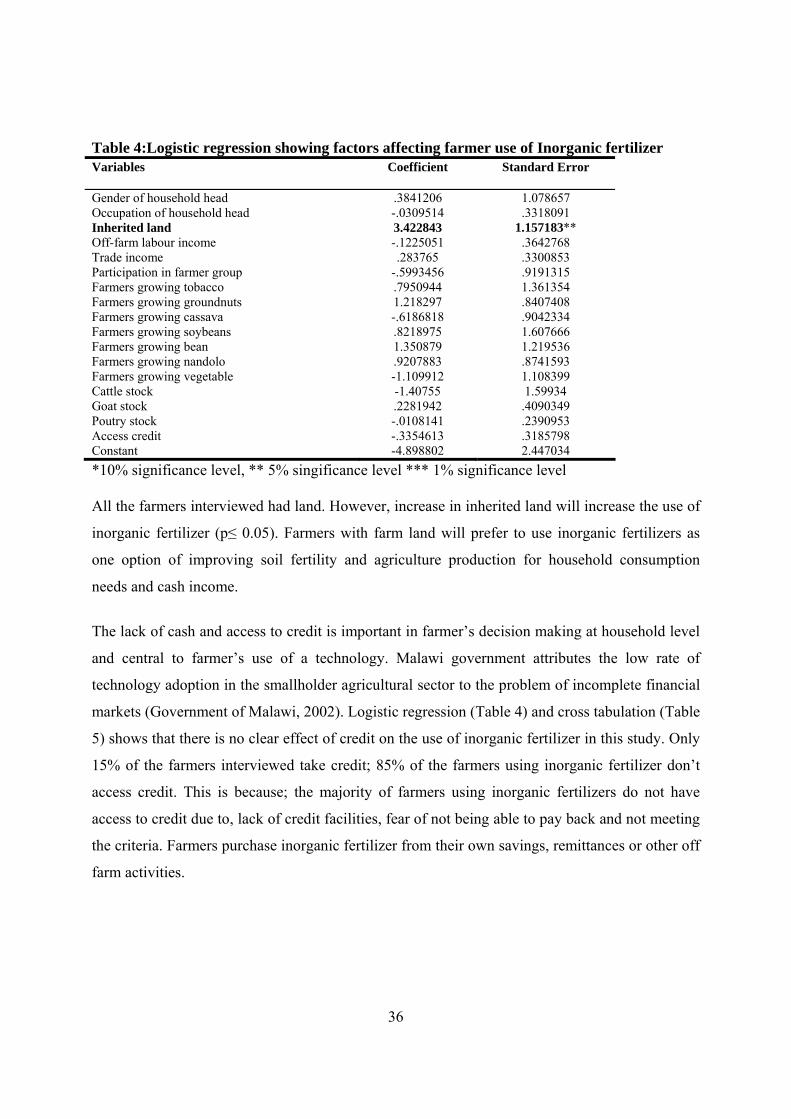
36
Table 4:Logistic regression showing factors affecting farmer use of Inorganic fertilizer Variables Coefficient Standard Error
Gender of household head .3841206 1.078657 Occupation of household head -.0309514 .3318091 Inherited land 3.422843 1.157183** Off-farm labour income -.1225051 .3642768 Trade income .283765 .3300853 Participation in farmer group -.5993456 .9191315 Farmers growing tobacco .7950944 1.361354 Farmers growing groundnuts 1.218297 .8407408 Farmers growing cassava -.6186818 .9042334 Farmers growing soybeans .8218975 1.607666 Farmers growing bean 1.350879 1.219536 Farmers growing nandolo .9207883 .8741593 Farmers growing vegetable -1.109912 1.108399 Cattle stock -1.40755 1.59934 Goat stock .2281942 .4090349 Poutry stock -.0108141 .2390953 Access credit -.3354613 .3185798 Constant -4.898802 2.447034 *10% significance level, ** 5% singificance level *** 1% significance level
All the farmers interviewed had land. However, increase in inherited land will increase the use of
inorganic fertilizer (p≤ 0.05). Farmers with farm land will prefer to use inorganic fertilizers as
one option of improving soil fertility and agriculture production for household consumption
needs and cash income.
The lack of cash and access to credit is important in farmer’s decision making at household level
and central to farmer’s use of a technology. Malawi government attributes the low rate of
technology adoption in the smallholder agricultural sector to the problem of incomplete financial
markets (Government of Malawi, 2002). Logistic regression (Table 4) and cross tabulation (Table
5) shows that there is no clear effect of credit on the use of inorganic fertilizer in this study. Only
15% of the farmers interviewed take credit; 85% of the farmers using inorganic fertilizer don’t
access credit. This is because; the majority of farmers using inorganic fertilizers do not have
access to credit due to, lack of credit facilities, fear of not being able to pay back and not meeting
the criteria. Farmers purchase inorganic fertilizer from their own savings, remittances or other off
farm activities.
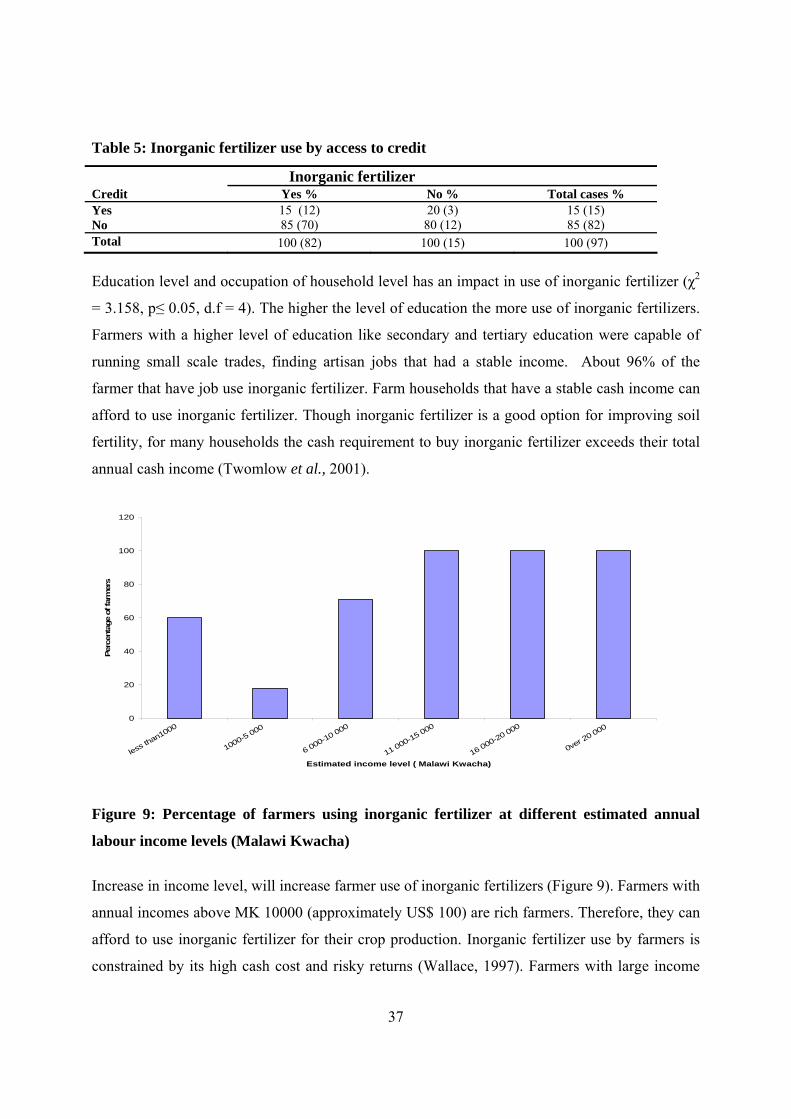
37
Table 5: Inorganic fertilizer use by access to credit
Inorganic fertilizer Credit Yes % No % Total cases % Yes 15 (12) 20 (3) 15 (15) No 85 (70) 80 (12) 85 (82) Total 100 (82) 100 (15) 100 (97)
Education level and occupation of household level has an impact in use of inorganic fertilizer (χ2
= 3.158, p≤ 0.05, d.f = 4). The higher the level of education the more use of inorganic fertilizers.
Farmers with a higher level of education like secondary and tertiary education were capable of
running small scale trades, finding artisan jobs that had a stable income. About 96% of the
farmer that have job use inorganic fertilizer. Farm households that have a stable cash income can
afford to use inorganic fertilizer. Though inorganic fertilizer is a good option for improving soil
fertility, for many households the cash requirement to buy inorganic fertilizer exceeds their total
annual cash income (Twomlow et al., 2001).
0
20
40
60
80
100
120
less than1000
1000-5 000
6 000-10 000
11 000-15 000
16 000-20 000
0ver 20 000
Estimated income level ( Malawi Kwacha)
Perc
enta
ge o
f far
mer
s
Figure 9: Percentage of farmers using inorganic fertilizer at different estimated annual
labour income levels (Malawi Kwacha)
Increase in income level, will increase farmer use of inorganic fertilizers (Figure 9). Farmers with
annual incomes above MK 10000 (approximately US$ 100) are rich farmers. Therefore, they can
afford to use inorganic fertilizer for their crop production. Inorganic fertilizer use by farmers is
constrained by its high cash cost and risky returns (Wallace, 1997). Farmers with large income
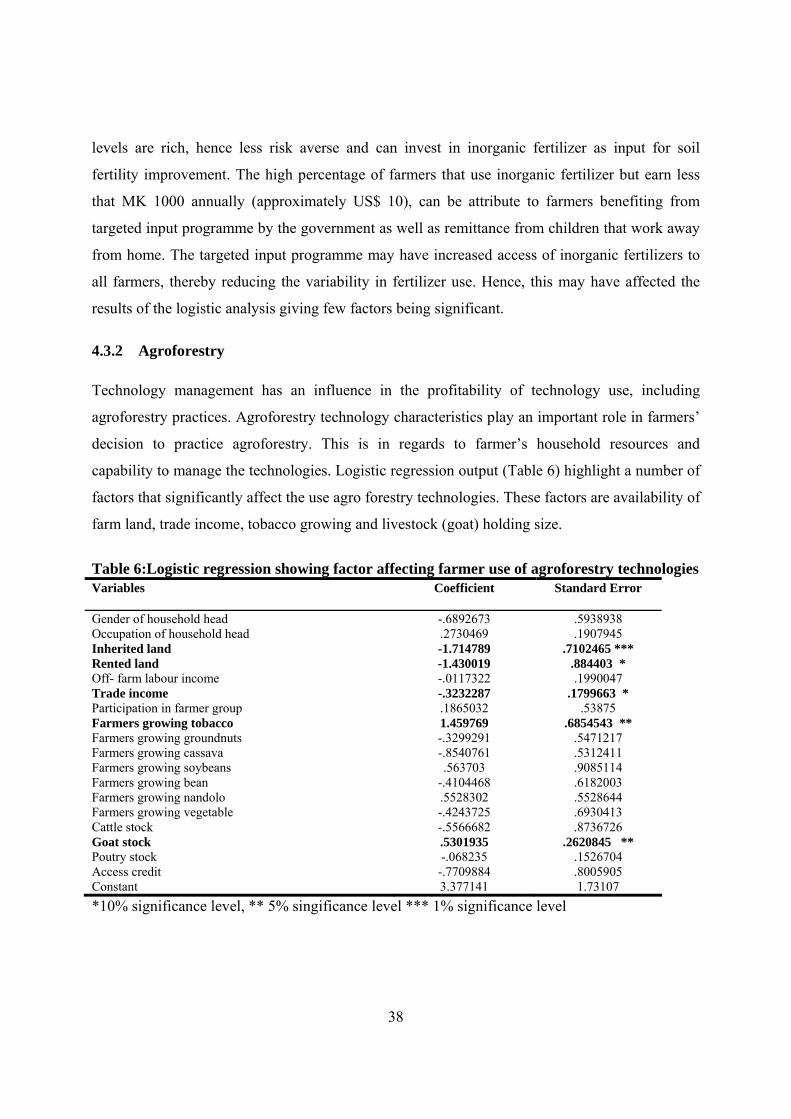
38
levels are rich, hence less risk averse and can invest in inorganic fertilizer as input for soil
fertility improvement. The high percentage of farmers that use inorganic fertilizer but earn less
that MK 1000 annually (approximately US$ 10), can be attribute to farmers benefiting from
targeted input programme by the government as well as remittance from children that work away
from home. The targeted input programme may have increased access of inorganic fertilizers to
all farmers, thereby reducing the variability in fertilizer use. Hence, this may have affected the
results of the logistic analysis giving few factors being significant.
4.3.2 Agroforestry Technology management has an influence in the profitability of technology use, including
agroforestry practices. Agroforestry technology characteristics play an important role in farmers’
decision to practice agroforestry. This is in regards to farmer’s household resources and
capability to manage the technologies. Logistic regression output (Table 6) highlight a number of
factors that significantly affect the use agro forestry technologies. These factors are availability of
farm land, trade income, tobacco growing and livestock (goat) holding size.
Table 6:Logistic regression showing factor affecting farmer use of agroforestry technologies Variables Coefficient Standard Error
Gender of household head -.6892673 .5938938 Occupation of household head .2730469 .1907945 Inherited land -1.714789 .7102465 *** Rented land -1.430019 .884403 * Off- farm labour income -.0117322 .1990047 Trade income -.3232287 .1799663 * Participation in farmer group .1865032 .53875 Farmers growing tobacco 1.459769 .6854543 ** Farmers growing groundnuts -.3299291 .5471217 Farmers growing cassava -.8540761 .5312411 Farmers growing soybeans .563703 .9085114 Farmers growing bean -.4104468 .6182003 Farmers growing nandolo .5528302 .5528644 Farmers growing vegetable -.4243725 .6930413 Cattle stock -.5566682 .8736726 Goat stock .5301935 .2620845 ** Poutry stock -.068235 .1526704 Access credit -.7709884 .8005905 Constant 3.377141 1.73107 *10% significance level, ** 5% singificance level *** 1% significance level
39
Increase in the number of farmers inheriting land will reduce the use of agroforestry technologies
(p≤ 0.01). Parents partition their land to give to their female children when they get married,
resulting is reduced land holding size. Since some agro forestry technologies require a substantial
amount of land, increase in number of farm families inheriting land reduces use of agroforestry
technologies in the area. A modeling study in Kasungu, Malawi, predicted that where sufficient
land is available, adoption of improved fallow technologies will occur (Thangata et al., 2001).
Therefore, agroforestry technologies that are promoted in an area should therefore take into
account the resource limited farm households as well as the land holding sizes in the area.
About 13% of the farmers rent land in order to increase operational land holding size and
increase crop yields. The maximum yield potential for using some agroforestry technologies
takes number of growing seasons. Maize yields in Gliricidia sepium plots during the first and
second year of establishment are similar to those from non-fertilized farmers’ plots (Ngugi,
2002). Since renting land is usually on annual basis, farmers will prefer to use alternative
technologies with immediate results on rented land to maximize profitability. Therefore, increase
in rented land will reduce the use of agroforestry technologies (p≤ 0.1). In Zambia, farmers who
did not plant improved fallow attributed their decision to labor constraints, lack of access to land
and unwillingness to wait for two years before realizing the benefits of the technology (Ajayi et
al., 2003).
Management practices for agroforestry technologies depend on labour availability for successful
use of agroforestry technologies in farming practices. In the study area, provision of labour
depends on household member, hence households involved in off farm trade for livelihood, may
be constrained in division of labour and time between off farm trade and farm activities.
Therefore, increase in trade income will reduce the use of agroforestry technologies (p≤ 0.1).
However, farmers with increased income from trade can afford to use inorganic fertilizers as an
option for soil fertility improvement.
Farmers that grow tobacco for cash income in the area, have access to information, capacity to
mobilize labour resources, relatively less risk averse and more innovative. Therefore, they will
practice agroforestry more than poor farmers. Hence, more farmers growing tobacco have
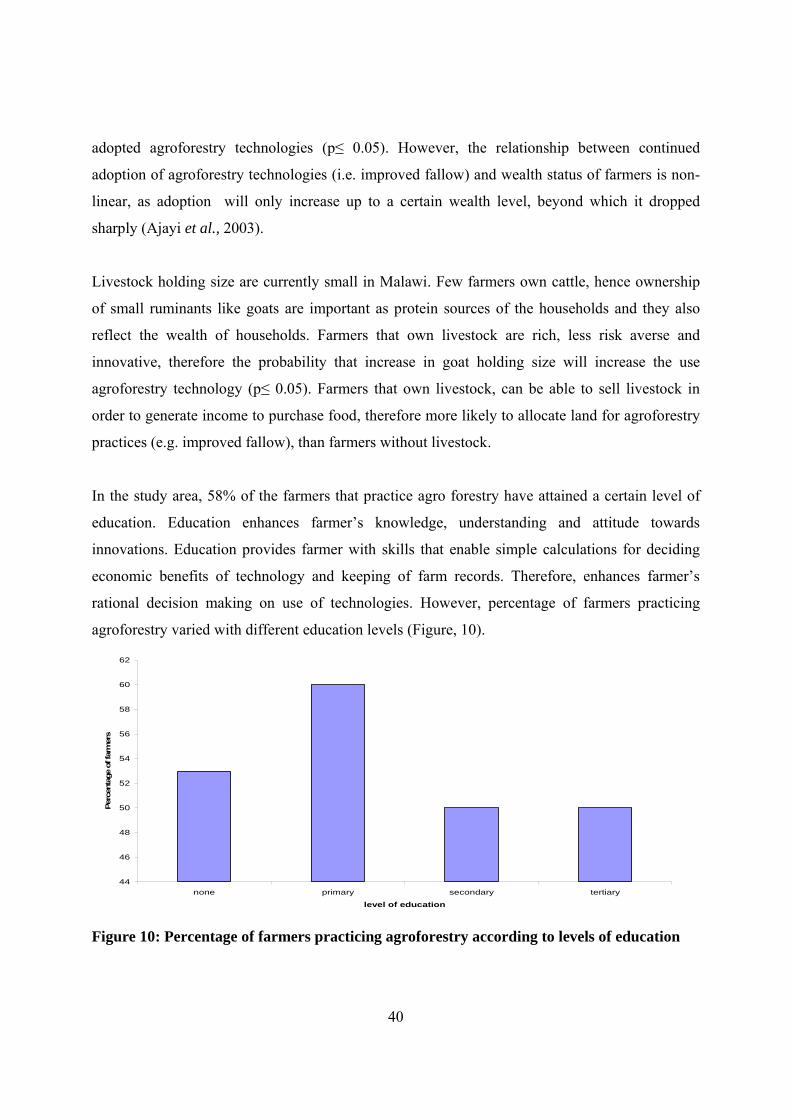
40
adopted agroforestry technologies (p≤ 0.05). However, the relationship between continued
adoption of agroforestry technologies (i.e. improved fallow) and wealth status of farmers is non-
linear, as adoption will only increase up to a certain wealth level, beyond which it dropped
sharply (Ajayi et al., 2003).
Livestock holding size are currently small in Malawi. Few farmers own cattle, hence ownership
of small ruminants like goats are important as protein sources of the households and they also
reflect the wealth of households. Farmers that own livestock are rich, less risk averse and
innovative, therefore the probability that increase in goat holding size will increase the use
agroforestry technology (p≤ 0.05). Farmers that own livestock, can be able to sell livestock in
order to generate income to purchase food, therefore more likely to allocate land for agroforestry
practices (e.g. improved fallow), than farmers without livestock.
In the study area, 58% of the farmers that practice agro forestry have attained a certain level of
education. Education enhances farmer’s knowledge, understanding and attitude towards
innovations. Education provides farmer with skills that enable simple calculations for deciding
economic benefits of technology and keeping of farm records. Therefore, enhances farmer’s
rational decision making on use of technologies. However, percentage of farmers practicing
agroforestry varied with different education levels (Figure, 10).
44
46
48
50
52
54
56
58
60
62
none primary secondary tertiary
level of education
Perc
enta
ge o
f far
mer
s
Figure 10: Percentage of farmers practicing agroforestry according to levels of education
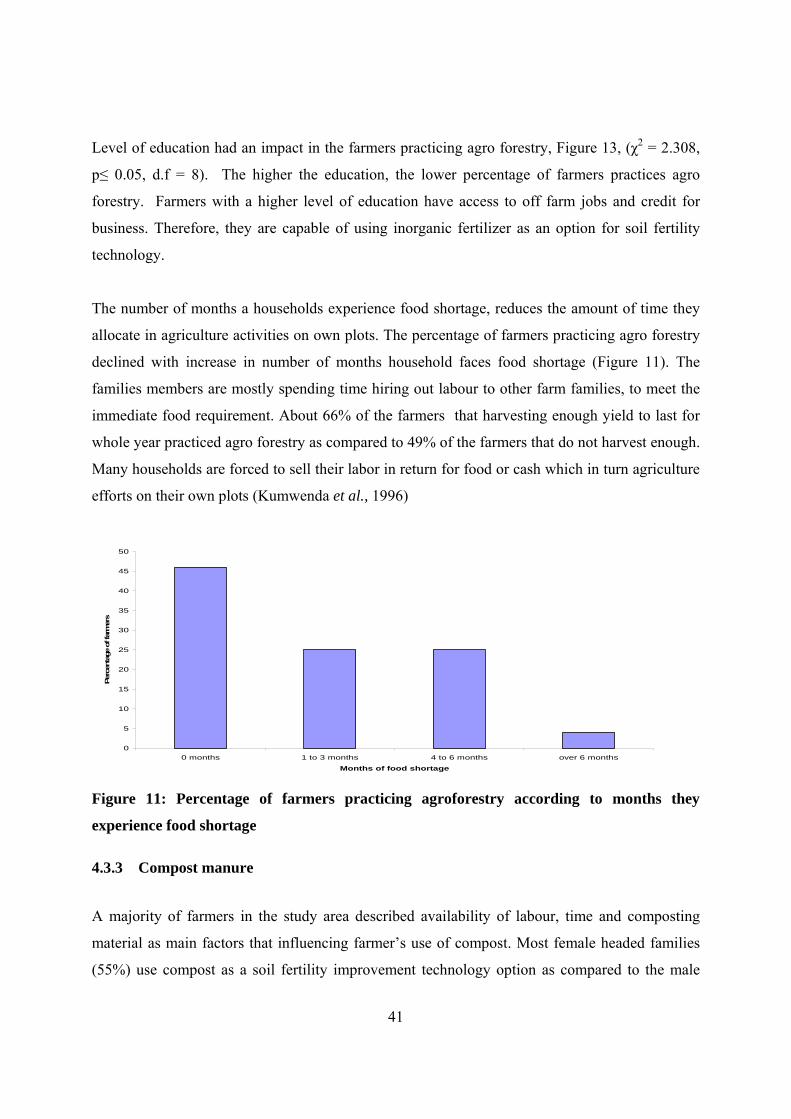
41
Level of education had an impact in the farmers practicing agro forestry, Figure 13, (χ2 = 2.308,
p≤ 0.05, d.f = 8). The higher the education, the lower percentage of farmers practices agro
forestry. Farmers with a higher level of education have access to off farm jobs and credit for
business. Therefore, they are capable of using inorganic fertilizer as an option for soil fertility
technology.
The number of months a households experience food shortage, reduces the amount of time they
allocate in agriculture activities on own plots. The percentage of farmers practicing agro forestry
declined with increase in number of months household faces food shortage (Figure 11). The
families members are mostly spending time hiring out labour to other farm families, to meet the
immediate food requirement. About 66% of the farmers that harvesting enough yield to last for
whole year practiced agro forestry as compared to 49% of the farmers that do not harvest enough.
Many households are forced to sell their labor in return for food or cash which in turn agriculture
efforts on their own plots (Kumwenda et al., 1996)
0
5
10
15
20
25
30
35
40
45
50
0 months 1 to 3 months 4 to 6 months over 6 months
Months of food shortage
Perc
enta
ge o
f far
mer
s
Figure 11: Percentage of farmers practicing agroforestry according to months they
experience food shortage
4.3.3 Compost manure
A majority of farmers in the study area described availability of labour, time and composting
material as main factors that influencing farmer’s use of compost. Most female headed families
(55%) use compost as a soil fertility improvement technology option as compared to the male
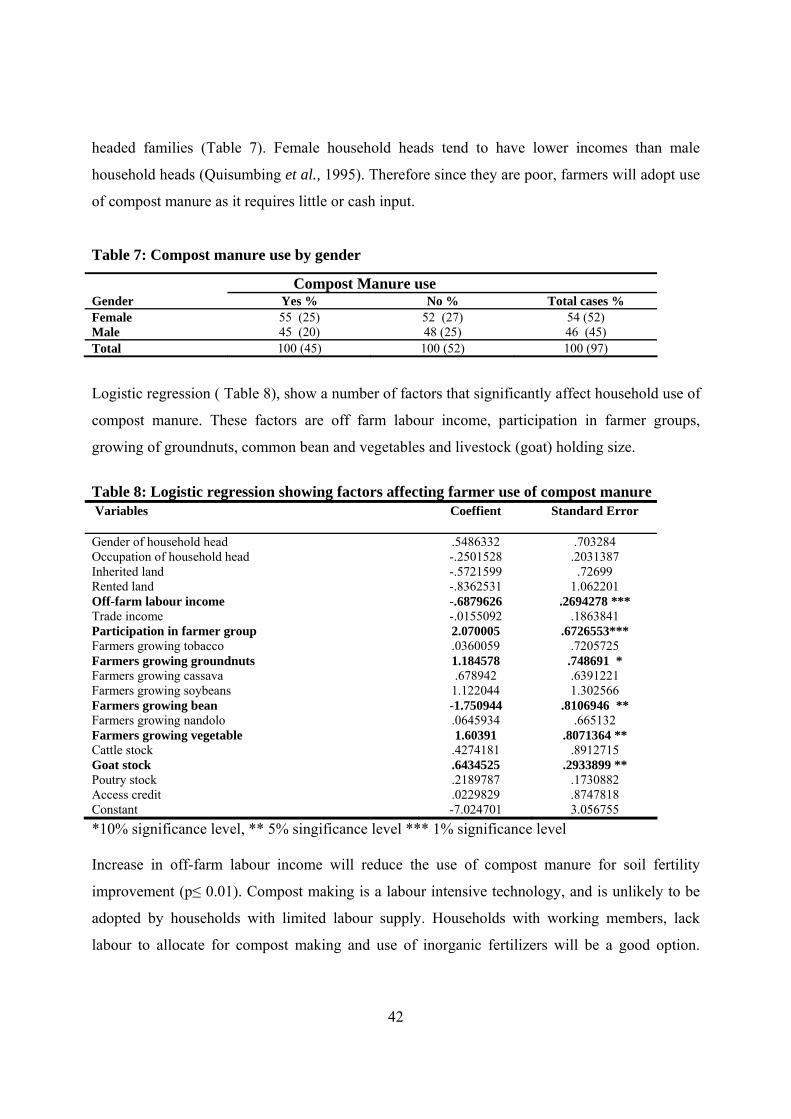
42
headed families (Table 7). Female household heads tend to have lower incomes than male
household heads (Quisumbing et al., 1995). Therefore since they are poor, farmers will adopt use
of compost manure as it requires little or cash input.
Table 7: Compost manure use by gender
Compost Manure use Gender Yes % No % Total cases % Female 55 (25) 52 (27) 54 (52) Male 45 (20) 48 (25) 46 (45) Total 100 (45) 100 (52) 100 (97)
Logistic regression ( Table 8), show a number of factors that significantly affect household use of
compost manure. These factors are off farm labour income, participation in farmer groups,
growing of groundnuts, common bean and vegetables and livestock (goat) holding size.
Table 8: Logistic regression showing factors affecting farmer use of compost manure Variables Coeffient Standard Error
Gender of household head .5486332 .703284 Occupation of household head -.2501528 .2031387 Inherited land -.5721599 .72699 Rented land -.8362531 1.062201 Off-farm labour income -.6879626 .2694278 *** Trade income -.0155092 .1863841 Participation in farmer group 2.070005 .6726553*** Farmers growing tobacco .0360059 .7205725 Farmers growing groundnuts 1.184578 .748691 * Farmers growing cassava .678942 .6391221 Farmers growing soybeans 1.122044 1.302566 Farmers growing bean -1.750944 .8106946 ** Farmers growing nandolo .0645934 .665132 Farmers growing vegetable 1.60391 .8071364 ** Cattle stock .4274181 .8912715 Goat stock .6434525 .2933899 ** Poutry stock .2189787 .1730882 Access credit .0229829 .8747818 Constant -7.024701 3.056755 *10% significance level, ** 5% singificance level *** 1% significance level Increase in off-farm labour income will reduce the use of compost manure for soil fertility
improvement (p≤ 0.01). Compost making is a labour intensive technology, and is unlikely to be
adopted by households with limited labour supply. Households with working members, lack
labour to allocate for compost making and use of inorganic fertilizers will be a good option.
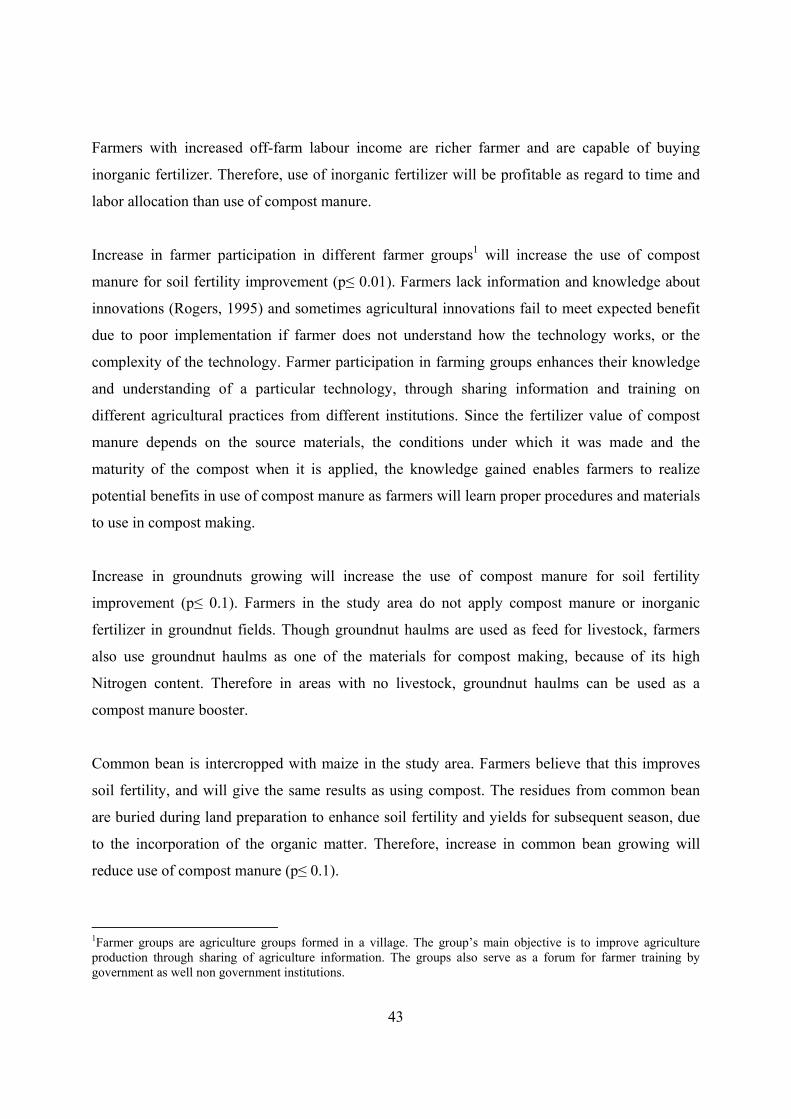
43
Farmers with increased off-farm labour income are richer farmer and are capable of buying
inorganic fertilizer. Therefore, use of inorganic fertilizer will be profitable as regard to time and
labor allocation than use of compost manure.
Increase in farmer participation in different farmer groups1 will increase the use of compost
manure for soil fertility improvement (p≤ 0.01). Farmers lack information and knowledge about
innovations (Rogers, 1995) and sometimes agricultural innovations fail to meet expected benefit
due to poor implementation if farmer does not understand how the technology works, or the
complexity of the technology. Farmer participation in farming groups enhances their knowledge
and understanding of a particular technology, through sharing information and training on
different agricultural practices from different institutions. Since the fertilizer value of compost
manure depends on the source materials, the conditions under which it was made and the
maturity of the compost when it is applied, the knowledge gained enables farmers to realize
potential benefits in use of compost manure as farmers will learn proper procedures and materials
to use in compost making.
Increase in groundnuts growing will increase the use of compost manure for soil fertility
improvement (p≤ 0.1). Farmers in the study area do not apply compost manure or inorganic
fertilizer in groundnut fields. Though groundnut haulms are used as feed for livestock, farmers
also use groundnut haulms as one of the materials for compost making, because of its high
Nitrogen content. Therefore in areas with no livestock, groundnut haulms can be used as a
compost manure booster.
Common bean is intercropped with maize in the study area. Farmers believe that this improves
soil fertility, and will give the same results as using compost. The residues from common bean
are buried during land preparation to enhance soil fertility and yields for subsequent season, due
to the incorporation of the organic matter. Therefore, increase in common bean growing will
reduce use of compost manure (p≤ 0.1).
1Farmer groups are agriculture groups formed in a village. The group’s main objective is to improve agriculture production through sharing of agriculture information. The groups also serve as a forum for farmer training by government as well non government institutions.
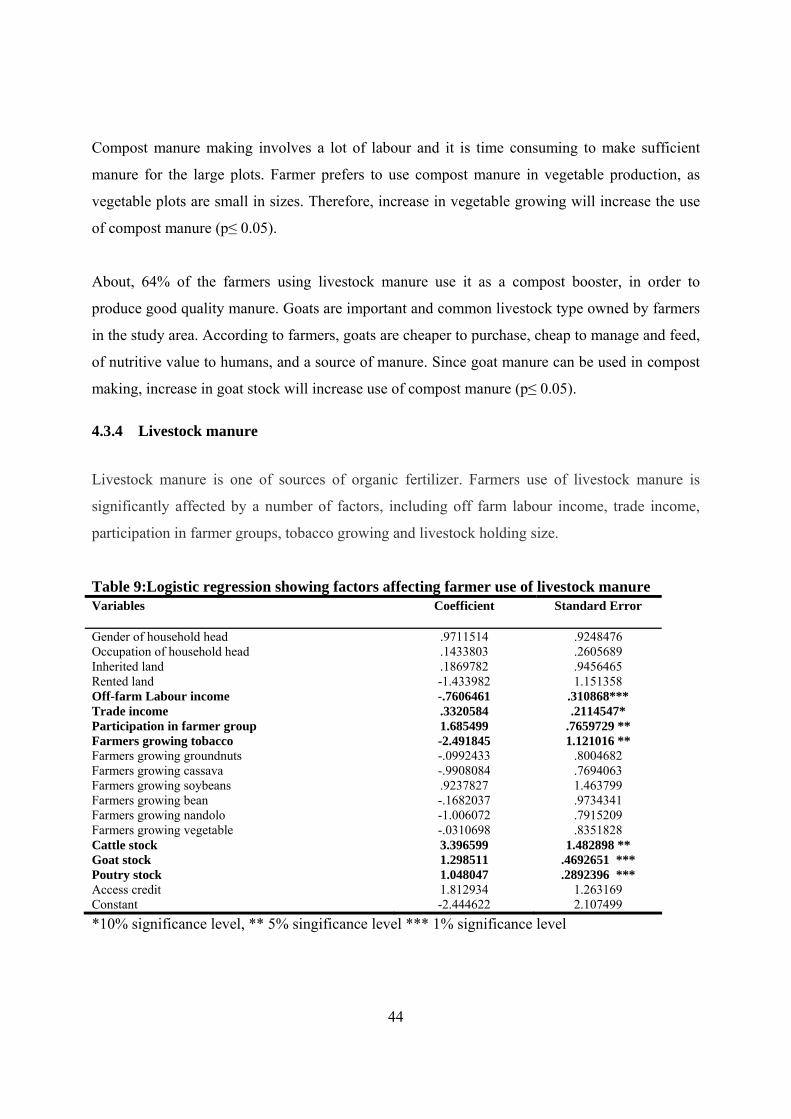
44
Compost manure making involves a lot of labour and it is time consuming to make sufficient
manure for the large plots. Farmer prefers to use compost manure in vegetable production, as
vegetable plots are small in sizes. Therefore, increase in vegetable growing will increase the use
of compost manure (p≤ 0.05).
About, 64% of the farmers using livestock manure use it as a compost booster, in order to
produce good quality manure. Goats are important and common livestock type owned by farmers
in the study area. According to farmers, goats are cheaper to purchase, cheap to manage and feed,
of nutritive value to humans, and a source of manure. Since goat manure can be used in compost
making, increase in goat stock will increase use of compost manure (p≤ 0.05).
4.3.4 Livestock manure
Livestock manure is one of sources of organic fertilizer. Farmers use of livestock manure is
significantly affected by a number of factors, including off farm labour income, trade income,
participation in farmer groups, tobacco growing and livestock holding size.
Table 9:Logistic regression showing factors affecting farmer use of livestock manure Variables Coefficient Standard Error
Gender of household head .9711514 .9248476 Occupation of household head .1433803 .2605689 Inherited land .1869782 .9456465 Rented land -1.433982 1.151358 Off-farm Labour income -.7606461 .310868*** Trade income .3320584 .2114547* Participation in farmer group 1.685499 .7659729 ** Farmers growing tobacco -2.491845 1.121016 ** Farmers growing groundnuts -.0992433 .8004682 Farmers growing cassava -.9908084 .7694063 Farmers growing soybeans .9237827 1.463799 Farmers growing bean -.1682037 .9734341 Farmers growing nandolo -1.006072 .7915209 Farmers growing vegetable -.0310698 .8351828 Cattle stock 3.396599 1.482898 ** Goat stock 1.298511 .4692651 *** Poutry stock 1.048047 .2892396 *** Access credit 1.812934 1.263169 Constant -2.444622 2.107499 *10% significance level, ** 5% singificance level *** 1% significance level
45
Increase in off-farm labour income will reduce the use of livestock manure for soil fertility
improvement (p≤ 0.01). Farmers will use technologies according to their resource. Farmers with
increased off-farm labour income have the ability to buy inorganic fertilizers, hence capable of
using inorganic fertilizers for soil fertility improvement. Households will use a particular soil
fertility technology depending on household cash inflow and resource availability.
Increase in trade income will increase use of livestock manure (p≤ 0.1). Farmers grow vegetables
for both household cash income and most of the farmers involved in trade, sell their vegetable.
Vegetable plots are small and where labour is available and livestock manure can be collected, it
makes sense to invest in production of vegetables (Scoones and Toulmin, 1999). Livestock
manure is cheaper as it does not involve cash input, hence farmers will opt to use livestock
manure for vegetable plot, in order to reduce costs and maximize benefits.
Farmer participation in different farmer groups will increase the use of livestock manure for soil
fertility improvement (p≤ 0.1). Farmers participating in farmer groups, share information and
obtain agriculture training from different institutions. Farmer participation in farming groups
enhances their knowledge and understanding of a particular technology. This helps farmers to use
a technology properly; enabling farmers to realize the desired benefit of using the technology.
Therefore, increased farmer participation in farmer groups may lead to increased use of livestock
manure.
Increase in tobacco growing will reduce use of livestock manure (p≤ 0.05). Farmers that grow
tobacco for cash income are relatively rich farmers, and have access to inorganic fertilizer on
credit from agro-dealer. Therefore, use of inorganic fertilizer will be a more profitable option for
soil fertility improvement as regard to labor allocation and time required for collection and
application of livestock manure.
In the study area, use of livestock manure is limited by the small livestock holdings. Since the use
of livestock manure depends on availability of livestock, increase in cattle, and goats as well as
poultry holding size will increase use of livestock manure (p≤ 0.05) and (p≤0.01), respectively.
Farmers regard goats and poultry keeping is a cheap and easy to manage, therefore farmers prefer
to keep goat and poultry as compared to cattle.
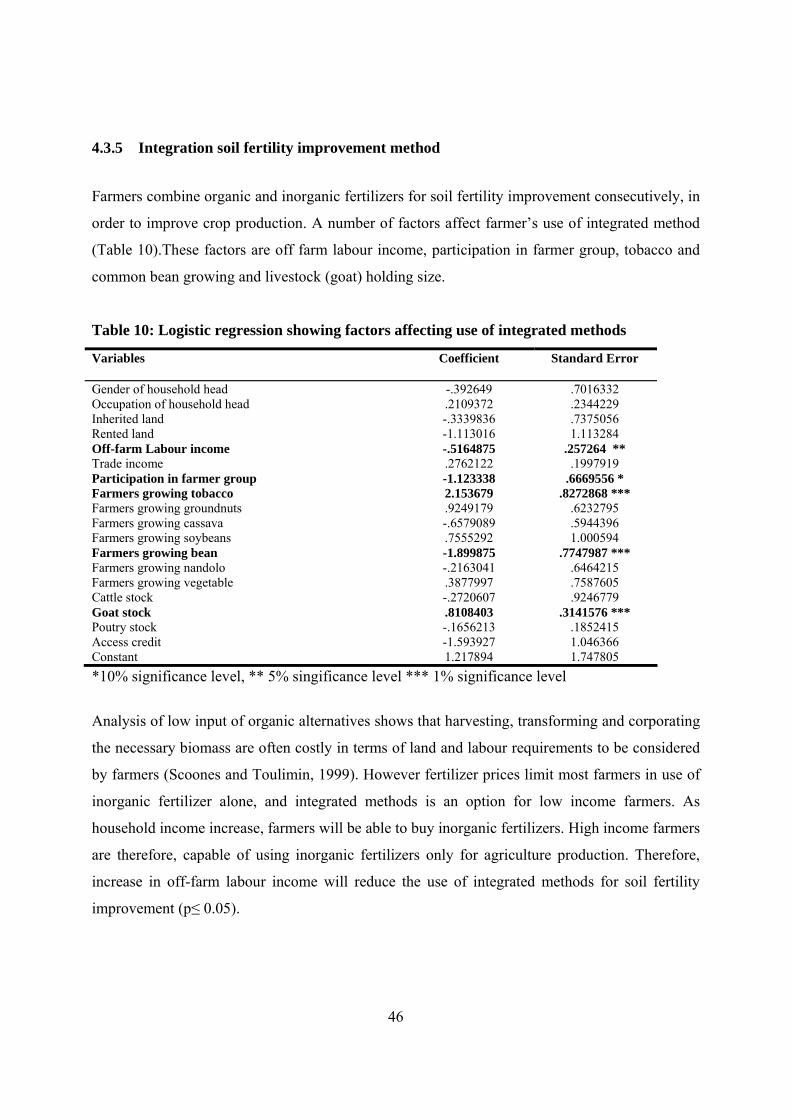
46
4.3.5 Integration soil fertility improvement method
Farmers combine organic and inorganic fertilizers for soil fertility improvement consecutively, in
order to improve crop production. A number of factors affect farmer’s use of integrated method
(Table 10).These factors are off farm labour income, participation in farmer group, tobacco and
common bean growing and livestock (goat) holding size.
Table 10: Logistic regression showing factors affecting use of integrated methods
Variables Coefficient Standard Error
Gender of household head -.392649 .7016332 Occupation of household head .2109372 .2344229 Inherited land -.3339836 .7375056 Rented land -1.113016 1.113284 Off-farm Labour income -.5164875 .257264 ** Trade income .2762122 .1997919 Participation in farmer group -1.123338 .6669556 * Farmers growing tobacco 2.153679 .8272868 *** Farmers growing groundnuts .9249179 .6232795 Farmers growing cassava -.6579089 .5944396 Farmers growing soybeans .7555292 1.000594 Farmers growing bean -1.899875 .7747987 *** Farmers growing nandolo -.2163041 .6464215 Farmers growing vegetable .3877997 .7587605 Cattle stock -.2720607 .9246779 Goat stock .8108403 .3141576 *** Poutry stock -.1656213 .1852415 Access credit -1.593927 1.046366 Constant 1.217894 1.747805 *10% significance level, ** 5% singificance level *** 1% significance level
Analysis of low input of organic alternatives shows that harvesting, transforming and corporating
the necessary biomass are often costly in terms of land and labour requirements to be considered
by farmers (Scoones and Toulimin, 1999). However fertilizer prices limit most farmers in use of
inorganic fertilizer alone, and integrated methods is an option for low income farmers. As
household income increase, farmers will be able to buy inorganic fertilizers. High income farmers
are therefore, capable of using inorganic fertilizers only for agriculture production. Therefore,
increase in off-farm labour income will reduce the use of integrated methods for soil fertility
improvement (p≤ 0.05).
47
Increasing in tobacco growing will increase use of integrated soil fertility methods (p≤ 0.05).
Integrated soil fertility methods require attention to timing and placing of inputs so that
synchrony between nutrient release and plant uptake is enhance (Myers et al., 1994). Few studies
have been done on the recommended combination of organic and inorganic fertilizers hence still
under research. According to farmers, integrated soil fertility improvement method is one of the
alternatives for improving soil fertility that farmers are experimenting. Soil management
technologies require a substantial farmer investment in form of land, labour or cash, which can be
a barrier to local experimentation (Twomlow et al., 2001). Wealthier farmers have access to
resource and may be able to assume risks; therefore they are more likely to experiment using
integrated methods for crop production than poor farmers. Since farmers that grow tobacco for
cash income are relatively rich farmers, they will be able to practice integrated methods for soil
fertility in non cash crops fields.
Increase in growing of common bean will reduce use of integrated soil fertility methods (p≤
0.05). Common bean is intercropped with maize in the study area, farmers believe that this
improves soil fertility, and will yield to the same results as organic fertilizer. Farmers perceive
application of organic manure to a maize-common beans plot as a duplication of efforts and not
effective in terms of labour input, therefore no incentive for farmers to use organic fertilizer on
maize-common bean plots. Farmers perceive maize-common bean intercropping as one form of
integrated soil fertility methods. This may contribute to the low use of integrated soil fertility
methods2, with increase in farmers growing of common bean.
Increase in goats holding size will increase use of integrated soil fertility methods (p≤ 0.01).
Livestock manure is one of sources of organic fertilizer. The organic material from livestock
improves soil structure and soils ability to hold nutrients leading to improved soil productivity.
Therefore, farmers prefer to integrate the use of livestock manure with inorganic fertilizer.
Farmers apply livestock manure as a basal dressing at each planting pocket and later apply
inorganic fertilizers as a top dressed. Goat is the common livestock type in the area, therefore the
increase in goat, holding size will have a positive effect on farmer use of integrated soil fertility
methods.
2 Integrated methods in the study did not consider intercropping as one way of integration.
48
Increasing farmer participation in groups will reduce use farmer use of integrated soil fertility
method (p≤0.05). Farmer groups have specific objective. Farmers that participate in farmer
groups obtain training on use of specific technologies in order to realize potential benefits from
the technology. Integrated methods for soil fertility improvement are still under experimentation.
Therefore, farmer trainers have little knowledge on use of integrated methods and do not
recommend integrated methods to farmers. Farmers participating in farmer groups have specific
knowledge on use of a specific technology. For maximum benefits, farmers participating in
farmer groups will tend to use one specific technology rather than combining different
technologies.
4.4 Access to technical support
Agricultural extension and research are part of the policy instruments that the Government of
Malawi uses to achieve its agricultural goals. Farmers get agriculture information from
agricultural research and extension service, NGO’s and friends. About 58% get information from
agricultural extension staff, 20% from agriculture researchers. Promoting use and adoption of
agriculture technologies, including soil fertility improvement technologies, among local farmers
therefore, largely depends on the public agricultural extension service. Farmers described the role
of extension services to be; sensitizing, training and monitoring farmers on agricultural practices.
Farmers believe that extension system can help improve productivity, through provision of
knowledge and timely transfer of agriculture information. Knowledge will enhance farmers
understanding of technology and change it attitude towards an innovation, hence farmers can
exploit the potential benefits in using the technology. However farmers expressed inadequate
visits by extension officers in the area. This is attributed to the shortage of extension service staff
in the Ministry of agriculture (Malawi Government, 2002).

49
5 CONCLUSION
Farmers described the soil fertility as low compared to 20 years ago. Farmers attributed these
change to a number of factor including increase in population, small land holding sizes,
continuous cultivation and increase in price of inorganic fertilizer. Farmers stated that soil
fertility level as low and that soil fertility level will continue to decline. Farmers are willing to
invest in soil fertility improvement technologies, in order to improve agriculture production.
Farmers have adapted a range of soil fertility improvement technologies to improve soil fertility.
These include inorganic fertilizer, agroforestry, compost manure, livestock manure and integrated
methods. Inorganic fertilizers are used by a majority of the farmers, because inorganic fertilizers
have immediate result on crop yield. High prices are a major constraint in using inorganic
fertilizers. Use of livestock manure for soil fertility improvement is limited by the small livestock
holding sizes in the study area. Livestock manure is mostly used around homestead and dimbas
(vegetable gardens). Use of compost manure for soil fertility improvement, is affordable and easy
to make. However, compost is bulky, labour intensive. Therefore, it is difficult to produce
enough for big plots and transport it to distant plot.
Agroforestry is also practiced for soil fertility by farmers in study area. The main constraints for
practicing agroforestry are high labour demand, lack of technical and the long lag period before
the benefits become tangible. Glicidia sepium is used by a majority practicing agroforestry. The
majority of farmers have not been able to expand use of agroforestry to other parts of farm plot.
Most farmers still maintain 0.1 acre plot. Farmers use organic and inorganic fertilizers in
combination (integrated methods). Farmers integrate methods in order to supplement on the
available inorganic fertilizer, improve crop yields, and reduce fertilizer costs.
The choice of technologies depended on crop type. Cash earning crops and maize cultivating,
farmers are willing to use inorganic fertilizer. Inorganic fertilizer ranked as the preferred option
across positions of the landscapes. Farmers will prefer to use organic fertilizers in lower areas.
However, farmers still practice the agroforestry in upland, for soil fertility improvement and soil
conservation.
50
Use of different soil fertility improvement technologies is affected by different factors. Use of
inorganic fertilizers was determined by households’ capacity to meet the cost. Ownership of land
and high levels of household income will increase use of organic fertilizer, and vegetable
growing will reduce use of inorganic fertilizer.
Household’s use of agroforestry was affected by household ability to plant and manage tree
species. Size of available land holding was found to be associated with the establishment of
agroforestry. Increase it trade income reduced use of agroforestry technologies. The majority of
farmers practicing agroforestry have obtained primary education. However, percentage of
farmers practicing agroforestry declined with increase in level of education. The percentage of
farmers practicing agroforestry also declined with increase in number of months household faces
food shortage. These farmers are engaged in off farm activities in order to meet the immediate
consumption need.
Farmer’s use of compost manure was affected by labour availability, time and availability of
composting material. More female headed families use compost manure than male headed
families. Increase in vegetable growing will increase use of compost manure. Farmer
participation in different farmer groups and increase in household labour income will increase use
of compost and livestock manure. Increase in livestock holding size will increase use of livestock
manure. A number of factors affect farmer’s use of integrated method. Though rich farmers are
more willing to experiment with integrated methods, increased household income level will
reduce the use of integrated methods for soil fertility improvement. Common bean intercropping
with maize in the study area is one form integrated method for soil fertility improvement. The use
of one soil fertility method does not exclude the use of the other.
The technology characteristic, feasibility, profitability, acceptability will influence farmers choice
for different soil fertility improvement technologies. Household characteristics vary in a
community hence; different households adopt different soil fertility improvement technologies
depending on the household capacity to manage the technology. Household cash income, land
and labour availability dominates decision making on use and adoption of different soil fertility
improvement technologies at household level.
51
6 REFERENCE
Adesina, A.A., and Baidu- Ferson, J., (1995). Farmers Perception and Adoption of New Agricultural
Technology: Evidence from Analysis of Bukina Faso and Guinea, West Africa, Agriculture
Economics, 13.
Ajayi, O.C., Franzel, S., Kuntashula, E. and Kwesiga, F., (2003). Adoption of Improved Fallow
Technology for Soil Fertility Management in Zambia: Empirical Studies And Emerging Issues.
Agroforestry Systems 59: 317–326.
Akinnifesi, F., DeWolf, J., and Matakala, P., (2005). On farm Assessment of Agroforestry
Technologies for Soil Fertility Replenishment in Malawi. ICRAF, Malawi.
Akinnifesi, F., and Kwesinga, F., (2002). Can Agroforestry Make a Difference as an existing
Strategy for the Starter Pack Scheme in Malawi? Malawi Journal of Agricultural Science.
Ban, A., and Hawkins, H., (1988). Agriculture Extension. Longman scientific and technical, New
York.
Bekele, W. (2003) Economics of Soil and Water Conservation: Theory and Empirical Application to
Subsistence Farming in the Eastern Ethiopian Highlands. Doctoral thesis,Dept. of Economics,
Acta Universitatis agriculturae Sueciae. Agraria vol. 411.
(diss-epsilon.slu.se/archive/00000362/ )
Bekunda, M.A., Bationo, A., and Ssali, H., (1997). Soil Fertility Management in Africa: A Review
of Selected Research Trials. In: Buresh R.J., Sanchez P.A. and Calhoun F. (eds.), Replenishing
Soil Fertility in Africa. Soil Science Society of America, Madison, Wisconsin, USA, pp. 63–79.
Bunderson, W.T., and Hayes, I.M., (1995). Agricultural and Environmental Sustainability In
Malawi. Paper presented at the Conference on Sustainable Agriculture for Africa, Cote d'Ivoire.
July, 1995.
Böhringer, A. (2001). Facilitating the Wider Use of Agroforestry for Development in Southern
Africa. Development in Practice.
Canadian Organic Growers (1992) www.eap.mcgill.ca/MagRack/ 3.03.06)
Carra, S.J. (1997). A Green Revolution Frustrated lessons from Malawi Experience. A Paper
Presented at the First All Africa Crop Science Congress Held in Pretoria South Africa. January
1997.
52
Chambers, R., Pacey, A., and Thrupp, L., (1989). Farmers first. Farmers Innovation and Agricultural
research. Intermediate Technology Publications, London.
CTA/MAFE, (2002). Agroforestry in Malawi and Zambia: Summary Report of CTA/MAFE study
visit. Technical Centre for Agriculture and Rural development, The Netherlands.
Department of Land Resources Conservation, (2004). Annual Progress Report, Ministry of
Agriculture, Malawi government.
DREA (1994). National Action Plan. Department of Research and Environmental Affairs Volume 1:
The Action Plan. Lilongwe.
Donova, W.G. (1996). The Role of Inputs and Marketing Systems in the Modernization of
Agriculture. Breth, S. A (eds) Achieving Greater Impact Research Investments in Africa..
Environmental Affairs Department, (2002). State of Environment Report. Ministry of Mines,
Natural Resources and Environment, Environmental Affairs Department.
www.malawi.gov.mw/mines/ environAffairs
Economist Intelligence Unit (2004). Country Profile.
FAOSTAT Agriculture Database, 2005. www.faostat.fao.org/faostat/collection, 2006.
Franzel, S. (1999). Socioeconomic factors affecting the adoption potential of improved tree fallows
in Africa. Agroforestry Systems 47: 305–321, 1999.
Gruhn, P., Francesco Goletit, F., and Yudelman, M. (2000) Integrated Nutrient Management, Soil
Fertility, and Sustainable Agriculture: Current Issues and Future Challenges. Food, Agriculture,
and the Environment Discussion Paper 32. International Food Policy. September 2000.
ICRAF. (2006). (www.worldagroforestry.org, 26.02.06).
ICRAF. (1998). Building on a Solid Foundation: Achievements, Opportunities and Impact. ICRAF,
Nairobi, Kenya.
Ikerra1, S.T., Maghembe, J.A., Smithson, P.C., and Buresh, R. J., (1999). Soil Nitrogen Dynamics
and Relationships with Maize Yields in A Gliricidia–Maize Intercrop In Malawi. Plant and Soil
211: 155–164.
Kamanga, B.C.G. (2002). Understanding Farmer’s Agricultural Environment in Malawi. Risk
Management Project Working Paper 02-01. CIMMYT-Malawi.
Kamanga, B.C.G., Shumuradyarira, Z., and Waddington, S. (2001). On/farm Comparison of
Fertilizer Application Practices to Assess Nitrogen Use Efficiency with Maize in Zimuto
Communal Area, Zimbabwe. Risk Management Project, CIMMTY Natural Resources Group,
53
Harare Zimbabwe. Seventh Eastern and Southern Africa Regional Conference. February, 2001.,
pp 519-529.
Kamanga, B.C.G., Kanyama-Phiri, G.Y., and Minae, S. (1999). Intercropping Perennial Legumes
for Green Manure Additions to Maize In Southern Malawi African Crop Science Journal, pp.
355-363.
Kanyama-Phiri, G.Y., Snapp, S.S., Kamanga, B. and Wellard, K. (2000). Towards Integrated Soil
Fertility Management in Malawi: Incorporating participatory approaches in agricultural research.
Managing Africa’s Soils No. 11. IIED, UK. 27
Kherallah, M. and Govindan, K. (1997). The Sequencing of Agricultural Market Reforms in
Malawi. Market and Structural Studies Division International Food Policy Research Institute,
MSSD Discussion Paper No. 13. 1997.
Kwesiga, F., Akinnifesi, F.K., Mafongoya, P.L., McDermott, M.H. and Agumya, A. (2003).
Agroforestry Research and Development in Southern Africa During The 1990s: Review and
Challenges Ahead. Agroforestry Systems 59: 173–186, 2003.
Kwesiga, F., Franzel. S., Place, F., Phiri, D., and Simwanza, C.P. (1999). Sesbania Sesban Improved
Fallows in Eastern Zambia: The inception, development and farmer Enthusiasm. Agroforestry
Systems 47: 49–66, 2003
Kumwenda, J.D.T., Waddington, S.R., Snapp, S.S., Jones, R.B., and Blackie, M.J., (1996). Soil
Fertility Management Research for the Maize Cropping Systems of Smallholders in Southern
Africa: A Review. NRG Paper 96-02. Mexico, D.F.: CIMMYT.
Makumba, W.(2003). Nitrogen use Efficiency and Carbon Sequestration in Legume Tree- based
Agroforestry system: A case study of Malawi. Ph. D Thesis Wageningen University and
Research Center, Wegeningen, The Netherlands. 2003.
Malawi Government, (2002), Malawi Poverty Reduction Strategy paper. Final Draft. Lilongwe,
Malawi.
Malawi Government, (1994), National Environmental Action Plan (vol, 2). Lilongwe, Malawi
Ministry of Forestry, Fisheries and Environmental Affairs, (1998). State of Environment Report.
Lilongwe, Malawi.
Ministry of Agriculture Irrigation and Livestock Development (1996). Guide to Agricultural
Production. Lilongwe, Malawi.
54
Murwira, H.K. (1994) Synchrony relationships of nitrogen release and plant uptake in a
Zimbabwean sandy soil amended with manure and fertilizer. African Crop Sci J 2: 69–77.
Myres, R.J.K., Palm, C.A., Cuevas, E., Gunatilleke, I., and Brossard, M.(1994). The
Synchronization of Nutrient Mineralization and Plant Nutrient Demand, In Woomer, P.L and
Swift, M.J.(Eds). The Biological Management of Tropical Soil Fertility. Wiley, Chichester.
Mafongoya, P.L., Katanga, R., Mkonda, A., Kuntashula, E. and Chirwa, T. 2001. ICRAF-Zambia
Agroforestry Project: Progress Report to Sida, January-December, 2000. ICRAF, Nairobi,
Kenya.
Nakhumwa, T.O. (2004). Dynamic Costs of Soil Degradation and Determinants of Adoption of Soil
Conservation Technologies by Smallholder Farmers in Malawi. Doctoral Thesis. University of
Pretoria, South Africa.
Negatu and Parikh,(1999). The impact of perception and other factors on the Adoption of
Agricultural Technology in the Moret and Jiru Woreda (district) Of Ethiopian. Ethiopia
Phiri A.D.K, Kanyama- Phiri, G.Y. and Snapps, S. (1999) Maize and sesbania production in relay
cropping at three landscape positions in Malawi . Agroforestry Systems 47: 153–162.
Reij, C. and Waters-Bayer, A. (2001). Farmers innovation in Africa. A source of Inspiration for
Agricultural development. Earth scan Publication Ltd, Sterling, VA, U.K.
Quisumbing, A.R., Brown, L.R., Feldstein, H.S., Haddad, L and Pena, C. (1995). Women: The Key
to Food Security. Food Policy Report. International Food Policy Research Institute, Washington
DC.
Rogers, E. (1995). Diffusion of innovations. Free press, New York.
Saka, A.R., Kumwenda, J.D., Phombeya, H.S.K., Itimu, O.A., Allison, A.G., Kamangira J.B., and
Bunderson, W.T. (1998). Integrating Pigeon peas into Smallholder Farming Systems to Improve
Soil fertility and Crop Yields in Malawi. A Paper Presented at the Soils and Agricultural
engineering Commodity Group Meeting. August 1998. Malawi.
Sanchez, P.A., Soule, S.M., Place, F.M., Buresh, R.J., Izac, A.N., Mokwunye, A.U., Kwesinga, F.
K., Ndiritu, C.G and Woomer, P.L. (1997). Soil Fertility Replenishment in Africa: An Investment
in Natural Resource Capital. Special Publication, No. 51.
Scoones, I and Thompson, J. (1994). Beyond Farmers First. Rural People’s knowledge, Agricultural
Research and Extension Practice. Intermediate Technology Publications. London.
55
Scoones, I. and Toulmin, C. (1999). Policies for Soil Fertility Management in Africa. A report for
the Department for International Development.
Sahn, D., Arulpragasam, J. and Merid, L. (1990). Policy Reform and Poverty in Malawi. A Survey
of a Decade of Experience. Cornell Food and Nutritional Policy Program. New York.
Swinkles, R. and Franzel, S. (1997). Adoption Potential of Hedgerow Intercropping In Maize-Based
Cropping Systems In The Highlands Of Western Kenya. Economic and Farmers' Evaluation.
Cambridge University Press, Expl Agric. pp. 211±22.3 IN
Thangata, P.H., Hildebrand, P.E. and Gladwin, C.H. (2001). Modeling Agro forestry adoption and
Household Decision making in Malawi. African Studies Quarterly. On line journal for African
studies.
Twomlow, S.J. and Rusike, J. and Snapp, S. (2001). Biophysical or Economic Performance- Which
Reflects Choice of Legumes ‘Best Bets’ in Malawi. Seventh Eastern and Southern Africa
Regional conference. Feb 2001, pp519-529.
Vanclay, F. and Lawrence, G. (1994) Farmer Rationality and the Adoption of environmentally
Sound Practices; A Critique of the Assumptions of Traditional Agricultural Extension. European
Journal of Agricultural Education and Extension, 1994 - bib.wau.nl
Whiteside, M. and Carr, S. (1997) Encouraging sustainable smallholder agriculture in Malawi.
Agricultural Services Reform in Southern Africa: Service and policies needed to support
sustainable smallholder Agriculture in Malawi. Environment and Development Consultancy Ltd,
Hillside Uk.
Vedeld P, (1990). Household Viability and Change Among Tugens- A case study of the house hold
Resource allocation in the semi arid Barango District, Nomadic Peoples: 133 -151
Vedeld, P. and Krogh, E. (2001). Good Agronomy. Social institutions among Norwegian Farmers.
Agriculture University of Norway, Norway
Waddington, S., Sakala, W.D. and Mekuria, M. (2004). Progress in lifting soil fertility in Southern
Africa. "New directions for a diverse planet". Proceedings of the 4th International Crop Science
Congress, 2004. www.cropscience.org.au
Wallace, M.B. and Knausenberger, W.I.(1997). Inorganic Fertilizer Use in Africa:Environmental
and Economic Dimensions Applied Research. Winrock International Environmental Alliance
Arlington, Virginia, U.S.A.September 1997
www.encapafrica.org/MEO_Course/Module9--Special_Topics ( 2006.04.20)-
56
Øygard, R. (2006). Malawi’s Persistent Food Crisis (draft). Norwegian University of Life Sciences.
December 6, 2005 www.aae.wisc.edu/seminars/papers( 2006.04.08)
Øygard. R, Roberto Garcia. R., Guttormsen. A. G., Kachule. R., Mwanaumo.A., Mwanawina. I.,
Sjaastad.E. and Wik. M. (2003). The Maze of Maize: Improving Input and Output Market Access
for Poor Smallholders in Southern African Region, the Experience of Zambia and Malawi.
Department of Economics and Resource Management Report No. 26. Agricultural University of
Norway, A report commissioned by NORAD, September 2003.
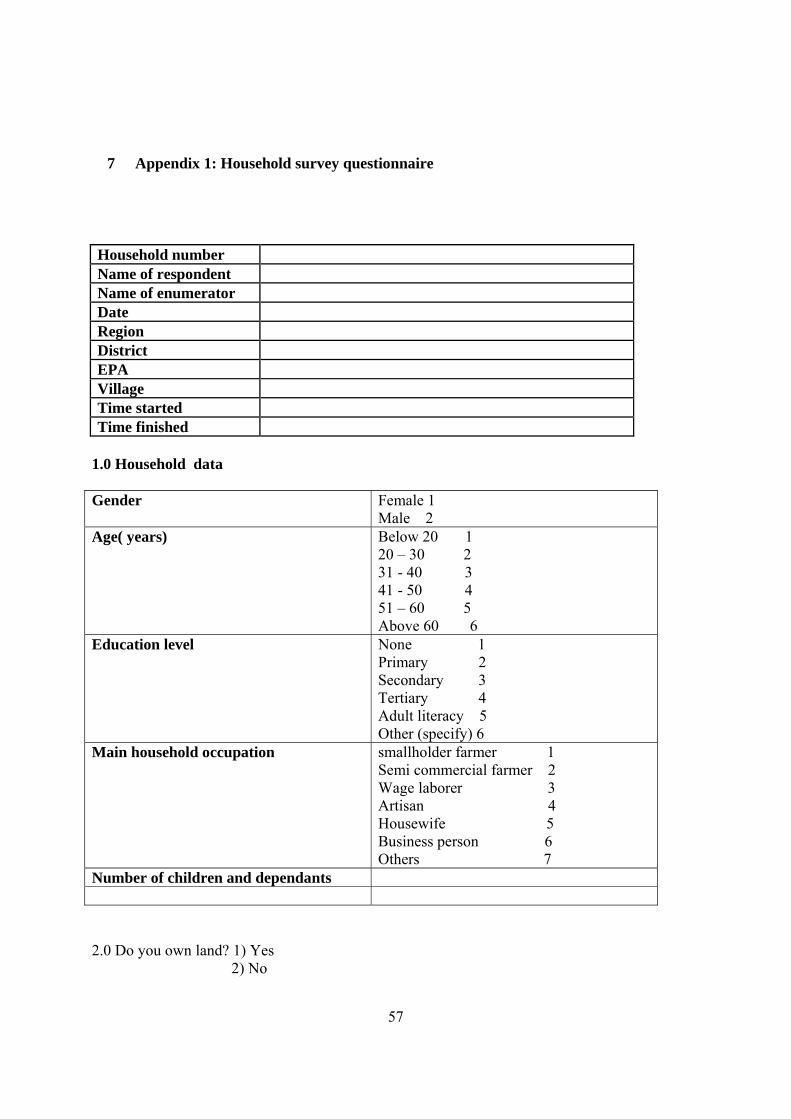
57
7 Appendix 1: Household survey questionnaire
Household number Name of respondent Name of enumerator Date Region District EPA Village Time started Time finished
1.0 Household data Gender Female 1
Male 2 Age( years) Below 20 1
20 – 30 2 31 - 40 3 41 - 50 4 51 – 60 5 Above 60 6
Education level None 1 Primary 2 Secondary 3 Tertiary 4 Adult literacy 5 Other (specify) 6
Main household occupation smallholder farmer 1 Semi commercial farmer 2 Wage laborer 3 Artisan 4 Housewife 5 Business person 6 Others 7
Number of children and dependants 2.0 Do you own land? 1) Yes 2) No
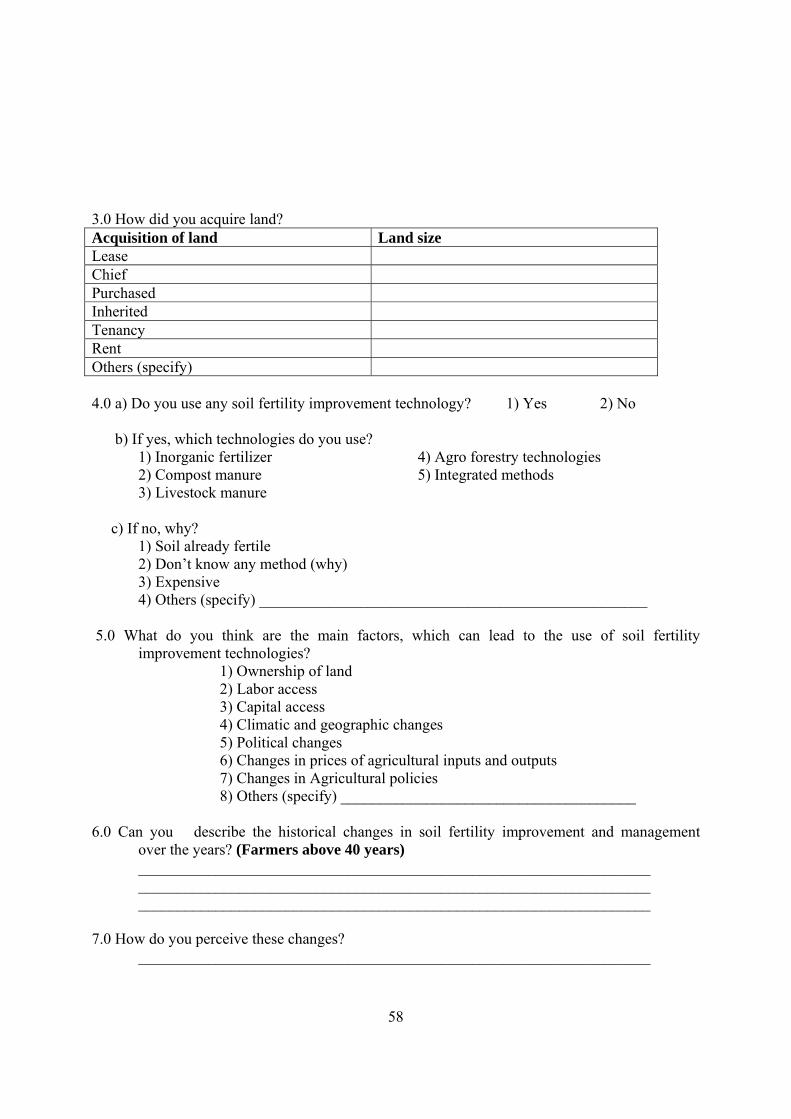
58
3.0 How did you acquire land? Acquisition of land Land size Lease Chief Purchased Inherited Tenancy Rent Others (specify) 4.0 a) Do you use any soil fertility improvement technology? 1) Yes 2) No b) If yes, which technologies do you use? 1) Inorganic fertilizer 4) Agro forestry technologies 2) Compost manure 5) Integrated methods 3) Livestock manure c) If no, why? 1) Soil already fertile 2) Don’t know any method (why) 3) Expensive 4) Others (specify) __________________________________________________ 5.0 What do you think are the main factors, which can lead to the use of soil fertility improvement technologies? 1) Ownership of land 2) Labor access 3) Capital access 4) Climatic and geographic changes 5) Political changes 6) Changes in prices of agricultural inputs and outputs 7) Changes in Agricultural policies 8) Others (specify) ______________________________________ 6.0 Can you describe the historical changes in soil fertility improvement and management over the years? (Farmers above 40 years) __________________________________________________________________ __________________________________________________________________ __________________________________________________________________ 7.0 How do you perceive these changes? __________________________________________________________________
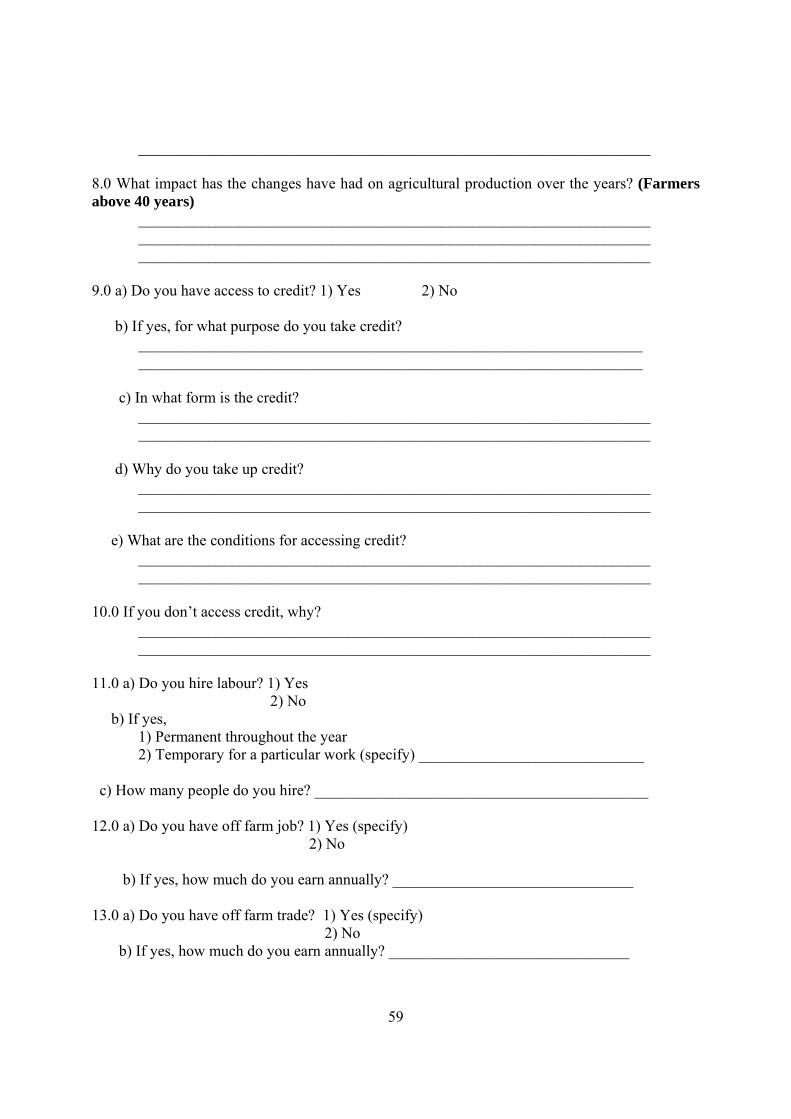
59
__________________________________________________________________ 8.0 What impact has the changes have had on agricultural production over the years? (Farmers above 40 years) __________________________________________________________________ __________________________________________________________________ __________________________________________________________________ 9.0 a) Do you have access to credit? 1) Yes 2) No b) If yes, for what purpose do you take credit? _________________________________________________________________ _________________________________________________________________ c) In what form is the credit? __________________________________________________________________ __________________________________________________________________ d) Why do you take up credit? __________________________________________________________________ __________________________________________________________________ e) What are the conditions for accessing credit? __________________________________________________________________ __________________________________________________________________ 10.0 If you don’t access credit, why? __________________________________________________________________ __________________________________________________________________ 11.0 a) Do you hire labour? 1) Yes 2) No b) If yes, 1) Permanent throughout the year 2) Temporary for a particular work (specify) _____________________________ c) How many people do you hire? ___________________________________________ 12.0 a) Do you have off farm job? 1) Yes (specify) 2) No b) If yes, how much do you earn annually? _______________________________ 13.0 a) Do you have off farm trade? 1) Yes (specify) 2) No b) If yes, how much do you earn annually? _______________________________
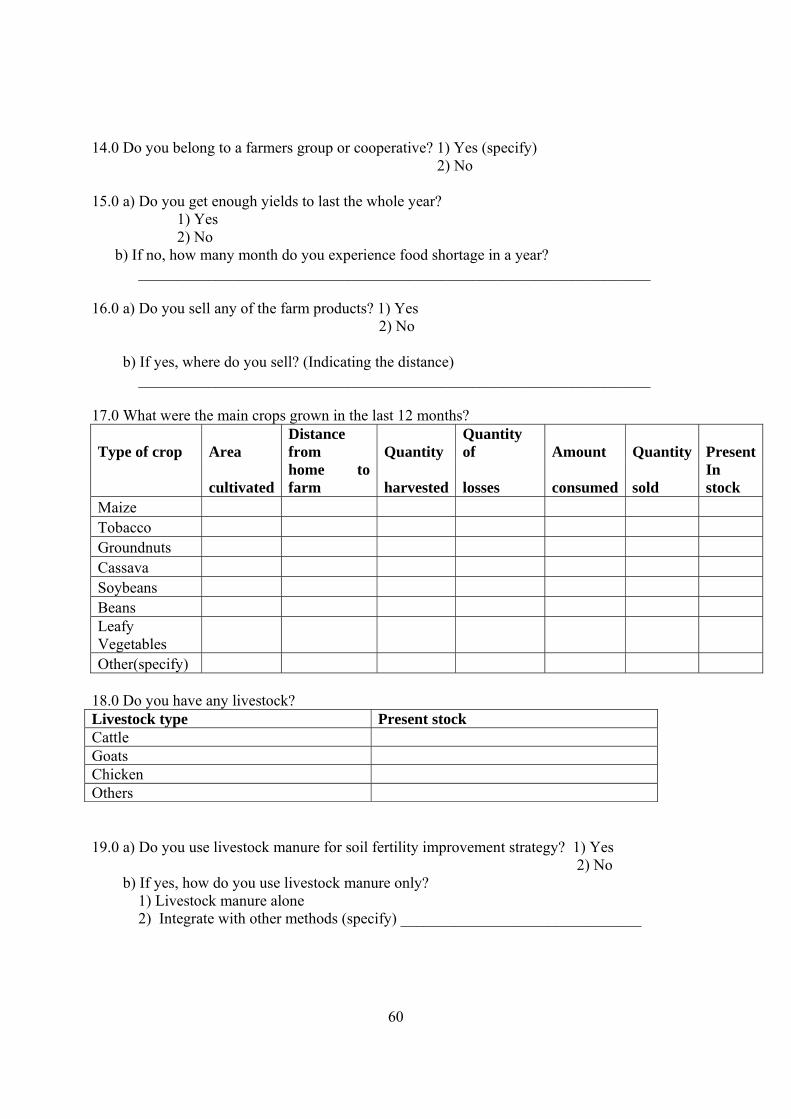
60
14.0 Do you belong to a farmers group or cooperative? 1) Yes (specify) 2) No
15.0 a) Do you get enough yields to last the whole year? 1) Yes 2) No b) If no, how many month do you experience food shortage in a year? __________________________________________________________________ 16.0 a) Do you sell any of the farm products? 1) Yes 2) No b) If yes, where do you sell? (Indicating the distance) __________________________________________________________________ 17.0 What were the main crops grown in the last 12 months?
Type of crop Area Distance from Quantity
Quantity of Amount Quantity Present
cultivated home to farm harvested losses consumed sold
In stock
Maize Tobacco Groundnuts Cassava Soybeans Beans Leafy Vegetables Other(specify)
18.0 Do you have any livestock? Livestock type Present stock Cattle Goats Chicken Others 19.0 a) Do you use livestock manure for soil fertility improvement strategy? 1) Yes 2) No b) If yes, how do you use livestock manure only?
1) Livestock manure alone 2) Integrate with other methods (specify) _______________________________
61
20.0 a) Do you compost your livestock manure or just apply straight into the field? 1) Compost 2) Apply straight into the field 3) Others (specify) __________________________________________________ b) Why did you choose to use the method described in 20 a? __________________________________________________________________ 21.0 a) Do you apply to the whole farm land? 1) Yes 2) No b) If no, why? ________________________________________________________ 22.0 Can you describe the changes in crop yield since you started using livestock manure?
1) Increased 3) Declined 2) No change 4) Can’t tell
23.0 If crop yield has increased, by how much has yield increased? Type of crop Area
applied with manure
Previous yield (# bags or Kg/ha)
Current yield (# bags or Kg/ha)
Yield increase (# bags or Kg/ha)
Maize Tobacco Groundnuts Cassava Soy beans Beans Leafy vegetables Others( specify) 24.0 What are the major constraints of using livestock manure for farm production? __________________________________________________________________ __________________________________________________________________ 25.0 a) Do you use compost manure? 1) Yes 2) No b) If yes, why did you choose to use compost manure? __________________________________________________________________ __________________________________________________________________ 26.0 a) Do you apply to the whole farm land? 1) Yes 2) No b) If no, why? ________________________________________________________ 27.0 How can you describe the changes in yield since you started using compost manure?
1) Increased 3) Declined 2) No change 4) Can’t tell
28.0 If crop yield has improved, by how much has yield increased? Type of crop Area Previous Current yield (# Yield increase (#
62
applied with manure
yield (# bags or Kg/ha)
bags or Kg/ha) bags or Kg/ha)
Maize Tobacco Groundnuts Cassava Soy beans Beans Leafy vegetables
Others( specify)
29.0 What are the major constraints of using compost manure for farm production? __________________________________________________________________ __________________________________________________________________ 30.0 a) Have you ever used Agroforestry technologies for soil fertility improvement? 1) Yes 2) No b) If yes, how did you know about Agroforestry technologies? __________________________________________________________________ c) How did you acquire the Agroforestry germplasm and technical support? __________________________________________________________________ d) For how long have you been practicing Agroforestry? ________________________ 31.0 a) Are you still using the Agroforestry technologies? 1) Yes 2) No b) If no, why did you stop? 1) Labour supply 3) Not effective 2) Expensive 4) lack of seed 5) Others specify 32.0 a) What kind of Agroforestry techniques do you use for soil fertility? 1) Improve fallow 2) Mixed cropping 3) Simultaneous intercropping (Gliricidia) 4) Relay cropping 5) Others (specify) __________________________________________________ b)Which AF tree species do you use 1) Gliricidia 4) Tithonia
63
2) Sesbania 5) Pigeon pea 3) Tephrosia 6) Others (specify)___________________________ 33.0 Why did you choose these technologies? _________________________________________________________________ _________________________________________________________________ 34.0 a) Do you apply the agroforesrty technologies to the whole farm land? 1) Yes 2) No b) If no, why? ________________________________________________________ 35.0 a) How much land is allocated to each of the AF technology? Agro forestry technology Area under technology (acres) Improve fallow Natural fallow Mixed cropping Simultaneous intercropping (Glicidia sp) Relay cropping Others (specify) 36.0 a) How can you describe the changes in yield since you started using Agroforestry technologies?
1) Improved 3) Declined 2) No change 4) Can’t tell
37.0 If crop yield has improved, by how much has yield increased? Type of crop Area
applied cultivated
Agroforestry technology
1Previous yield (# bags or Kg/ha)
Current yield (# bags or Kg/ha)
Yield increase (# bags or Kg/ha)
Maize Tobacco Groundnuts Cassava Soy beans Beans Leafy vegetables
Others( specify)
38.0 What are the major constraints on the use of Agroforestry technologies? __________________________________________________________________ __________________________________________________________________
64
For inorganic fertilizer user 39.0 Where do you buy inorganic fertilizer (Indicating distance)? __________________________________________________________________ 40.0 Do you apply the recommended rate for inorganic fertilizer to your crops? 1) Yes
2) No
41.0 a) Do you apply the inorganic fertiliser to the whole farm land? 1) Yes 2) No b) If no, why? ________________________________________________________ 42.0 How can you describe the changes in yield since you started using inorganic fertilizer?
1) Increased 3) Declined 2) No change 4) Can’t tell
43.0 If crop yield has improved, by how much has yield increased? Type of crop Area
applied cultivated
Inorganic fertilizer
1Previous yield (# bags or Kg/ha)
Current yield (# bags or Kg/ha)
Yield increase (# bags or Kg/ha)
Maize Tobacco Groundnuts Cassava Soy beans Beans Leafy vegetables
Others( specify)
1Yields obtained before using inorganic fertilizer 44.0 Why don’t you use other organic materials for soil fertility improvement (If don’t combine methods)? 1) Labour supply 4) Don’t know them 2) Expensive 5) Others specify 3) Not effective 45.0 What are the major constraints of using inorganic fertilizer for farm production? __________________________________________________________________ __________________________________________________________________ 46.0 a) Do you use a combination of fertilizer and organic materials (integrated method) on the same field?
1) Yes 2) No b) If yes, why do you combine inorganic fertilizer and organic materials?
65
__________________________________________________________________ __________________________________________________________________ 47.0 a) What type of organic materials do you use for integration soil fertility improvement method? __________________________________________________________________ __________________________________________________________________ b) How do you apply the two forms of fertilizer? (Simultaneously or Consecutively) __________________________________________________________________ c) What fertilizer rates (inorganic) do you use for the integrated method? __________________________________________________________________ __________________________________________________________________ 48.0 a) Do you use intergrated methods to the whole farm land? 1) Yes 2) No b) If no, why? ________________________________________________________ 49.0) a) For how long have you been using integrated the methods?_________________ b) Do integrated methods have an impact on crop yield? 1) Increased over inorganic fertilizer alone
2) No change 3) Declined
4) Can’t tell 50.0 If crop yield has improved, by how much has yield increased?
51.0 What are the major constraints of using integrated soil fertility improvement methods for farm production? __________________________________________________________________ 52.0 a) What is your opinion on the use of organic materials for soil fertility improvement without adding fertilizer? _________________________________________________________________
Type of crop Area applied cultivated
Previous yield (# bags or Kg/ha)
Current yield (# bags or Kg/ha)
Yield increase (# bags or Kg/ha)
Maize Tobacco Groundnuts Cassava Soy beans Beans Leafy vegetables Others( specify)
66
_________________________________________________________________ b) What is your opinion on the use of inorganic fertilizer for soil fertility improvement without adding organic material? _________________________________________________________________ _________________________________________________________________ _________________________________________________________________ 53.0 Why don’t you use inorganic fertilizer in your field? (Non inorganic fertilizer users)
1) Limited supply 4) Land is fertile (why) 2) Expensive 5) Others specify
3) Not effective 54.0 What is your opinion on the use of integrated soil fertility improvement management? _________________________________________________________________ _________________________________________________________________ 55.0 How much labor is required for management of the soil fertility improvement technology? Agro forestry Technology
Number of adult people involved in the activity
Area of land worked
Hours/ days
# of children involved in the work
Improve fallow Natural fallow Mixed cropping Simultaneous intercropping (Gliricidia)
Relay cropping Livestock manure Compost manure Fertilizer Others (specify) 56.0 What soil fertility improvement technologies do you prefer to use for each of the following crops? Type of crop soil fertility improvement technique Maize
Tobacco
Groundnuts
Cassava
Soy beans
67
Beans Leafy vegetables 57. 0 What kind of technologies do you use for soil fertility improvement, for the different land site (Soil catenae)? Land site soil fertility improvement method(s) Steep slopes (hill sides) Mid slope Flat area Valley bottom Dambo (Wetlands) Others (specify) 58.0 Where did you get information for soil fertility improvement technologies?
1) Extension worker 4) Both 2) Researcher 5) Others (specify) 3) Friends
59.0 If extension worker or research scientist, from which institution or organization? 1) Government 2) NGO (specify) _____________________________________________ 3) Others (specify) ____________________________________________ 60.0 Explain the role of extension service in soil fertility improvement technologies adoption? __________________________________________________________________ 61.0 What role do fellow farmers in adoption of soil fertility improvement technologies play? __________________________________________________________________ 62.0 When does a farmer practicing soil fertility technologies become an adopter? __________________________________________________________________