Embed Size (px)
Citation preview

1 Copyright © 2003 by ASME
Proceedings of FEDSM’03 4TH ASME_JSME Joint Fluids Engineering Conference
Honolulu, Hawaii, USA, July 6–11, 2003
FEDSM2003-45472
CHARACTERIZATION OF POWERED RESONANCE TUBE FOR HIGH FREQUENCY ACTUATON
A. Hamed, K. Das and D. Basu Department of Aerospace Engineering and Engineering Mechanics
University of Cincinnati, Cincinnati, OH-45219
ABSTRACT A numerical investigation of powered resonance tube is
carried out to study the effect of geometry on the unsteady flow characteristics and mass flow variations. Computational results for pressure fluctuations and sound pressure level (SPL) spectra are presented for different tube configurations. The results demonstrate that both amplitude and frequency for pressure oscillations in the gap are strongly dependent on tube length and separation distance.
NOMENCLATURE D=Nozzle exit diameter L=Tube length S=Distance between nozzle exit and tube inlet Mj=Jet Mach number C=Speed of sound
INTRODUCTION Active flow control is being touted as an effective method
to develop the technology of flow manipulation in many applications. Recent interest in resonance tube [1,2] based powered devices is due to their potential application as high bandwidth actuators in high-speed flows. Stanek et. al. [3,4] conducted an experimental study, which demonstrated that Hartmann resonance tube based fluidic actuators are more effective than other passive devices for noise suppression noise in high speed flow over cavities. Cain et al [5] conducted a numerical investigation to study the effect of pressure ratio and free-stream flow on the pressure oscillations in a resonance tube. Raman et al [6,7] conducted an experimental study to obtain the desirable frequency in high bandwidth resonance tube actuator though the variation of gap and tube length. Kastner and Samimy [8] studied the effect of tube depth, jet Mach number and separation distance on the power spectra of far acoustic field and the near pressure field.
Hamed et al [9] conducted a numerical investigation of the
unsteady flow in a resonance tube with a supersonic jet to characterize the pressure oscillations and the high amplitude low frequency tones generated by the tube in the jet regurgitant mode. In a subsequent study Hamed et al [10] investigated the
effect of jet Mach number on resonance tube operation and predicted the switching from jet regurgitant to jet screech mode with increased jet Mach number, which was documented in earlier experimental studies [11].
The principal thrust of the current work is to gain an in-
depth understanding of the unsteady flow characteristics in the resonance tube and how it is affected by the tube length and the separation gap between the nozzle-exit and tube-entry are presented. The simulations were performed for the compressible unsteady Reynolds averaged Navier-Stokes equations with algebraic turbulence model for the boundary and shear layers. Computational results are presented for the pressure fluctuations and sound pressure level spectra as well as the mass flow variation through the gap for different geometrical configurations.
Geometry and Computational Domain
A schematic of the Hartmann resonance tube device under investigation is shown in Figure 1. The nozzle and tube geometry are similar to the ones tested by Kastner and Samimy [10]. The current simulations were conducted for axi-symmetric flows, while the gap was partially closed in the experimental study. The computational domain was 12 times the nozzle diameter, D, in the radial direction and extended from inlet duct to the closed end of the resonance tube. The study includes baseline configuration with a tube length to diameter ratio (L/D) of one and gap to diameter ratio (S/D) of one and four additional configurations with L/D=1.5, 2 and S/D=1.5, 2 as listed in Table 1.
Methodology The unsteady compressible viscous flow solutions were
obtained for the compressible Navier-Stokes equations in conservation law form using the WIND code [12,13]. Van-Leer second order scheme and Jacobi implicit operator with 30 sub-iterations in each time step were used. with four-stage Runge-Kutta time stepping scheme. A TVD factor of 1.0 was used. to
2 Copyright © 2003 by ASME
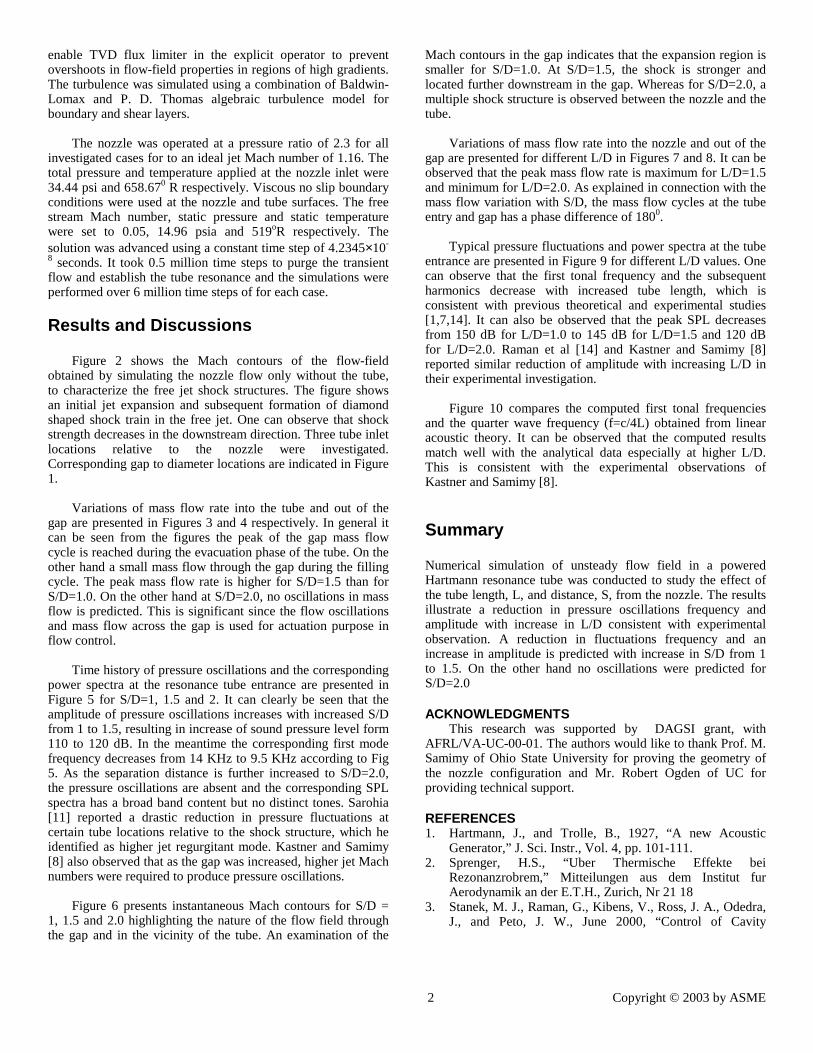
enable TVD flux limiter in the explicit operator to prevent overshoots in flow-field properties in regions of high gradients. The turbulence was simulated using a combination of Baldwin-Lomax and P. D. Thomas algebraic turbulence model for boundary and shear layers.
The nozzle was operated at a pressure ratio of 2.3 for all
investigated cases for to an ideal jet Mach number of 1.16. The total pressure and temperature applied at the nozzle inlet were 34.44 psi and 658.670 R respectively. Viscous no slip boundary conditions were used at the nozzle and tube surfaces. The free stream Mach number, static pressure and static temperature were set to 0.05, 14.96 psia and 519oR respectively. The solution was advanced using a constant time step of 4.2345×10-
8 seconds. It took 0.5 million time steps to purge the transient flow and establish the tube resonance and the simulations were performed over 6 million time steps of for each case.
Results and Discussions Figure 2 shows the Mach contours of the flow-field
obtained by simulating the nozzle flow only without the tube, to characterize the free jet shock structures. The figure shows an initial jet expansion and subsequent formation of diamond shaped shock train in the free jet. One can observe that shock strength decreases in the downstream direction. Three tube inlet locations relative to the nozzle were investigated. Corresponding gap to diameter locations are indicated in Figure 1.
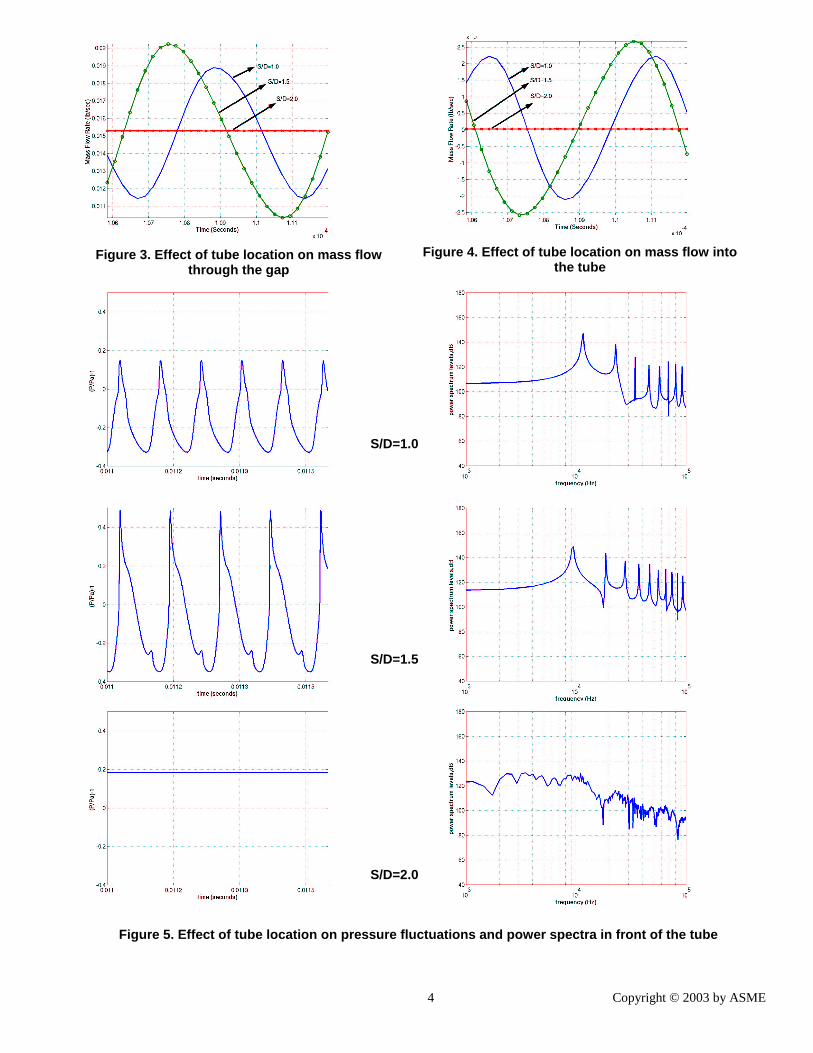
Variations of mass flow rate into the tube and out of the
gap are presented in Figures 3 and 4 respectively. In general it can be seen from the figures the peak of the gap mass flow cycle is reached during the evacuation phase of the tube. On the other hand a small mass flow through the gap during the filling cycle. The peak mass flow rate is higher for S/D=1.5 than for S/D=1.0. On the other hand at S/D=2.0, no oscillations in mass flow is predicted. This is significant since the flow oscillations and mass flow across the gap is used for actuation purpose in flow control.
Time history of pressure oscillations and the corresponding
power spectra at the resonance tube entrance are presented in Figure 5 for S/D=1, 1.5 and 2. It can clearly be seen that the amplitude of pressure oscillations increases with increased S/D from 1 to 1.5, resulting in increase of sound pressure level form 110 to 120 dB. In the meantime the corresponding first mode frequency decreases from 14 KHz to 9.5 KHz according to Fig 5. As the separation distance is further increased to S/D=2.0, the pressure oscillations are absent and the corresponding SPL spectra has a broad band content but no distinct tones. Sarohia [11] reported a drastic reduction in pressure fluctuations at certain tube locations relative to the shock structure, which he identified as higher jet regurgitant mode. Kastner and Samimy [8] also observed that as the gap was increased, higher jet Mach numbers were required to produce pressure oscillations.
Figure 6 presents instantaneous Mach contours for S/D =
1, 1.5 and 2.0 highlighting the nature of the flow field through the gap and in the vicinity of the tube. An examination of the
Mach contours in the gap indicates that the expansion region is smaller for S/D=1.0. At S/D=1.5, the shock is stronger and located further downstream in the gap. Whereas for S/D=2.0, a multiple shock structure is observed between the nozzle and the tube.
Variations of mass flow rate into the nozzle and out of the
gap are presented for different L/D in Figures 7 and 8. It can be observed that the peak mass flow rate is maximum for L/D=1.5 and minimum for L/D=2.0. As explained in connection with the mass flow variation with S/D, the mass flow cycles at the tube entry and gap has a phase difference of 1800.
Typical pressure fluctuations and power spectra at the tube
entrance are presented in Figure 9 for different L/D values. One can observe that the first tonal frequency and the subsequent harmonics decrease with increased tube length, which is consistent with previous theoretical and experimental studies [1,7,14]. It can also be observed that the peak SPL decreases from 150 dB for L/D=1.0 to 145 dB for L/D=1.5 and 120 dB for L/D=2.0. Raman et al [14] and Kastner and Samimy [8] reported similar reduction of amplitude with increasing L/D in their experimental investigation.
Figure 10 compares the computed first tonal frequencies
and the quarter wave frequency (f=c/4L) obtained from linear acoustic theory. It can be observed that the computed results match well with the analytical data especially at higher L/D. This is consistent with the experimental observations of Kastner and Samimy [8].
Summary
Numerical simulation of unsteady flow field in a powered Hartmann resonance tube was conducted to study the effect of the tube length, L, and distance, S, from the nozzle. The results illustrate a reduction in pressure oscillations frequency and amplitude with increase in L/D consistent with experimental observation. A reduction in fluctuations frequency and an increase in amplitude is predicted with increase in S/D from 1 to 1.5. On the other hand no oscillations were predicted for S/D=2.0
ACKNOWLEDGMENTS This research was supported by DAGSI grant, with
AFRL/VA-UC-00-01. The authors would like to thank Prof. M. Samimy of Ohio State University for proving the geometry of the nozzle configuration and Mr. Robert Ogden of UC for providing technical support.
REFERENCES 1. Hartmann, J., and Trolle, B., 1927, “A new Acoustic
Generator,” J. Sci. Instr., Vol. 4, pp. 101-111. 2. Sprenger, H.S., “Uber Thermische Effekte bei
Rezonanzrobrem,” Mitteilungen aus dem Institut fur Aerodynamik an der E.T.H., Zurich, Nr 21 18
3. Stanek, M. J., Raman, G., Kibens, V., Ross, J. A., Odedra, J., and Peto, J. W., June 2000, “Control of Cavity

3 Copyright © 2003 by ASME
Resonance Through Very High Frequency Forcing,” AIAA Paper 2000-1905.
4. Stanek, M. J., Raman, G., Kibens, V., Ross, J. A., Odedra, J., and Peto, J. W., June 2000, “Suppression of Cavity Resonance Using High Frequency Forcing – The Characteristic Signature of Effective Devices,” AIAA Paper 2001-2128.
5. Cain, A B; Kerschen, E J ; Raman, G ; Khanafseh, S, 2002, “Simulation of powered resonance tubes - Effects of pressure ratio and freestream flow” , AIAA Paper 2002-2821
6. Raman, G., Khanafseh, S., Cain, A.B., January 2002, “Development of high bandwidth actuators for aeroacoustic control,” AIAA Paper 2002-0664.
7. Raman, G., Khanafseh, S., Cain, A.B., January 2002 “High bandwidth powered resonance tube actuators with feedback control (for active flow control)” , AIAA Paper 2002-2820.
8. Kastner, Jeff and Samimy Mo, January 2002 “ Development and Characterization of Hartmann Tube Base Fluidic Actuators for High Speed Flow Control,” AIAA Paper 2002-0128.
9. Hamed, A., Das, K., and Basu, D., January 2002 “Numerical Simulation of Unsteady Flow in Resonance Tube,” AIAA Paper 2002-1118.
10. Hamed, A., Das, K., and Basu, D., January 2003 “ Numerical Simulation and parametric study of a Hartmann
Sprenger Tube based Powered Device” AIAA Paper 2003-0050.
11. Sarohia V and Back, L.H., 1979, “Experimental investigation of Flow and Heating in a Resonance tube,” J. of Fluid mech., Vol. 94, Part 4, pp.649-672.
12. Bush, R.H., Power, G.D. Towne, C.D., 1998, “WIND: The production solver for the NPARC alliance” , AIAA Paper –1998-0935.
13. http://www.grc.nasa.gov/WWW/winddocs/ 14. Raman, G., Mills, A., Othman, S., and Kibens, V, June
2001, “Development of Powered Resonance Tube Actuators for Active Flow Control,” ASME FEDSM 2001-18273.
Table 1.
L/D S/D Grid points
1 1.0 31,875 1.5 1.0 36,125 2.0 1.0 40,375 1.0 1.0 31,875 1.0 1.5 36,125 1.0 2.0 40,375
Figure 1. Schematic of Resonance Tube Figure 2. Free jet shock structure
4 Copyright © 2003 by ASME
Figure 4. Effect of tube location on mass flow into the tube
Figure 3. Effect of tube location on mass flow through the gap
S/D=1.0
S/D=1.5
S/D=2.0
Figure 5. Effect of tube location on pressure fluctuations and power spectra in front of the tube

5 Copyright © 2003 by ASME
Figure 7. Effect of tube length on mass flow through the gap
Figure 8. Effect of tube length on mass flow into the tube
Figure 6. Mach Contours for different S/D
S/D=1.0 S/D=1.5
S/D=2.0

6 Copyright © 2003 by ASME
Figure 10. Comparison of computed first mode with quarter wave frequency
Figure 9. Effect of tube length on pressure fluctuations and power spectra in front of the tube
L/D=1.0
L/D=1.5
L/D=2.0