Embed Size (px)
Citation preview
NBER WORKING PAPER SERIES
FEDERALISM'S VALUES AND THE VALUE OF FEDERALISM
Robert P. Inman
Working Paper 13735http://www.nber.org/papers/w13735
NATIONAL BUREAU OF ECONOMIC RESEARCH1050 Massachusetts Avenue
Cambridge, MA 02138January 2008
The author would like to thank Grant Long and Jonathan Stott for their excellent research assistanceon this project, Richard Bird and Anwar Shah for their helpful comments regarding the governanceclassifications, and Ruth Jody for her understanding. Excellent comments were provided by conferenceparticipants at the CESifo-Kentucky Conference on Federalism and by two anonymous referees.¸ Theviews expressed herein are those of the author(s) and do not necessarily reflect the views of the NationalBureau of Economic Research.
NBER working papers are circulated for discussion and comment purposes. They have not been peer-reviewed or been subject to the review by the NBER Board of Directors that accompanies officialNBER publications.
© 2008 by Robert P. Inman. All rights reserved. Short sections of text, not to exceed two paragraphs,may be quoted without explicit permission provided that full credit, including © notice, is given tothe source.
Federalism's Values and the Value of FederalismRobert P. InmanNBER Working Paper No. 13735January 2008JEL No. H11,H77,P48
ABSTRACT
What is it about federal governance that makes it so attractive to economists, political philosophers,and legal scholars and is there any evidence that would suggest all this attention is warranted? Proponentssee federalism as a means to more efficient public and private economies, as the foundation for increasedpolitical participation and democratic stability, and as important check on governmental abuses ofpersonal rights and liberties. This study provides a working definition of federal governance and classifiesa sample of 73 countries as either a constitutionally-based federal democracy, an administratively-basedfederal democracy, a unitary democracy, a federal dictatorship, or a unitary dictatorship. Governanceis then related to eleven measures of economic, democratic, and rights performance. Three conclusionsfollow. First, decentralized policy-making does have a unique contribution to make to a society's abilityto enforce property rights, to protect political and civil rights, and then because of such rights protections,to enhance private sector economic performance. Second, while policy decentralization is the keyto federalism's strong rights and economic performance and can be achieved within a unitary governmentby fiat, constitutionally established provincial (or state) governments provide an extra and importantprotective barrier for policy decentralization. Federal institutions protect policy decentralization, andpolicy decentralization provides federalism's valued outcomes. Third, federalism needs democracy;there is no evidence that adding policy decentralization or provinces to a dictatorship significantlyimproves a dictatorship's economic or rights performance.
Robert P. InmanDepartment of FinanceWharton SchoolUniversity of PennsylvaniaPhiladelphia, PA 19104-6367and [email protected]
1
FEDERALISM’S VALUES & VALUE OF FEDERALISM
by
Robert P. Inman
If we wish to know the (political and social function of the federal system), we mustask two questions: Whether federalism as such has value(s) and whether (thosevalues) are attainable only through this governmental arrangement. . . . The valueof federalism as against the unitary state ... can be determined solely through anempirical analysis of a given political system. (Franz Neumann, “Federalism andFreedom: A Critique,” Federalism, A. W. MacMahon (ed.), 1962, pp. 44-45).
Strategies to stop decentralization are unlikely to succeed, as the pressures fordecentralization are beyond government control. . . . (G)overnment should facedecentralization armed with lessons from countries that have gone before them.(World Bank, World Development Report, 2000, p. 124)
The federal state, once the constitutional foundation for only a few western governments,
now seems a polity of choice both for emerging democracies and for established states undergoing
economic and democratic reforms. After long periods of military dictatorships Argentina, Brazil,
South Africa, and the new democracies emerging from the old Soviet Union have each chosen to use
a federal form of government. The once dictatorial East Germany has been re-configured as new
democratic Länder within the federal republic of Germany. Centralized political systems as
different as China, Norway, and Sweden are now finding a federal style of governmental decision-
making a useful means for implementing economic reforms. The European Union, first begun as
simply a trading partnership for coal and steel, is now moving, albeit slowly, towards a more
integrated political union founded upon federal principles of governance. Mexico’s recent
emergence as truly competitive democracy is arguably a result of a new commitment to a system of
shared powers between the central government and lower-tier, provincial or state governments. Even
the original and perhaps still strongest federal unions – Australia, Canada, and the United States –
2
are today facing significant challenges to their current structure of federal governance: A redefinition
of state financing in Australia, addressing the Quebec “question” in Canada, and an invigorated U.S.
Supreme Court seeking to limit the powers of Congress over U.S. states. Now is perhaps a good
time to stand back for a moment to engage a first-order question: What is it about federal governance
that makes it so potentially attractive and is there any evidence that suggests all this attention is
warranted?
Section II offers a brief overview of the arguments for federalism from the economic,
political science, and legal literatures. Proponents from economics see federal governance as a
means to efficient public and private sector performance, advocates from political science as a means
to political participation and democratic stability, and legal scholars as a way to check central
government powers and possible abuses of personal rights and liberties.
Section III first provides a working definition of federal governance and classifies each of
a sample of 73 countries as either a constitutionally-based federal democracy, an administratively-
based federal democracy, a unitary democracy, a federal dictatorship, or a unitary dictatorship. The
sample includes all 24 generally recognized federal countries, whether democratic or dictatorial, and
nine countries I identify as de facto or administratively federal countries. The empirical analysis of
Section III then seeks to identify the impact of each form of governance on each of the valued federal
outcomes. The analysis makes a distinction, now neglected in the empirical literature, between the
contribution of federal political institutions formally specified in a country’s constitution and the
contribution of the federal policy choice to decentralize or devolve program responsibilities to lower
tier governments or administrative units. Constitutionally-based federal governments have
independently elected provincial governments and constitutionally specified representation of those
3
provinces in the central government. Administratively-based federal governments are formally
specified as unitary governments but ones that make significant use of local governments for the
implementation of central government policies. For this sample of countries and sample years
(1965-2000), I find both constitutionally-based and administratively-based federal governments
outperform unitary governments on many of federalism’s valued outcomes but that there is no
significant performance difference between the two forms of federalism. It is policy decentralization
that is most important factor contributing to federalism’s strong performance. Finally, federalism’s
strong performance is only observed in democracies. There appears to be no advantage to attaching
formal federal institutions to, or in advocating policy decentralization for, dictatorships.
Section IV looks behind these reduced form results to identify the relative contribution of
each of federalism’s three institutional features: provincial governments, central representation, and
policy decentralization. While policy decentralization is the primary means through which federal
governments favorably impact federal values, having constitutionally created and protected
provinces with central representation provides an important safeguard for the decentralization
decision itself. The primary role of constitutionally specified federal institutions, it appears, is to
protect federal policy choices.
II. Federalism’s Values
Beginning with Plato’s argument for the optimal size of political jurisdictions – 5,040
citizens based on the capacity of a coliseum with adequate acoustics to guarantee all speakers could
be heard – almost all great political philosophers in the Western tradition have had something nice
1 Beer (1993) provides an encyclopedic overview of the history of political thought on the virtuesand vices of federal governance.
2 See Federalist Papers, No. 51 (1982).
3 Excellent surveys of the contemporary economic, political science, and legal literatures on theadvantages of federalism can be found in Oates (1999), Weingast (2006), and Friedman (1997), respectively.
4
to say about federal governance.1 Aquinas stressed the virtue of specialization but the need for
coordination from the top by (divinely) selected “elders.” John Milton and James Harrington also
valued specialization but preferred that final authority arise from the collective deliberation of the
governed. Machiavelli and Montesquieu took matters further preferring small governments for such
decisions – perhaps no more than a 1,000 residents with similar needs and preferences – but then
allowing for negotiated “contracts” or treaties between those governments as group interests, most
notably the common defense, required. Adam Smith, John Stuart Mills, and Jean-Jacques Rousseau
embraced and refined Montesquieu’s arguments, preferring majority rule representative government
as both the most efficient and participatory means for collective choices by the many small states.
Even James Madison, one of the most forceful advocates for a strong central government, saw
provinces as an important check against central government abuse of individual rights and liberties
and thus essential for a well-run democracy.2 Contemporary social scientists and political
philosophers have been no less enamored.3 Three categories of valued outcomes have typically been
offered throughout this literature as the comparative advantages of federal governance: economic
efficiency, democratic participation, and the protection of personal rights and liberties.
A. Economic Efficiency: Federal governance is argued to promote efficiency in both the
public and private sectors of the economy. First, multiple, lower tier governments allow mobile
residents the opportunity to choose a preferred public goods bundle at the lowest cost. Choice
4 It is here that an economist would place the favorable outcome of “policy experimentation andinnovation” so often stressed by U.S. courts; see Friedman (1997) or Rubin and Feeley (1994).
5 The Data Appendix provides the precise definition of each variable as well as the variable’s samplemean and standard deviation.
5
through mobility ensures a better matching of citizen preferences to government allocations
(Tiebout, 1956) and serves as a disciplinary device to limit government inefficiency and corruption
(Brennan and Buchanan, 1980; Shleifer and Vishny,1993). Even if citizens are not mobile,
politically independent provinces may engage in efficiency-enhancing “yardstick competition” as
citizens observe what their neighbors are doing and demand comparable service or tax performances
from their own elected leaders (Besley and Case, 1995).4 Decentralized governance does not come
without its risks, however. Public “goods” with significant interjurisdictional spillovers may be
underprovided while public “bads” may be overused; see, for example, Oates (1972). Such local
spillovers can be corrected, but efficiently so only if local representatives to the central government
do not fall prey to the mis-incentives of “common pool” budgeting of their mutual tax base; see
Inman and Fitts (1990) and Besley and Coate (2003). Federalism can contribute to the valued
outcome of government efficiency, but it is by no means guaranteed.
Here I test for the potential ability of federal governance to promote public sector efficiency
using two measures of government performance: 1) the average share over our sample period of
Government Consumption spending in GDP (GC6589) measured by the share of total government
spending less spending shares for defense, education, and social insurance; and 2) the average
ranking during our sample period of each country’s government corruption score as provided by
Transparency International (TICORRUPT). Higher values of both variables are meant to reflect less
efficient government performance.5
6 It has proven exceedingly difficult to find persuasive evidence for the effects of politicalinstitutions on economic growth. Growth rates are themselves very noisy measures of economicperformance often more influenced by outside events – oil crises, world commodity prices – than countryfundamentals. Further, as the arguments here for the effects of federalism make clear, institutions workthrough many economic channels and each channel itself can be a subtle path of influence. I did run growthregressions relating country growth rates from 1965 to 2000 to federal institutions controlling for variouscountry fundamentals (available upon request) but found no significant effect of federal or democraticinstitutions on growth rates. This conclusion is consistent with the careful analysis in Tavares and Wacziarg(2001). In their work democracy promotes education which helps growth but stimulates incomeredistribution and inefficient government spending which discourage growth. In the end, democracy’simpact on growth is very small and slightly negative.
6
Federalism is also argued to improve private sector economic performance. Assigning tax
and regulatory responsibilities to provinces and local governments checks government’s temptation
to exploit business investment through confiscatory capital taxes or excessive business regulation;
see Weingast (1995). Decentralized provision of public goods may encourage a more efficient
allocation of tax burdens over the life-cycle, thus promoting higher savings by younger workers and
increased domestic capital accumulation; see Brueckner (2006) and Hatfield (2006). Together, tax
and spending decentralization encourage foreign and domestic investment, capital accumulation,
economic growth, and finally higher steady-state incomes. The potential long-run private sector
economic benefits of federal institutions and policy decentralization are best measured by the level
of a country’s income in a recent year; see Hall and Jones (1999), Acemoglu, Johnson, and Robinson
(2004), and Rodrik (2006).6 For my measure of private sector economic performance I use the
relative ranking in each of the sample country’s real output per worker (Y/L) in 1988 as presented
in Hall and Jones (1999), where all values are relative to the United States. The U.S. ranking is
1.000 (this sample’s top score) while Myanmar has a relative score of .029 (this sample’s lowest
score).
B. Democratic Participation: Federalism’s contribution to democratic participation, first
noted by Plato and Aristotle, is in the presumed ability of small polities to encourage public
7
discourse. Modern political theorists have made similar arguments but within the context of
representative democracies. Access to politicians is likely to be easier and information about
politician’s activities more readily available when government is small. With lower costs to
participation, participation should increase. Further, if small governments are allocated
responsibility for policies of importance, then the benefits of participation are higher too. This too
encourages political activity. Federal institutions both create small governments and assign those
governments significant policy responsibilities. With low costs and high benefits, political
participation whether through voting, organizing, or community action should be greater in federal
democracies; see Pateman (1970).
The challenge to this argument is the reality of free-rider behavior in political activities. Why
should I participate if my single contribution to the final outcome is trivial relative to my costs of
participation? One answer is found in the new work on political participation recognizing citizens
often identify with wider groups with coincident interests and may feel an ethical obligation to
behave in a responsible manner on behalf of the group – that is, what would happen if everyone in
my group behaved as I do? From this perspective it can be rational to participate; see Feddersen and
Sandroni (2006). Now the relevant environment for the citizen’s decision to participate is not one
of a thousand or a million of voters, but rather as a “representative” for one of three or four
competing reference (interest) groups. This small numbers environment is far more likely to produce
citizen political participation; see Palfrey and Rosenthal (1984) and for evidence Coate and Conlin
(2004). Since federal provinces with preference sorting is likely to reduce the number of interacting
representative groups, we can salvage the original prediction that democratic federalism encourages
political participation. I test for empirical validity of this argument by relating federal institutions
to each country’s average rate of voter turnout in national elections over our sample period (VOTE).
7 Myerson (2006) presents an additional argument for why a federal form of governance mightenhance the stability of democracy. In Myerson’s model everyone votes but it is difficult for citizens toidentify politicians who are truly honest democrats from those who are despots – i.e., corrupt – in disguise.Intuitively, under federal governance there will always be a supply of potential honest politicians, eitherbecause they are truly honest or because they are acting honest in hopes of being elected to national officewhere they might then act the despot. Either both levels of government are run by honest democrats, or atleast one or more of the provinces are.
8
Democratic participation, and thus federal institutions in turn, is argued to have another
important democratic benefit: stable governance. Elections marked by high rates of voluntary
political participation confer legitimacy on the winners of those elections. Thus we should expect
the transition from one government to the next to be peaceful and to adhere to the stated rules for
the transfer of power; Dahl (1998).7 We test this secondary hypothesis that federal governments are
more stable governments by relating federal institutions to the percent of times over our sample
period that a country’s schedule transfer of executive authority follows the stated or legal guidelines
for such transitions (LEGALTRAN).
C. Protection of Personal Rights and Liberties: Federalism’s final, and for many its finest,
virtue is its ability to protect personal rights and liberties: the economic rights to own and allocate
property, the political rights to vote and to speak one’s mind, and the civil liberties of religious
expression, privacy, and travel. Federal institutions, it is argued, protect these rights and liberties
in two ways. First, if a province’s majority denies the economic, political or civil liberties of a
minority, that minority can move to a more hospitable province; see Rapaczynski (1985). Second,
even lacking mobile residents, federal institutions still may provide protection. Under federalism,
Madison argued, “the power surrendered by the people is first divided between two distinct
governments, and then the portion allotted to each, subdivided among distinct and separate
departments. Hence a double security arises to the rights of the people. The different governments
8 See Madison (1982), at Federalist No. 51. (Italics added.)
9 The index is specified as .5@[(1/PRScore) + (1/CRScore)], where the PRScore is the country’saverage score over our sample period for Freedom House’s index of political rights and the CRScore is thecountry’s average score over our sample period for Freedom House’s index of civil rights. Freedom Housescores range from 1 (most liberal) to 7 (most oppressive).
9
will control each other; at the same time that each will be controlled by itself.”8 States “check” the
central government and the central government “checks” the states, just as within each tier of
government the legislative, executive, and judicial branches balance the others’ powers.
I measure a country’s performance as a protector of personal rights and liberties on two
dimensions. First, a country’s respect for private economic property is measured by its relative
ranking in the Hall-Jones (1999) index of Government Anti-Diversion Policies (GADP) with the
United States receiving the top ranking of 1.000 and Sudan the lowest ranking of .308. Second, a
country’s respect for political and civil liberties is measured by its relative ranking on an index of
average scores over our sample period of the Freedom House’s rating of political and civil liberties
(POL/CIV).9 Western democracies typically have a score of 1.000 while dictatorships such as
Vietnam (.145), Myanmar (.150) and China (.152) have low scores.
D. Is There a Cost to Federalism? For all its virtues, federal governance is not without its
critics. In particular, scholars with strong redistributive preferences (Musgrave, 1959, pp. 179-183)
and those who champion efficiency (Stigler, 1957) both recognize the potential inability of strongly
decentralized governments to achieve socially agreed to norms of equal opportunity or economic
fairness. To ensure an equal opportunity for all citizens to “choose a life one has reason to value”
Sen (1999, p. 74), government must guarantee sufficient human capital skills and physical health to
all its citizens – services Musgrave calls “merit wants,” Rawls “primary goods,” and Sen
“capabilities.” Provincial responsibilities for education and health care may lead to an inequitable
10
distribution of these services, however, either because fiscal resources are lacking in poorer
provinces or because discrimination occurs in wealthy, elite run provinces (Bardhan and
Mookherjee, 2000). Even with more equal human capital skills and good health, all citizens are not
fully mobile and because of agglomeration economies or the spatial concentration of natural
advantages some may have only limited access to income opportunities. The equalization of
provincial fiscal resources plus mandates for equal access to education, health care services, and job
opportunities can correct such inequities, but critics argue central government taxation, resource
redistribution, and close monitoring of provincial governments will typically be needed. I test for
the relative performance of federal governments to provide equal economic opportunities by relating
countries’ governance structures to their performance in the provision and distribution of education,
measured by the average level of educational attainment for those over 25 years of age (YRS/ED)
and the ratio female to male educational attainment for those over 25 (EQ/ED) in our sample period,
to their performance in the provision of health care, measured by the average life expectancy of
citizens in the year 2000 (LIFEXP), and to countries’ ability to provide equal earnings opportunities,
measured by the average value of their Gini coefficients (GINI) over our sample years.
III. Federal Governance the Value of Federalism
To determine the potential contribution of federal institutions to their proposed valued
outcomes, I first specify the governance structure for a sample of 73 countries for the sample period
1965-2000 and then relate that structure to each country’s proposed measures for federal values. The
results here should be viewed as “reduced form” results suggestive of the potential for federal
institutions broadly defined to generate socially valued outcomes. Section IV will step behind this
reduced form analysis to explore how each of the individual institutions of federalism might interact
11
to contribute to overall outcomes observed here.
A. Specifying Federal Governance: What defines a federal state? The word federalism has
its roots in the Latin foedus meaning “league,” “treaty,” or “compact,” and in this sense federal has
come to represent any form of government which brings together, in an alliance, constituent
governments each of which recognizes the legitimacy of an overarching central government to make
decisions on some matters once exclusively the responsibility of the individual member states.
William Riker, perhaps political science’s most careful scholar of federalism, defines federalism as:
(A) political organization in which the activities of government are divided betweenregional governments and a central government in such a way that each kind ofgovernment has some activities on which it makes final decisions (Riker, 1964, p.101).
Montesquieu (1977) and Madison (1982) further stressed that, in addition to multiple tiers of
government with unique responsibilities, the lower-tier state or provincial governments must also
have constitutionally protected representation to the encompassing central government setting
national policies.
For this work, governance is defined along each of these three institutional dimensions:
number of provincial governments (N $ 2 for federal; N = 1 for unitary), policy assignment for the
provision of important government services between central and provincial governments (A = 1 for
federal; 0 for unitary), and constitutionally protected provincial representation to the central
government legislature ( R = 1 for federal; 0 for unitary). Federal governments are defined as having
two or more provinces (N $2) each with substantive policy responsibilities (A = 1) and provincially
elected representation in the central legislature ( R = 1). Unitary governments either lack politically
independent provincial governments (i.e., N = 1) or, if there are provincial or lower tier governments,
10 The most detailed compilation of federal governments is found in Griffiths and Nerenberg (2002),in their comprehensive survey, Handbook of Federal Countries, 2002. All of the countries which meet mycriteria are classified as federal by the Handbook and all of the Handbook’s federal countries are includedin this study.
11 I use locally collected revenues as my measure of decentralization under the belief that ownrevenues carry with them greater local policy discretion. Local expenditures are often dependent uponclosely monitored central government grants-in-aid. As it happens, local revenue shares and localexpenditure shares are highly correlated in this sample (D = .81) and a ranking of countries by the percentof government expenditures done by lower-tier governments gives the same classification of countries asreported in Table 1.
12
those governments either lack independent policy authority (A = 0) or central government
representation ( R = 0). Federal and unitary governments may be either democratic or dictatorial.
Table 1 classifies each of the 73 countries included in this study as either a federal democracy
(denoted FED/DEM = 1 in the empirical analysis), a unitary democracy with significant policy
decentralization called an administratively federal democracy (AFED/DEM = 1), a unitary
democracy without policy decentralization called simply a unitary democracy (UNT/DEM = 1), a
federal dictatorship (FED/DICT = 1), or a unitary dictatorship (UNT/DICT = 1). The 13 countries
classified as federal democracies plus the 11 countries classified as federal dictatorships include all
the of the world’s countries typically classified as federal governments.10 The nine additional
countries I specify here as democratic and administratively federalism are unitary governments (N
= 1 and/or R = 0) but with a significant assignment of policy responsibility to lower-tier (provinces,
counties, cities) governments (A = 1). For purposes of this study, a country qualifies as an
administratively federal democracy if it is democratic and if it ranks in the upper half (quartiles III
and IV) of the sample on the percent of all government revenues raised by lower-tier (not central)
governments averaged over the sample years1965-2000.11 It should be noted that each country’s
revenue share is very stable over the sample period. Constitutionally specified federal democracies
13
(FED/DEM = 1) have a mean local revenue share of .33 while administratively federal democracies
(AFED/DEM) have a mean local revenue share of .34. This is in contrast to the mean local revenue
share for unitary democracies of .12 and for unitary dictatorships of .13; see Table 1. Finally, I
classify a country as a democratic if it is democratic in 2000 and has been classified as democratic
for more than half of the 1965-2000 sample period using the definitions of Prezworski, et. al. (2000)
and updating their results. For Prezworski and his colleagues, the key attribute of a democracy is
holding regular, openly contested elections for national office where an opposition party can assume
office if it wins the election.
Table 2 presents the simple mean performance along each measure of federal values for each
form of governance. On average, government inefficiency is lower and output per worker
significantly higher in federal governments than in dictatorships or even in unitary democracies.
Democratic participation and the likelihood of an orderly transition between governments are both
higher in federal governments as well, particularly so as an improvement over unitary dictatorships.
Economic property rights and political and civil rights are higher too in federal democracies. By
each of our value measures federal governance appears to deliver on its promised federal outcome.
Even on those dimensions where federal governance is typically thought to be counterproductive –
educational opportunities, health outcomes, and economic opportunities as measured by income
equality – federal democracies do best on average. In this first look at least, both constitutional and
administratively federal democracies appear to perform very well. It remains to be seen whether this
favorable impression withstands more careful scrutiny, testing for statistically significant differences
between forms of governance and controlling for other possible causes of valued outcomes.
B. Estimation Strategy: The formal analysis looks for significant statistical correlations

12 The variable (A) used to classify countries as administratively federal is potentially endogenousover the sample period, but two facts hopefully minimize concerns. First, A = 1 is defined by the percentgovernment revenues raised locally which is historically very stable for our sample countries, even beforeour sample years. Thus A = 1 or 0 seems to be describing a fundamental attribute of a country’s publicfinances. Second, allocating countries to A = 1 classification by its sample quartile rankings remove further,possibly (cross-country) endogenous variation. In this sense, quartile rankings arguably serve as a validinstrument for actual percent revenues raised locally.
14
between the five forms of governance and valued federal outcomes using cross-section regressions
of averaged outcomes on governance and selected control variables. As there is little variation over
time in outcome measures and even less in the governance indicators, panel regressions are
inappropriate; valid inferences are only available from the sample’s cross-section variation. Further,
the stability of the governance indicators and the fact that the formal institutions which define
governance have been in place in most of our sample countries well before the start of the sample
period (1965) gives some confidence that the results will be identifying long-run consequences of
what Glaeser, et. al. (2004) call the “deep” or “permanent” features of the institutional landscape.12
Identification of governance’s impacts on outcomes will be done in three steps. Step one
tests for the average contribution of democracy, whether unitary or federal, to valued outcomes
generally as:
1) Q = " + $•X + (•DEM + g,
where Q is a single measure of each of the valued federal outcomes, X is a vector of common
controls, and DEM (= UNT/DEM + AFED/DEM + FED/DEM) = 1 if governance is democratic,
whether unitary, administratively federal, or constitutionally federal. The average gain in Q of
being democratic rather than dictatorial (measured by " + $•X) is the estimated coefficient, (. In
step two, I add the additional institutional variable ALLFEDDEM (= AFED/DEM + FED/DEM) to
the analysis as:
13 Under this specification, the estimated contribution of unitary democracy to the valued outcomeis :, the estimated contribution of adminstrative federalism is 2, and the estimated contribution ofconstitutionally protected federalism is (2 + B). Thus B measures the “value-added” of having N > 1 andR = 1. The estimated marginal contributions of governance to outcomes from eq. (3) are identical to thosewe would have obtained had we run the regression using governance variables UNT/DEM, AFED/DEM, andFED/DEM individually, but specification here gives an easily observed test for the difference between thecontributions of AFED/DEM and FED/DEM.
15
2) Q = " + $•X + (•DEM + 2•ALLFEDDEM + g,
where ( continues to measure the average contribution to the valued outcome of democracy above
that of a dictatorship (" + $•X) and now 2 measures the average additional contribution, beyond
being a democracy, that federal institutions allow. Finally, step three, provides a full decomposition
of the contribution of democratic governance to valued outcomes, estimated as:
3) Q = " + $•X + :•UNT/DEM + 2•ALLFEDDEM + B•FED/DEM + g,
where : measures the unique contribution of unitary democracy, 2 measures the average
contribution of the two forms of federal governance, and B the additional contribution of being a
constitutional federal democracy beyond that which comes from being federal democracy with
strongly decentralized policy assignment (A = 1). Again we are estimating the contribution of the
three democracies above that available with dictatorship (" + $•X). The statistical significance of
B provides a direct test of the value of adding constitutional protections for lower-tier governments
(N > 1, R = 1) to policy decentralization (A = 1) alone.13
Knowing if the formal institutions of federalism – provinces and provincial representation
to the central government – contribute significantly to the performance of federal governance is
important for at least two reasons. First, if B is statistically or quantitatively unimportant, then
established unitary democracies will be able to achieve most of the substantive benefits of federalism
without re-configuring their formal institutions of governance. A policy decision to decentralize,
14 A practical example of such a decision is the current debate in the United States over the efficacyof the U.S. Supreme Court’s efforts to weaken the influence of Congress over public policies and tostrengthen the role of U.S. states. Rapaczynski (1985) sees value in these efforts as he expects B will bestatistically and quantitatively significant in the political and civil rights (POL/CIV) equation. Feeley andRubin (1994) argue strongly that B is zero in all the valued outcome equations and thus the Court’s effortsare seriously misplaced. The results here offer some empirical guidance to resolving this debate.
16
as recently pursued by Sweden, will be sufficient. Second, if B is insignificant, then new
democracies can adopt federal or unitary governance solely to maximize the likelihood of a
successful democratic transition without worry that the chosen institutions of governance will
constrain future valued outcomes. But if B is important, constitutional choices must be made. In
this case, knowing the potential contribution of provinces and central representation to valued
outcomes – that is, having estimates of B – is a first step towards making these important
institutional decisions.14
For the initial estimates, two control variables (X) are included in each cross-country
regression: the absolute value in latitude as measure of the country’s distance from the equator
(ABSLAT) and the number of years beginning in 1800 that country has been independent of colonial
rule (YRS/IND). ABSLAT serves as a control for the country’s location and climate and has proven
to be an important fundamental determinant of economic growth, incomes, and a country’s colonial
legacies; see Gallup and Sachs (1998) and Acemoglu, Johnson, and Robinson (2001). YRS/IND is
meant to control for a country’s modern experience with alternative institutional structures, allowing
for the possibility of finding overtime stable informal strategies to overcome the inefficiencies or
inequities of formal, or constitutional, rules; see North (1990). There is a plausible list of additional
demographic, legal, political, and cultural controls which might be added to each outcome equation
and in Section D below I test for the sensitivity of the core results to the inclusion of these additional
controls. Estimation of each equation is by OLS, equivalent in this case to seemingly unrelated
17
regression (SUR). Coefficient estimates are therefore efficient.
C. Results: Table 3 reports estimates for equations (1)-(3) for the impact of governance on
each of the seven measures of valued outcomes and for each of the four measures of economic
opportunity and fairness thought to be potential costs from adopting federal governance. The
reported results reveal the potential contribution of each institutional structure, now controlling for
a country’s geography and years of independence and their correlates. ABSLAT and YRS/IND are
always positively and significantly correlated with a valued outcome, except for YRS/IND in the
LEGALTRAN and GINI regressions where the estimated effects are marginally negative. (ABSLAT
AND YRS/IND results are not reported, but available upon request.)
Five general conclusions are evident from the results in Table 3. First, from the eq. (1)
specification we see moving from dictatorship to democracy is never harmful and is often associated
with very significant improvements in valued social outcomes. The coefficient on DEM measures
the potential gain over dictatorships. For comparisons, I evaluate the relative improvement from
being a democracy for the country with the average values of ABSLAT (= 29°) and YRS/IND (= 118
years). The percentage improvement in a performance measure between democracies and
dictatorships where the outcome difference is statistically significant is: 28% lower public sector
corruption (TICORRUPT), 82% higher output per worker (Y/L), 8% improvement in the rate of
legal transitions in executive leadership (LEGALTRAN), 22% improvement in the index of
economic property rights (GADP), 116% improvement in the index of political and civil rights and
liberties (POL/CIV), 28% increase in the average years of education (YRS/ED), 16% improvement
15 Percentage improvements were calculated in two steps: 1) estimate the average performance fora dictatorship evaluated at the mean value of ABSLAT ( = 29°) and YRS/IND (=118 years) inclusive of theregression’s constant term, and then 2) add the estimated coefficient for DEM to the computed value fordictatorship to compute the average performance of a democracy. The ratio of democracy to dictatorshipperformance then gives the percentage improvement. For example, the average dictatorship performancefor TICORRUPT is 6.08 and that for democracy is 6.08 - 1.71 = 4.37. The percentage improvement is4.37/6.08 = .72 or a 28% improvement (decline). A simpler procedure, but one which fails to control forABSLAT and YRS/IND, would be to just add the estimated coefficient for democracy from each equationto the mean value for that outcome measure for either unitary or federal dictatorships from Table 2, and thencompute the performance ratio.
16 In this case the percentage improvements were evaluated in three steps: 1) estimate the averageperformance for the dictatorship at the mean value of ABSLAT and YRS/IND using estimates fromspecification for eq. (2); 2) add to that estimate the additional impact of DEM from the estimates in Table3 for eq. (2); and finally, 3) add to those estimates the added gains from ALLFEDDEM as reported for eq.(2) in Table 3. The percentage improvements reported here are for the gains from moving from DEM aloneto DEM plus ALLFEDDEM.
18
in relative educational opportunity for women (EQ/ED), 10% greater life expectancy (LIFEXP).15
Second, from estimates for eq. (2)in Table 3 we see adding one or more federal institutions
significantly improves country performance over that available from being a unitary democracy in
three instances: output per worker (Y/L), protection of economic property rights, and protection of
political rights and civil liberties. Now we can compute the relative improvement in performance
from adding federal institutions to a unitary democracy. Again, evaluating relative performance for
mean values of ABSLAT and YRS/IND, we find that federal institutions generally add an additional
43% to a country’s performance in output/worker (Y/L) above the gains from democracy alone, 13%
to democracy’s performance for property rights (GADP), and 25% to democracy’s performance in
protecting political and civil rights (POL/CIV).16 These results highlight the importance of federal
institutions and/or policy decentralization for rights protection and then the gain that rights protection
offers a society in economic welfare. Section IV examines these connections in greater detail.
Third, estimates of eq. (3) in Table 3 reveal the contribution to our valued outcomes of policy
decentralization (A = 1) alone relative to being decentralized and having constitutionally established
19
provinces (N > 1) with central representation ( R = 1). If the variable FED/DEM is positive and
significant along with ALLFEDDEM, then formal institutions (N >1, R = 1) strengthen the
contribution of policy decentralization. Table 3 shows FED/DEM is never significant once policy
decentralization has been included in the analysis. This does not mean that federal institutions are
unimportant to federal government performance, however. In Section IV, we will find that
provincial governments play an crucial role in protecting policy decentralization in democracies.
Their impact is just one step removed.
Fourth, dividing dictatorships into unitary and federal dictatorships and re-estimating eq. (3)
for all valued outcomes shows the performance of federal and unitary dictatorships differs for only
two outcomes: federal dictatorships (FED/DICT = 1; see Table 1) have a higher rate of legal
executive transitions (LEGALTRAN) and a significantly lower level of economic inequality (GINI);
see Table 3. FED/DICT was insignificant in all other regressions. It is not unreasonable to think
the two significant reduced form results might be causally connected. Importantly, however, adding
policy decentralization and/or federal institutions to a dictatorship has no observable consequence
for a country’s economic efficiency or rights performance. Much has been said about China’s policy
decentralization and its recent economic performance (see Jin, Qian, and Weingast, 2005), but there
is no evidence here that this story generalizes to other dictatorships. The results in Table 3 are
unaffected if I exclude China from the sample or if I re-classify China as a federal, rather than a
unitary, dictatorship. (Results available upon request.) For this sample, it appears that federalism
only matters in democracies.
Fifth, the potential costs of federal institutions to economic opportunity (YRS/ED; ED/ED;
LIFEXP) or economic fairness (GINI) are not observed in this sample. Federal democracies appear

20
to use central government fiscal policies to equalize economic prospects much as do unitary
democracies. Only under dictatorial rule do federal institutions affect fairness, and here the effects
are positive. In dictatorships provincial governments may provide a political voice for equalizing
economic opportunity (GINI) not found in unitary dictatorships. These results must be interpreted
with care, however. They are reduced form estimates, not structural estimates of a constraint-based
frontier between possibly competing values of federalism, as conjectured, for example, in Inman and
Rubinfeld (1997). We cannot distinguish between the case where there are in fact no trade-offs
along a value frontier from the case where outcomes are chosen along federally-induced outward
shifting value frontiers. That said, however, the results remain encouraging for democratic countries
considering decentralized governance.
D. Robustness: There are at least three sources of bias that must be addressed before
accepting the core results of Table 3: That some countries’ governance structures may be mis-
classified; that important omitted variables may be responsible of the observed correlations between
governance institutions and values; and that the causal connection is not from institutions to valued
outcomes, as hypothesized by the federalism literature, but rather is from outcomes to institutions.
I have evaluated each in turn and summarize the results briefly here.
First, when setting the governance classifications reported in Table 1, I made three judgement
calls. Following the decisions of other scholars (e.g., Griffiths and Nerenberg, 2002) I classified
China as a unitary dictatorship rather than a federal dictatorship as characterized by Weingast in his
important work on market preserving federalism (Jin, Qian, and Weingast, 2005). Next, I classified
Venezuela as a federal democracy rather than a unitary democracy, despite the fact that its share of
government revenues raised locally (only .05; see Table 1) would better fit my assignment definition

17 Nor were the results affected by a re-specification of assignment using the share of governmentexpenditures done locally rather than as here the share of government revenues raised locally; see fn. 11above.
18 Again the details available upon request.
21
for unitary governance. Finally, I did not classify Ecuador, Greece, and Iceland as administratively
federal democracies, calling each a unitary democracy despite the fact that their shares of
government revenues raised locally (.19, .21, .26, respectively; Table 1) do meet my definition of
administrative federalism. To be sure that the results in Table 3 were not significantly affected by
these choices, I redid the analysis in Table 3 assigning the alternative classification for each country.
The statistical and quantitative importance of governance institutions were unaffected.17
Second, bias may arise because an important variable correlated with governance and
outcomes is omitted from the list of core controls. The historical and theoretical literature on the
emergence of democratic and federal governance suggests six sets of additional controls:18
• Ethnic, religious, or language fractionalization of a country might encourage theadoption of federal governance but at the same time, because of unmeasured latentconflicts, reduce the likelihood of achieving valued outcomes; see Alesina andLaFerrara (2005). If so, the estimated coefficients for ALLFEDDEM or FED/DEMwould be biased towards finding no effect of federalism on outcomes. I re-estimatedall the equations of Table 3 individually adding Alesina, et. al.’s (2003) and Fearon’s(2003) indices for ethnic, then religious, then language differences to each valueequation. The fractionalization indices themselves were occasionally significant – forexample, positively impacting economic, political, and civil rights as Madison inFederalist 10 conjectured – but their inclusion did not significantly affect theestimates in Table 3 for the effects of governance on outcomes.
• A country’s culture may define the fundamental values or preferences of itscitizens which in turn jointly impact a valued outcome and the decision to adopt aparticular form of governance. For example, the protestant ethic is seen to fosterhigh savings, high work effort, a commitment to individual rights, and rewards basedon merit; see Weber (1958). These values are also seen to foster democraticgovernance and a tolerance of, if not a preference for, local government; see deTocqueville (1969; Part I). As a result protestant countries should have strong
22
economic performance and favorable rights performance as well as democratic, andperhaps decentralized, governance. Catholicism’s historical emphasis on strongcentral governance and obedience (Beer, 1993), and more recently, democracy andeconomic equality (Huntington, 1991) suggest these countries are more likely to bedemocratic and unitary as well as more egalitarian. Finally, Muslim societies areseen as strongly centralized and repressive, particular with respect to women’s rights;see Landes (1998). In these countries, governance will be dictatorial and outcomesmay be less egalitarian and rights and opportunities more restricted. In each instance,omitting a good measure of a country’s culture is likely to lead to an overestimate ofthe effect of democratic and federal governance on favored outcomes. Here Imeasure culture by the majority religion in each of my sample countries; countrieswithout a single dominant religion are considered multi-cultural; see La Porta, et. al.(1999). Culture matters. The Muslim control is significantly negative and thecoefficient on democracy, though still positive, becomes statistically insignificant inthe YRS/ED and EQ/ED equations. There are no effects of including the culturalcontrols on the estimated coefficients for ALLFEDDEM and FED/DEM.
• A country’s natural resource endowment, particularly if geographicallyconcentrated, may lead to significant interregional conflict as, for example, in Nigeria(Suberu, 2001); federalism with regional redistribution might mitigate such conflicts(Boix, 2003, Chapter 4). Here the bias from omitting a measure of natural resourcesis likely to lead to an over estimate of the impact of ALLFEDDEM and FED/DEM.I adopt as my measure of a country’s resource endowment the percent of GDP arisingfrom the extraction industries (Hall and Jones, 1999). A country’s natural resourceendowment was never significant and there were no effects on the governancecoefficients from the inclusion of this variable.
• A country’s colonial origins is thought to influence its modern form of governanceand subsequently its current economic performance; see Acemoglu, Johnson, andRobinson (2001) and Hall and Jones (1999). Of particular interest here is thepossible influence of a British colonial past; Britain used administrative federalismin many of its colonies as a way to control ethnic or religious conflicts. When thosecountries became independent the original administrative provinces or states oftenremained in place as lower-tier governments – for example, Australia, Canada, India,Malaysia, Nigeria, Pakistan, Tanzania, and the United States. The control variablefor British colonial origins was nearly always insignificant in the outcome equations– the exceptions were a significant positive effect on GADP and YRS/ED – and itsinclusion had no effect on the governance results in Table 3.
• A country’s legal origins is argued by LaPorta, et. al. (1999) to have importanteffects on a country’s government efficiency and rights performance. A country’schoice of a legal system and its choice of governance are typically madesimultaneously. They find Socialist and French legal origins correlate with
19 In particular, decentralized parliamentary democracies improve Y/L by .096 (.06), GADP by .07(.04), and POL/CIV by .07 (.07) while decentralized majority rule democracies improve this performanceby an additional .14 (.08) for Y/L, .09 (.06) for GADP, and .15 (.09) for POL/CIV. Since the separate effectsare all not quite significant but the joint effects are, I continue to use the average effects reported in Table3 as my core estimates. A recent paper by Enikolopov and Zhuravskaya (2006) also tests the Rikerconjecture, and they too find some evidence in its favor.
23
dictatorial and unitary governance, weaker personal rights performance, but strongerperformance on education opportunities. Omitting measures of legal originstherefore suggests a possible upward bias to Table 3 estimates of democratic andfederal governance’s impacts on rights but a downward bias on access to economicopportunities. I therefore included the La Porta et. al.’s indicator variables forEnglish, French, German, Scandinavian, or Socialist legal origins in the core outcomeequations, both individually and as a set. I find results comparable to those reportedby La Porta, et. al. on rights performance and because of the importance of rightsprotection for economic performance a strong negative effect of socialist legalorigins on Y/L. Again, however, the core estimates for DEM and ALLFEDDEM inTable 3 remain in place.
• The new political economy suggests a country’s choice of its electoral process willhave important effects on fiscal policies and through fiscal policies on private sectoreconomic performance; Przeworski, et. al. (2000) provide the needed data. Perssonand Tabellini (2004), for example, find beneficial effects of majority rule governancefor fiscal efficiency and economic growth. The literature on federalism stresses theimportance of electoral systems, in particular strong party governance, for protectionof decentralized governance; see Riker (1964). Direct measures of party strength arenot available, but by Duverger Law majority rule governance and presidentialsystems are generally seen to favor fewer, and presumably stronger, parties. Here theomitted variable would be the interaction of our federalism measures with majorityelectoral rules, expected to have a favorable effect on outcomes. This is exactly whatwe observe for the three important cases in Table 3 where both DEM andALLFEDDEM are significant – Y/L, GADP and POL/CIV. For these outcomemeasures, majority rule governance strengthens the influence of assignmentdecentralization over that seen in parliamentary democracies just as Rikerconjectured.19
I conclude the core results in Table 3 remain in place with the inclusion of these additional controls,
with one important exception. Estimating the effect of democracy on the level and distribution of
education may be biased upward if a control for a country’s predominance as a Muslim nation is not
included in the specification.
20 See Panizza (1999) and Arzaghi and Henderson (2005). The endogenous variable ALLFEDDEMis a (0,1) variable. The results in Table 4 use the predicted values for ALLFEDDEM from the first-stageequation as the second-stage instrument rather than the implied (0,1) value, a specification that assumesoutcomes are chosen in response to the likelihood that governance will be “federal-like” in its effects. Thequalitative results and significance were similar when I converted the first-stage estimates into a predicted(0,1) value for the second-stage. See Maddala (1984, pp. 242-247).
I also used an alternative strategy as robustness check for my definition of ALLFEDDEM. Omittedvariables correlated with local revenue shares may mean I have mis-classified some countries as AFED/DEMwhen then should have been UNT/DEM and conversely. This problem would arise for those countries rightat the dividing line between the II and III quartiles in the distribution of percent revenue raised locally – thatis, for France, Italy and the Netherlands now in AFED/DEM and Greece, Iceland, and Ecuador now inUNT/DEM. I reversed the classifications and re-estimated all value equations. The effects of ALLFEDDEMand UNT/DEM on valued outcomes all fell slightly, but significance remained.
24
While the results above are reassuring as to possible bias, we cannot rule out the possibility
that there still remains some unmeasured omitted variable that might be generating the positive
correlations between governance and outcomes in Table 3. Controlling for this possibility requires
the use of instrumental variables (IV) estimation. Table 4 (cols. IV) present IV estimates for our core
relationship between valued outcomes and the two institutional variables, DEM and ALLFEDDEM.
DEM measures the contribution of democracy (above dictatorship) to value performance and
ALLFEDDEM measures the additional contribution above democracy from either constitutional
(FED/DEM) or administrative federalism (AFED/DEM). The most likely source of bias is a possible
correlation of an omitted variable with the percent of revenues raised locally, the variable used to
define administrative federalism and thus ALLFEDDEM. I instrument for ALLFEDDEM using two
(assumed exogenous) constitutional variables, number of provinces (N) and provincial representation
to the central government ( R), and country land area.20 The F statistic for the significance of the
three instruments in the first-stage estimates of ALLFEDDEM is F3,66 = 4.69. Though as a group the
three instruments are significant at the .01 level of confidence, they are “weak” by current standards
requiring F statistics > 10; see Bound, Jaeger, and Baker (1995). Still the results in Table 4 offer
21 Hahn-Hausman (2005) specify the ratio [Bias(2SLS)/Bias(OLS)] .R/n@R2(Adj), where R is thenumber of instruments (=3), n is the sample size for the first stage regression (= 73), and R2(Adj) is theadjusted R2 from the first stage regression (= .55): [Bias(2SLS)/Bias(OLS)] .3/73A.55 = .08.
22 Excluded from the analysis are Botswana, Brazil, Bulgaria, Chile, Colombia, Czechoslovakia,Ecuador, Ghana, Greece, Honduras, Nicaragua, Nigeria, Pakistan, Panama, Papau New Guinea, Peru,Portugal, Russia, South Africa, Spain, Vietnam, Zambia, and Zimbabwe.
25
a plausible improvement to any omitted variable bias in the OLS estimates in Table 3; the Hahn-
Hausman (2005) approximation for the ratio of bias in the 2SLS estimates relative to the OLS
estimates is about .10 with these three instruments.21 Table 4's IV results continue to support the
view that federal institutions enhance federal values, and in several instances (GC6589, Y/L,
LEGALTRAN, GADP) the estimated coefficients suggest an even stronger effect of federalism on
values than reported in Table 3.
There remains a final concern – that the constitutionally specified institutions themselves
(DEM, N, and R) are endogenous. Recent research strongly suggests a country’s decision to be
democratic or to adopt a federal constitution is largely idiosyncratic, ruling out any compelling IV
strategy; see Acemoglu, et. al. (2007). Lacking instruments, an alternative strategy is to limit the
sample to those countries where the institutions of governance have been long established, and thus
not plausibly “caused by” current sample period outcomes. Table 4 (cols. EST. GOV.) repeats the
core regressions for the full set of democratic institutions – ALLFEDDEM, FED/DEM, and
UNT/DEM – using a sample limited to the fifty countries whose current constitutions were written
before 1950.22 First, democratic institutions remain important in this restricted sample,
outperforming dictatorships in limiting corruption (TICORRUPT), providing high output per worker
(Y/L), the orderly transfer of executive power (LEGALTRAN), protecting economic (GADP) and
political and civil (POL/CIV) rights, and in providing education (YRS/ED) to both men and women
23 Standard errors are within parentheses, and an * indicates significance at the .05 level. The resultsare similar for a sample of democracies only. The institution variables, N and R, have the following samplemeans and standard deviations: FULL SAMPLE: Mean N = 9.69 (14.97); Mean R = .34 (.48); FEDERALSAMPLE: Mean N = 16.84 (18.87)); Mean R = .73 (.45); FED/DEM SAMPLE: Mean N = 20.38 (12.41);Mean R = 1.00 (.00).
26
(EQ/ED). Second, federal democracies do at least as well as unitary democracies in providing these
valued outcomes and sometimes significantly better, particularly so in protecting economic rights
and providing high output per worker.
IV. What Role for Federal Institutions?
The core results of Table 3 found that federalism’s unique contribution to valued outcomes
could be achieved in either of two ways: First, by being a constitutionally established federal
democracy (FED/DEM), or second, by adopting significant fiscal decentralization yet remaining a
unitary democracy (AFED/DEM). The results in Table 3 found no statistically significant difference
between the performance of these two governance structures. Is there any reason then to adopt a
federal constitution? The answer is yes, and it is found in the ability of the formal institutions to
protect the informal institution of policy decentralization. Regressing the average local share of
government revenues (LOCREV) for our sample period on DEM, FED/DEM, and country controls
shows:23
LOCREV = .05 + $(ABSLAT, YRS/IND) -.04@DEM + .13@FED/DEM, R2(Adj) = .29. (.04) (.05) (.05)*
The individual role of each federal institution is seen when N and R replace FED/DEM:
LOCREV = -.02 + $(ABSLAT, YRS/IND) -.03@DEM + .007@N + .03@R , R2(Adj) = .56. (.03) (.04) (.001)* (.04)
The results are nearly identical if the local revenue share equation is estimated for a sub-sample of
democracies alone. What federal institutions provide, particularly the creation of provinces as

24 Provincial leaders, even if they lack direct representation to the central government, appear tohave sufficient informal political influence to protect their local policy domains. This conclusion has directrelevance to the recent constitutional debates in the United States as to how best to protect the valuedoutcomes of federalism. The Supreme Court in Printz v. United States argues that the states as separategovernments must be protected, while Wechsler (1954), Choper (1980) and the Court in its earlier decisionin Garcia v. San Antonio Metropolitan Transit Authority argued that state representation to the U.S. Senatewould be sufficient protection. The international evidence presented here supports the Court’s currentposition.
25 Estimates of the influence along each path in Figure 1 was by OLS, again controlling forABSLAT and YRS/IND. The individual links were also estimated by IV, using N, R, and country land areaas instruments for LOCREV in the GADP and POL/CIV equations, and then N, R, area, British legal origins,and being a Muslim nation as instruments for GADP and POL/CIV in the Y/L, LIFEXP, and ED/EQequations. The IV estimates for each linkage are statistically significant and tell the same qualitative storyas presented in Figure 1.
26 Krueger and Schkade (2007) find such indices do measure plausible differences in citizen well-being. The life satisfaction index used here has a maximum value of 10 representing “extremely satisfied.”For this sample, the index’s mean is 6.46 (S.D. = 1.03). Reduced form estimates of the contribution of DEMand ALLFEDDEM to life satisfaction (LIFE/SAT) for this sample of countries shows:
LIFE/SAT = 5.70 + .009@ABSLAT + .701@DEM + .408@ALLFEDDEM, R2(Adj) = .32 (.21) (.007) (.274)* (.292)
Standard errors within parentheses.
27
constitutionally protected political jurisdictions, is protection for policy decentralization.24 What
policy decentralization provides is valued federal outcomes.
Finally, estimates for one plausible structural connection from federal institutions to valued
federal outcomes is shown in Figure 1.25 First, institutions promote policy decentralization. Then
democracy plus policy decentralization act to protect economic property rights (GADP) and political
and civil rights (POL/CIV). Rights protection in turn increases country output per worker (Y/L).
Output per worker enhances life expectancy (LIFEXP) and educational opportunity (EQ/ED). In
the end citizens appear to be happier, at least as ranked by the Friends of the Earth’s (2006)
composite index of life satisfaction, under democratic federalism because of federal institutions’
favorable impacts on valued federal outcomes.26
In a related paper, Frey and Stutzer (2000) asked if federal institutions might also make a direct (i.e.,structural) contribution to citizen welfare beyond their instrumental contribution as shown in Figure 1.Adding DEM and ALLFEDDEM along with LIFEXP, Y/L, ED/EQ to the structural estimation of LIFE/SATshows both variables are statistically insignificant. For this sample at least, institutions only matter tocitizens because of their substantive contribution to income, health, and opportunity.
28
V. Conclusions
Federal governance has been long been embraced by political philosophers, legal scholars,
and economists for its ability to encourage political participation, to protect personal rights and
liberties, and to promote public and private sector economic efficiency. Policy-makers today, both
in new and established democracies, seem equally enamored. This paper provides some initial
evidence as to the ability of federal institutions to deliver on this promised agenda by comparing
country performance on each of eleven valued outcomes for a sample of 73 countries, including the
generally recognized thirteen federal democracies and eleven federal dictatorships. As with any
cross-country analysis, cautious use of these results is recommended. Three conclusions, however,
seem worth emphasizing.
First, whether formally established by constitutional provision or informally implemented
by a central government decision, decentralized governance does have a unique contribution to make
to a society’s ability to enforce property rights, to protect political and civil rights, and then because
of such rights protections, to enhance private sector economic performance. Second, while policy
decentralization is the key to federalism’s strong rights and economic performance and can be
achieved within a unitary government by fiat, constitutionally established provincial (or state)
governments provide an extra and important protective barrier for policy decentralization. Federal
institutions protect policy decentralization, and policy decentralization provides federalism’s valued
outcomes. Third, federalism needs democracy. There is no evidence from this sample that adding
policy decentralization or provinces to a dictatorship significantly improves a dictatorship’s rights
29
or economic performance.
Finally, though we have no evidence on the point here, federalism’s greatest contribution
may come from its ability to enhance the transition to democracy itself. The empirical analysis
makes clear the very significant advantages democratic societies hold over dictatorships on most all
of our measured dimensions of societal performance. But to move peacefully from a dictatorship to
a democracy will typically require protections for the economic interests and civil rights of the once
ruling elite. It is here that federal governance seems to have its institutional comparative advantage
and, once recognized (as in Figure 1), may offer federalism’s greatest potential for improving
societal welfare.
30
REFERENCES
Acemoglu, D., S. Johnson, and J. Robinson (2001), “The Colonial Origins of ComparativeDevelopment,” American Economic Review, Vol. 91, December, 1369-1401.
Acemoglu, D., S. Johnson, and J. Robinson (2004), “Institutions as the Fundamental Cause of LongRun Growth,” in P. Aghion and S. Durlauf (eds.), Handbook of Economic Growth,Amsterdam: North-Holland.
Acemoglu, D., et. al. (2007), “Re-Evaluating the Modernization Hypothesis,” NBER WP No. 13334.
Alesina, et. al. (2003), “Fractionalization,” Journal of Economic Growth, Vol. 8, June, 155-194.
Arzaghi, M. and V. Henderson (2005), “Why Countries are Fiscally Decentralizing,” Journal ofPublic Economics, Vol. 89, July, 1157-1189.
Bardhan, P. and D. Mookherjee (2000), “Capture and Governance at Local and National Levels,”American Economic Review, Vol. 90, May, 135-139.
Barro, Robert and Jon-Wha Lee (2000), “International Data on Educational Attainment: Updates andImplications,” CID Working Paper No. 42.
Beer, S., The Foundations of Federalism (1993), Cambridge, MA: Harvard University Press.
Besley, T. and A. Case (1995), “Incumbent Behavior: Vote-Seeking, Tax-Setting, and YardstickCompetition,” American Economic Review, Vol. 85, March, 25-45.
Besley, T. and S. Coate (2003), “Centralized versus Decentralized Provision of Local Public Goods:A Political Economy Approach,” Journal of Public Economics, Vol. 87, December, 2611-2637.
Boix, C. (2003), Democracy and Redistribution, Cambridge: Cambridge University Press.
Bound, J., A. Jaeger, and R. Baker (1995), “Problems with Instrumental Variables Estimation Whenthe Correlation Between Instruments and the Endogenous Explanatory Variable is Weak,”Journal of the American Statistical Association, Vol. 90, June, 443-450.
Brueckner, J. (2006), “Fiscal Federalism and Economic Growth,” mimeo, University of California,Irvine.
Brennan G. and J. Buchanan (1980), The Power to Tax: Analytical Foundations of a FiscalConstitution, Cambridge: Cambridge University Press.
Coate, S. and M. Conlin (2004), “A Group Rule-Utilitarian Approach to Voter Turnout: Theory andEvidence,” American Economic Review, Vol. 94, December, 1476-1504.
31
Choper, J. (1980), Judicial Review and the National Political Process, Cambridge: HarvardUniversity Press.
Dahl, R (1998), On Democracy, New Haven: Yale University Press.
Deininger, K. and L. Squire (1996), “A New Data Set Measuring Income Inequality,” World BankEconomic Review, Vol. 10, No. 3, 565-591.
de Tocqueville, A. (1969), Democracy in America, New York: Anchor Books.
Enikolopov, R. and E. Zhuravskaya (2006), “Decentralization and Political Institutions,” mimeo.
Fearon, J. (2003), “Ethnic and Cultural Diversity by Country,” Journal of Economic Growth, Vol.8, June, 195-222.
Feddersen, T. and A. Sandroni (2006), “A Theory of Participation in Elections,” American EconomicReview, Vol. 96, September, 1271-1282.
Frey, B. and A. Stutzer (2000), “Happiness, Economy, and Institutions,” Economic Journal, Vol.110, October, 918-938.
Friedman, B. (1997), “Valuing Federalism,” Minnesota Law Review, Vol. 82, December, 317-412.
Gallup, J. And J. Sachs (1998), “Geography and Economic Development,” in B. Pleskovic and J.Stiglitz, Annual World Bank Conference on Development Economics, 1998, Washington,D.C.: The World Bank, 127-170.
Glaeser, E., R. LaPorta, F. Lopez-de-Silanes, and A. Shleifer (2004), “Do Institutions CauseGrowth?” Journal of Economic Growth, Vol. 9, September, 271-303.
Griffiths, A. and K.. Nerenberg (2002), Handbook of Federal Countries, 2002, Montreal: McGill-Queen’s University Press.
Hall, R. and C. Jones (1999), “Why Do Some Countries Produce So Much More Output per Workerthan Others?” Quarterly Journal of Economics, February, 83-116.
Hahn, J. and J. Hausman (2005), “Instrumental Variable Estimation with Valid and InvalidInstruments,” Mimeo., M.I.T..
Hatfield, J. (2006), “Federalism, Taxation, and Economic Growth,” Stanford University, GraduateSchool of Business, WP No. 1929.
Huntington, S. (1991), The Third Wave, Norman: University of Oklahoma Press.
32
Inman, R. and M. Fitts (1990), “Political Institutions and Fiscal Policy: Evidence from the U.S.Historical Record,” Journal of Law, Economics, and Organization, Vol. 6, December(Special Issue), 79-132.
Inman, R. and D. Rubinfeld (1997), “Making Sense of the Antitrust State-Action Doctrine:Balancing Political Participation and Economic Efficiency in Regulatory Federalism,” TexasLaw Review, Vol. 75, May, 1204-1299.
Jin, H., Qian Y., and B. Weingast (2005), “Regional Decentralization and Fiscal Incentives:Federalism Chinese Style,” Journal of Public Economics, Vol. 89, September, 1719-1742.
Krueger, A. And D. Schkade (2007), “The Reliability of Subjective Well-Being Measures,” NBERWP No. 13027.
La Porta, et. al. (1999), “The Quality of Government,” Journal of Law, Economics, andOrganization, Vol. 15, Spring, 222-279.
Landes, D. (1998), Wealth and Poverty of Nations, New York: W. W. Norton.
Maddala, G. S., Limited Dependent and Qualitative Variables in Econometrics, Cambridge:Cambridge University Press.
Madison, J. (1982), The Federalist Papers, New York: Bantam Books.
Montesquieu, B. (1977), The Political Theory of Montesquieu, M. Richter (ed.), Cambridge:Cambridge University Press.
Musgrave, R. (1959), The Theory of Public Finance: A Study in Public Economy, New York:McGraw-Hill Book Company, Inc.
Myerson, R. (2006), “Federalism and Incentives for Success of Democracy,” Quarterly Journal ofPolitical Science, Vol. 1, No. 1, 3-23.
North, D. (1990), Institutions, Institutional Change, and Economic Performance, Cambridge, U.K.:Cambridge University Press.
Oates, W. (1972), Fiscal Federalism, New York: Harcourt, Brace, Jovanovich.
Oates, W. (1999), “An Essay on Fiscal Federalism,” Journal of Economic Literature, Vol. 37,September, 1120-1149.
Palfrey, T. and H. Rosenthal (1984), “Participation and the Provision of Discrete Public Goods: AStrategic Analysis,” Journal of Public Economics, Vol. 24, July, 171-193.
33
Panizza, U. (1999), “On the Determinants of Fiscal Centralization: Theory and Evidence,” Journalof Public Economics, Vol. 74, October, 97-139.
Pateman, C. (1970), Participation and Democratic Theory, Cambridge: Cambridge University Press.
Persson, T. and G. Tabellini (2004), “Constitutional Rules and Fiscal Policy Outcomes,” AmericanEconomic Review, Vol. 94, March, 25-46.
Przeworski, Adam, Michael Alvarez, José Cheibub, and Fernando Limongi (2000), Democracy andDevelopment: Political Institutions and Material Well-Being in the World: 1950-1990, NewYork: Cambridge University Press.
Rapaczynski, A. (1985), “From Sovereignty to Process: The Jurisprudence of Federalism AfterGarcia,” Supreme Court Review, Vol. 1985, 341-419.
Riker, W. (1964), Federalism: Origin, Operation, Significance, Boston: Little-Brown.
Rodrik, D. (2006), “Goodbye Washington Consensus, Hello Washington Confusion? A Review ofthe World Bank’s Economic Growth in the 1990's: Learning from a Decade of Reform,”Journal of Economic Literature, Vol. 44, December, 973-987.
Rubin, E. and M. Feeley (1994), “Federalism: Some Notes on a National Neurosis,” UCA LawReview, Vol. 41, April, 903-952.
Sen, A. (1999), Development as Freedom, New York: Random House.
Shleifer, A. and R. Vishny (1993), “Corruption,” Quarterly Journal of Economics, Vol. 108, August,599-617.
Stigler, G. (1957), “The Tenable Range of Functions of Local Government,” in Joint EconomicCommittee, U.S. Congress, Federal Expenditure Policy for Economic Growth and Stability,Washington, D.C.: Government Printing Office.
Suberu, R. (2001), Federalism and Ethnic Conflict in Nigeria, Washington, D.C.: United StatesInstitute of Peace Press.
Tavares, J. and R. Wacziarg (2001), “How Democracy Affects Growth,” European EconomicReview, Vol. 45, August, 1341-1378.
Tiebout, C. (1956), “A Pure Theory of Local Expenditures,” Journal of Political Economy, Vol. 64,October, 416-424.
Treisman, D. (2000), “The Causes of Corruption: A Cross-National Study,” Journal of PublicEconomics, Vol. 76, June, 399-457.
34
Wacziarg, R. (2002), “Review of Easterly’s The Elusive Quest for Growth,” Journal of EconomicLiterature, Vol. 40, September, 907-917.
Weber, M. (1958), The Protestant Ethic and the Spirit of Capitalism, New York: Charles Scribner’sSons.
Wechsler, H. (1954), “The Political Safeguards of Federalism: The Role of the States in theComposition and Selection of the National Government,” Columbia Law Review, Vol. 54,April, 543-560.
Weingast, B. (1995), “The Economic role of Political Institutions: Market-Preserving Federalismand Economic Development,” Journal of Law, Economics, and Organizations, Vol. 11,Spring, 1-31.
Weingast, B. (2006), “Second Generation Fiscal Federalism: Implications for DecentralizedDemocratic Governance and Economic Development,” Mimeo. Hoover Institution, StanfordUniversity.
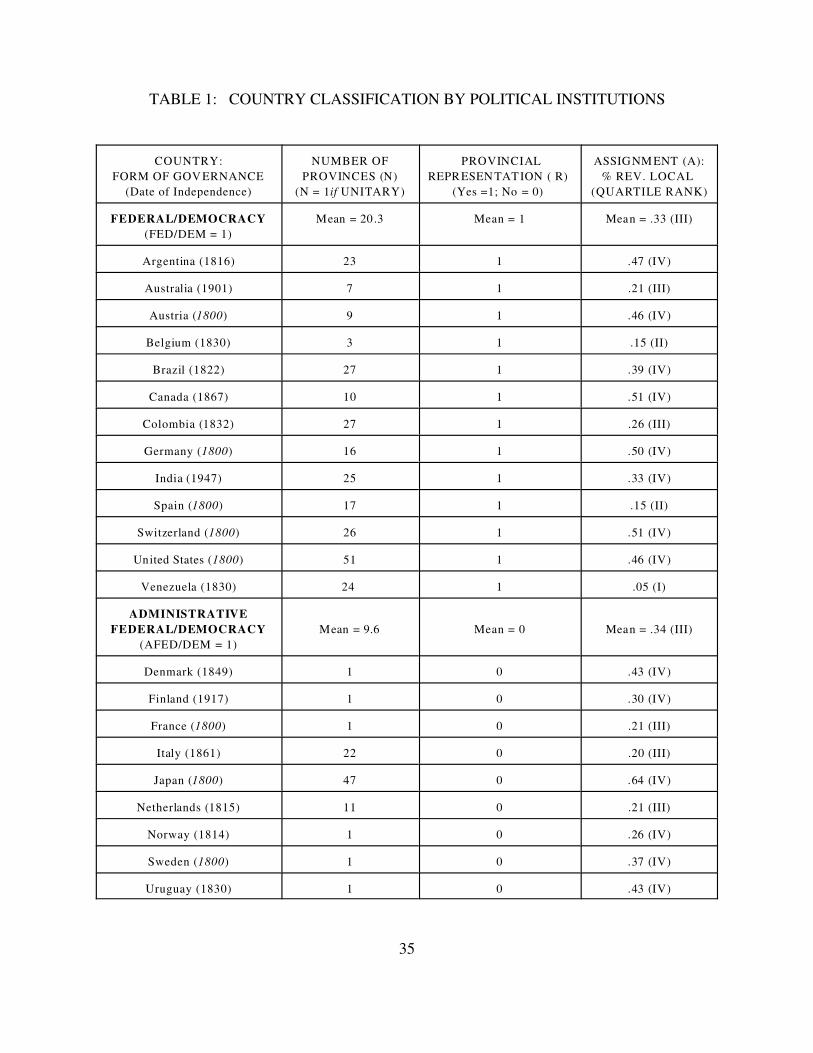
35
TABLE 1: COUNTRY CLASSIFICATION BY POLITICAL INSTITUTIONS
COUNTRY:
FORM OF GOV ERNANCE
(Date of Independence)
NUMBER OF
PROVINCES (N)
(N = 1if UNITARY)
PROVINCIAL
REPRESEN TATION ( R)
(Yes =1; No = 0)
ASSIGNM ENT (A):
% REV. LOCAL
(QUARTILE RANK)
FEDERAL/DEMOCRACY
(FED/DEM = 1)
Mean = 20 .3 Mean = 1 Mean = .33 (III)
Argentina (1816) 23 1 .47 (IV)
Australia (1901) 7 1 .21 (III)
Austria (1800) 9 1 .46 (IV)
Belgium (1830) 3 1 .15 (II)
Brazil (1822) 27 1 .39 (IV)
Canada (1867) 10 1 .51 (IV)
Colombia (1832) 27 1 .26 (III)
Germany (1800) 16 1 .50 (IV)
India (1947) 25 1 .33 (IV)
Spain (1800) 17 1 .15 (II)
Switzerland (1800) 26 1 .51 (IV)
United States (1800) 51 1 .46 (IV)
Venezuela (1830) 24 1 .05 (I)
ADMINISTRATIVE
FEDERAL/DEMOCRACY
(AFED/DEM = 1)
Mean = 9.6 Mean = 0 Mean = .34 (III)
Denmark (1849) 1 0 .43 (IV)
Finland (1917) 1 0 .30 (IV)
France (1800) 1 0 .21 (III)
Italy (1861) 22 0 .20 (III)
Japan (1800) 47 0 .64 (IV)
Netherlands (1815) 11 0 .21 (III)
Norway (1814) 1 0 .26 (IV)
Sweden (1800) 1 0 .37 (IV)
Uruguay (1830) 1 0 .43 (IV)
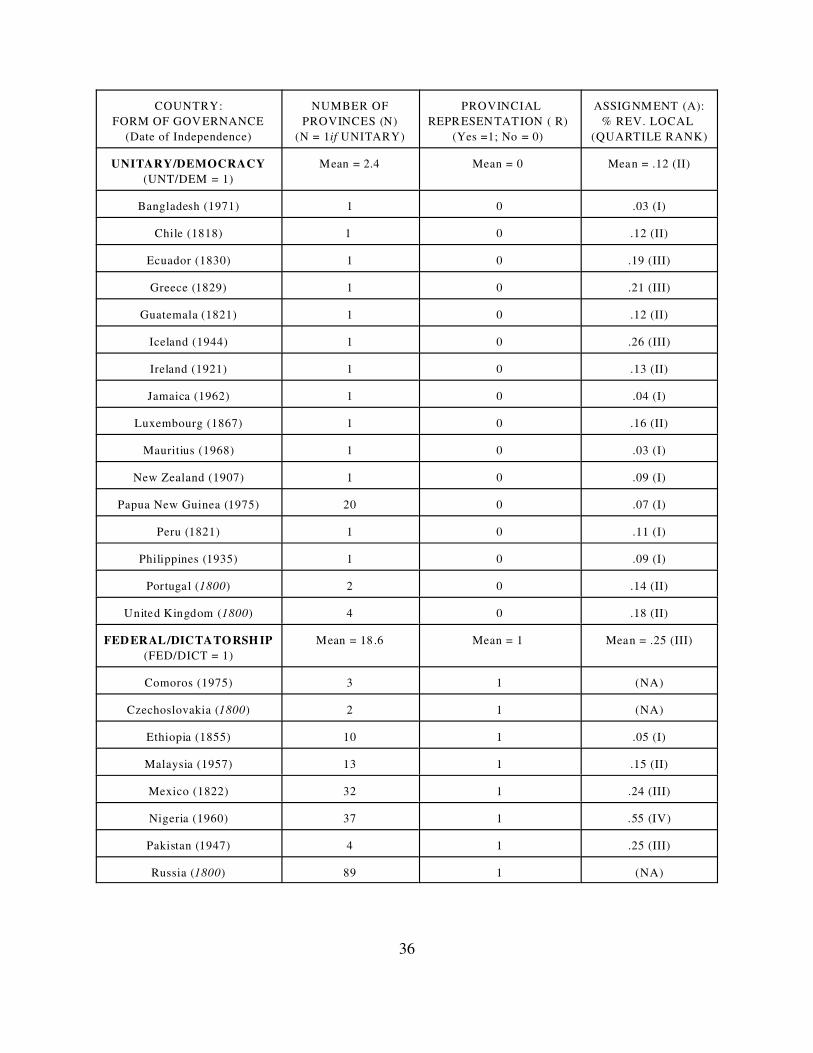
36
COUNTRY:
FORM OF GOV ERNANCE
(Date of Independence)
NUMBER OF
PROVINCES (N)
(N = 1if UNITARY)
PROVINCIAL
REPRESEN TATION ( R)
(Yes =1; No = 0)
ASSIGNM ENT (A):
% REV. LOCAL
(QUARTILE RANK)
UNITARY/DEMOCRACY
(UNT/DEM = 1)
Mean = 2.4 Mean = 0 Mean = .12 (II)
Bangladesh (1971) 1 0 .03 (I)
Chile (1818) 1 0 .12 (II)
Ecuador (1830) 1 0 .19 (III)
Greece (1829) 1 0 .21 (III)
Guatemala (1821) 1 0 .12 (II)
Iceland (1944) 1 0 .26 (III)
Ireland (1921) 1 0 .13 (II)
Jamaica (1962) 1 0 .04 (I)
Luxembourg (1867) 1 0 .16 (II)
Mauritius (1968) 1 0 .03 (I)
New Zealand (1907) 1 0 .09 (I)
Papua New Guinea (1975) 20 0 .07 (I)
Peru (1821) 1 0 .11 (I)
Philippines (1935) 1 0 .09 (I)
Portugal (1800) 2 0 .14 (II)
United Kingdom (1800) 4 0 .18 (II)
FED ERAL/DICTATORSH IP
(FED/DICT = 1)
Mean = 18 .6 Mean = 1 Mean = .25 (III)
Comoros (1975) 3 1 (NA)
Czechoslovakia (1800) 2 1 (NA)
Ethiopia (1855) 10 1 .05 (I)
Malaysia (1957) 13 1 .15 (II)
Mexico (1822) 32 1 .24 (III)
Nigeria (1960) 37 1 .55 (IV)
Pakistan (1947) 4 1 .25 (III)
Russia (1800) 89 1 (NA)
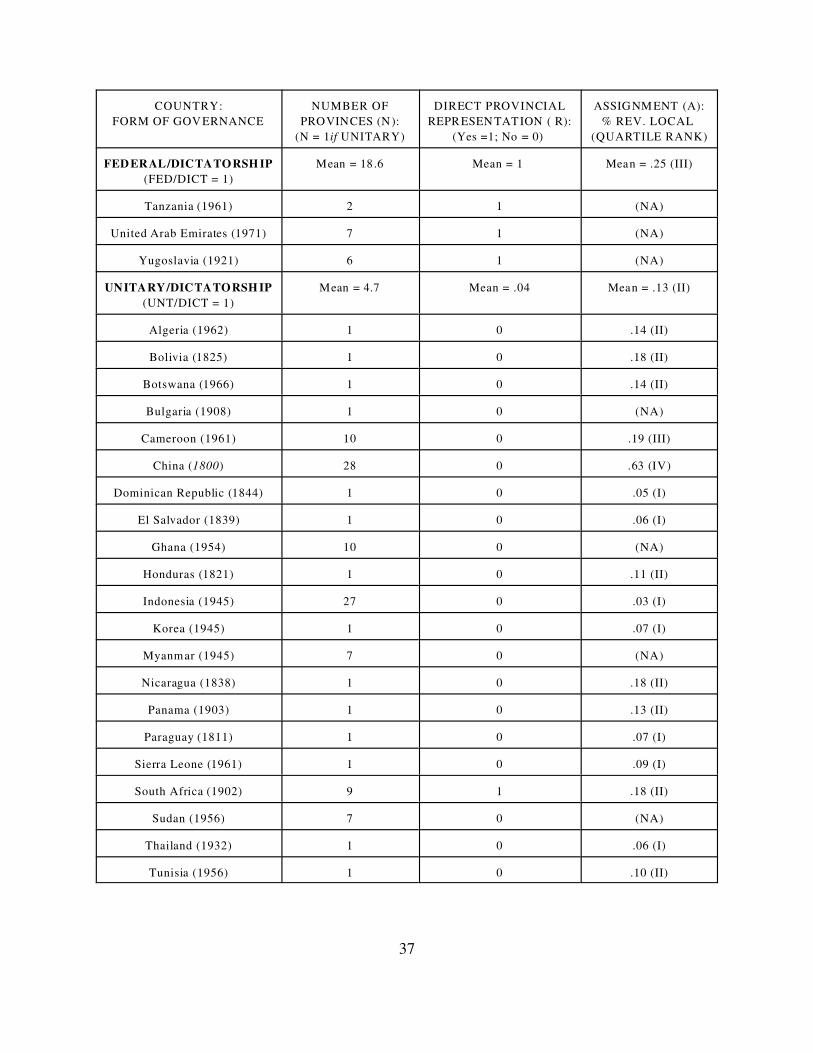
37
COUNTRY:
FORM OF GOV ERNANCE
NUMBER OF
PROVINCES (N):
(N = 1if UNITARY)
DIRECT PROVINCIAL
REPRESEN TATION ( R):
(Yes =1; No = 0)
ASSIGNM ENT (A):
% REV. LOCAL
(QUARTILE RANK)
FED ERAL/DICTATORSH IP
(FED/DICT = 1)
Mean = 18 .6 Mean = 1 Mean = .25 (III)
Tanzania (1961) 2 1 (NA)
United Arab Emirates (1971) 7 1 (NA)
Yugoslavia (1921) 6 1 (NA)
UNITARY/DICTATORSH IP
(UNT/DICT = 1)
Mean = 4.7 Mean = .04 Mean = .13 (II)
Algeria (1962) 1 0 .14 (II)
Bolivia (1825) 1 0 .18 (II)
Botswana (1966) 1 0 .14 (II)
Bulgaria (1908) 1 0 (NA)
Cameroon (1961) 10 0 .19 (III)
China (1800) 28 0 .63 (IV)
Dominican Republic (1844) 1 0 .05 (I)
El Salvador (1839) 1 0 .06 (I)
Ghana (1954) 10 0 (NA)
Honduras (1821) 1 0 .11 (II)
Indonesia (1945) 27 0 .03 (I)
Korea (1945) 1 0 .07 (I)
Myanmar (1945) 7 0 (NA)
Nicaragua (1838) 1 0 .18 (II)
Panama (1903) 1 0 .13 (II)
Paraguay (1811) 1 0 .07 (I)
Sierra Leone (1961) 1 0 .09 (I)
South Africa (1902) 9 1 .18 (II)
Sudan (1956) 7 0 (NA)
Thailand (1932) 1 0 .06 (I)
Tunisia (1956) 1 0 .10 (II)
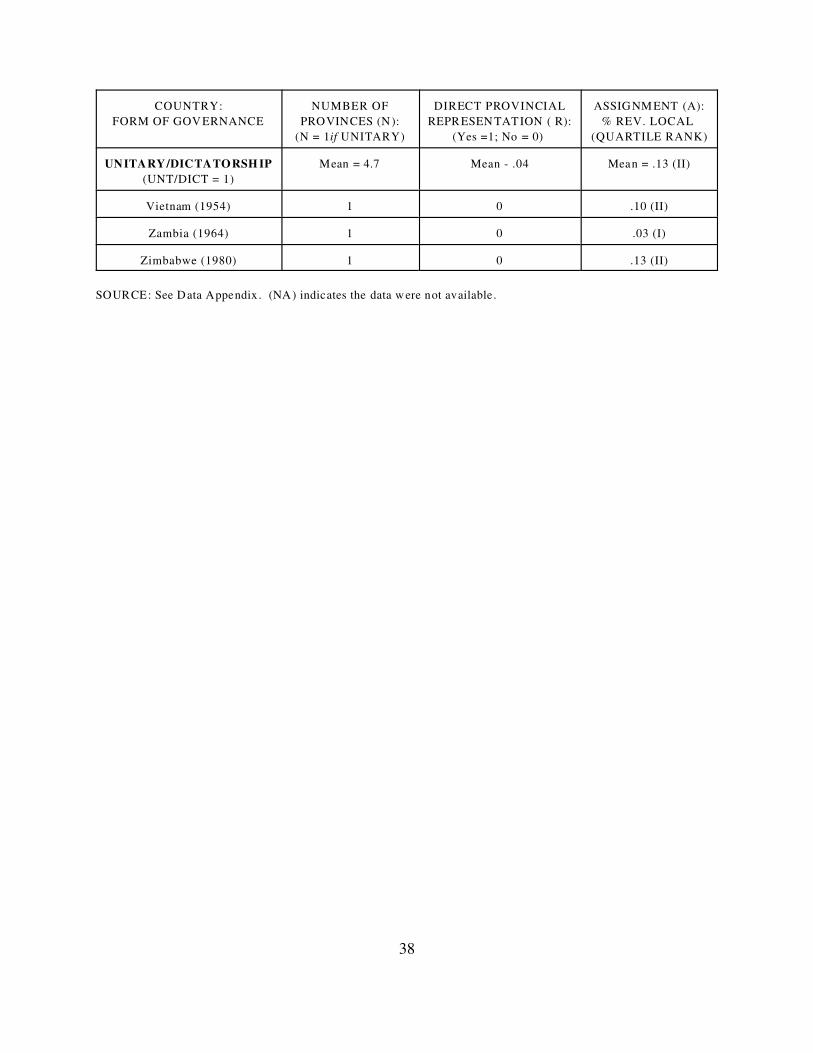
38
COUNTRY:
FORM OF GOV ERNANCE
NUMBER OF
PROVINCES (N):
(N = 1if UNITARY)
DIRECT PROVINCIAL
REPRESEN TATION ( R):
(Yes =1; No = 0)
ASSIGNM ENT (A):
% REV. LOCAL
(QUARTILE RANK)
UNITARY/DICTATORSH IP
(UNT/DICT = 1)
Mean = 4.7 Mean - .04 Mean = .13 (II)
Vietnam (1954) 1 0 .10 (II)
Zambia (1964) 1 0 .03 (I)
Zimbabwe (1980) 1 0 .13 (II)
SOURCE: See Data Appendix . (NA) indicates the data w ere not available.
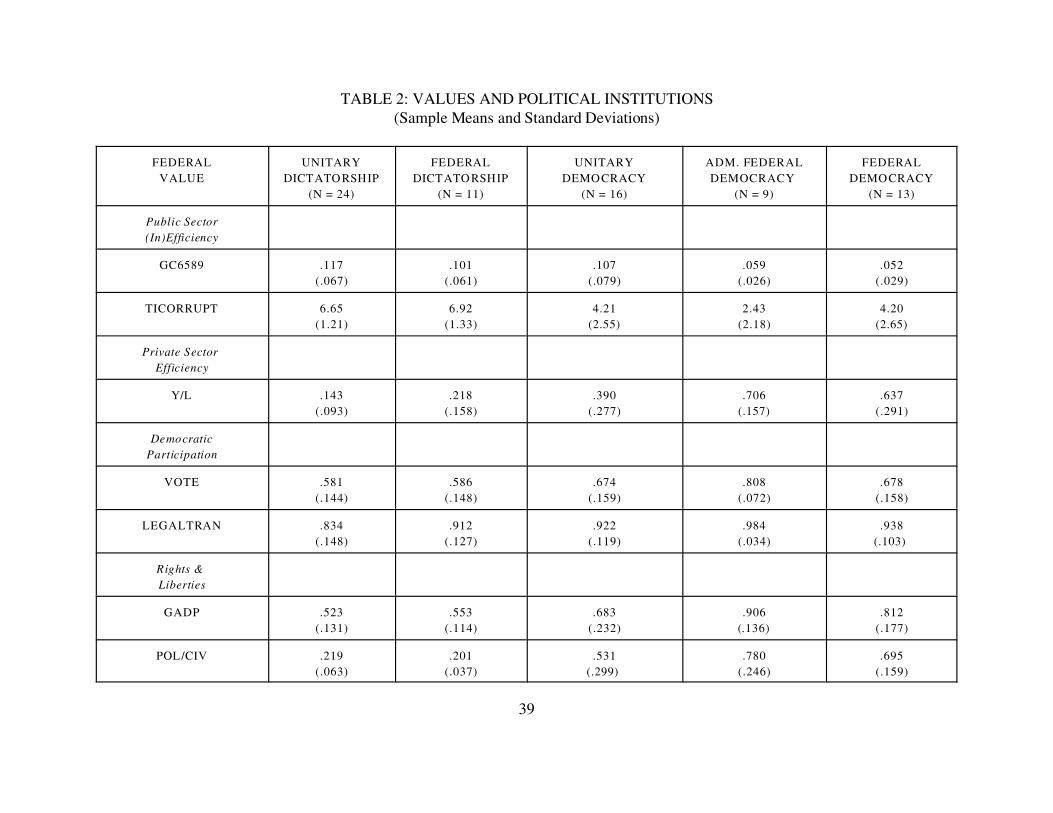
39
TABLE 2: VALUES AND POLITICAL INSTITUTIONS(Sample Means and Standard Deviations)
FEDERAL
VALUE
UNITARY
DICTATO RSHIP
(N = 24)
FEDERAL
DICTATO RSHIP
(N = 11)
UNITARY
DEMOCRACY
(N = 16)
ADM. FEDERAL
DEMOCRACY
(N = 9)
FEDERAL
DEMOCRACY
(N = 13)
Public Sector
(In)Efficiency
GC6589 .117
(.067)
.101
(.061)
.107
(.079)
.059
(.026)
.052
(.029)
TICORRUPT 6.65
(1.21)
6.92
(1.33)
4.21
(2.55)
2.43
(2.18)
4.20
(2.65)
Private Sector
Efficiency
Y/L .143
(.093)
.218
(.158)
.390
(.277)
.706
(.157)
.637
(.291)
Democratic
Participation
VOTE .581
(.144)
.586
(.148)
.674
(.159)
.808
(.072)
.678
(.158)
LEGALTRAN .834
(.148)
.912
(.127)
.922
(.119)
.984
(.034)
.938
(.103)
Rights &
Liberties
GADP .523
(.131)
.553
(.114)
.683
(.232)
.906
(.136)
.812
(.177)
POL/CIV .219
(.063)
.201
(.037)
.531
(.299)
.780
(.246)
.695
(.159)
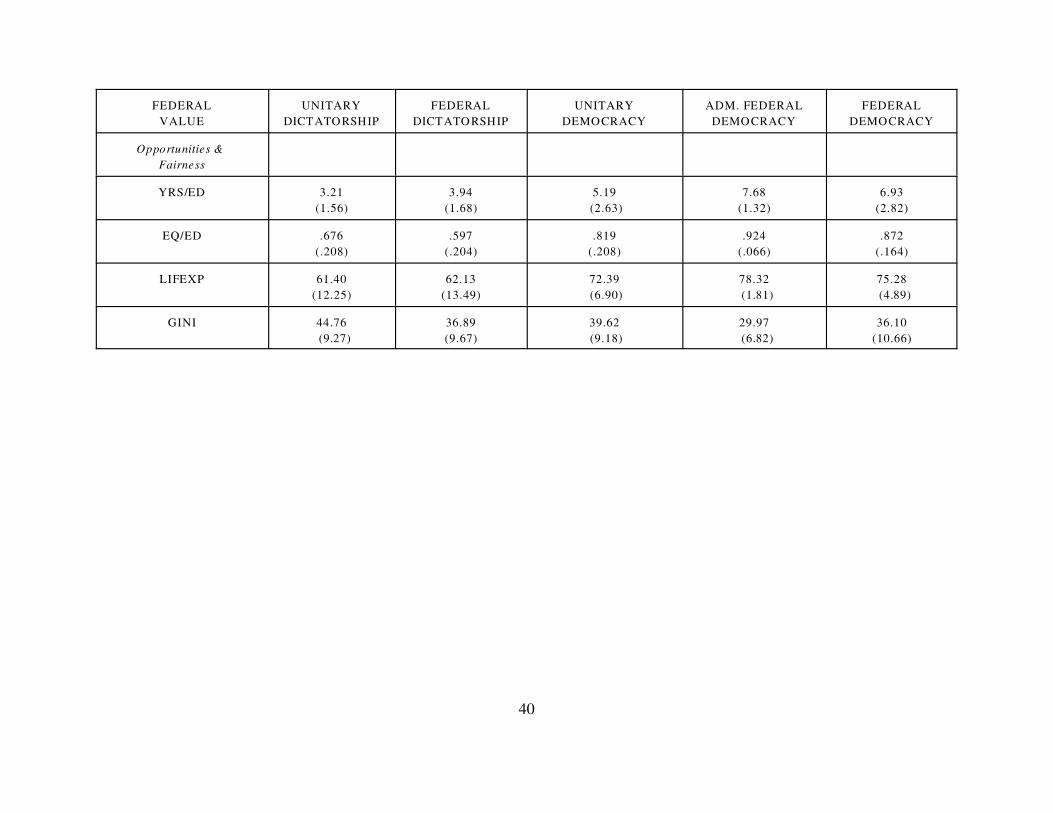
40
FEDERAL
VALUE
UNITARY
DICTATO RSHIP
FEDERAL
DICTATO RSHIP
UNITARY
DEMOCRACY
ADM. FEDERAL
DEMOCRACY
FEDERAL
DEMOCRACY
Opportunities &
Fairness
YRS/ED 3.21
(1.56)
3.94
(1.68)
5.19
(2.63)
7.68
(1.32)
6.93
(2.82)
EQ/ED .676
(.208)
.597
(.204)
.819
(.208)
.924
(.066)
.872
(.164)
LIFEXP 61.40
(12.25)
62.13
(13.49)
72.39
(6.90)
78.32
(1.81)
75.28
(4.89)
GINI 44.76
(9.27)
36.89
(9.67)
39.62
(9.18)
29.97
(6.82)
36.10
(10.66)
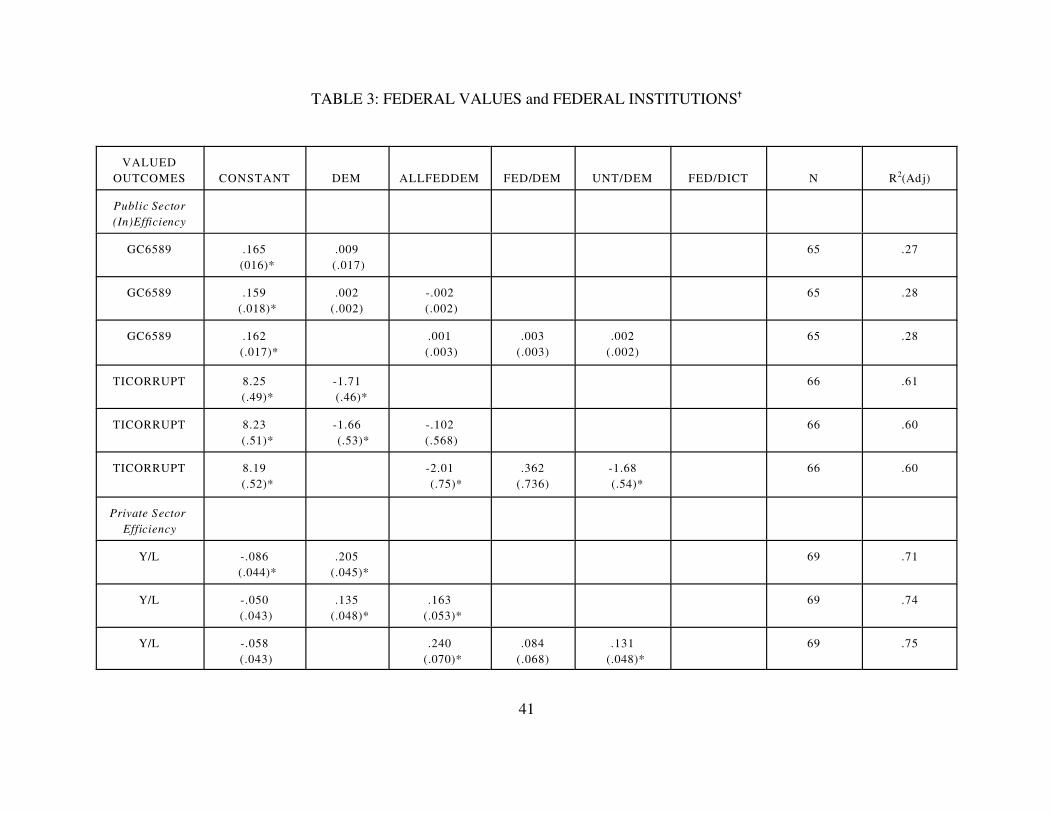
41
TABLE 3: FEDERAL VALUES and FEDERAL INSTITUTIONS^
VALUED
OUTCOMES CONSTANT DEM ALLFEDDEM FED/DEM UNT/DEM FED/DICT N R2(Adj)
Public Sector
(In)Efficiency
GC6589 .165
(016)*
.009
(.017)
65 .27
GC6589 .159
(.018)*
.002
(.002)
-.002
(.002)
65 .28
GC6589 .162
(.017)*
.001
(.003)
.003
(.003)
.002
(.002)
65 .28
TICORRUPT 8.25
(.49)*
-1.71
(.46)*
66 .61
TICORRUPT 8.23
(.51)*
-1.66
(.53)*
-.102
(.568)
66 .60
TICORRUPT 8.19
(.52)*
-2.01
(.75)*
.362
(.736)
-1.68
(.54)*
66 .60
Private Sector
Efficiency
Y/L -.086
(.044)*
.205
(.045)*
69 .71
Y/L -.050
(.043)
.135
(.048)*
.163
(.053)*
69 .74
Y/L -.058
(.043)
.240
(.070)*
.084
(.068)
.131
(.048)*
69 .75
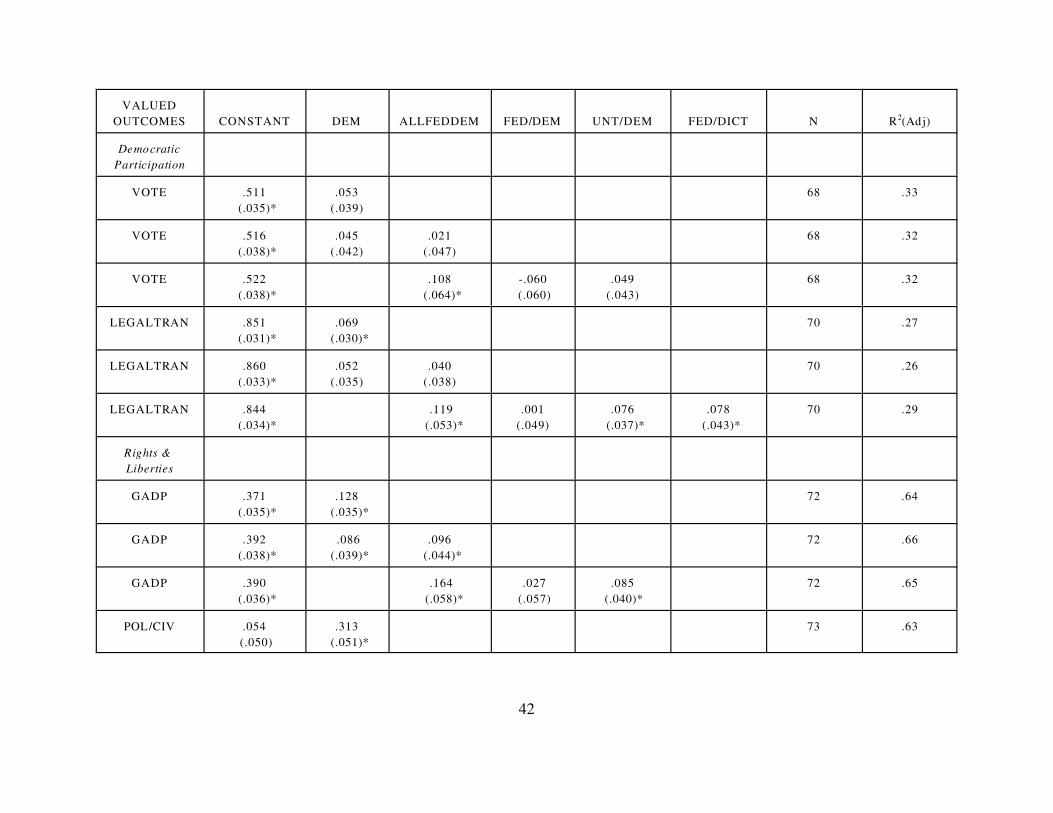
42
VALUED
OUTCOMES CONSTANT DEM ALLFEDDEM FED/DEM UNT/DEM FED/DICT N R2(Adj)
Democratic
Participation
VOTE .511
(.035)*
.053
(.039)
68 .33
VOTE .516
(.038)*
.045
(.042)
.021
(.047)
68 .32
VOTE .522
(.038)*
.108
(.064)*
-.060
(.060)
.049
(.043)
68 .32
LEGALTRAN .851
(.031)*
.069
(.030)*
70 .27
LEGALTRAN .860
(.033)*
.052
(.035)
.040
(.038)
70 .26
LEGALTRAN .844
(.034)*
.119
(.053)*
.001
(.049)
.076
(.037)*
.078
(.043)*
70 .29
Rights &
Liberties
GADP .371
(.035)*
.128
(.035)*
72 .64
GADP .392
(.038)*
.086
(.039)*
.096
(.044)*
72 .66
GADP .390
(.036)*
.164
(.058)*
.027
(.057)
.085
(.040)*
72 .65
POL/CIV .054
(.050)
.313
(.051)*
73 .63

43
VALUED
OUTCOMES CONSTANT DEM ALLFEDDEM FED/DEM UNT/DEM FED/DICT N R2(Adj)
Rights &
Liberties
POL/CIV .083
(.051)
.255
(.057)*
.133
(.064)*
73 .65
POL/CIV ..079
(.052)
.362
(.085)*
.039
(.084)
.253
(.058)*
73 .65
Opportunities &
Fairness
YRS/ED .977
(.519)*
1.22
(.53)*
64 .58
YRS/ED 1.10
(.57)*
.933
(.588)
.723
(.643)
64 .58
YRS/ED 1.03
(.058)*
1.21
(.89)
.620
(.808)
.896
(.592)
64 .58
EQ/ED .533
(.050)*
.111
(.051)*
64 .34
EQ/ED .531
(.054)*
.113
(.058)*
-.006
(.063)
64 .33
EQ/ED .536
(.055)*
.132
(.087)
-.034
(.079)
.115
(.058)*
64 .32
LIFEXP 52.67
(2.13)*
6.76
(2.22)*
72 .52
LIFEXP 52.46
(2.24)*
7.18
(2.54)*
-.975
(2.54)
72 .51

44
VALUED
OUTCOMES CONSTANT DEM ALLFEDDEM FED/DEM UNT/DEM FED/DICT N R2(Adj)
Opportunities &
Fairness
LIFEXP 52.38
(2.28)*
5.57
(3.76)
.914
(3.71)
7.13
(2.57)*
72 .50
GINI 48.23
(2.38)*
-2.05
(2.24)
66 .42
GINI 47.54
(2.46)*
-.638
(2.61)
-2.99
(2.83)
66 .42
GINI 49.17
(2.49)*
-6.02
(3.64)
-.032
(3.51)
-2.84
(2.73)
-6.86
(3.06)*
66 .45
^ All regressions include the control variables for the absolute value of the country’s latitude and for the number of yearssince 1800 that the country has been independent (free of colony rule). Both variables are statistically significant at the .10level or better and favorable to the valued outcome in all regressions, except for YRS/IND in the LEGALTRAN and GINIregressions where the estimated effect is marginal negative.
* Standard errors within parenthesis. An * indicates statistical significance at the .10 level or better.
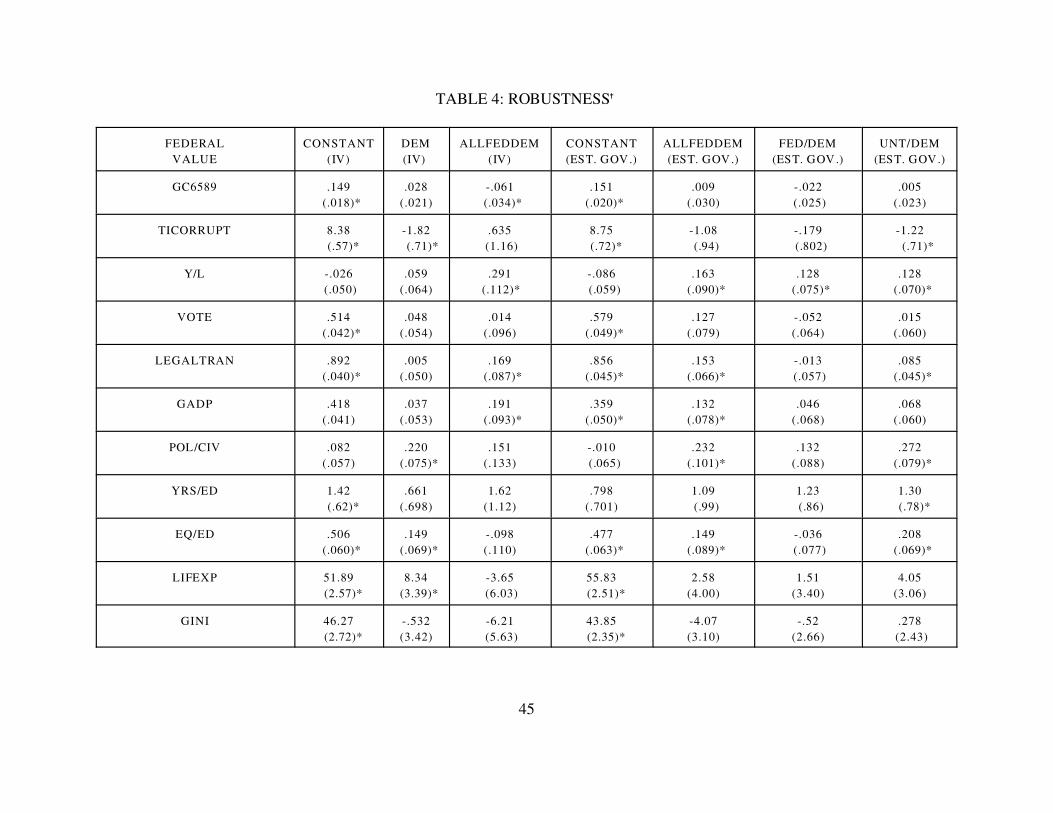
45
TABLE 4: ROBUSTNESS^
FEDERAL
VALUE
CONSTANT
(IV)
DEM
(IV)
ALLFEDDEM
(IV)
CONSTANT
(EST. GOV.)
ALLFEDDEM
(EST. GOV.)
FED/DEM
(EST. GOV.)
UNT/DEM
(EST. GOV.)
GC6589 .149
(.018)*
.028
(.021)
-.061
(.034)*
.151
(.020)*
.009
(.030)
-.022
(.025)
.005
(.023)
TICORRUPT 8.38
(.57)*
-1.82
(.71)*
.635
(1.16)
8.75
(.72)*
-1.08
(.94)
-.179
(.802)
-1.22
(.71)*
Y/L -.026
(.050)
.059
(.064)
.291
(.112)*
-.086
(.059)
.163
(.090)*
.128
(.075)*
.128
(.070)*
VOTE .514
(.042)*
.048
(.054)
.014
(.096)
.579
(.049)*
.127
(.079)
-.052
(.064)
.015
(.060)
LEGALTRAN .892
(.040)*
.005
(.050)
.169
(.087)*
.856
(.045)*
.153
(.066)*
-.013
(.057)
.085
(.045)*
GADP .418
(.041)
.037
(.053)
.191
(.093)*
.359
(.050)*
.132
(.078)*
.046
(.068)
.068
(.060)
POL/CIV .082
(.057)
.220
(.075)*
.151
(.133)
-.010
(.065)
.232
(.101)*
.132
(.088)
.272
(.079)*
YRS/ED 1.42
(.62)*
.661
(.698)
1.62
(1.12)
.798
(.701)
1.09
(.99)
1.23
(.86)
1.30
(.78)*
EQ/ED .506
(.060)*
.149
(.069)*
-.098
(.110)
.477
(.063)*
.149
(.089)*
-.036
(.077)
.208
(.069)*
LIFEXP 51.89
(2.57)*
8.34
(3.39)*
-3.65
(6.03)
55.83
(2.51)*
2.58
(4.00)
1.51
(3.40)
4.05
(3.06)
GINI 46.27
(2.72)*
-.532
(3.42)
-6.21
(5.63)
43.85
(2.35)*
-4.07
(3.10)
-.52
(2.66)
.278
(2.43)
46
^ All regressions include the control variables for the absolute value of the country’s latitude and for the number of yearssince 1800 that the country has been independent (free of colony rule). Standard errors within parenthesis. An * indicatesstatistical significance at the .10 level or better.
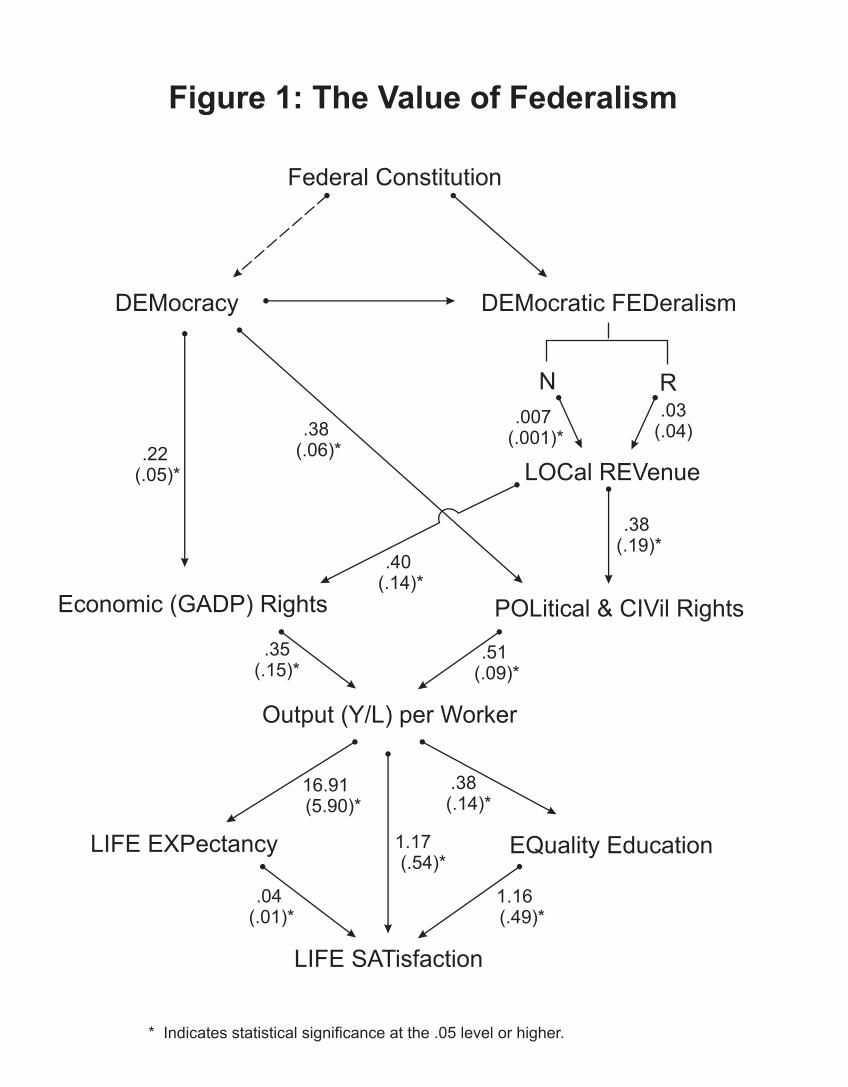
DEMocratic FEDeralism
Figure 1: The Value of Federalism
DEMocracy
N R
.007 (.001)*
.03(.04)
LOCal REVenue.22
(.05)*
.38 (.19)*
.38 (.06)*
.40 (.14)*
Economic (GADP) Rights POLitical & CIVil Rights
.35(.15)*
.51 (.09)*
Output (Y/L) per Worker
LIFE EXPectancy
16.91 (5.90)*
.38 (.14)*
1.17 (.54)*
EQuality Education
1.16 (.49)*
.04 (.01)*
LIFE SATisfaction
* Indicates statistical significance at the .05 level or higher.
Federal Constitution
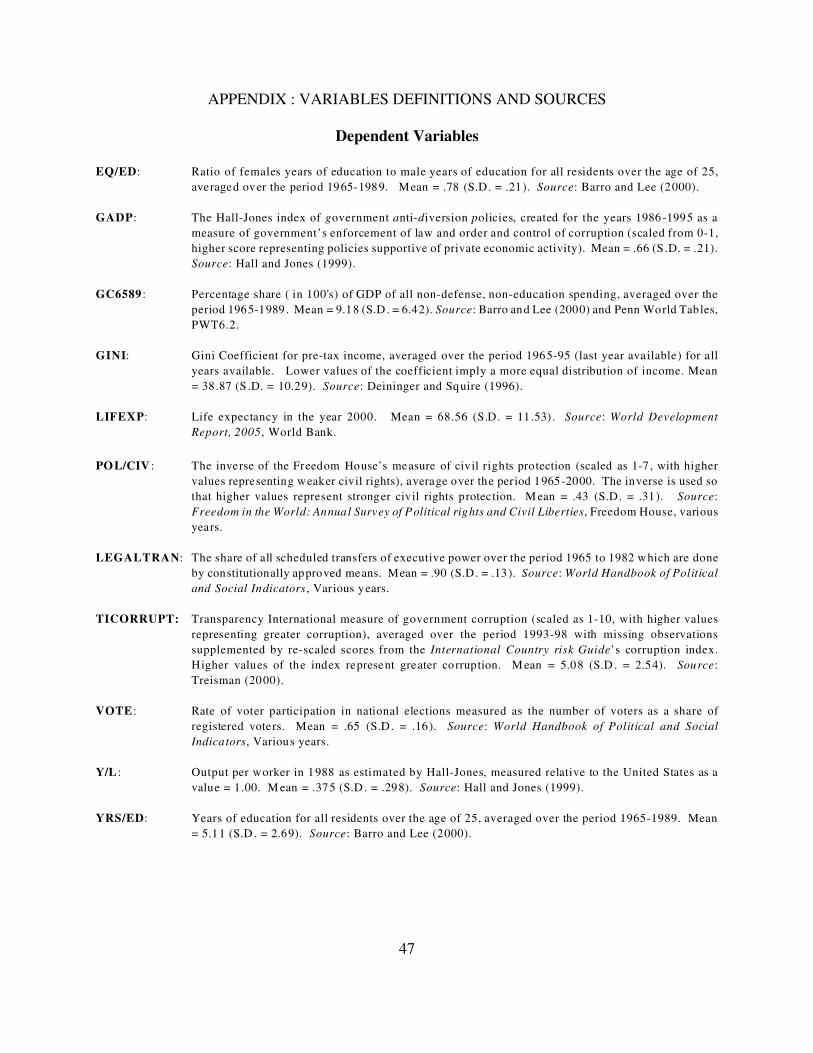
47
APPENDIX : VARIABLES DEFINITIONS AND SOURCES
Dependent Variables
EQ/ED: Ratio of females years of education to male years of education for all residents over the age of 25,
averaged over the period 1965-1989. Mean = .78 (S.D. = .21). Source: Barro and Lee (2000).
GADP: The Hall-Jones index of government anti-diversion policies, created for the years 1986-1995 as a
measure of government’s enforcement of law and order and control of corruption (scaled from 0-1,
higher score representing policies supportive of private economic activity). Mean = .66 (S.D. = .21).
Source: Hall and Jones (1999).
GC6589 : Percentage share ( in 100's) of GDP of all non-defense, non-education spending, averaged over the
period 1965-1989 . Mean = 9.18 (S.D . = 6.42). Source: Barro and Lee (2000) and Penn World Tables,
PWT6.2.
GINI: Gini Coefficient for pre-tax income, averaged over the period 1965-95 (last year available) for all
years available. Lower values of the coefficient imply a more equal distribution of income. Mean
= 38 .87 (S .D. = 10.29). Source: Deininger and Squire (1996).
LIFEXP: Life expectancy in the year 2000. Mean = 68.56 (S.D. = 11 .53). Source: World Development
Report, 2005, World Bank.
POL/CIV : The inverse of the Freedom House’s measure of civil rights protection (scaled as 1-7 , with higher
values representing weaker civil rights), average over the period 1965-2000. The inverse is used so
that higher values represent stronger civil rights protection. M ean = .43 (S.D. = .31). Source:
Freedom in the World: Annual Survey of Political rights and Civil Liberties, Freedom House, various
years.
LEGALTRAN: The share of all scheduled transfers of executive power over the period 1965 to 1982 which are done
by constitutionally approved means. Mean = .90 (S.D. = .13). Source: World Handbook of Political
and Social Indicators , Various years.
TICORRUPT: Transparency International measure of government corruption (scaled as 1-10, with higher values
representing greater corruption), averaged over the period 1993-98 with missing observations
supplemented by re-scaled scores from the International Country risk Guide’s corruption index.
Higher values of the index represent greater corruption. M ean = 5.08 (S.D . = 2.54). Source:
Treisman (2000).
VOTE : Rate of voter participation in national elections measured as the number of voters as a share of
registered voters. Mean = .65 (S.D. = .16). Source: World Handbook of Political and Social
Indicators, Various years.
Y/L : Output per worker in 1988 as estimated by Hall-Jones, measured relative to the United States as a
value = 1.00. M ean = .375 (S.D . = .298). Source: Hall and Jones (1999).
YRS/ED: Years of education for all residents over the age of 25, averaged over the period 1965-1989. Mean
= 5.11 (S.D . = 2.69). Source: Barro and Lee (2000).
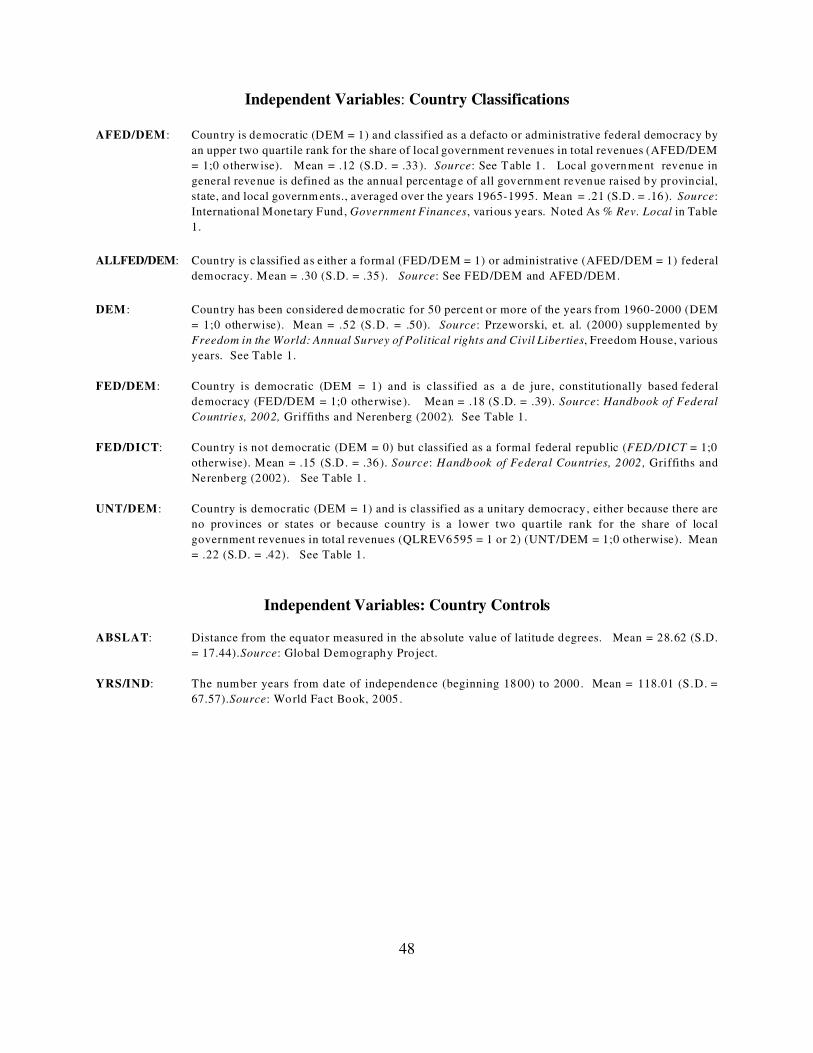
48
Independent Variables: Country Classifications
AFED/DEM : Country is democratic (DEM = 1) and classified as a defacto or administrative federal democracy by
an upper two quartile rank for the share of local government revenues in total revenues (AFED/DEM
= 1;0 otherwise). Mean = .12 (S.D. = .33). Source: See Table 1 . Local government revenue in
general revenue is defined as the annual percentage of all governm ent revenue raised by provincial,
state, and local governm ents., averaged over the years 1965-1995. Mean = .21 (S.D. = .16). Source:
International Monetary Fund , Government Finances, various years. Noted As % Rev. Local in Table
1.
ALLFED/DEM: Country is c lassified as e ither a formal (FED/DEM = 1) or administrative (AFED/DEM = 1) federal
democracy. Mean = .30 (S.D. = .35). Source: See FED/DEM and AFED/DEM.
DEM : Country has been considered democratic for 50 percent or more of the years from 1960-2000 (DEM
= 1;0 otherwise). Mean = .52 (S.D. = .50). Source: Przeworski, et. al. (2000) supplemented by
Freedom in the World: Annual Survey of Political rights and Civil Liberties, Freedom House, various
years. See Table 1.
FED/DEM: Country is democratic (DEM = 1) and is classified as a de jure, constitutionally based federal
democracy (FED/DEM = 1;0 otherwise). Mean = .18 (S .D. = .39). Source: Handbook of Federal
Countries, 2002, Griffiths and Nerenberg (2002). See Table 1.
FED/DICT: Country is not democratic (DEM = 0) but classified as a formal federal republic (FED/DICT = 1;0
otherwise). Mean = .15 (S.D. = .36). Source: Handbook of Federal Countries, 2002 , Griffiths and
Nerenberg (2002). See Table 1 .
UNT/DEM : Country is democratic (DEM = 1) and is classified as a unitary democracy , either because there are
no provinces or states or because country is a lower two quartile rank for the share of local
government revenues in total revenues (QLREV6595 = 1 or 2) (UNT/DEM = 1;0 otherwise). Mean
= .22 (S.D. = .42). See Table 1.
Independent Variables: Country Controls
ABSLAT: Distance from the equator measured in the absolute value of latitude degrees. Mean = 28.62 (S.D.
= 17.44).Source: Global Demography Pro ject.
YRS/IND: The number years from date of independence (beginning 1800) to 2000. Mean = 118.01 (S.D. =
67.57).Source: World Fact Book, 2005 .