Embed Size (px)
Citation preview

Federal PrisonConstruction:Alternative ApproachesJanuary1977
Congressional Budget OfficeCongress of the United StatesWashington, D.C.
FEDERAL PRISON CONSTRUCTION:ALTERNATIVE APPROACHES
The Congress of the United StatesCongressional Budget Office
For sale by the Superintendent of Documents, U.S. Government Printing OfficeWashington, D.C. 20402 - Price $1.20
PREFACE
In its report accompanying the fiscal year 1977State, Justice, and Commerce, the Judiciary, and RelatedAgencies Appropriation bill, the Senate AppropriationsCommittee expressed its views of the various issuesinvolved in the question of construction of new federalpenal facilities (Appendix A). The Committee stated:"The cost of constructing and operating new prisonfacilities is enormous, and the use of imprisonmentis the most expensive sanction which can be imposed ona criminal offender. Because cost makes imprisonmenta scarce resource, it is essential that imprisonmentonly be used where necessary to assure the protectionof society or the administration of just punishment.In those cases in which imprisonment is not necessary,the range of alternatives to incarceration currentlyavailable is clearly unsatisfactory."
The Chairman of the Senate Appropriations Sub-committee on State, Justice, Commerce, the Judiciaryand Related Agencies asked the Congressional BudgetOffice to "prepare a report for the committee whichwould develop alternative funding proposals for thepossible construction of new federal prisons." Thisbudget issue paper is designed to assist the Appro-priations Committees of both Houses of the Congressand to provide a budgetary perspective for some of thepolicy issues confronting the Congress in the area ofprison construction and operation.
This paper was prepared by Earl A. Armbrust andDonald G. Deloney of the Management Programs Divisionof the Congressional Budget Office, under the super-vision of Howard M. Messner and Seymour D. Greenstone.The paper was edited by Katharine Bateman and preparedfor publication under the supervision of Johanna ZachariasBetty Ripple typed the manuscript.
Alice M. RivlinDirector
January 1977
iii

1I.UL
TABLE OF CONTENTS
Page
Preface ill
Summary xi
Chapter I. Overview 1
Chapter II. Prison Population—CurrentSituation and Outlook for the Future 3
Current Status of Federal PrisonPopulation—A Profile 3
Outlook for the Future 7
Chapter III. Alternative CapitalInvestment Strategies 15
Current Conditions 15Alternative Approaches 20Cost Comparisons 30
Appendix A. Extract from Senate AppropriationsCommittee Report 94-964 32
Appendix B. Projection of Prison Population . . 35
Appendix C. Facilities Requirements underOptions 3 and 4 39
Appendix D. Cost Estimates 45
v
" TMTTT

1
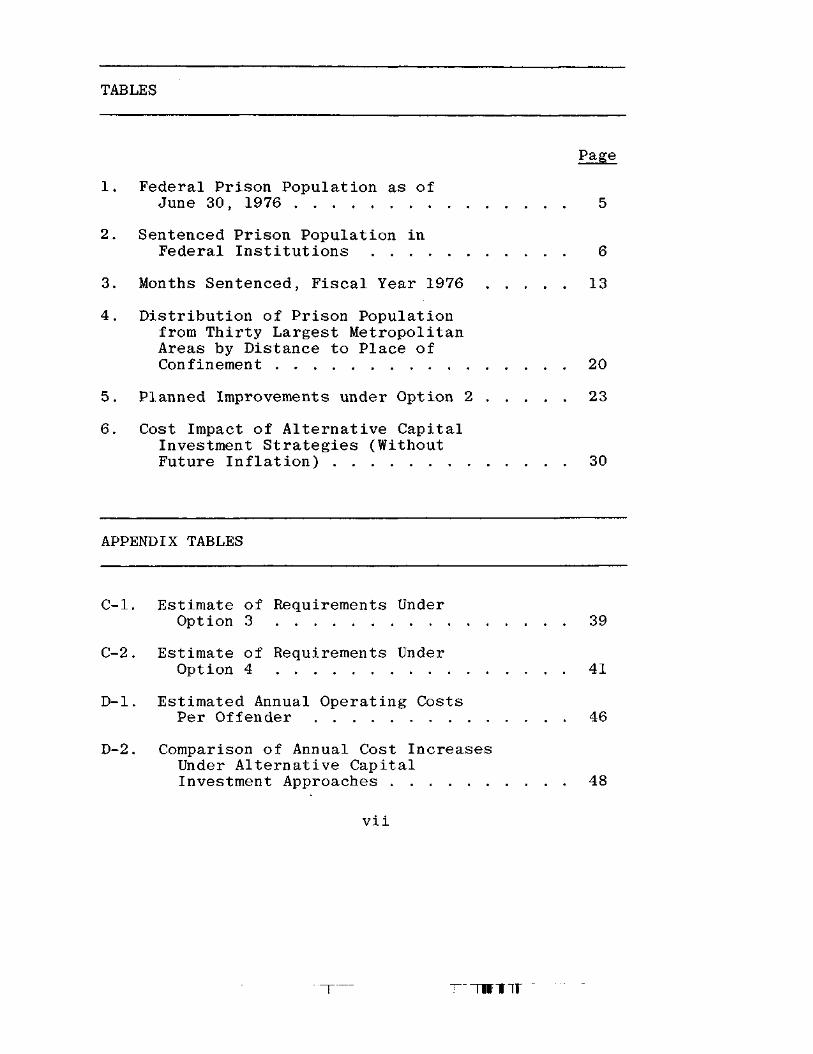
TABLES
Page
1. Federal Prison Population as ofJune 30, 1976 5
2. Sentenced Prison Population inFederal Institutions 6
3. Months Sentenced, Fiscal Year 1976 13
4. Distribution of Prison Populationfrom Thirty Largest MetropolitanAreas by Distance to Place ofConfinement 20
5. Planned Improvements under Option 2 23
6. Cost Impact of Alternative CapitalInvestment Strategies (WithoutFuture Inflation) 30
APPENDIX TABLES
C-l. Estimate of Requirements UnderOption 3 39
C-2. Estimate of Requirements UnderOption 4 41
D-l. Estimated Annual Operating CostsPer Offender 46
D-2. Comparison of Annual Cost IncreasesUnder Alternative CapitalInvestment Approaches 48
VII
•~nmr

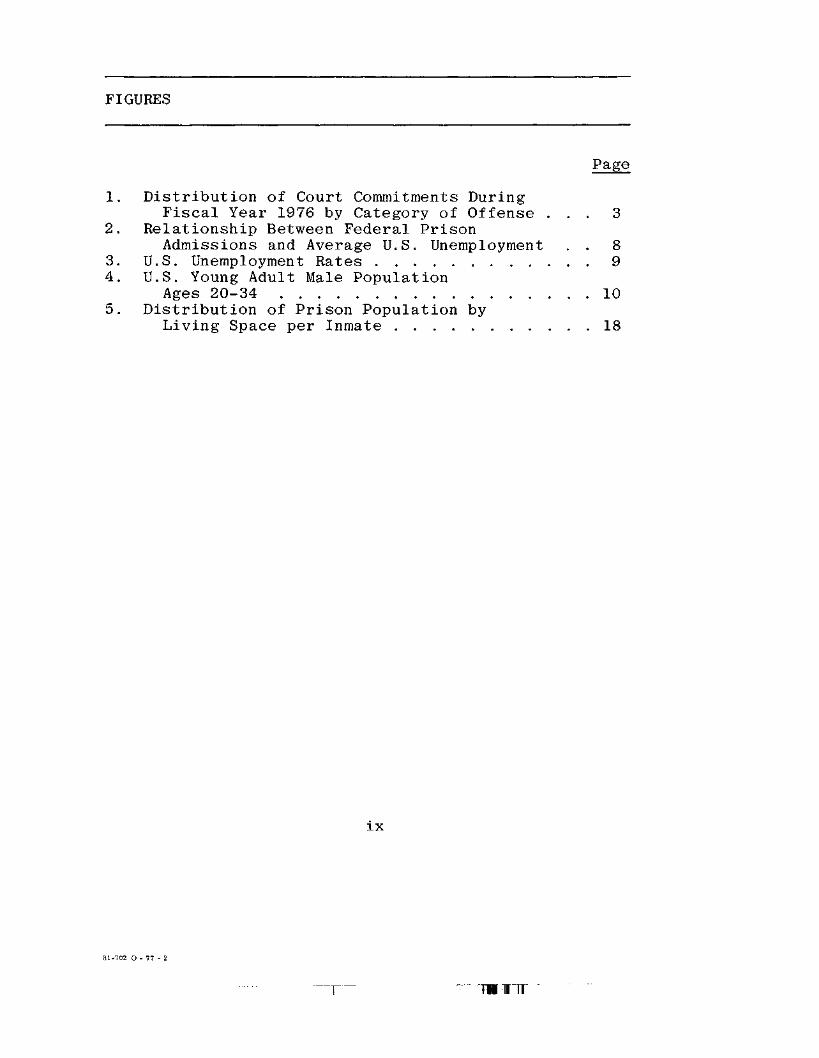
FIGURES
Page
1. Distribution of Court Commitments DuringFiscal Year 1976 by Category of Offense . . . 3
2. Relationship Between Federal PrisonAdmissions and Average U.S. Unemployment . . 8
3. U.S. Unemployment Rates 94. U.S. Young Adult Male Population
Ages 20-34 105. Distribution of Prison Population by
Living Space per Inmate 18
IX
81-702 O - 77 - 2
TW1TT

JLJLMIL.
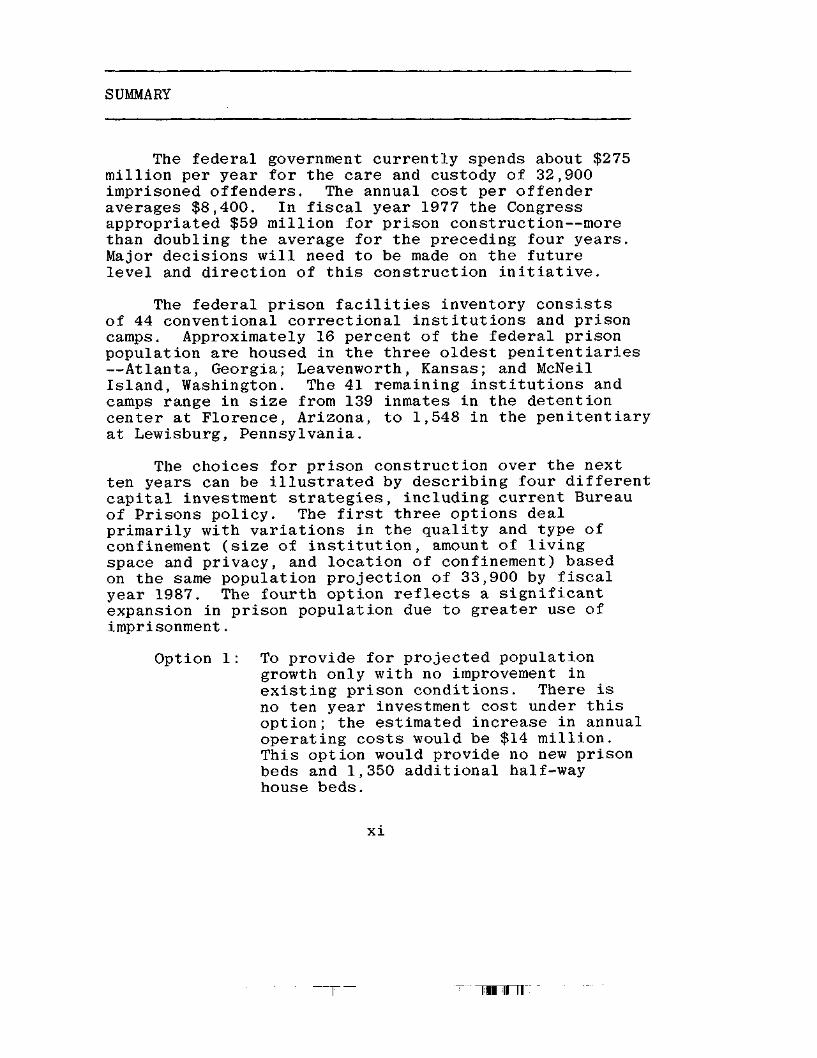
SUMMARY
The federal government currently spends about $275million per year for the care and custody of 32,900imprisoned offenders. The annual cost per offenderaverages $8,400. In fiscal year 1977 the Congressappropriated $59 million for prison construction—morethan doubling the average for the preceding four years.Major decisions will need to be made on the futurelevel and direction of this construction initiative.
The federal prison facilities inventory consistsof 44 conventional correctional institutions and prisoncamps. Approximately 16 percent of the federal prisonpopulation are housed in the three oldest penitentiaries—Atlanta, Georgia; Leavenworth, Kansas; and McNeilIsland, Washington. The 41 remaining institutions andcamps range in size from 139 inmates in the detentioncenter at Florence, Arizona, to 1,548 in the penitentiaryat Lewisburg, Pennsylvania.
The choices for prison construction over the nextten years can be illustrated by describing four differentcapital investment strategies, including current Bureauof Prisons policy. The first three options dealprimarily with variations in the quality and type ofconfinement (size of institution, amount of livingspace and privacy, and location of confinement) basedon the same population projection of 33,900 by fiscalyear 1987. The fourth option reflects a significantexpansion in prison population due to greater use ofimprisonment.
Option 1: To provide for projected populationgrowth only with no improvement inexisting prison conditions. There isno ten year investment cost under thisoption; the estimated increase in annualoperating costs would be $14 million.This option would provide no new prisonbeds and 1,350 additional half-wayhouse beds.
XI
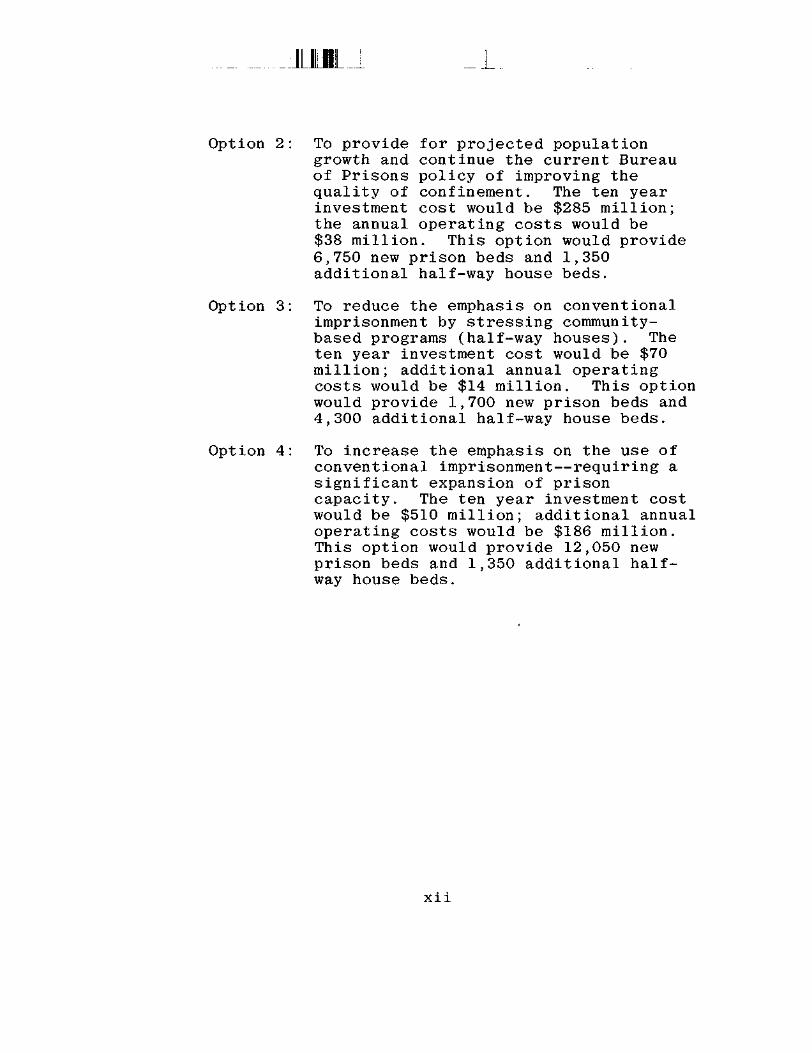
Option 2: To provide for projected populationgrowth and continue the current Bureauof Prisons policy of improving thequality of confinement. The ten yearinvestment cost would be $285 million;the annual operating costs would be$38 million. This option would provide6,750 new prison beds and 1,350additional half-way house beds.
Option 3: To reduce the emphasis on conventionalimprisonment by stressing community-based programs (half-way houses). Theten year investment cost would be $70million; additional annual operatingcosts would be $14 million. This optionwould provide 1,700 new prison beds and4,300 additional half-way house beds.
Option 4: To increase the emphasis on the use ofconventional imprisonment—requiring asignificant expansion of prisoncapacity. The ten year investment costwould be $510 million; additional annualoperating costs would be $186 million.This option would provide 12,050 newprison beds and 1,350 additional half-way house beds.
Xll
CHAPTER I OVERVIEW
On an average day, there are now approximately32,900 persons imprisoned under the authority of thefederal government. About 90 percent of these personsare sentenced offenders and are confined primarily infederal institutions. The remaining 10 percent areunsentenced and are being detained in both federalfacilities and local jails while they await trial.
Approximately 5,300—or 20 percent—of theoffenders in conventional correctional institutionsare in the three oldest federal penitentiaries—Atlanta, Georgia; Leavenworth, Kansas; and McNeilIsland, Washington. The 41 institutions and campshousing the remaining prison population are locatedthroughout the United States. They range in sizefrom a population of 139 in the detention center atFlorence, Arizona, to a population of 1,548 in thepenitentiary at Lewisburg, Pennsylvania.
The federal government currently spends about$275 million per year for care and custody of theprisoners for whom it is responsible. !_/ In fiscalyear 1977 the Congress appropriated $59 million forprison construction—more than doubling the averageamount spent during each of the preceding four years.Major decisions will need to be made on the futurelevel and direction of this construction initiative.Decisions on capital investments in the federalcorrections program often influence state and localpractices at levels that are responsible for 90percent of the nation's sentenced offenders.
_!/ Includes maintenance and improvements to existing~ facilities, expenses for prison industries except
for production costs, and an anticipated supple-mental appropriation for pay increase costs andprison population growth.
IMI ir
II IH ill
This paper will focus on an assessment of:
o the existing prison population and projectedchanges in the long-term population;
o the basic quality standards for facilities; and
o capital investment alternatives, includingconsideration of new facilities and the mixof conventional incarceration vis-a-viscommunity-based programs.
CHAPTER II PRISON POPULATION—CURRENT SITUATION ANDOUTLOOK FOR THE FUTURE
CURRENT STATUS OF FEDERAL PRISON POPULATION—A PROFILE
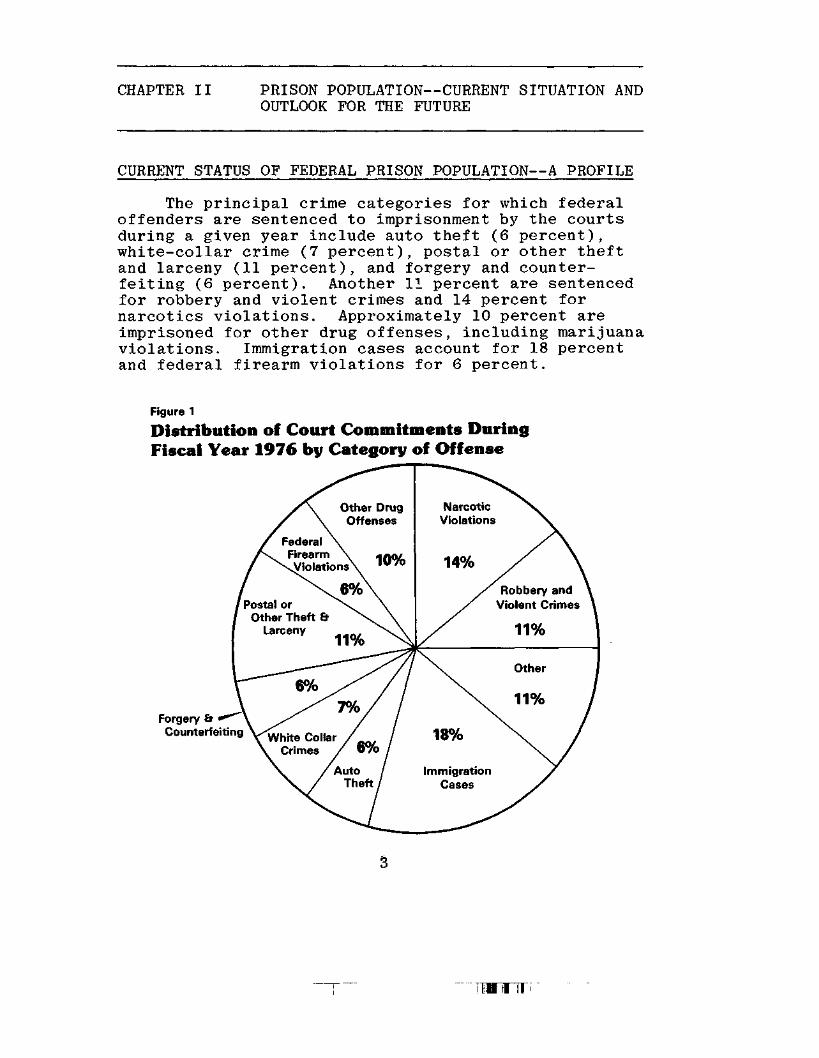
The principal crime categories for which federaloffenders are sentenced to imprisonment by the courtsduring a given year include auto theft (6 percent),white-collar crime (7 percent), postal or other theftand larceny (11 percent), and forgery and counter-feiting (6 percent). Another 11 percent are sentencedfor robbery and violent crimes and 14 percent fornarcotics violations. Approximately 10 percent areimprisoned for other drug offenses, including marijuanaviolations. Immigration cases account for 18 percentand federal firearm violations for 6 percent.
Figure 1
Distribution of Court Commitments DuringFiscal Year 1976 by Category of Offense
Forgery &Counterfeiting
FederalFirearmViolations
Robbery andViolent CrimesPostal or
Other Theft &Larceny
TWITTF'
IllThe typical offender confined by the federal
government is 29.8 years of age and has an eleventhgrade education. He is sentenced for an average ofeight years and, based on past experience, will servea little less than half of his sentence before beingreleased. Upon release, there is a 32 percent chancethat the individual will have his parole revoked orreceive a new federal or state sentence of 60 days ormore within the following two years.
It is important to note, however, that the averageage, sentence, time served, and recidivism rate willvary significantly with the type of offense and priorrecord. For example, the average robbery offender is27 years old, sentenced for 11 years, and serves about41 percent of his sentence. He has a 25 percent chanceof not committing another crime in the two years follow-ing his release. The average immigration offender, onthe other hand, is 28 years old, is sentenced for 6months, and serves 75 percent of his time. About 29percent of the federal offenders are black or belong toother minority groups. About 6 percent of the federaloffenders imprisoned annually are women whose typicalage is 27 years.
Most of the 32,900 currently imprisoned offendersare confined in 44 conventional federal correctionalinstitutions and prison camps. About 15 percent areserving time in state institutions or local jails;another 4 .percent are completing their sentences in half-way houses which are either federally operated or sharedon a contract basis with nonfederal institutions. Thesehalf-way houses or Community Treatment Centers(as they are designated by the Bureau of Prisons) areintended to provide the offender with a transition fromconventional confinement to community life. They areplaces of residence with an average capacity of 45 bedswhich operate under the supervision of a staff ofprofessional counselors.
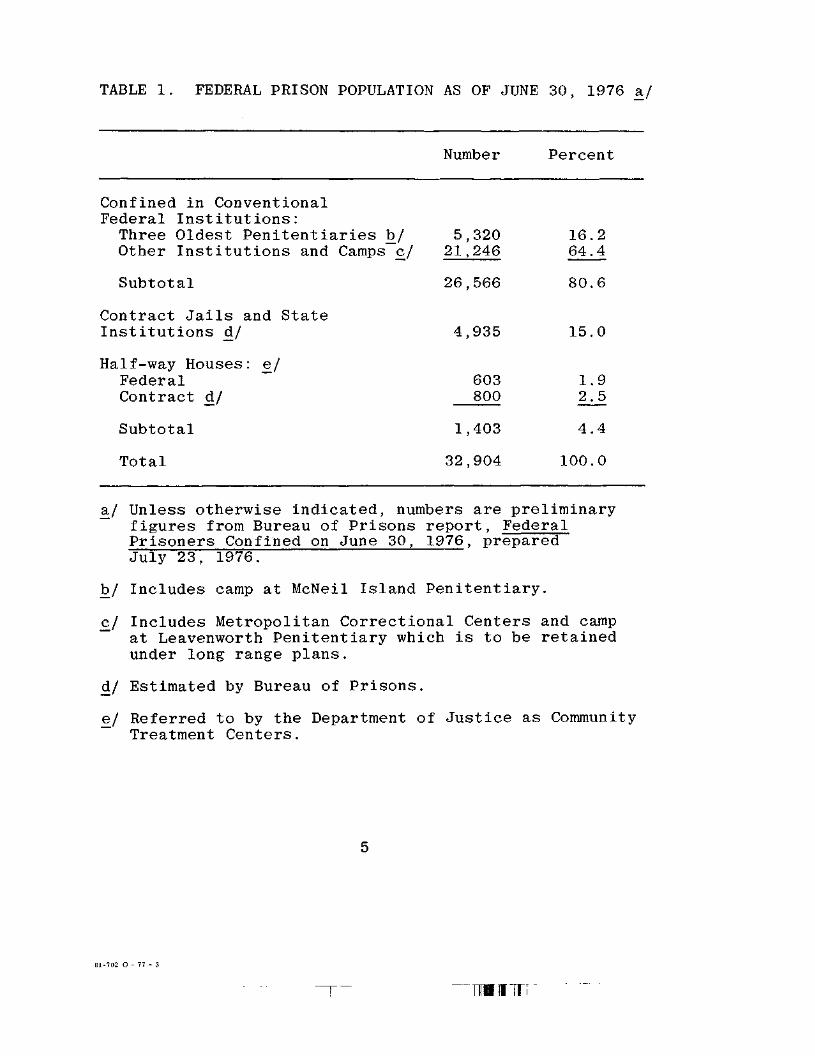
TABLE 1. FEDERAL PRISON POPULATION AS OF JUNE 30, 1976 a/
Number Percent
Confined in ConventionalFederal Institutions:Three Oldest Penitentiaries b/Other Institutions and Camps c/
Subtotal
Contract Jails and StateInstitutions d/
Half-way Houses: e/FederalContract d/
Subtotal
Total
521
26
4
1
32
,320,246
,566
,935
603800
,403
,904
16.264.4
80.6
15.0
1.92.5
4.4
100.0
a,/ Unless otherwise indicated, numbers are preliminaryfigures from Bureau of Prisons report, FederalPrisoners Confined on June 30, 1976, preparedJuly 23, 1976.
b/ Includes camp at McNeil Island Penitentiary.
£/ Includes Metropolitan Correctional Centers and campat Leavenworth Penitentiary which is to be retainedunder long range plans.
d/ Estimated by Bureau of Prisons.
e_/ Referred to by the Department of Justice as CommunityTreatment Centers.
81-702 O - 77 - 3
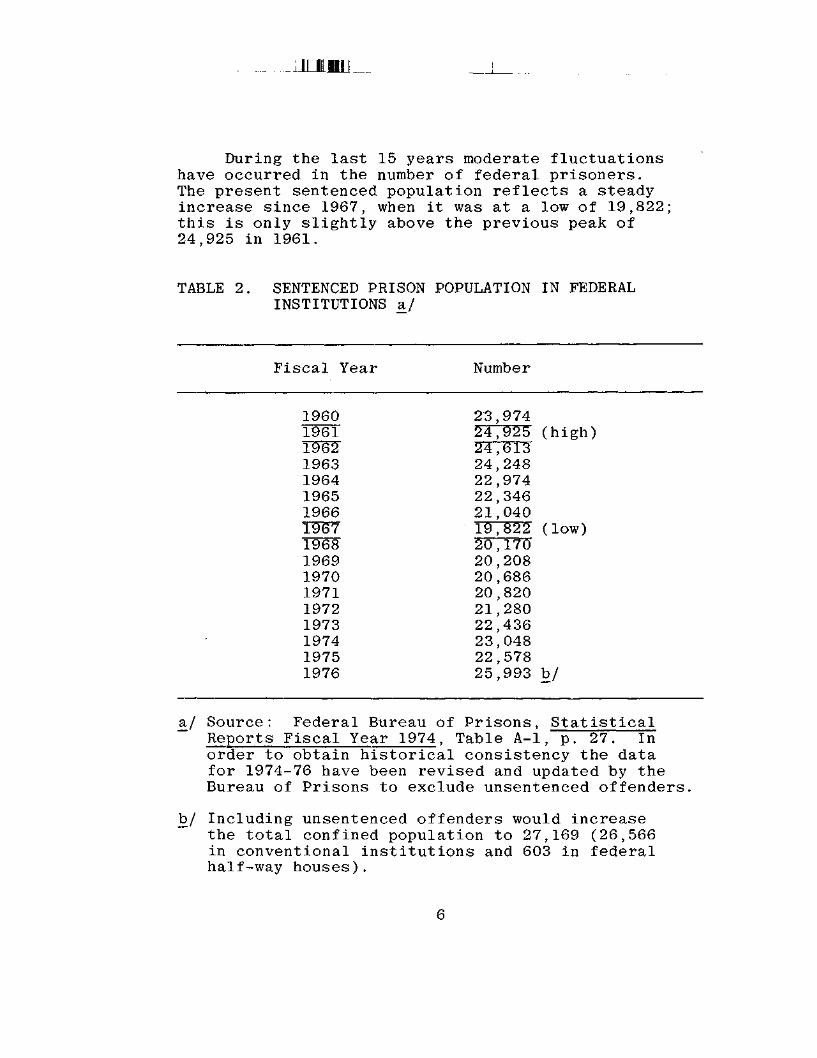
During the last 15 years moderate fluctuationshave occurred in the number of federal prisoners.The present sentenced population reflects a steadyincrease since 1967, when it was at a low of 19,822;this is only slightly above the previous peak of24,925 in 1961.
TABLE 2. SENTENCED PRISON POPULATION IN FEDERALINSTITUTIONS a/
Fiscal Year Number
1960196119621963196419651966I3B7196819691970197119721973197419751976
23,97424,92524,61324,24822,97422,34621,04019,82220,17020,20820,68620,82021,28022,43623,04822,57825,993
(high)
(low)
V
a./ Source: Federal Bureau of Prisons, StatisticalReports Fiscal Year 1974, Table A-l, p. 27. Inorder to obtain historical consistency the datafor 1974-76 have been revised and updated by theBureau of Prisons to exclude unsentenced offenders,
b/ Including unsentenced offenders would increasethe total confined population to 27,169 (26,566in conventional institutions and 603 in federalhalf-way houses).
6
OUTLOOK FOR THE FUTURE
There are now about 32,900 offenders confinedunder the authority of the federal government. Thenumber is estimated to reach 33>900 by fiscal year1987. Undoubtedly, the prison population willcontinue to grow for the next few years. Estimatingthe future prison population is a very difficulttask. The socioeconomic factors and the operationsof the federal criminal justice system which affectprison population are changing constantly. Forpurposes of capital investment planning, however, itis necessary to develop an estimate of what thepopulation will be ten years from now (i.e., infiscal year 1987) rather than the specific changes.
Although many socioeconomic factors will affectthe size of the future prison population, a particu-larly important indicator for projection purposes isthe national unemployment rate. The size of theyoung adult population is another influential factor
Unemployment
The unemployment rate appears to be a majordeterminant of the number of persons committed toprison. Analyses made by the Congressional ResearchService (CRS) "found a close correlation betweenadmissions and the yearly unemployment rate. Theunemployment rate had a striking similarity to thepattern of admissions." i/
This study indicates "that there are someplausible links that can be made between unemploymentper se and the change in the prison population."Rather than concluding "that unemployment 'causes'admissions to the prison system," CRS suggests "thatthe unemployment rate may stand as a proxy" for otherfactors that also influence the number of personscommitted to prison. 2/
JL/ Robinson, William H., Prison Population and Costs-Illustrative Projections to 1980, CongressionalResearch Service, April 24, 1974, p. 19-20.
2/ Ibid.
"Tim WITT
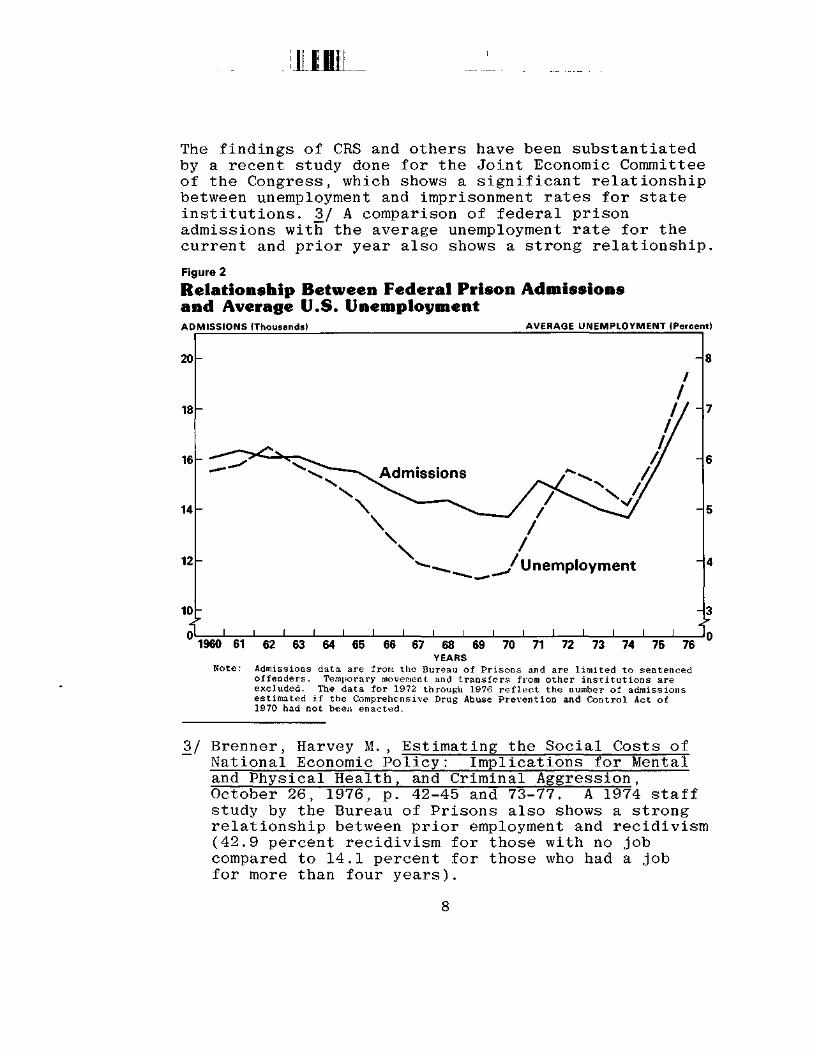
The findings of CRS and others have been substantiatedby a recent study done for the Joint Economic Committeeof the Congress, which shows a significant relationshipbetween unemployment and imprisonment rates for stateinstitutions. 3_/ A comparison of federal prisonadmissions with the average unemployment rate for thecurrent and prior year also shows a strong relationship.
Figure 2
Relationship Between Federal Prison Admissionsand Average U.S. UnemploymentADMISSIONS (Thousands) AVERAGE UNEMPLOYMENT (Percent)
20
18
16
14
12
10-L
ii-
/Unemployment
i i i i-3
In1960 61 62 63 64 65 66 67 68 69 70 71 72 73 74 75 76
YEARSNote: Admissions data are from the Bureau of Prisons and are limited to sentenced
offenders. Temporary movement and transfers from other institutions areexcluded. The data for 1972 through 1976 reflect the number of admissionsestimated if the Comprehensive Drug Abuse Prevention and Control Act of1970 had not been enacted.
Brenner, Harvey M. , Estimating the Social Costs ofNational Economic Policy: Implications for Mentaland Physical Health, and Criminal Aggression,October 26, 1976, p. 42-45 and 73-77. A 1974 staffstudy by the Bureau of Prisons also shows a strongrelationship between prior employment and recidivism(42.9 percent recidivism for those with no jobcompared to 14.1 percent for those who had a jobfor more than four years).
8
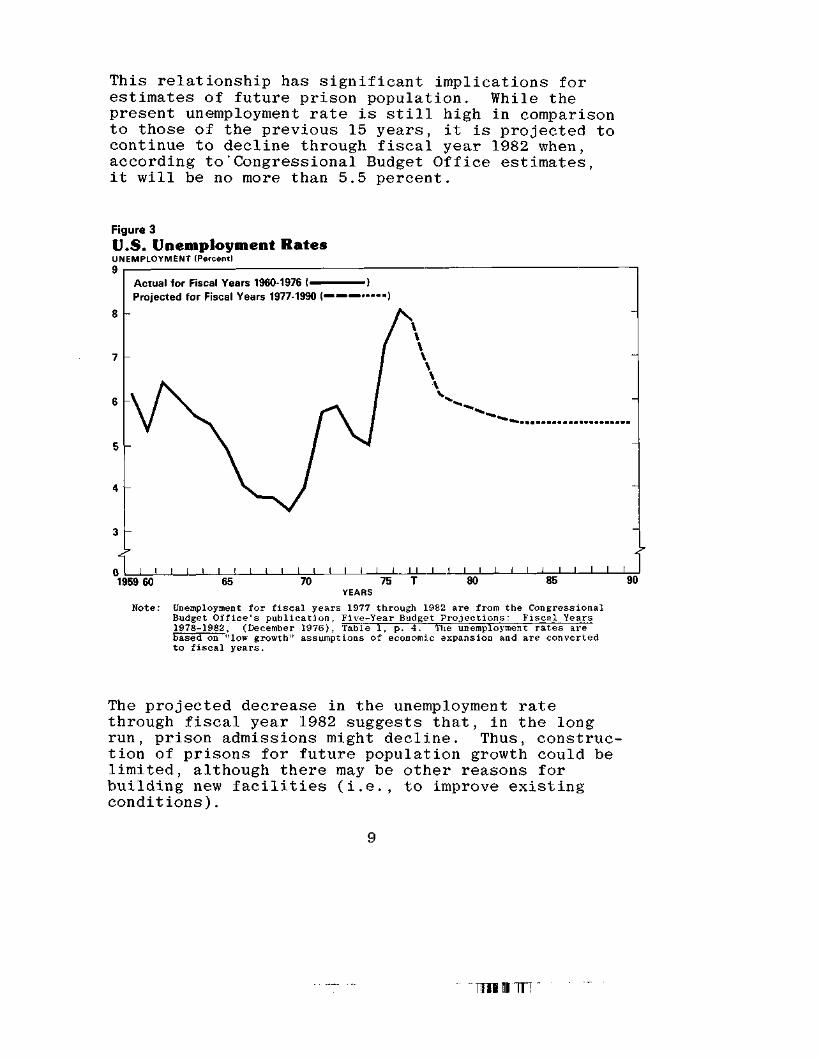
This relationship has significant implications forestimates of future prison population. While thepresent unemployment rate is still high in comparisonto those of the previous 15 years, it is projected tocontinue to decline through fiscal year 1982 when,according to'Congressional Budget Office estimates,it will be no more than 5.5 percent.
Figure 3U.S. Unemployment RatesUNEMPLOYMENT (Percent!
Actual for Fiscal Years 1960-1976 ( )Projected for Fiscal Years 1977-1990 (— ——
I I I I I I I I I I l l l I I I j_J I I I I I I L_J I L1959 60 65 70 75 T 80 85 90
YEARS
Note: Unemployment for fiscal years 1977 through 1982 are from the CongressionalBudget Office's publication, Five-Year Budget Projections: Fiscal Years1978-1982, (December 1976), Table 1, p. 4. The unemployment rates arebased on "low growth" assumptions of economic expansion and are convertedto fiscal years.
The projected decrease in the unemployment ratethrough fiscal year 1982 suggests that, in the longrun, prison admissions might decline. Thus, construc-tion of prisons for future population growth could belimited, although there may be other reasons forbuilding new facilities (i.e., to improve existingconditions).
9
Size of the Young Adult Population
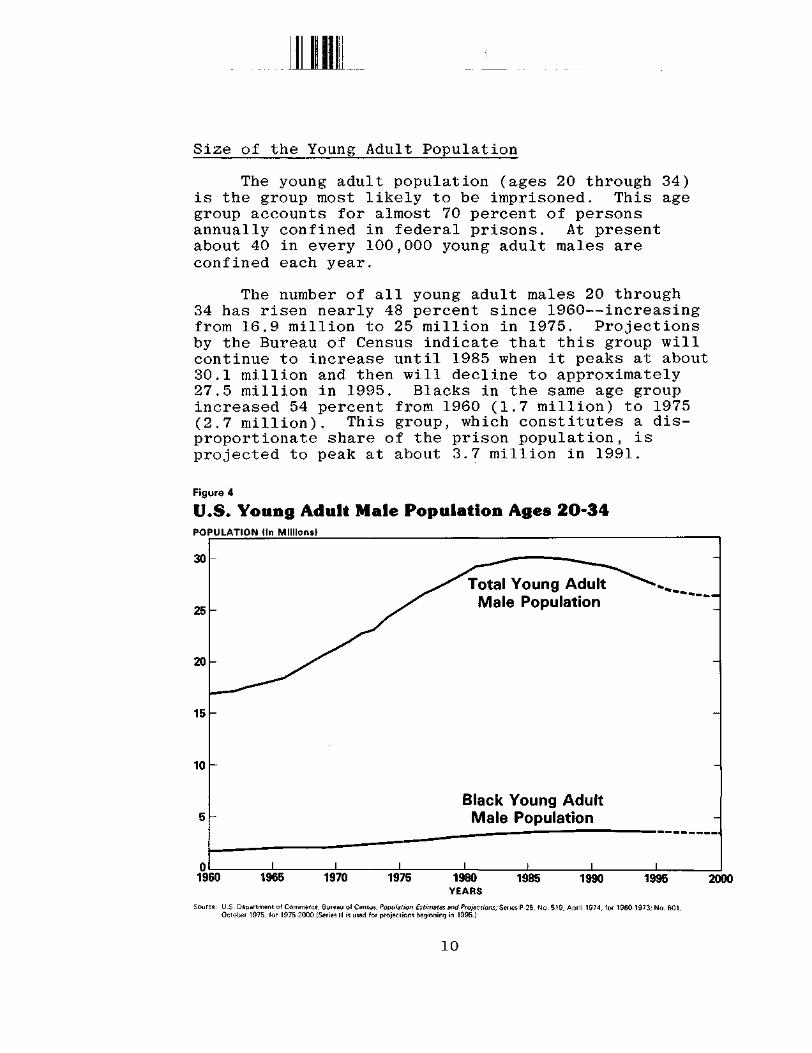
The young adult population (ages 20 through 34)is the group most likely to be imprisoned. This agegroup accounts for almost 70 percent of personsannually confined in federal prisons. At presentabout 40 in every 100,000 young adult males areconfined each year.
The number of all young adult males 20 through34 has risen nearly 48 percent since 1960—increasingfrom 16.9 million to 25 million in 1975. Projectionsby the Bureau of Census indicate that this group willcontinue to increase until 1985 when it peaks at about30.1 million and then will decline to approximately27.5 million in 1995. Blacks in the same age groupincreased 54 percent from 1960 (1.7 million) to 1975(2.7 million). This group, which constitutes a dis-proportionate share of the prison population, isprojected to peak at about 3.7 million in 1991.
Figure 4
U.S. Young Adult Male Population Ages 2O-34POPULATION (In Millions)
30
25
20
15
10
Total Young AdultMale Population
Black Young AdultMale Population
1960 1965 1970 1975 1980YEARS
1985 1990 1995 2000
Source: U.S. Department of Commerce, Bureau of Census, Population Estimates and Projections; Series P-25, No. 519, April 1974, for 1960-1973; No. 601,October 1975, for 1975-2000 (Series II is used for projections beginning in 1995.)
10
The likely effect of these population movementswill be to increase the number of prison admissionsuntil the mid-1980s, when they should start to decline. 4/However, this decline in prison admissions may be offsetsomewhat by the higher growth rate among young adultblacks. Even so, these projections suggest thatcaution should be exercised in proposing the construc-tion of new prisons to accommodate future growth inthe inmate population. New prisons for which initialfunding is requested in 1978 would not go into opera-tion until around 1980. However, within five years ofthat date prison admissions should begin to decline.
Changes in the Federal Criminal Justice System
The size of the prison population may be influ-enced by changes at various points in the federalcriminal justice process. These changes includepossible revisions to the Federal Criminal Code, levelof enforcement, conviction rates, sentencing policy,and time served. Except for new drug legislationeffective in 1971, the impact of changes in recentyears appears to be nominal. However, the potentialfor significant impact in the future is great.
Data on prosecution rates for federal offensesare limited. A 1973 survey estimated that about 25percent of all criminal matters brought to the atten-tion of U.S. attorneys were prosecuted. The remainingcases were dismissed initially or dropped afteradditional investigation. _5/ Any significant increasein prosecution rates or in the number of prosecutorscould affect the size of the prison population.
4_/ John Flanagan of the University of Wisconsin usesa "population at risk" of ages 20 through 29 andprojects that admissions to federal prisons willpeak in 1985. A model developed by Blumstein andCohen uses U.S. population at all ages and projectsa continued increase in the federal prison popula-tion beyond 1985.
j5/ U.S. Department of Justice, Pretrial DiversionProgram (March 1975), derived from estimates onflow of criminal matters.
11
IDuring the last six years, there has been little
change in the overall conviction rate (77.5 percentof defendants convicted in fiscal year 1970 comparedto 77.7 percent in fiscal year 1976). For robberyand narcotics convictions (which account for about23 percent of inmates received) the trends vary.Robbery conviction rates have increased slightlyfrom 81.9 percent in fiscal year 1970 to 84.8 percentin fiscal year 1976. The narcotics conviction ratehas remained at around 75 percent during the lastthree years. 6_/
If no changes took place in the number ofoffenders being confined, but an increase in thoseconvicted for serious crimes did occur; a longer-runincrease in the prison population would result becauseof the longer sentences being served. During the lastfive years, the most notable changes in crime categorieshave resulted from enactment of firearm legislation andthe Comprehensive Drug Abuse Prevention and Control Actof 1970. Violators of firearms laws accounted for upto 6.1 percent of inmates sentenced in fiscal year 1976compared to 2.8 percent in 1971. Narcotics offendersaccounted for 14.1 percent in 1976 compared with 7.1percent in 1971. 7/
Offenders today are receiving court sentenceswhich are substantially longer than those receivedby inmates currently being released for the sameoffenses. Those convicted of narcotics offensesare receiving sentences averaging 11.5 months longerthan those being released. Sentences for robberyconvictions are running 12.1 months longer; andsentences for larcency are running 7.1 months longer.
Q_l Compiled from Detailed Statistical Tables (TableD-4) Appendix I of Annual Reports of the Adminis-trative Office of the U.S. Courts for Fiscal Years1970 through 1976.
T_l Compiled from Bureau of Prisons Statistical Reports~~ (Table B-l) for Fiscal Years 1971 through 1976.
12
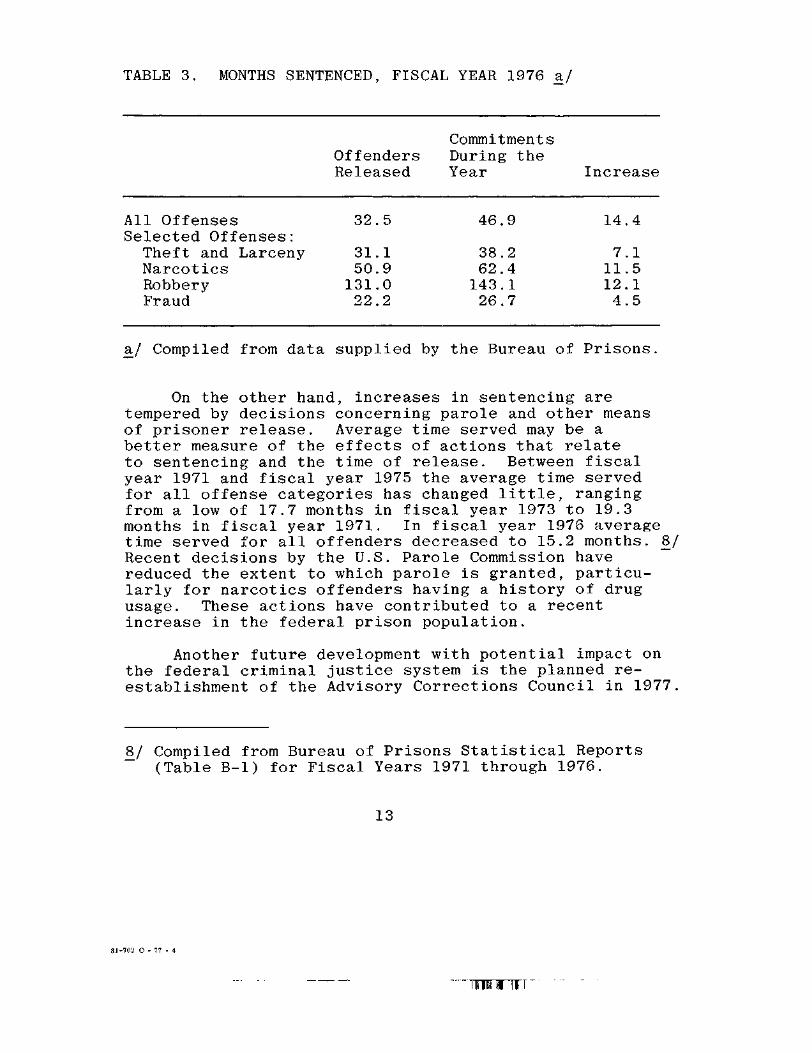
TABLE 3. MONTHS SENTENCED, FISCAL YEAR 1976 a/
CommitmentsOffendersReleased
All OffensesSelected Offenses:Theft and LarcenyNarcoticsRobberyFraud
32.
31.50.131.22.
5
1902
During theYear
46
386214326
.9
.2
.4
.1
.7
Increase
14.
7.11.12.4.
4
1515
a/ Compiled from data supplied by the Bureau of Prisons.
On the other hand, increases in sentencing aretempered by decisions concerning parole and other meansof prisoner release. Average time served may be abetter measure of the effects of actions that relateto sentencing and the time of release. Between fiscalyear 1971 and fiscal year 1975 the average time servedfor all offense categories has changed little, rangingfrom a low of 17.7 months in fiscal year 1973 to 19.3months in fiscal year 1971. In fiscal year 1976 averagetime served for all offenders decreased to 15.2 months. £3Recent decisions by the U.S. Parole Commission havereduced the extent to which parole is granted, particu-larly for narcotics offenders having a history of drugusage. These actions have contributed to a recentincrease in the federal prison population.
Another future development with potential impact onthe federal criminal justice system is the planned re-establishment of the Advisory Corrections Council in 1977
8y Compiled from Bureau of Prisons Statistical Reports~~ (Table B-l) for Fiscal Years 1971 through 1976.
13
81-702 O - 77 - 4
"I IS III I IT"
III ill
The membership of the Council will include represen-tatives from the Department of Justice and the federaljudiciary. As stated in the U.S. Code, the purpose ofthe Council is to "consider problems of treatment andcorrections of all offenders . . . and make suchrecommendations to the Congress, President, the JudicialConference and other officials as may improve theadministration of criminal justice." 9/
CBO Projections
CBO estimates that the federal prisoner populationwill increase from the June 30, 1976, level of 32,900to 33,900 in fiscal year 1987. This estimate is basedon an average increase taken from three projectionmodels: (a) unemployment (CRS as modified by CBO),(b) young adult population (John Flanagan), and (c)historical inmate population (Bureau of Prisons).
The Bureau of Prisons estimate for the 1987 federalprisoner population is 39,200. This estimate also is acomposite of several projections, including the Flanaganand Bureau of Prisons historical models. However, thesemodels do not consider unemployment rates as an indicatorof changes in prison population.
Inclusion of the unemployment model accounts forthe major difference between the CBO and Bureau ofPrisons projections for 1987. The unemployment modelexplains 94 percent of the year to year change inprison admissions and 68 percent of the change inprison discharges. If only this model were used, the1987 estimated prison population would decline by6,600 under CBO assumptions of high unemployment andby 8,300 under assumptions of lower unemployment.However, the inclusion of other factors, such aschanges in the federal criminal justice system, offsetsthe projected reductions. 10/
9/ 18 U.S. Code 5002.
10/ See Appendix B for discussion of populationprojections.
14
CHAPTER III ALTERNATIVE CAPITAL INVESTMENT STRATEGIES
CURRENT CONDITIONS
Many corrections specialists now maintain that"even well-designed, adequately funded rehabilitationprograms have not reformed criminals." This conclusionis documented in a study by Robert Martinson ofrehabilitation programs from 1945 to 1967. _!/ However,any consideration of alternative capital investmentstrategies for prison construction needs to be based ona set of consistent standards for the facilities.
The basic criteria usually applied to prisonfacilities cover: (a) size and type of institution,(b) amount of living space and privacy, and (c) locationof confinement. The overall quality standard appliedis one which corrections specialists view as being asnormal an environment as is possible for confinedoffenders. While the fact of confinement and itsconsequences are inescapables, there are conditions ofhuman existence in everyday society which correctionalspecialists believe should prevail inside prisonfacilities.
Size of Institution
Corrections specialists are in general agreementthat the large maximum security type prison is nolonger desirable or manageable. Smaller institutionsprovide an atmosphere for effective interaction bothamong inmates and between inmates and correctional staffThey also permit correctional programs to be built onsmall group organization, and allow closer managementand supervision of the inmate population. The
!_/ Included in Saxon, Mariam, Prison Reform: Federal~ Role, Congressional Research Service Issue Brief
Number IB 75077, October 2, 1975, p. 2.
15
THOFTT
Mill 18:1111
Clearinghouse for Criminal Justice Planning andArchitecture (an affiliate of the Law EnforcementAssistance Administration) recommends that the sizeof new facilities be limited to a capacity of 400. 2yThe Clearinghouse also recommends that building designshould be as conventional as security considerationspermit.
About 17 percent of the existing prison populationis confined in institutions that have a long-rangecapacity within the National Clearinghouse sizelimitation of 400. Another 45 percent is confined insix institutions with planned long-range capacities inexcess of 600 and in the three oldest penitentiaries,which are slated to be closed eventually by the Bureauof Prisons. 3/
These penitentiaries were constructed before 1907and in view of current professional standards areconsidered obsolete. Bureau of Prisons officials donot believe that these facilities meet minimum standardsof human dignity or that they are conducive to theconduct of effective correctional programs, includingthe needs for adequate supervision and inmate safety.As of June 30, 1976, their respective populations were2,164 at Atlanta, 1,834 at Leavenworth, and 1,045 atMcNeil Island.
2_/ Ibid. , p. 2. The Clearinghouse establishes standardsfor new prison facilities to be constructed by stateand local governments requesting special financialassistance from the LEAA.
3/ Compiled from population data from U.S. Department ofJustice report on Federal Prisoners Confined onJune 30, 1976 (Prepared July 7, 1976) and Bureau ofPrisons long-range capacity estimates of September 16,1976.
16
Living Space and Privacy
Most professional standards for correctionalfacilities recommend "a minimum of 70 to 80 squarefeet of floor space per person." 4/ In addition,housing in individual rooms is considered importantin providing privacy for incarcerated persons. Suchprivacy also permits increased safety of individualoffenders and control over the overall inmate popu-lation. A study of inmates living in varying amountsof space at 37 different institutions revealed "asignificant association between density and totalassaults" on staff and inmates. The study wasconducted for the Bureau of Prisons in 1975. 5_/
Nearly half of all of the prisoners have lessthan 45 square feet of living space per inmate.Most of these prisoners are concentrated in thethree oldest penitentiaries where it is common forinmates to be housed six and eight to a cell (80percent having less than 45 square feet per inmate).Of the total prison population, less than 20 percenthave more than 65 square feet per inmate. 6/
4_/ Bureau of Prisons, Federal Prison System--Long-Range Facility Analysis, draft, May 1976.
/̂ Nacci, Peter L., and others, Population Densityand Inmate Misconduct Rates in the Federal PrisonSystem, U.S. Bureau of Prisons Research Office(October 1976), p. 11.
(3/ Compiled from data supplied by Bureau of Prisons,September 20, 1976.
17
—mnnirr
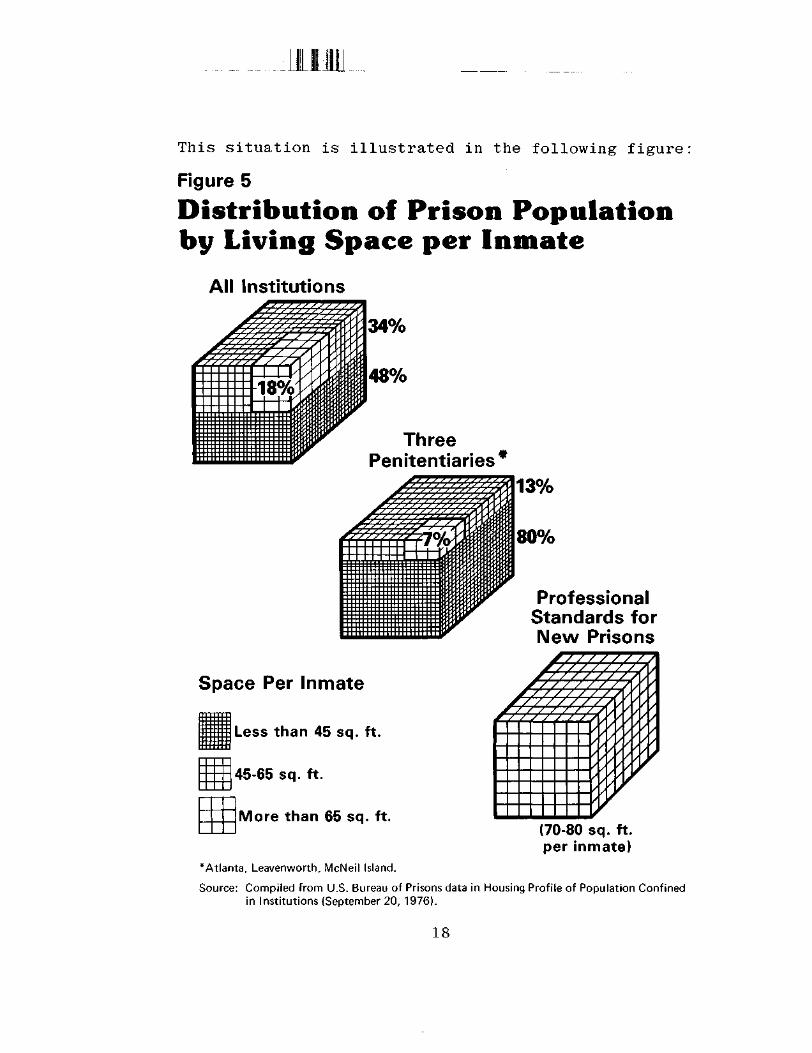
This situation is illustrated in the following figure
Figure 5
Distribution of Prison Populationby Living Space per Inmate
All Institutions
ThreePenitentiaries*
/ X /
// /
7*7̂
/ / / / s /
/ // / / /*
— ru| ;
?' I;; : ' :
1 ' : . ' •r
13%
80%
ProfessionalStandards forNew Prisons
Space Per Inmate r / //' 7 / /
' / / / / ./ / / / /
Less than 45 sq. ft.
45-65 sq. ft.
More than 65 sq. ft.
'/
(70-80 sq. ft.per inmate)
*Atlanta, Leavenworth, McNeil Island.
Source: Compiled from U.S. Bureau of Prisons data in Housing Profile of Population Confinedin Institutions (September 20, 1976).
18
Furthermore, existing prison facilities affordlittle privacy. About 70 percent of the 26,566 inmatesconfined in conventional federal facilities are housedin multiple cells or dormitory buildings. As a stop-gap measure, the Bureau of Prisons is providing someprivacy in dormitory buildings by installing partitionsto create individual living spaces. However, at presentless than 25 percent of those housed in dormitories ormultiple cells have individually partitioned quarters. 7/
Location of Confinement and Community Ties
Most professionals in the field agree thatcorrectional institutions should be located nearurban centers and that the place of confinementshould be as close as possible to the offender'shome community. Location in urban centers permitsready access to a number of community services andto opportunities for job training and employment.Close proximity to the offender's "outside" residencestrengthens family and community ties and improvesthe possibility of his obtaining and keeping ameaningful job.
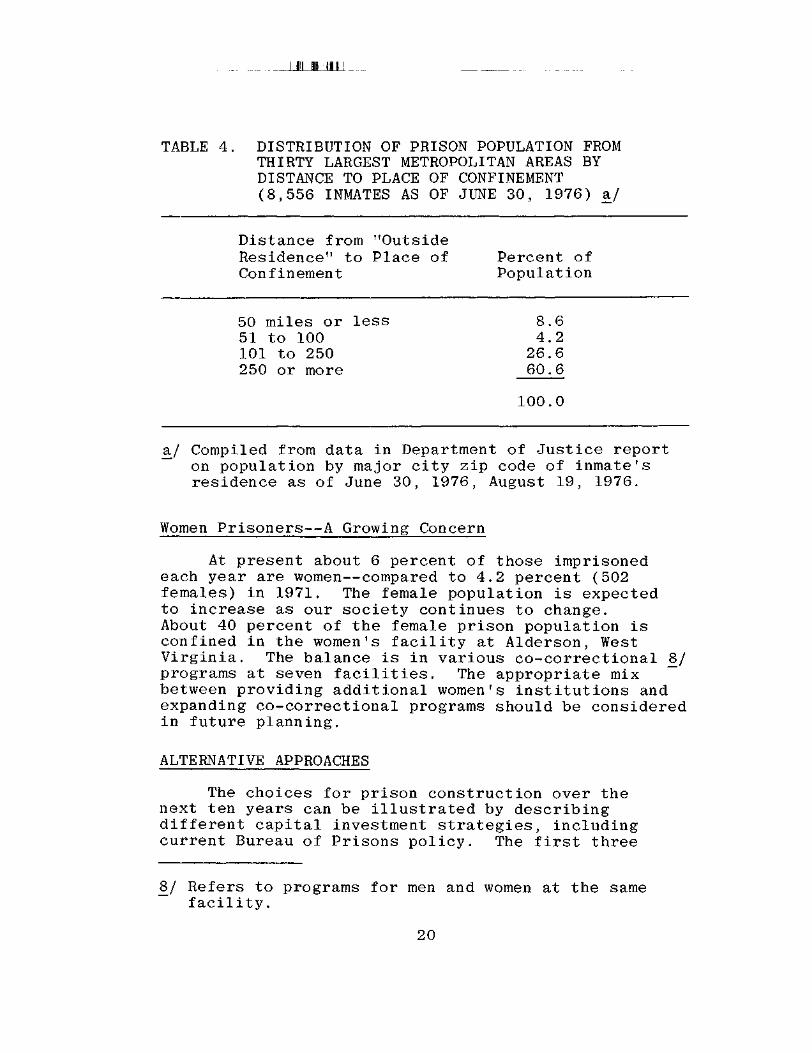
A survey of prisoners who have their "outside"residence in the nation's 30 largest metropolitanareas (representing 45 percent of those confined inconventional federal institutions) indicates thatfewer than 10 percent are confined within a distanceof 50 miles or less from their homes. About 60percent are confined at a distance of 250 miles ormore. Nearly a third of those imprisoned 250 milesor more from their homes are confined in the threeoldest penitentiaries. By contrast, nearly 70percent of those confined in Federal CommunityTreatment Centers (half-way houses) are within 50miles of their "outside" residence.
T_l Compiled from data supplied by Bureau of Prisons,September 20, 1976, and October 15, 1976.
19
nnijirr
. __ULJIJlii
TABLE 4. DISTRIBUTION OF PRISON POPULATION FROMTHIRTY LARGEST METROPOLITAN AREAS BYDISTANCE TO PLACE OF CONFINEMENT(8,556 INMATES AS OF JUNE 30, 1976) a/
Distance from "OutsideResidence" to Place of Percent ofConfinement Population
50 miles or less 8.651 to 100 4.2101 to 250 26.6250 or more 60.6
100.0
a,/ Compiled from data in Department of Justice reporton population by major city zip code of inmate'sresidence as of June 30, 1976, August 19, 1976.
Women Prisoners—A Growing Concern
At present about 6 percent of those imprisonedeach year are women—compared to 4.2 percent (502females) in 1971. The female population is expectedto increase as our society continues to change.About 40 percent of the female prison population isconfined in the women's facility at Alderson, WestVirginia. The balance is in various co-correctional 8/programs at seven facilities. The appropriate mixbetween providing additional women's institutions andexpanding co-correctional programs should be consideredin future planning.
ALTERNATIVE APPROACHES
The choices for prison construction over thenext ten years can be illustrated by describingdifferent capital investment strategies, includingcurrent Bureau of Prisons policy. The first three
8_/ Refers to programs for men and women at the samefacility.
20
options deal primarily with variations in the qualityand type of confinement based on the same populationprojection. The last option deals with a significantexpansion in prison population. No allowance is madein any of the options for any significant change inthe number of sentenced federal offenders confined instate and local facilities. Nor is any considerationgiven to the possibility of newly defined federalcrimes or to decriminalization of any current federaloffense. The four options are general examples ofpossible approaches—many others are possible.
Option 1: To provide for projected populationgrowth only with no improvement inexisting prison conditions (no newprison beds and 1,350 additionalhalf-way house beds).
Option 2: To provide for projected populationgrowth and continue the currentBureau of Prisons policy of improvingthe quality of confinement (6,750 newprison beds and 1,350 additionalhalf-way house beds).
Option 3: To reduce the emphasis on conventionalimprisonment by stressing community-based programs (1,700 new prison bedsand 4,300 additional half-way housebeds).
Option 4: To increase the emphasis on the use ofconventional imprisonment—requiringa significant expansion of prisoncapacity (12,050 new prison beds and1,350 additional half-way house beds).
Option l--To Provide for Projected Population Growth Only
Under this option, prison construction would belimited to provision for growth in the inmate populationwhich is estimated by CBO to increase moderately overthe next ten years—reaching 33,900 in fiscal year 1987.
21
ill 1 II
IllThis 1,000 increase in inmate population wouldrequire 1,084 additional beds. These would beprovided by completion of four projects for whichconstruction is scheduled to begin by September 30,1977, (2,100 beds) and planned expansion of half-way house capacity (1,350 beds). £/ No other newprison facilities would be provided. The threeoldest penitentiaries would continue to be usedalong with other existing institutions. This optionwould not provide for any significant improvement inexisting conditions which are considered unacceptableby Bureau of Prisons officials.
Completion of the facilities under contractwould not require additional construction fundingbut would result in estimated outlays of $18 millionin fiscal year 1978 and $21 million in fiscal year1979. Operating costs would increase by $14 millionin 1987.
Option 2—To Provide for Projected Population Growthand Continue the Current Bureau of Prisons Policy ofImproving the Quality of Confinement
New facilities provided under current Bureau ofPrisons policy at the planned level of constructionwould provide 6,750 new prison beds over the nextten years at an estimated capital investment cost of$285 million. Consistent with recent Congressionaldirection and Bureau of Prisons planning, this optionwould permit a more normal inmate environment byclosing the three oldest penitentiaries as well asincreasing living space and inmate privacy.
Professor Norval Morris' The Future of Imprison-ment IQ/provides the rationale for current federalplanriTng. Confinement is in itself considered
9_/ Includes a correctional facility at Otisville,New York, and three youth centers (Memphis,Tennessee; Bastrop, Texas; and Talladega, Alabama)
10/ Morris, Norval, The Future of Imprisonment,University of Chicago Press, 1974.
22
punishment rather than the condition of imprisonment.Accordingly, the objective is to create a prisonenvironment that is similar to a normal livingsituation.
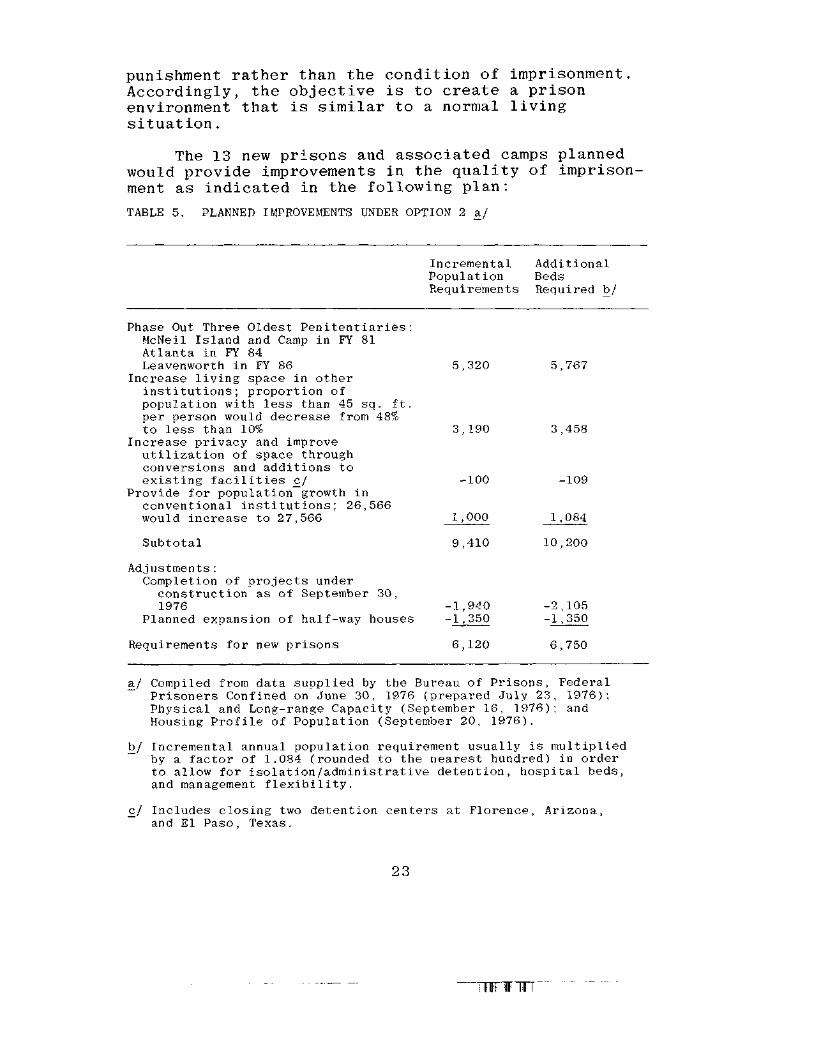
The 13 new prisons and associated camps plannedwould provide improvements in the quality of imprison-ment as indicated in the following plan:
TABLE 5. PLANNED IMPROVEMENTS UNDER OPTION 2 a/
Incremental AdditionalPopulation BedsRequirements Required b/
Phase Out Three Oldest Penitentiaries:McNeil Island and Camp in FY 81Atlanta in FY 84Leavenworth in FY 86 5,320 5,767
Increase living space in otherinstitutions; proportion ofpopulation with less than 45 sq. ft.per person would decrease from 48%to less than 10% 3,190 3,458
Increase privacy and improveutilization of space throughconversions and additions toexisting facilities c/ -100 -109
Provide for population growth inconventional institutions; 26,566would increase to 27,566 1,000 _1_,_084_
Subtotal 9,410 10,200
Adjustments:Completion of projects underconstruction as of September 30,1976 -1,940 -2,105
Planned expansion of half-way houses -1,350 -1,350
Requirements for new prisons 6,120 6,750
a./ Compiled from data supplied by the Bureau of Prisons, Federal~ Prisoners Confined on June 30, 1976 (prepared July 23, 1976);
Physical and Long-range Capacity (September 16, 1976); andHousing Profile of Population (September 20, 1976).
b/ Incremental annual population requirement usually is multipliedby a factor of 1.084 (rounded to the nearest hundred) in orderto allow for isolation/administrative detention, hospital beds,and management flexibility.
£/ Includes closing two detention centers at Florence, Arizona,and El Paso, Texas.
23
:ll II ill
Under this option, annual operating costs wouldincrease by $38 million in 1987 in addition to the$285 million capital investment.
Option 3--To Reduce the Emphasis on ConventionalImprisonment by Stressing Community-based Programs
Current planning objectives of the Bureau ofPrisons include an expanded use of half-way houses,increasing from an average daily population of 1,400at present to 2,750 in 1987. The Bureau has respondedpositively to Congressional interest in this area. 1_1/
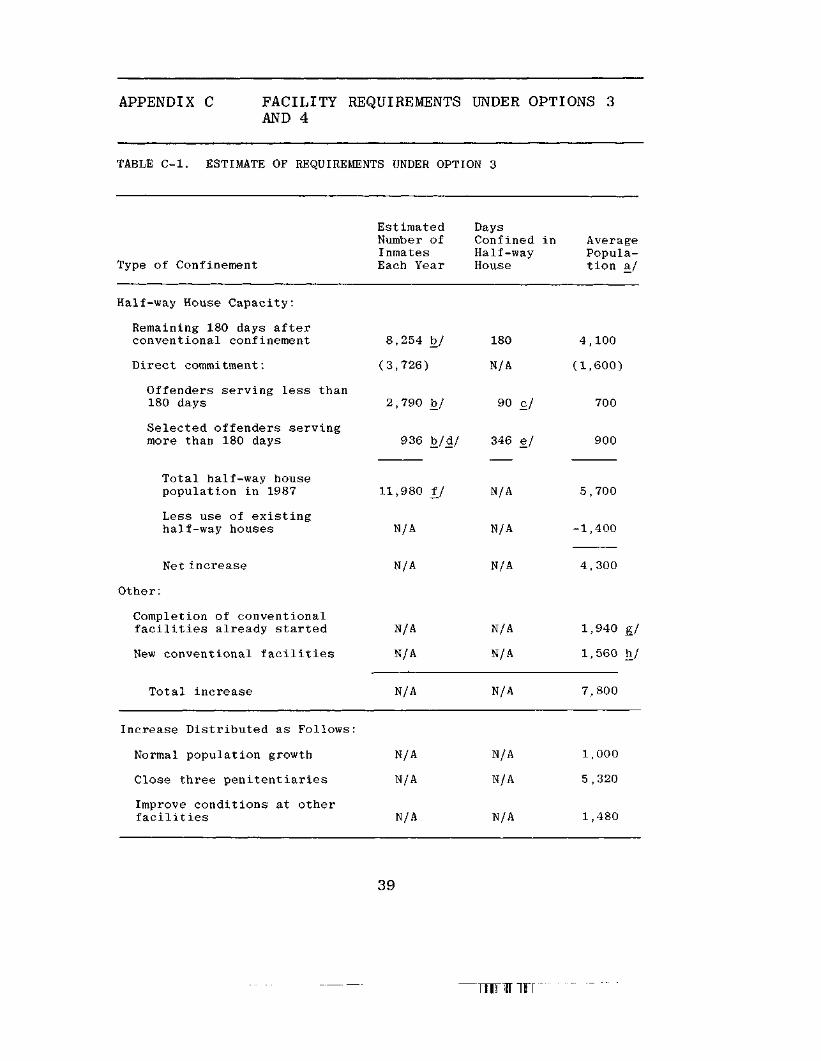
This option would expand the use of half-wayhouses beyond current Bureau of Prisons objectives.The length of residence in half-way houses would beextended for most offenders from the planned 90 daysto 180 days. Also, there would be direct commitmentsof some offenders at the time of conviction. Theestimated average daily half-way house populationwould be 5,700 in 1987. Of the 5,700, approximately4,100 or 70 percent represent offenders serving atotal of 180 days after having spent some time inconventional prisons. The remaining 1,600 representdirect commitments upon conviction, including thoseserving terms of less than 180 days and certainoffenders with terms in excess of 180 days who have noknown record of prior commitments. 12/
Under this option, the construction of conventionalfacilities would be limited to completion of the fourprojects for which construction was scheduled to beginby September 30, 1977, and four other new facilitieswhich are planned to start during fiscal year 1978. 13/
11/ See Appendix A for extract from Senate AppropriationsReport No. 94-964.
12/ See Appendix C for detailed computations.
]J3/ Two Metropolitan Correctional Centers (Phoenix,Arizona, and Detroit, Michigan) and two Youth Centers(Camarillo, California, and Philadelphia/New Jersey).Total of 1,700 beds provides combined capacity of1,560.
24
At present, nearly 40 percent of offendersreleased from prison spend the last 70 to 75 days inhalf-way houses. This means that on an average dayabout 4.4 percent of the prison population is under-going a transition from conventional confinement tocommunity life. Little, if any, use is made ofexisting authority for direct confinement to half-wayhouses upon conviction. The Bureau of Prisons believesthat the initiative in this area probably should betaken by federal judges.
The primary objective of the half-way house isto provide the offender with increasing degrees ofsupervised freedom and an environment in which he isable to exercise self-discipline and self-sufficiency.For example, most offenders are able to obtainemployment within two weeks and then buy their ownmeals and pay $2 per day for board. Self-disciplineis encouraged by providing a place of residence undera supervised setting—averaging 50 inmates under astaff consisting of a director and from two to sevenother full-time employees.
Any proposal for a significant expansion of theuse of half-way houses would be controversial. Thosewho object to extending the period of residence inhalf-way houses to 180 days are concerned that thefailure rates would increase; i.e., the number ofescapes or returns to prison for serious misconduct.Also, there would be considerable resistance by manyto the direct commitment of convicted felons to half-way houses rather than to conventional prison facilities.The basis of this opposition is evidence that recidivismrates would be higher for offenders not having firstserved some time in conventional prison facilities.
However, persuasive arguments are advanced by some insupport of greater use of half-way houses. They believethat half-way houses offer an effective means ofreinforcing family and community ties by permittinginmates to be confined in smaller supervised settingslocated in their own communities. There are greatlyimproved opportunities to provide employment for mostinmates in meaningful jobs in the community compared toan average participation rate of less than 1 percent inwork release programs under conventional imprisonment.
25
nun"
The use of half-way houses is less expensive—$7,365 per offender compared to $17,305 per offenderfor new conventional prisons. Also, the use of half-way houses can facilitate the rapid accommodation ofchanges in prison population. This option would permitthe closing of the three penitentiaries and reductionof population at other existing facilities.
The capital investment required for this optionwould be approximately $70 million, compared to $285million under the current Bureau of Prisons policyalternative described under option 2. 14/ Totaloperating costs in 1987 would be $14 mTTlion.
Option 4—To Increase Emphasis on the Use of Conven-tional Imprisonment
The basis for this option is an increased use ofimprisonment of convicted offenders, the opposite ofthe approach under option 3. This option could beimplemented by requiring mandatory minimum sentencesfor certain crimes lj5/ and the serving of some timefor all other offenses for which probation is nowgranted. This option would require a significantexpansion of prison capacity. Its adoption couldpreclude closing the three penitentiaries and improvingconditions in other existing facilities during the nearfuture. In the hypothetical premise on which thisoption is based, the duration of imprisonment foroffenders currently placed on probation would average
14 / The Bureau of Prisons estimates that the fourfacilities to be started during fiscal year 1978will have a total cost of $70.1 million, of which$6.9 million has been appropriated.
15/ Mandatory minimum sentence of 2 years is assumedfor first offenders for murder, assault, burglary,robbery, and narcotics violations and 4 years forsecond offenders (similar to provisions in S, 2698introduced in the 94th Congress).
26
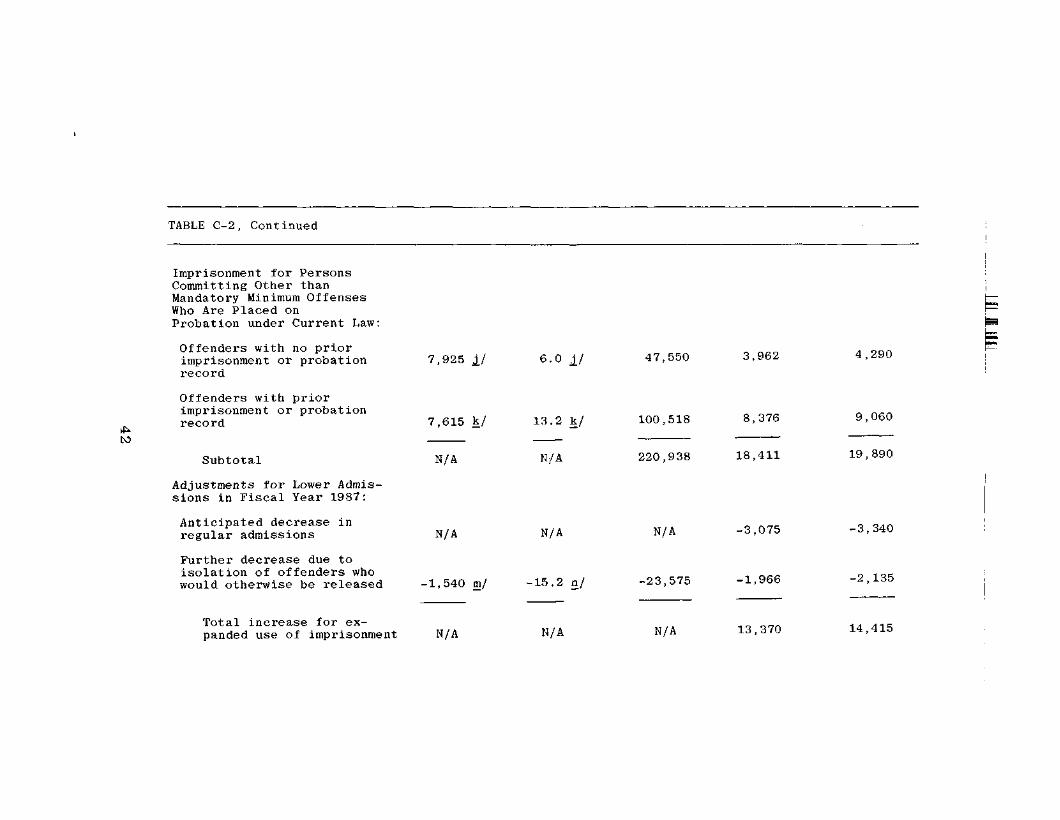
six months 16/ for those without prior records (noprison or probation record) and for those with priorrecords--about half the term now served by thosecurrently imprisoned for the same offense. Theoverall long-term effect would be to increase theaverage daily prison population by about 13,370 above thecurrent population projection. 17/
At present about 45 percent of sentenced personsare placed on probation. Generally, the percentage ismuch smaller for serious crimes; i.e., 11 percent forrobbery and 29 percent for narcotics offenses. Thesepercentages contrast sharply with those for certainwhite-collar convictions which have a probation rateof about 64 percent. IS/
Increasing the use of confinement places primaryemphasis on protection of the community and theretribution objectives of imprisonment. ProfessorsJames Q. Wilson and Ernest Van den Haag are leadingproponents of the position that crime can be reducedby imprisoning more offenders--particularly habitualor career criminals. 19/ It is argued that curtailingprobation and increasing some sentences would reducecrime due to:
16/ Wilson, James Q., Thinking About Crime, BasicBooks, Inc., 1975, p. 180. Average imprisonmentof six months for most offenders who are nowplaced on probation appears to be consistent withWilson's view that every conviction for a non-trival offense would entail a penalty rangingfrom one week for many offenses to six months toa year for most offenses.
17/ See Appendix C for detailed calculations.
18/ Annual Report of the Director of the AdministrativeOffice of the U.S. Courts, 1976, Appendix II, TableD-5. Offenses for embezzlement, fraud, income taxand extortion are used for white-collar crimes.
19/ Wilson, op. cit., and Van den Haag, Ernest, PunishingCriminals, Basic Books, Inc., 1975.
27
"iTfTTTTT
isolation of offenders who would otherwisebe free to commit further crimes, and
increased certainty and severity of punish-ment and added sense of shame in the offender
Increased use of confinement also is predicatedon the following:
o In the last 15 years the crime ratehas steadily increased while the percentageof criminals in prison has declined and theproportion placed on probation has increased.
o Crime is often a way of making a living whichinvolves "practical" decisions of whether thecosts and risks of committing an offense areworth the anticipated gain.
Those opposing increased emphasis on confinementargue that neither the certainty nor the severity ofimprisonment deter crime. They maintain that offendersplaced on probation do not have higher rates ofrecidivism and that a reduction in the use of probationwould increase the demands for jury trials because ofthe lessened incentive to plead guilty--85 percent ofconvictions in federal criminal cases are obtainedwithout jury trials.
Even though many offenders (who would otherwisebe placed on probation) would receive short sentences,this option would require a substantial increase inprison construction and operating costs. Over thenext ten years the increased use of imprisonment wouldrequire an estimated addition of 12,050 new prisonbeds, 20/ placing the capital investment cost of thisoption at $510 million. Annual operating costs wouldincrease by $186 million in 1987, compared to anincrease of $38 million under current Bureau of Prisonspolicy. 21/
20/ See Appendix C for detailed calculations.
21I See Appendix D for cost comparisons.
28
A Counter View
A number of critics of existing correctionsprograms at both the federal and state levels advocateclosing most prisons or, at a minimum, not buildingany new ones. Strategies such as improving thequality of existing institutions or simply substitutinghalf-way houses for conventional imprisonment areresisted in favor of more fundamental changes directedtoward providing jobs and other incentives "to gostraight." This view is based on the following beliefs:
o U.S. crime rates are higher than in most othercountries. Furthermore, the United States hashigher rates of imprisonment than in most othercountries.
o Most persons who are imprisoned are "victims ofa socioeconomic system that harshly discriminatesagainst the poor and minorities" 22/ with non-whites serving about 50 percent more time thanwhites.
o Confinement is inherently "cruel and unusualpunishment" which should be discontinued onconstitutional grounds.
o Imprisonment does not effectively reduce thelikelihood that further offenses will becommitted upon release and may actually leadto the commission of further crimes.
22/ Serrill, Michael S., "Critics of Corrections SpeakOut," Corrections Magazine, March 1976, p. 5.
29
" TTifTirr
. JJLJLJILL
COST COMPARISONS
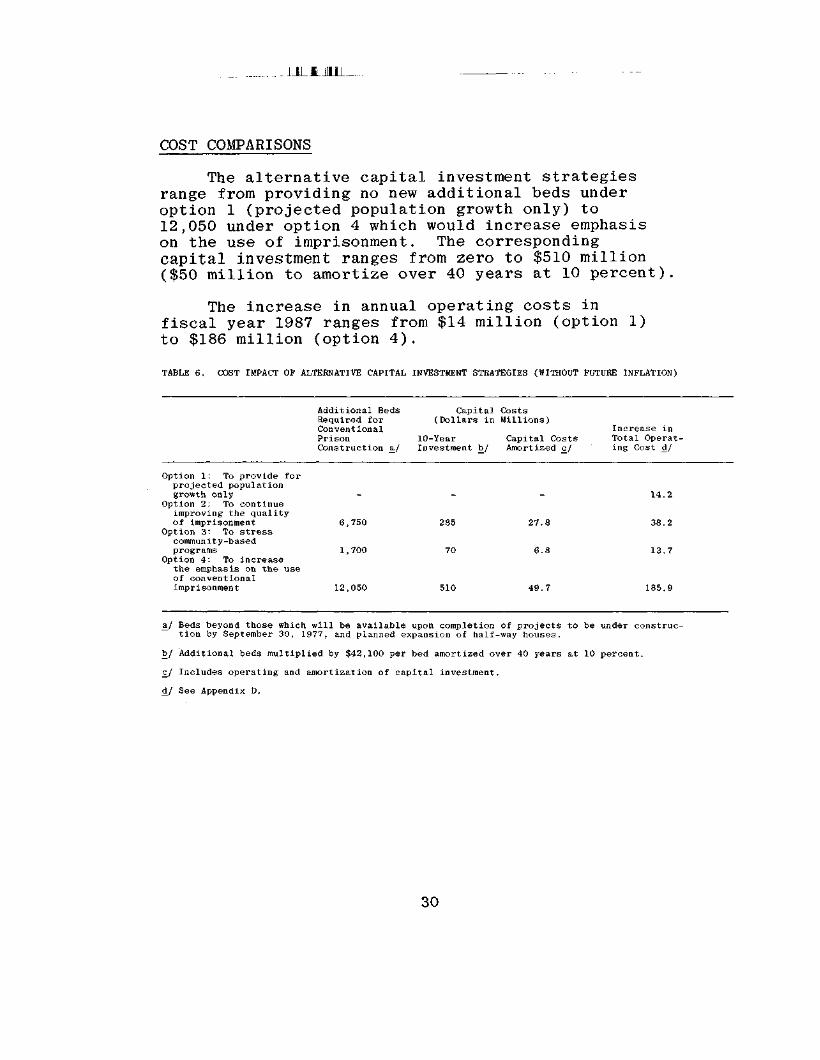
The alternative capital investment strategiesrange from providing no new additional beds underoption 1 (projected population growth only) to12,050 under option 4 which would increase emphasison the use of imprisonment. The correspondingcapital investment ranges from zero to $510 million($50 million to amortize over 40 years at 10 percent).
The increase in annual operating costs infiscal year 1987 ranges from $14 million (option 1)to $186 million (option 4).
TABLE 6. COST IMPACT OF ALTERNATIVE CAPITAL INVESTMENT STRATEGIES (WITHOUT FUTURE INFLATION)
Additional BedsRequired forConventionalPrisonConstruction &/
Capital Costs(Dollars in Millions)
10-Year Capital CostsInvestment b/ Amortized cy
Increase inTotal Operat-ing Cost d/
Option 1: To provide forprojected populationgrowth only
Option 2: To continueimproving the qualityof imprisonment 6,750
Option 3: To stresscommunity-basedprograms 1,700
Option 4: To increasethe emphasis on the useof conventionalimprisonment 12,050
285
510 49.7
14.2
38.2
13.7
185.9
a/ Beds beyond those which will be available upon completion of projects to be under construc-tion by September 30, 1977, and planned expansion of half-way houses.
b/ Additional beds multiplied by $42,100 per bed amortized over 40 years at 10 percent,
cy Includes operating and amortization of capital investment,
dy See Appendix D.
30
The differences in annual costs per offender area significant factor affecting the total cost of thealternative capital investment strategies. The averagebudgeted cost per offender in existing conventionalinstitutions is estimated at $9,600 annually. Thiscompares to $17,305 (operating expenses and capitalamortization) per offender to be housed in new conven-tional facilities and $7,365 per offender in a half-way house. 23/
23/ See Appendix D for definitions and basis for costcalculations.
31
'TTirTUT
APPENDIX A EXTRACT FROM SENATE APPROPRIATIONSCOMMITTEE REPORT 94-964 (pages 21-23)
For the past several years the Committee haswrestled with the question of construction of newpenal facilities. Last year the Committee passedover without prejudice the budget request for newconstruction because there was some question aboutthe capacities of Federal prison facilities andwhether they were being fully utilized.
The Committee recognizes that the Bureau hasno control over the number of inmates in the system.The Bureau has no option but to accept those indi-viduals who have been sentenced by the Federalcourts. The latest statistics, however, indicatethat inmate population has now reached 27,039, anall-time high. During the past year, the populationhas increased by 3,708 and in recent months has beenincreasing at a rate of about 100 inmates per week.There can be no doubt, based on these latest figures,that the Federal Prison System is overcrowded. More-over, the frequency of physical assaults by inmatesagainst each other, as well as against staff members,is another form of evidence that additional facilitiesare needed. The Committee is convinced that furtherdelay in the construction of the two facilities atissue could only lead to further overcrowding,increasingly inhumane treatment of prisoners and theincreasing danger of violence. Consequently, theCommittee concurs in the House allowance for theconstruction of two new facilities.
However, this should not be construed as anassurance that the Committee would favorably considerany future construction requests, or that the Committeehas lost its interest in alternatives to presentsentencing and correctional practices. Most emphat-ically, this should not be construed as a reason forthe Justice Department to delay in bringing about thenecessary reforms in the criminal justice system. Tothe contrary, the Committee admonishes the Department,in the strongest possible terms, to take whateveractions are necessary to promote such reforms.
32

There is no question that the Justice Departmentclearly could be doing more than it is now doing inthis area to promote reform. For example, when amajority of criminal cases are disposed of by pleabargaining, and not by judicial process, the enormousrole of the Department of Justice in sentencing policycannot be ignored.
The Department of Justice is further admonishedto seek legislation to assure greater uniformity andrationality in sentencing practice, if legislation isnecessary. However, until legislation can be enacted,the Advisory Corrections Council authorized under18 U.S.C. 5002 would be an appropriate forum to beginthe search for workable reforms.
In its review of sentencing and correctionalpolicy, the Department of Justice is directed toconsider alternatives to incarceration for appropriatenon-violent offenders, as well as steps that may berequired to assure that those who commit violent actsreceive adequate prison terms.
Intensive community supervision of parolees andprobationers is one alternative that has been developedby the Law Enforcement Assistance Administration thatthe Department of Justice and the Advisory Councilshould examine. Another is restitution of losses tothe victims of property crimes. The Committee is alsoaware that existing half-way houses and communitytreatment centers are not being as fully utilized asthey might be.
The cost of constructing and operating new prisonfacilities is enormous, and the use of imprisonmentis the most expensive sanction which can be imposed ona criminal offender. Because cost makes imprisonmenta scarce resource, it is essential that imprisonmentonly be used where necessary to assure the protectionof society or the administration of just punishment.In those cases in which imprisonment is not necessary,the range of alternatives to incarceration currentlyavailable is clearly unsatisfactory.
This is only the beginning of policy questionswhich the Department of Justice and the AdvisoryCouncil should examine before coming back to theCommittee for new funds for correctional institutionsor agencies.
33
TFimrr
.£JUL
Although the Committee recommends the budget asapproved by the House, it should be clear that theintent is that the additional facilities should beused to provide more humane treatment of prisonersand encourage rehabilitation. As the reforms proposedare implemented the Committee expects to see a down-ward trend in prison population that would accommodatethe phase out of the large, antiquated penitentiaries.Continued use of such facilities by a prison systemwhich prides itself on its ability to promote the useof new and innovative correctional methods is destruc-tive to the stated objectives of the Federal PrisonSystem and to the unfortunate inmates who are housedin these degrading institutions.
34
APPENDIX B PROJECTION OF PRISON POPULATION
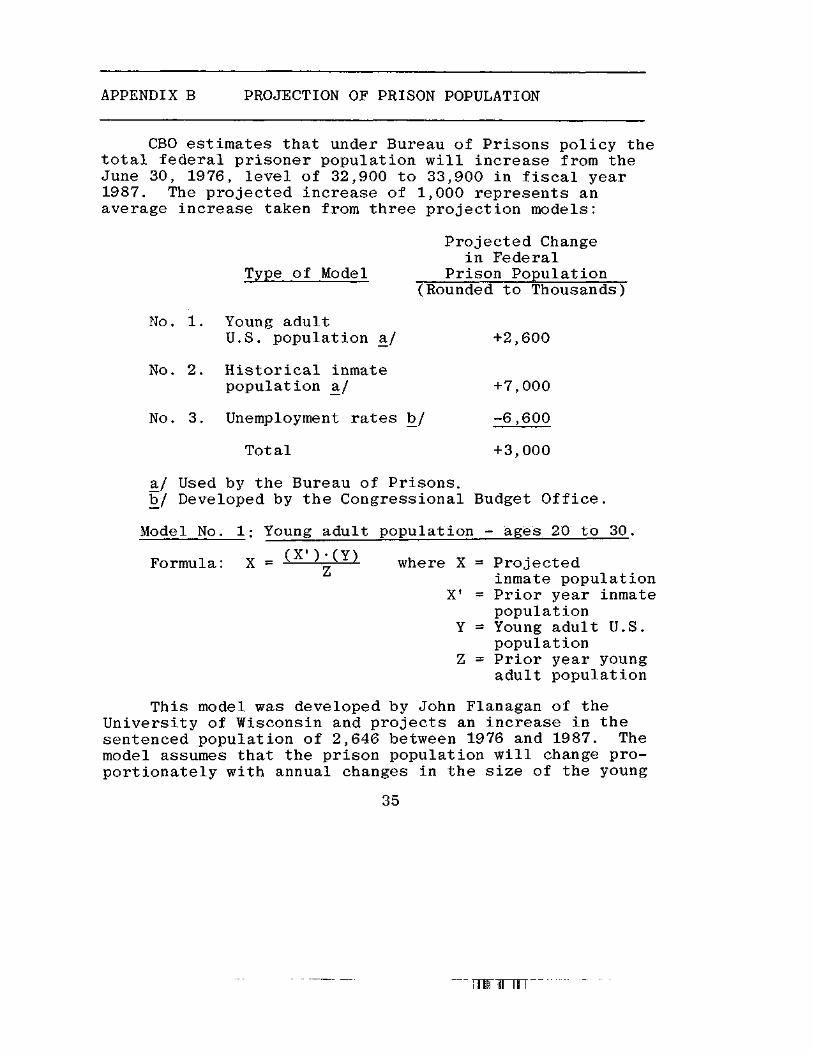
CBO estimates that under Bureau of Prisons policy thetotal federal prisoner population will increase from theJune 30, 1976, level of 32,900 to 33,900 in fiscal year1987. The projected increase of 1,000 represents anaverage increase taken from three projection models:
No. 1.
No. 2.
No. 3.
Type of Model
Young adultU.S. population a./
Historical inmatepopulation a/
Projected Changein Federal
Prison Population(Rounded to Thousands)
+2,600
Unemployment rates b/
Total
+7,000
-6,600
+3,000
a/ Used by the Bureau of Prisons.b_/ Developed by the Congressional Budget Office.
Model No
Formula:
Young adult population - ages 20 to 30.
where X
X'
y _ (X')-(Y)X " Z
Projectedinmate populationPrior year inmatepopulation
Y = Young adult U.S.population
Z = Prior year youngadult population
This model was developed by John Flanagan of theUniversity of Wisconsin and projects an increase in thesentenced population of 2,646 between 1976 and 1987. Themodel assumes that the prison population will change pro-portionately with annual changes in the size of the young
35
adult population (ages 20-30). This approach does nottake into account changes in the rates or severity ofcriminal activity. It assumes the criminal justice system,particularly parole and other forms of prisoner release,will continue without change.
Model No. 2: Historical inmate population.
Formula: X = X' + Y where X =
X' =
Y =
Projected inmatepopulationPrior year inmatepopulation757 prisoners I/
This model projects an increase in the sentencedinmate population of 7,010 between 1976 and 1987. Themodel postulates that during each of the next 10 years,changes in the inmate population will follow the histor-ical relationship of the preceding seven years. Thismodel implicitly incorporates all factors which affect thesize of the prison population (admissions and discharges).However, it assumes that the future will reflect the pastand thus does not include any independent variables.
Model No. 3: U.S. unemployment.
Formula: Admissions (A) = 11,371 + (1912 x Avu)Discharges (D) = 248 + A'
where Avu = Average unemployment ratefor the current and prioryear
A' = Prior year admissions
The difference between admissions and discharges(A - D) equals the incremental change in theinmate population.
This model, initially developed by the CongressionalResearch Service and modified by the Congressional BudgetOffice 2y, predicts a decrease in the sentenced inmatepopulation of 6,579 between 1976 and 1987. This modelpostulates that changes in U.S. unemployment rates are
36
strongly indicative of changes in prison admissions andsubsequent discharges (one-year lag).3/ The formula,developed by correlating data for the seventeen-year period1960-1976, explains 94 percent of the year to year variationin prisons admissions and 68 percent of the changes inannual discharges. 4_/
While the unemployment model exhibits a strongstatistical relationship between admissions and unemploy-ment, it is only as good as the unemployment projectionson which it is based. However, there is little disagree-ment that unemployment will decline over the next severalyears—the question is how fast and how far. Consequently,use of the unemployment model alone would project a decreasein prison population—the extent depending on the particu-lar unemployment projections which are used.
N O T E S
_!/ The projected increment of 757 inmates per year wasdeveloped by the Bureau of Prisons from a standardlinear regression for the years 1970-1976. Increasesin the federal prison population during this periodmay not be indicative of future trends due to highincreases in unemployment and redefinitions of criminalactivity resulting from enactment of firearms and druglegislation.
J2/ The major modification to the CRS model was to use theaverage unemployment rate for the current and prioryear rather than the unemployment rate for the prioryear only. Other changes to the CRS model include anupdate of the historical input data and recognitionof the new drug legislation.
3̂/ The statistical relationship between discharges andprior year admissions explains more than two-thirds ofthe year to year variation. The correlation might beimproved with additional research.
4/ If the CRS/CBO model had been used for making projec-tions for the 17-year period (1960-1976), cumulativenew admissions would have been estimated at 273,160
37

.ULUllL
compared to actual cumulative admissions of 273,205,Cumulative discharges would have been estimated at269,963 compared to 269,678 actual. The estimatesassume that unemployment would have been accuratelyprojected.
38
APPENDIX C FACILITY REQUIREMENTS UNDER OPTIONS 3AND 4
TABLE C-l. ESTIMATE OF REQUIREMENTS UNDER OPTION 3
Type of Confinement
Half-way House Capacity:
Remaining 180 days afterconventional confinement
Direct commitment:
Offenders serving less than180 days
Selected offenders servingmore than 180 days
Total half-way housepopulation in 1987
Less use of existinghalf-way houses
Net increase
Other:
Completion of conventionalfacilities already started
New conventional facilities
Total increase
Increase Distributed as Follows:
Normal population growth
Close three penitentiaries
EstimatedNumber ofInmatesEach Year
8,254 b/
(3,726)
2,790 b/
936 b/d/
11,980 t_j
N/A
N/A
N/A
N/A
N/A
N/A
N/A
DaysConfined inHalf-wayHouse
180
N/A
90 c/
346 e/
N/A
N/A
N/A
N/A
N/A
N/A
N/A
N/A
AveragePopula-tion a/
4,100
(1,600)
700
900
5,700
-1,400
4, 300
1,940 £/
1,560 h/
7,800
1,000
5,320
Improve conditions at otherfacilities N/A N/A 1,480
39
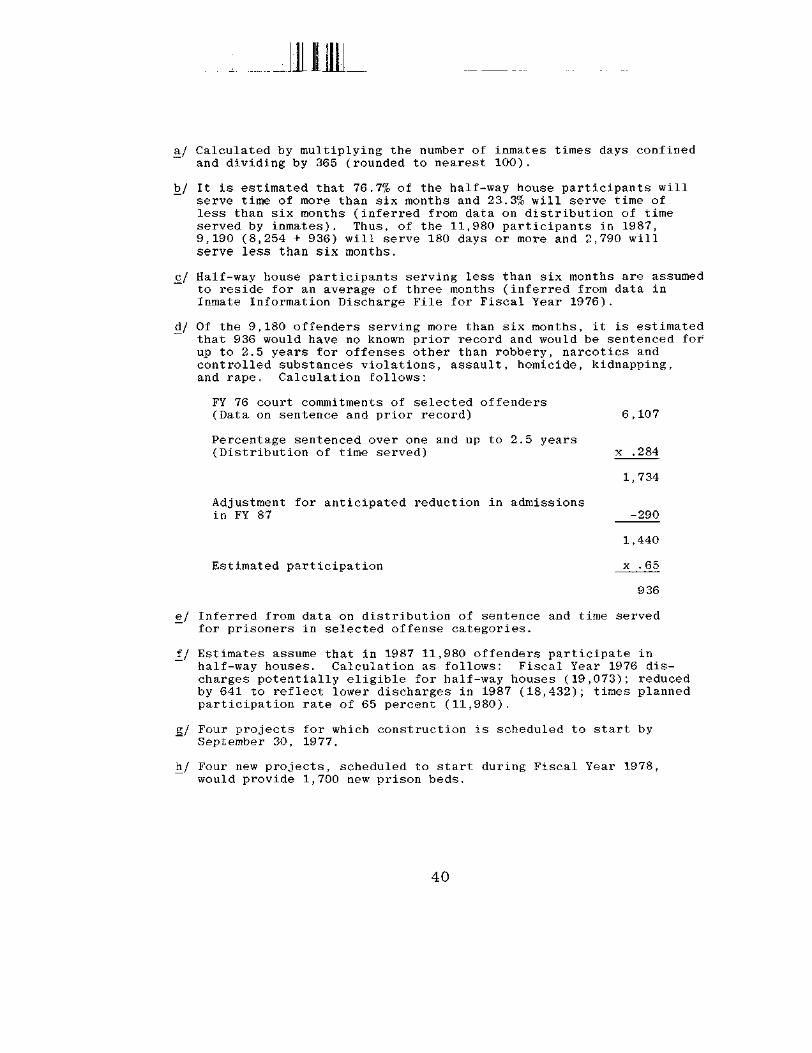
a./ Calculated by multiplying the number of inmates times days confinedand dividing by 365 (rounded to nearest 100).
b/ It is estimated that 76.7% of the half-way house participants willserve time of more than six months and 23.3% will serve time ofless than six months (inferred from data on distribution of timeserved by inmates). Thus, of the 11,980 participants in 1987,9,190 (8,254 + 936) will serve 180 days or more and 2,790 willserve less than six months.
c/ Half-way house participants serving less than six months are assumedto reside for an average of three months (inferred from data inInmate Information Discharge File for Fiscal Year 1976).
d/ Of the 9,180 offenders serving more than six months, it is estimatedthat 936 would have no known prior record and would be sentenced forup to 2.5 years for offenses other than robbery, narcotics andcontrolled substances violations, assault, homicide, kidnapping,and rape. Calculation follows:
FY 76 court commitments of selected offenders(Data on sentence and prior record) 6,107
Percentage sentenced over one and up to 2.5 years(Distribution of time served) x .284
1,734
Adjustment for anticipated reduction in admissionsin FY 87 -290
1,440
Estimated participation x .65
936
e_/ Inferred from data on distribution of sentence and time servedfor prisoners in selected offense categories.
_f/ Estimates assume that in 1987 11,980 offenders participate inhalf-way houses. Calculation as follows: Fiscal Year 1976 dis-charges potentially eligible for half-way houses (19,073); reducedby 641 to reflect lower discharges in 1987 (18,432); times plannedparticipation rate of 65 percent (11,980).
g_/ Four projects for which construction is scheduled to start bySeptember 30, 1977.
h/ Four new projects, scheduled to start during Fiscal Year 1978,would provide 1,700 new prison beds.
40
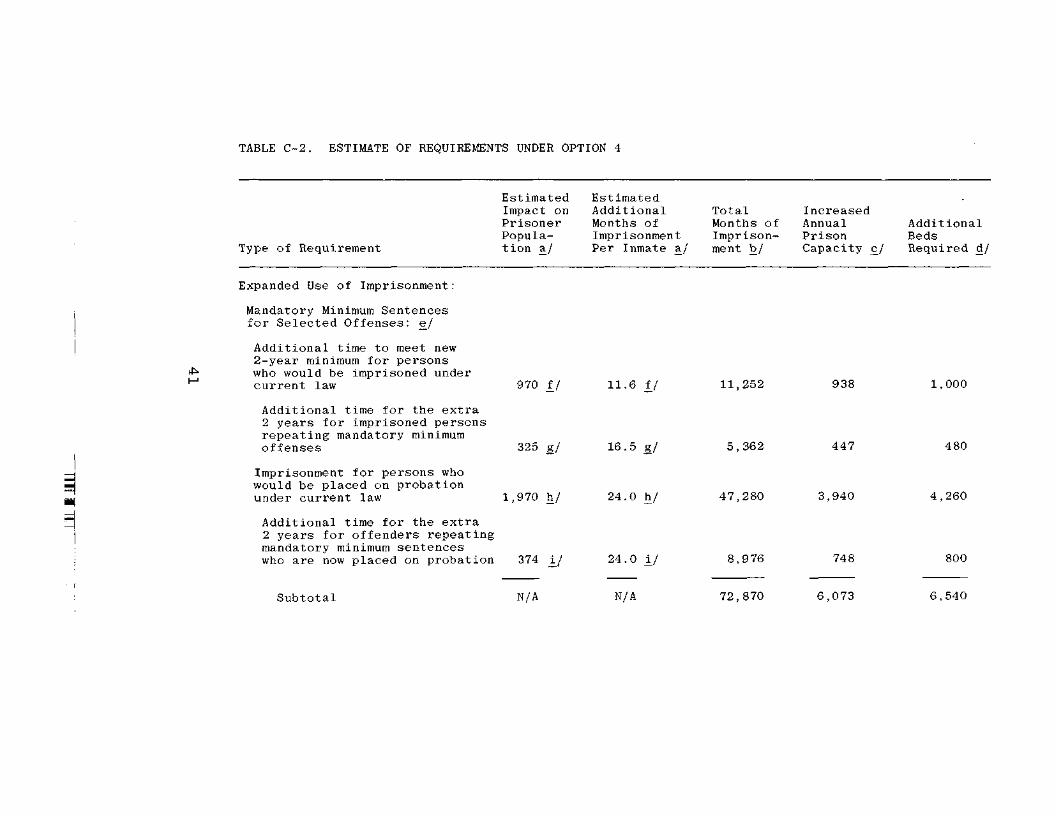
TABLE C-2. ESTIMATE OF REQUIREMENTS UNDER OPTION 4
Type of Requirement
EstimatedImpact onPrisonerPopula-tion a/
EstimatedAdditionalMonths ofImprisonmentPer Inmate a/
TotalMonths ofImprison-ment b/
IncreasedAnnualPrisonCapacity c/
AdditionalBedsRequired d/
Expanded Use of Imprisonment:
Mandatory Minimum Sentencesfor Selected Offenses: e_/
Additional time to meet new2-year minimum for personswho would be imprisoned undercurrent law
Additional time for the extra2 years for imprisoned personsrepeating mandatory minimumoffenses
Imprisonment for persons whowould be placed on probationunder current law
Additional time for the extra2 years for offenders repeatingmandatory minimum sentenceswho are now placed on probation
970 f/
325 g/
1,970 h/
374
11.6 f /
16.5 g/
24.0 h/
24.0 i/
11,252
5,362
47,280
8,976
938
447
3,940
748
1,000
480
4,260
800
Subtotal N / A N/A 72,870 6,073 6,540
to
TABLE C-2, Continued
Imprisonment for PersonsCommitting Other thanMandatory Minimum OffensesWho Are Placed onProbation under Current Law:
Offenders with no priorimprisonment or probation 7,925 j./ 6.0 j_/ 47,550 3,962record
Offenders with priorimprisonment or probation nnr,record 7,615 k/ 13.2 k/ 100,518 8,376
Subtotal N/A N/A 220,938 18,411
Adjustments for Lower Admis-sions in Fiscal Year 1987:
Anticipated decrease inregular admissions N/A N/A N/A -3,075
Further decrease due toisolation of offenders whowould otherwise be released -1,540 m/ -15.2 n/ -23,575 -l.abb
4,290
9,060
19,890
-3,340
-2,135
Total increase for ex- 1.panded use of imprisonment N/A N/A N/A 13,370 14,
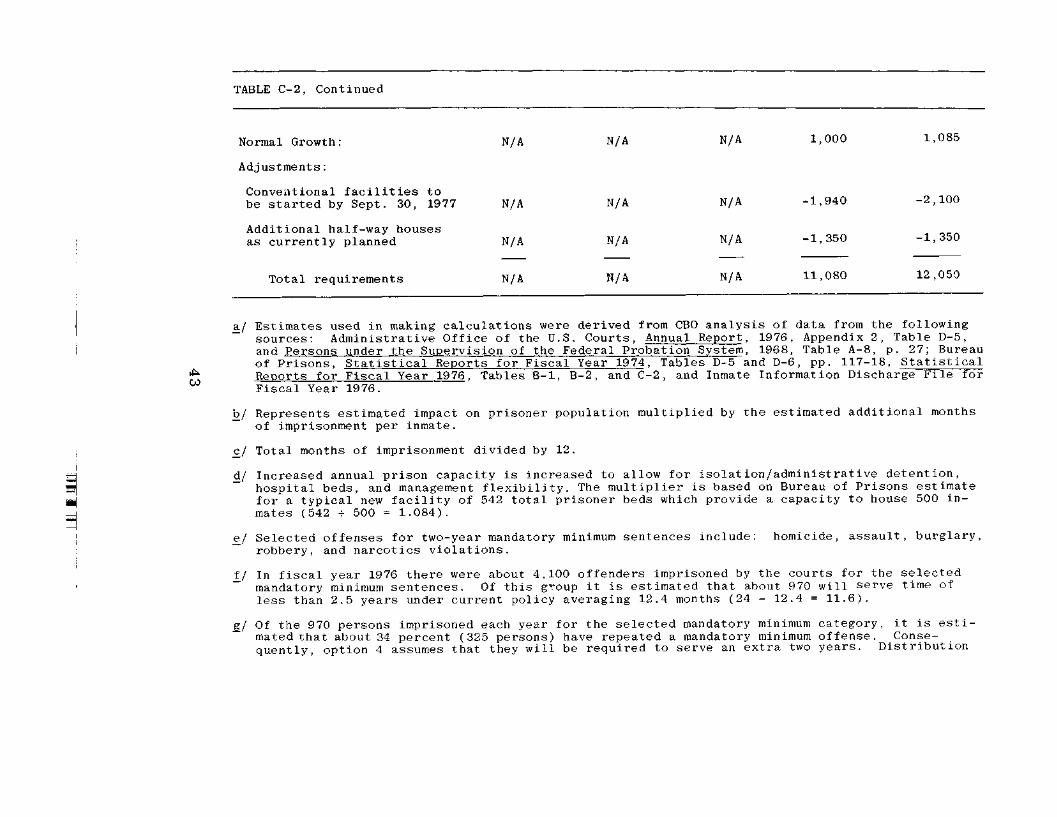
TABLE C-2, Continued
CO
Normal Growth:
Adjustments:
Conventional facilities to
N/A N/A N/A 1,000 1,085
be started by Sept. 30, 1977
Additional half-way housesas currently planned
Total requirements
N/A
N/A
N/A
N/A
N/A
N/A
N/A
N/A
N/A
-1,940
-1,350
11,080
-2,100
-1,350
12,059
a/ Estimates used in making calculations were derived from CBO analysis of data from the followingsources: Administrative Office of the U.S. Courts, Annual Report, 1976, Appendix 2, Table D-5,and Persons under the Supervision of the Federal Probation System, 1968, Table A-8, p. 27; Bureauof Prisons, Statistical Reports for Fiscal Year 1974, Tables D-5 and D-6, pp. 117-18, StatisticalReports for Fiscal Year 1976, Tables B-l, B-2, and C-2, and Inmate Information Discharge File forFiscal Year 1976.
b_/ Represents estimated impact on prisoner population multiplied by the estimated additional monthsof imprisonment per inmate.
c_/ Total months of imprisonment divided by 12.
d/ Increased annual prison capacity is increased to allow for isolation/administrative detention,~~ hospital beds, and management flexibility. The multiplier is based on Bureau of Prisons estimate
for a typical new facility of 542 total prisoner beds which provide a capacity to house 500 in-mates (542 4- 500 = 1.084).
e_/ Selected offenses for two-year mandatory minimum sentences include:robbery, and narcotics violations.
homicide, assault, burglary,
_f/ In fiscal year 1976 there were about 4,100 offenders imprisoned by the courts for the selected~ mandatory minimum sentences. Of this g-oup it is estimated that about 970 will serve time of
less than 2.5 years under current policy averaging 12.4 months (24 - 12.4 = 11.6).
g/ Of the 970 persons imprisoned each year for the selected mandatory minimum category, it is esti-mated that about 34 percent (325 persons) have repeated a mandatory minimum offense. Conse-quently, option 4 assumes that they will be required to serve an extra two years. Distribution
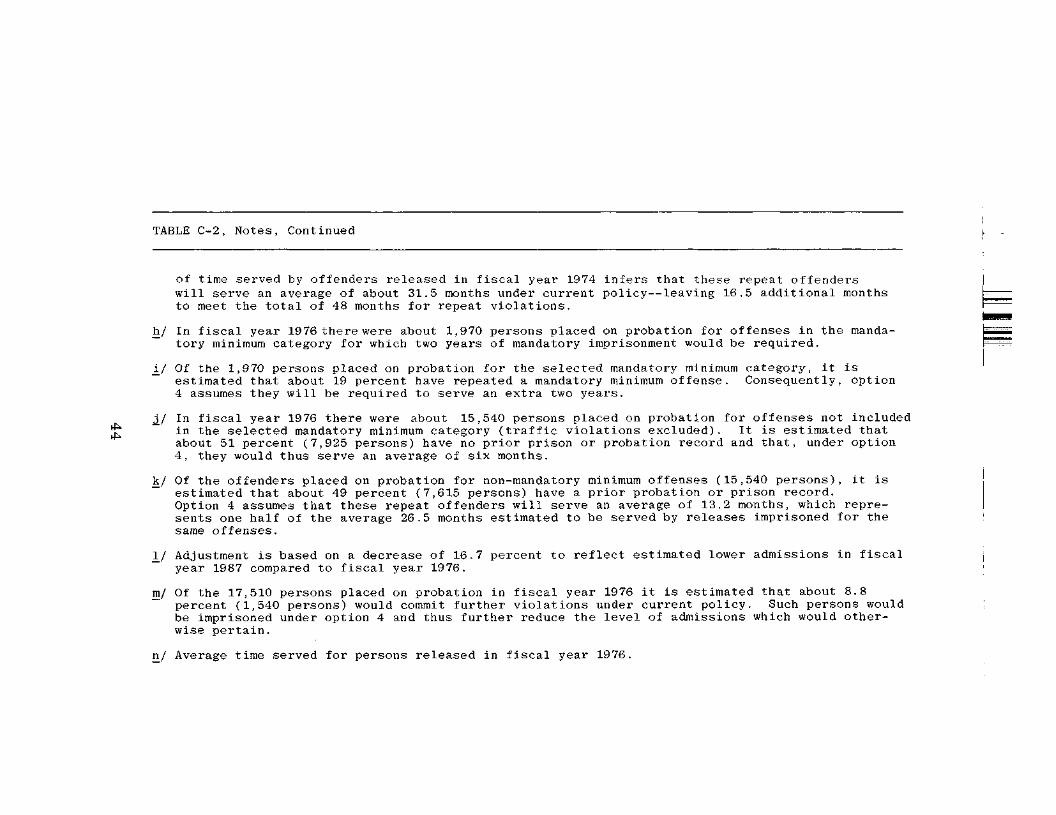
TABLE C-2, Notes, Continued
of time served by offenders released in fiscal year 1974 infers that these repeat offenderswill serve an average of about 31.5 months under current policy—leaving 16.5 additional monthsto meet the total of 48 months for repeat violations.
h_/ In fiscal year 1976 there were about 1,970 persons placed on probation for offenses in the manda-tory minimum category for which two years of mandatory imprisonment would be required.
_!/ Of the 1,970 persons placed on probation for the selected mandatory minimum category, it isestimated that about 19 percent have repeated a mandatory minimum offense. Consequently, option4 assumes they will be required to serve an extra two years.
j_/ In fiscal year 1976 there were about 15,540 persons placed on probation for offenses not includedin the selected mandatory minimum category (traffic violations excluded). It is estimated thatabout 51 percent (7,925 persons) have no prior prison or probation record and that, under option4, they would thus serve an average of six months.
k/ Of the offenders placed on probation for non-mandatory minimum offenses (15,540 persons), it is~ estimated that about 49 percent (7,615 persons) have a prior probation or prison record.
Option 4 assumes that these repeat offenders will serve an average of 13.2 months, which repre-sents one half of the average 26.5 months estimated to be served by releases imprisoned for thesame offenses.
_!/ Adjustment is based on a decrease of 16.7 percent to reflect estimated lower admissions in fiscalyear 1987 compared to fiscal year 1976.
m/ Of the 17,510 persons placed on probation in fiscal year 1976 it is estimated that about 8.8percent (1,540 persons) would commit further violations under current policy. Such persons wouldbe imprisoned under option 4 and thus further reduce the level of admissions which would other-wise pertain.
ri/ Average time served for persons released in fiscal year 1976.
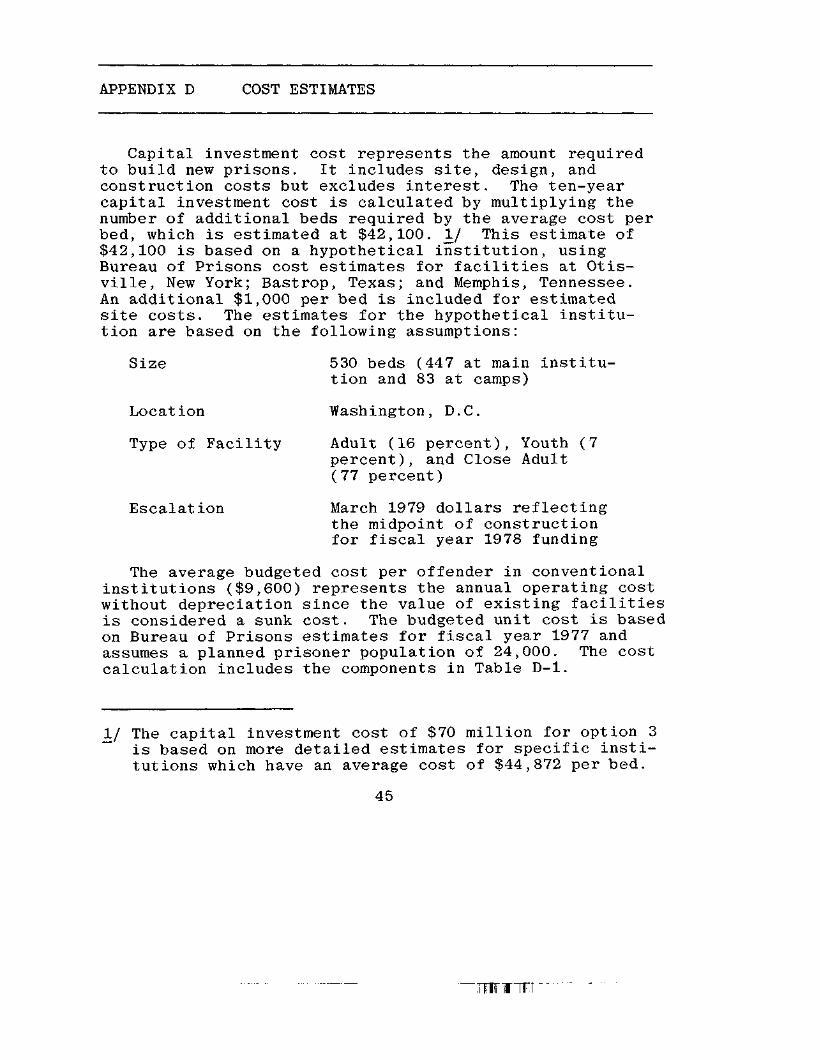
APPENDIX D COST ESTIMATES
Ca.pital investment cost represents the amount requiredto build new prisons. It includes site, design, andconstruction costs but excludes interest. The ten-yearcapital investment cost is calculated by multiplying thenumber of additional beds required by the average cost perbed, which is estimated at $42,100. I./ This estimate of$42,100 is based on a hypothetical institution, usingBureau of Prisons cost estimates for facilities at Otis-ville, New York; Bastrop, Texas; and Memphis, Tennessee.An additional $1,000 per bed is included for estimatedsite costs. The estimates for the hypothetical institu-tion are based on the following assumptions:
Size 530 beds (447 at main institu-tion and 83 at camps)
Location Washington, D.C.
Type of Facility Adult (16 percent), Youth (7percent), and Close Adult(77 percent)
Escalation March 1979 dollars reflectingthe midpoint of constructionfor fiscal year 1978 funding
The average budgeted cost per offender in conventionalinstitutions ($9,600) represents the annual operating costwithout depreciation since the value of existing facilitiesis considered a sunk cost. The budgeted unit cost is basedon Bureau of Prisons estimates for fiscal year 1977 andassumes a planned prisoner population of 24,000. The costcalculation includes the components in Table D-l.
_!/ The capital investment cost of $70 million for option 3is based on more detailed estimates for specific insti-tutions which have an average cost of $44,872 per bed.
45
Tnmrr
LJ11L
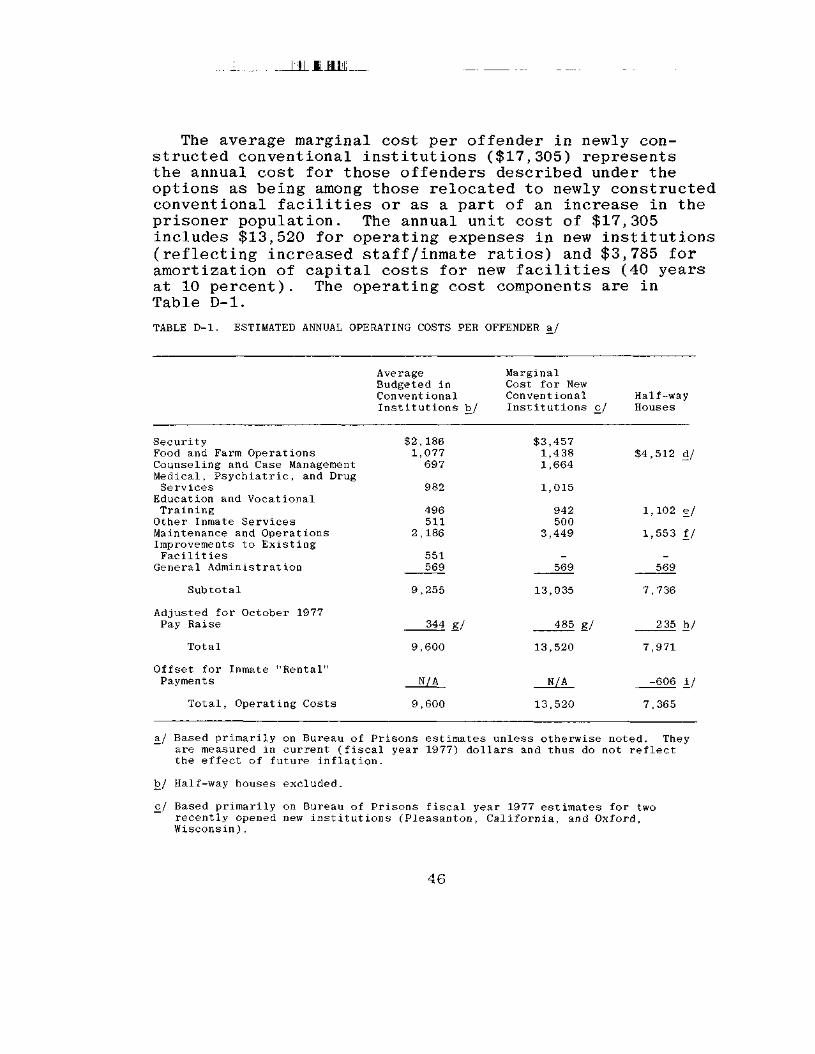
The average marginal cost per offender in newly con-structed conventional institutions ($17,305) representsthe annual cost for those offenders described under theoptions as being among those relocated to newly constructedconventional facilities or as a part of an increase in theprisoner population. The annual unit cost of $17,305includes $13,520 for operating expenses in new institutions(reflecting increased staff/inmate ratios) and $3,785 foramortization of capital costs for new facilities (40 yearsat 10 percent). The operating cost components are inTable D-l.
TABLE D-l. ESTIMATED ANNUAL OPERATING COSTS PER OFFENDER a/
AverageBudgeted inConventionalInstitutions b/
MarginalCost for NewConventionalInstitutions
Half-wayHouses
Security $2,186Food and Farm Operations 1,077Counseling and Case Management 697Medical, Psychiatric, and DrugServices 982
Education and Vocational
$3,4571,4381,664
1,015
$4,512 d/
TrainingOther Inmate ServicesMaintenance and OperationsImprovements to ExistingFacilitiesGeneral Administration
Subtotal
Adjusted for October 1977Pay Raise
Total
Offset for Inmate "Rental"Payments
Total, Operating Costs
496511
2,186
551569
9,255
344 g/
9,600
N/A
9,600
942500
3,449_
569
13,035
485 g/
13,520
N/A
13,520
1,102
1,553
-569
7,736
235
7,971
-606
7,365
e/
I/
h/
i/
a./ Based primarily on Bureau of Prisons estimates unless otherwise noted. Theyare measured in current (fiscal year 1977) dollars and thus do not reflectthe effect of future inflation.
b/ Half-way houses excluded.
c/ Based primarily on Bureau of Prisons fiscal year 1977 estimates for tworecently opened new institutions (Pleasanton, California, and Oxford,Wisconsin).
46
Notes for Table D-l (continued)
d/ Is based on an average daily cost per offender of $16.62 (weighted to reflectuse of both Federal and contract facilities) and assumes that 74.4 percent ofsuch costs are allocated to inmate care.
e_/ Is based on estimated average daily cost of $3.02 per offender for directcommunity services, drug after care, and medical support.
!_/ Is based on an average daily cost per offender of $16.62 (weighted to reflectuse of both Federal and contract facilities) and assumes that 25.6 percent ofsuch costs are allocated to maintenance and operation.
g/ Operating costs increased by 3.72 percent to reflect October 1977 pay adjust-ment: .72 (pay and benefits as percent of total cost) x .0517 (average payincrease cost) = .0372.
h/ Operating costs increased by 3.04 percent to reflect October 1977 pay adjust-ment: .588 (pay and benefits as percent of total cost) x .0517 (average payincrease cost) = .0304.
_!/ The estimated annual off-set assumes that the inmate will continue to con-tribute $2.00 per day for half-way house expenses after he has received hisfirst full paycheck. Most inmates are assumed to make such payments beginningwith the 36th day of confinement until their release.
47
"TTir¥irr
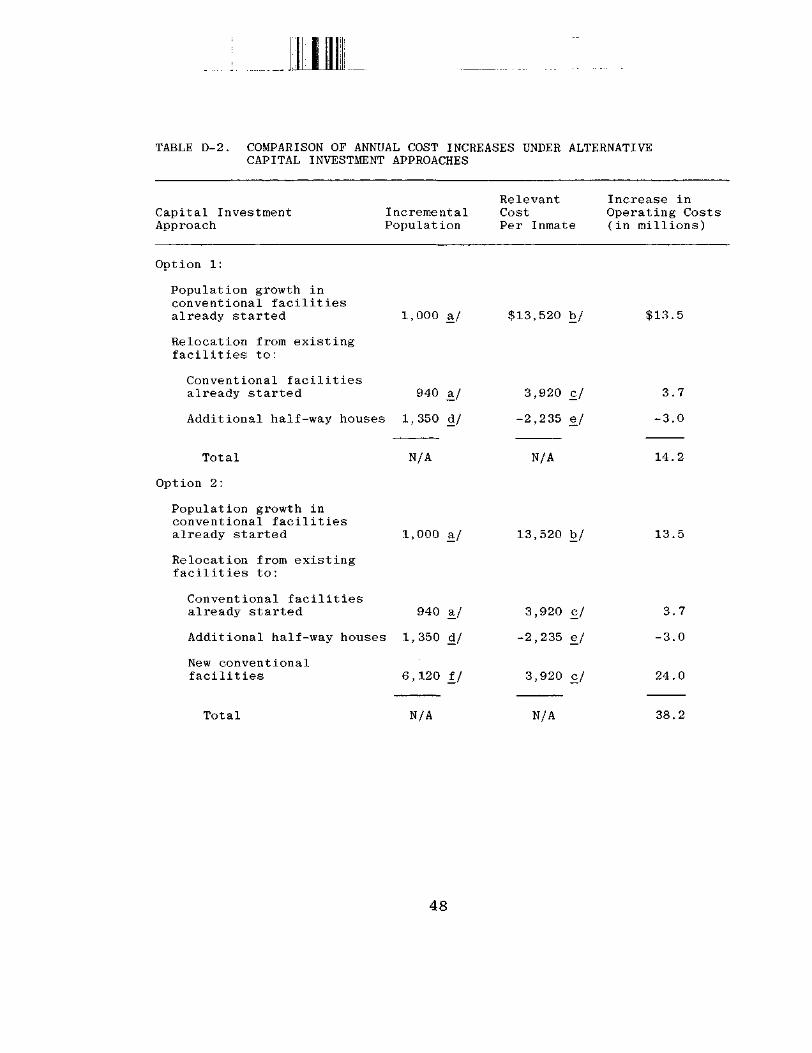
TABLE D-2. COMPARISON OF ANNUAL COST INCREASES UNDER ALTERNATIVECAPITAL INVESTMENT APPROACHES
Capital InvestmentApproach
Relevant Increase inIncremental Cost Operating CostsPopulation Per Inmate (in millions)
Option 1:
Population growth inconventional facilitiesalready started 1,000 a./
Relocation from existingfacilities to:
Conventional facilitiesalready started 940 a,/
Additional half-way houses 1,350 d./
Total N/A
Option 2:
Population growth inconventional facilitiesalready started 1,000 a./
Relocation from existingfacilities to:
Conventional facilitiesalready started 940 a,/
Additional half-way houses 1,350 d/
$13,520 b/
3,920 c/
-2,235 e/
New conventionalfacilities 6,120 f_/
N/A
13,520 b/
3,920 £/
-2,235 e/
3,920 £/
$13.5
3.7
-3.0
14.2
13.5
3.7
-3.0
24.0
Total N/A N/A 38.2
48
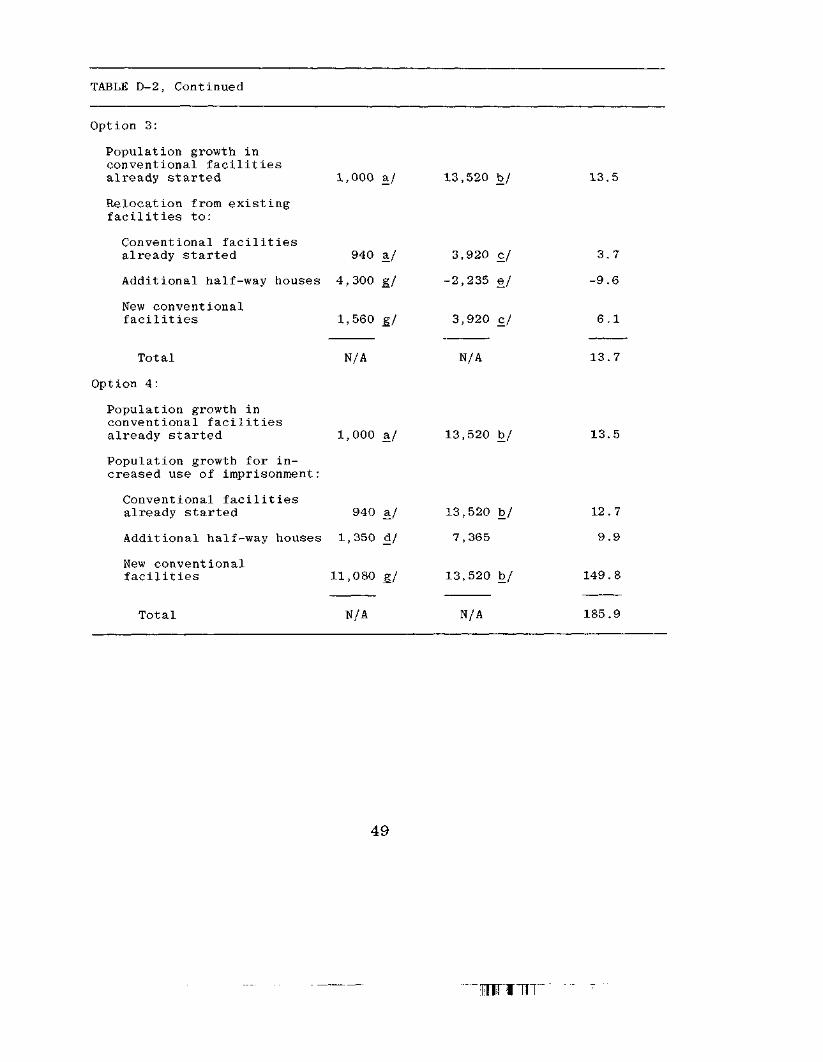
TABLE D-2, Continued
Option 3:
Population growth inconventional facilitiesalready started 1,000 a./ 13,520 b/ 13.5
Relocation from existingfacilities to:
Conventional facilitiesalready started 940 a./ 3,920 c/ 3.7
Additional half-way houses 4,300 g/ -2,235 £/ -9.6
New conventionalfacilities 1,560 g/ 3,920 c/ 6.1
Total N/A N/A 13.7
Option 4:
Population growth inconventional facilitiesalready started 1,000 a/ 13,520 b/ 13.5
Population growth for in-creased use of imprisonment:
Conventional facilitiesalready started 940 a/ 13,520 b/ 12.7
Additional half-way houses 1,350 d/ 7,365 9.9
New conventionalfacilities 11,080 g/ 13,520 b/ 149.8
Total N/A N/A 185.9
49
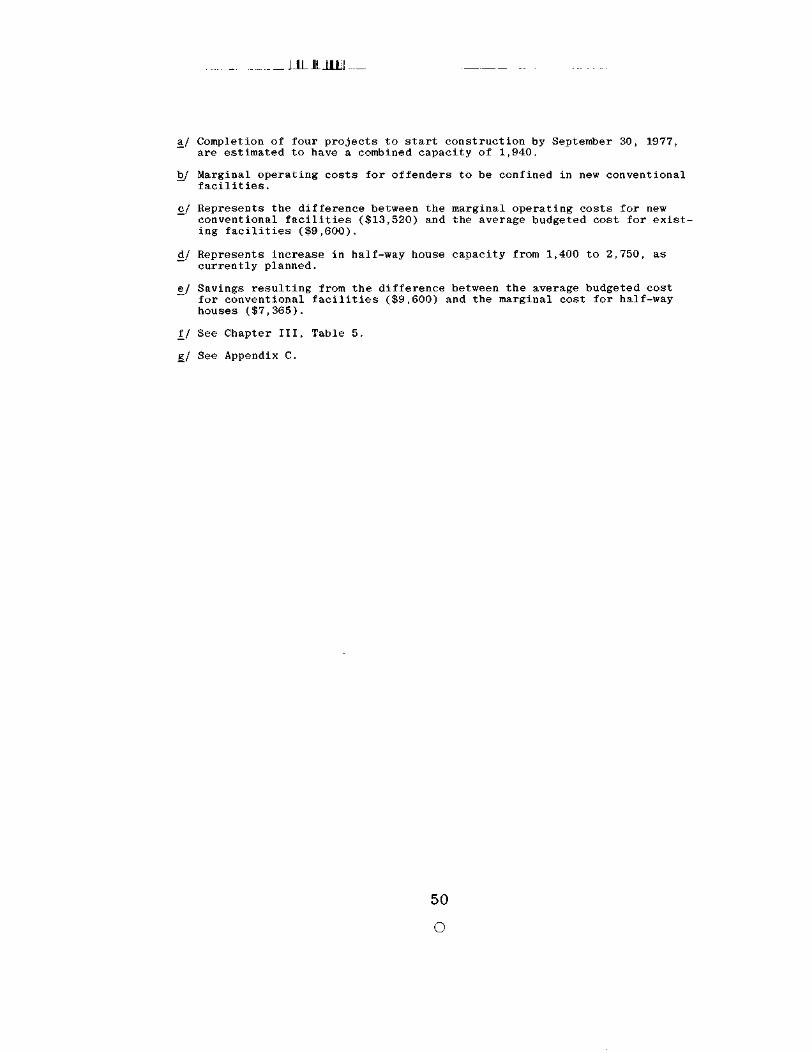
a/ Completion of four projects to start construction by September 30, 1977,are estimated to have a combined capacity of 1,940.
b/ Marginal operating costs for offenders to be confined in new conventionalfacilities.
<:/ Represents the difference between the marginal operating costs for newconventional facilities ($13,520) and the average budgeted cost for exist-ing facilities ($9,600).
d/ Represents increase in half-way house capacity from 1,400 to 2,750, ascurrently planned.
e_/ Savings resulting from the difference between the average budgeted cost~ for conventional facilities ($9,600) and the marginal cost for half-way
houses ($7,365).
f/ See Chapter III, Table 5.
£/ See Appendix C.
50
O