Embed Size (px)
Citation preview
Calhoun County
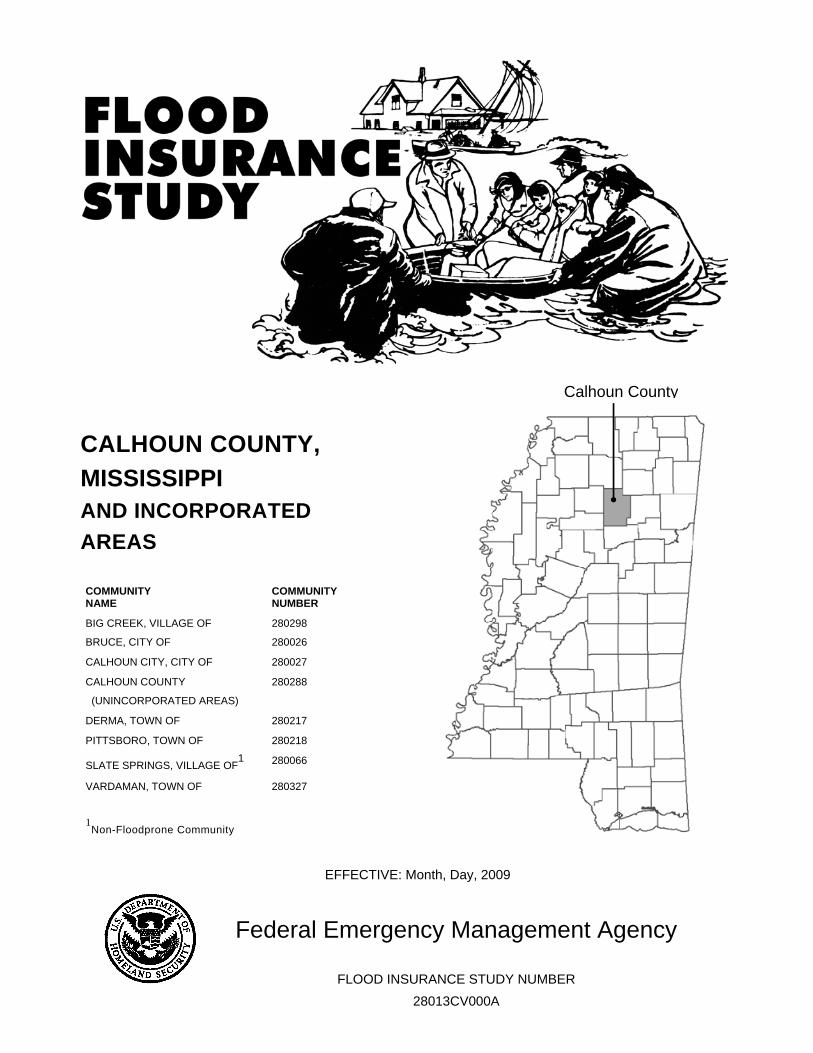
CALHOUN COUNTY, MISSISSIPPI AND INCORPORATED AREAS
COMMUNITY
NAME COMMUNITY NUMBER
BIG CREEK, VILLAGE OF
BRUCE, CITY OF
280298
280026
CALHOUN CITY, CITY OF 280027
CALHOUN COUNTY
(UNINCORPORATED AREAS)
280288
DERMA, TOWN OF 280217
PITTSBORO, TOWN OF 280218
SLATE SPRINGS, VILLAGE OF1
280066
VARDAMAN, TOWN OF 280327
1Non-Floodprone Community
EFFECTIVE: Month, Day, 2009
Federal Emergency Management Agency
FLOOD INSURANCE STUDY NUMBER 28013CV000A
i
NOTICE TO FLOOD INSURANCE STUDY USERS
Communities participating in the National Flood Insurance Program (NFIP) have established repositories of flood hazard data for floodplain management and flood insurance purposes. This Flood Insurance Study (FIS) may not contain all data available within the repository. It is advisable to contact the community repository for any additional data. Part or all of this FIS may be revised and republished at any time. In addition, part of this FIS may be revised by the Letter of Map Revision process, which does not involve republication or redistribution of the FIS. It is, therefore, the responsibility of the user to consult with community officials and to check the community repository to obtain the most current FIS components. Initial Countywide FIS Effective: January 3, 1990 First Revised Countywide FIS Revision:

TABLE OF CONTENTS
Page
1.0 INTRODUCTION ........................................................................................................................... 1
1.1 Purpose of Study ............................................................................................................... 1
1.2 Authority and Acknowledgments ...................................................................................... 1
1.3 Coordination ...................................................................................................................... 2
2.0 AREA STUDIED ............................................................................................................................ 2
2.1 Limits of New Detailed and Enhanced Approximte Studies............................................. 2
2.2 Community Description .................................................................................................... 3
2.3 Principal Flood Problems .................................................................................................. 3
2.4 Flood Protection Measures ................................................................................................ 4
3.0 ENGINEERING METHODS .......................................................................................................... 4
3.1 Hydrologic Analyses ......................................................................................................... 5
3.2 Hydraulic Analyses ........................................................................................................... 7
3.3 Vertical Datum .................................................................................................................. 9
4.0 FLOODPLAIN MANAGEMENT APPLICATIONS ..................................................................... 9
4.1 Floodplain Boundaries .................................................................................................... 10
4.2 Floodways ....................................................................................................................... 10
5.0 INSURANCE APPLICATION ..................................................................................................... 12
6.0 FLOOD INSURANCE RATE MAP ............................................................................................. 12
7.0 OTHER STUDIES ......................................................................................................................... 14
8.0 LOCATION OF DATA ................................................................................................................. 14
9.0 BIBLIOGRAPHY AND REFERENCES ...................................................................................... 14
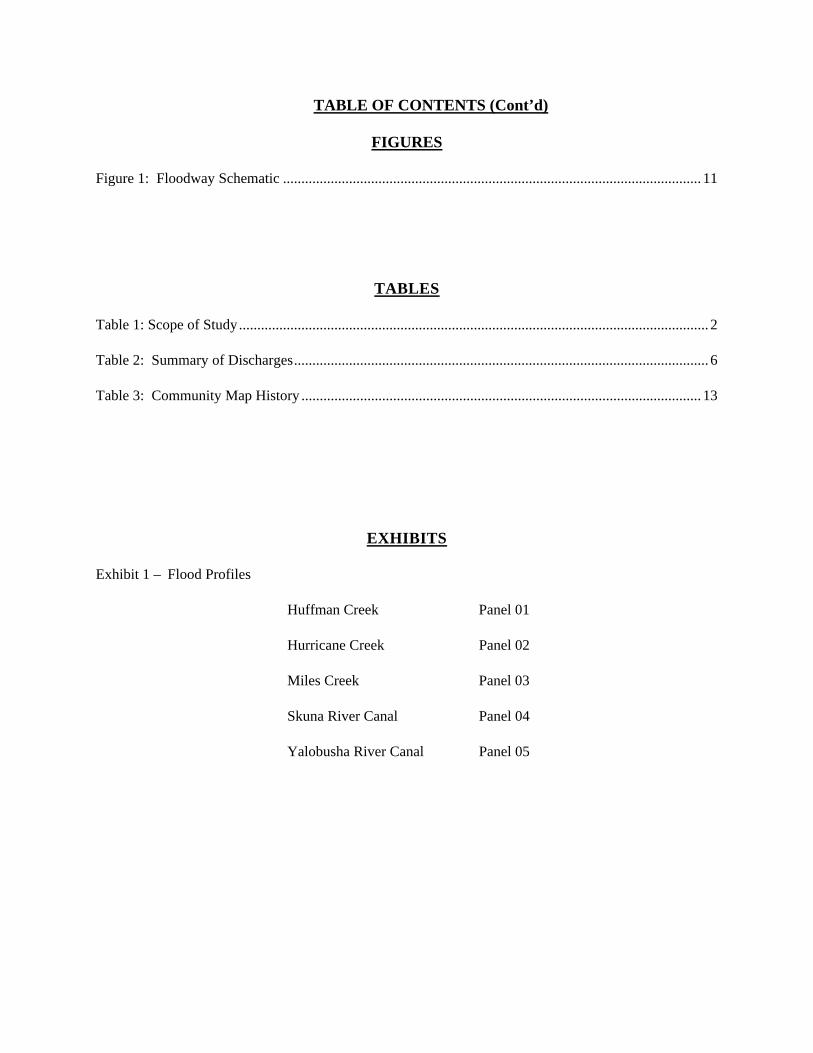
TABLE OF CONTENTS (Cont’d)
FIGURES
Figure 1: Floodway Schematic .................................................................................................................. 11
TABLES
Table 1: Scope of Study ................................................................................................................................ 2
Table 2: Summary of Discharges ................................................................................................................. 6
Table 3: Community Map History ............................................................................................................. 13
Table 4: Summary of Roughness Coefficients .......................................... Error! Bookmark not defined.
Table 5: Floodway Data Table ................................................................... Error! Bookmark not defined.
Table 6: Community Map History ............................................................. Error! Bookmark not defined.
EXHIBITS
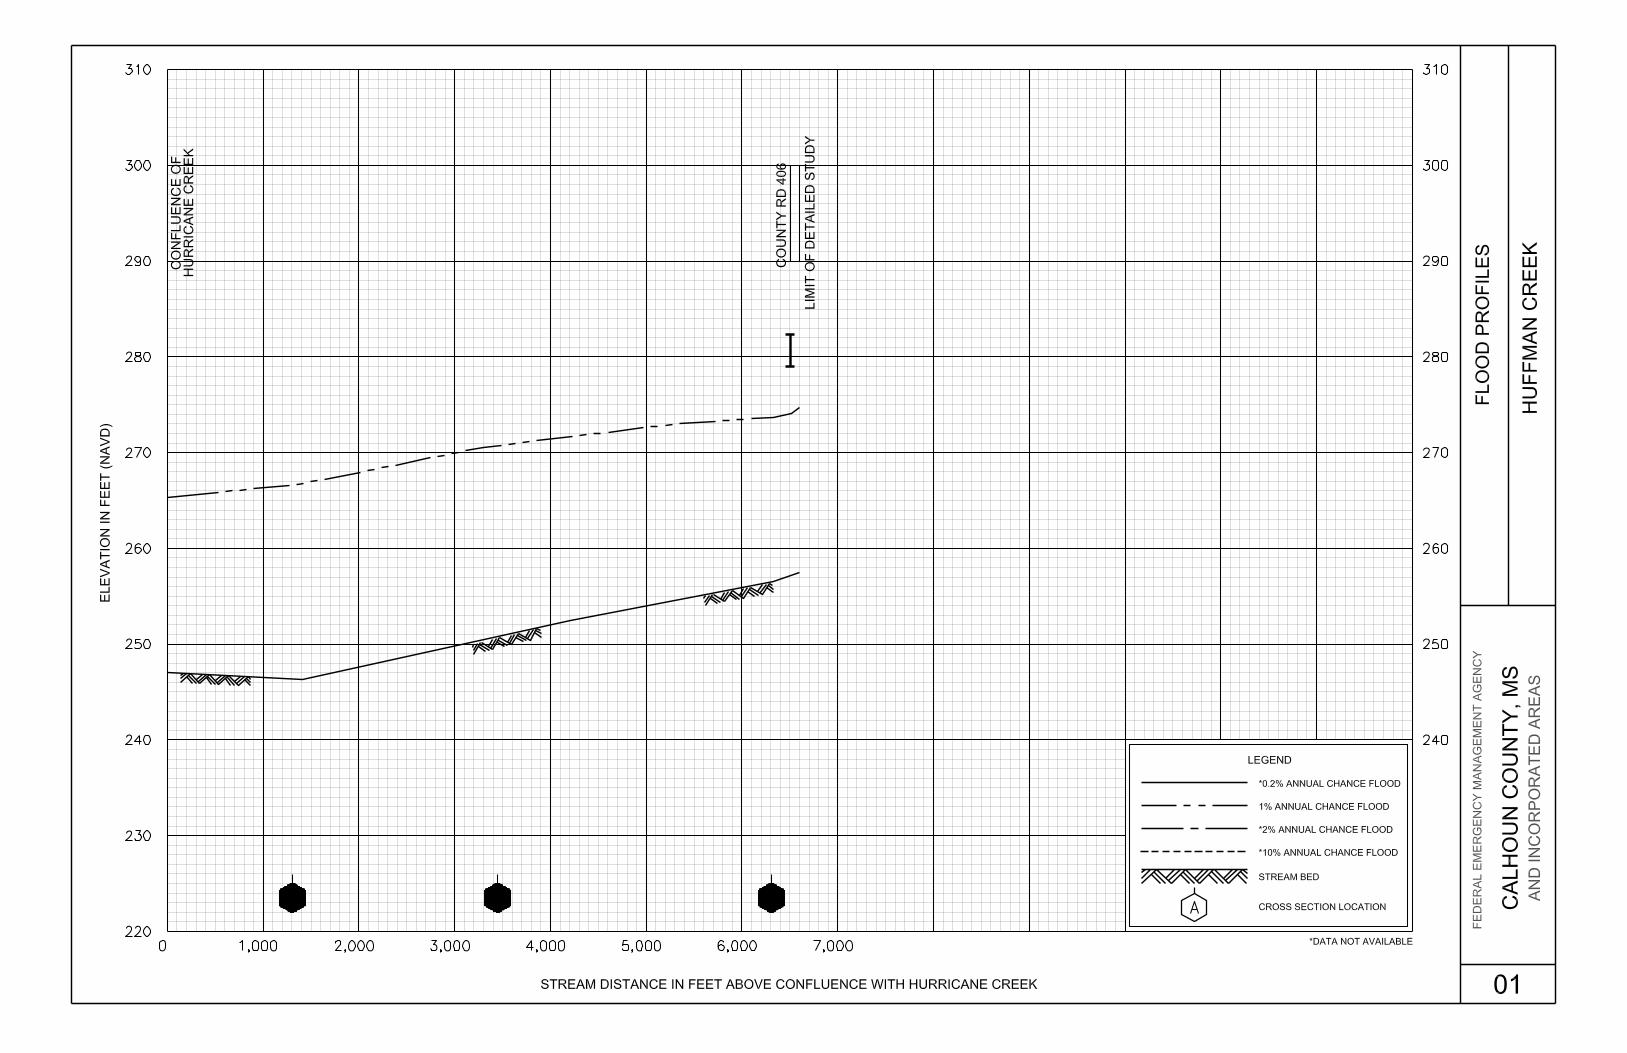
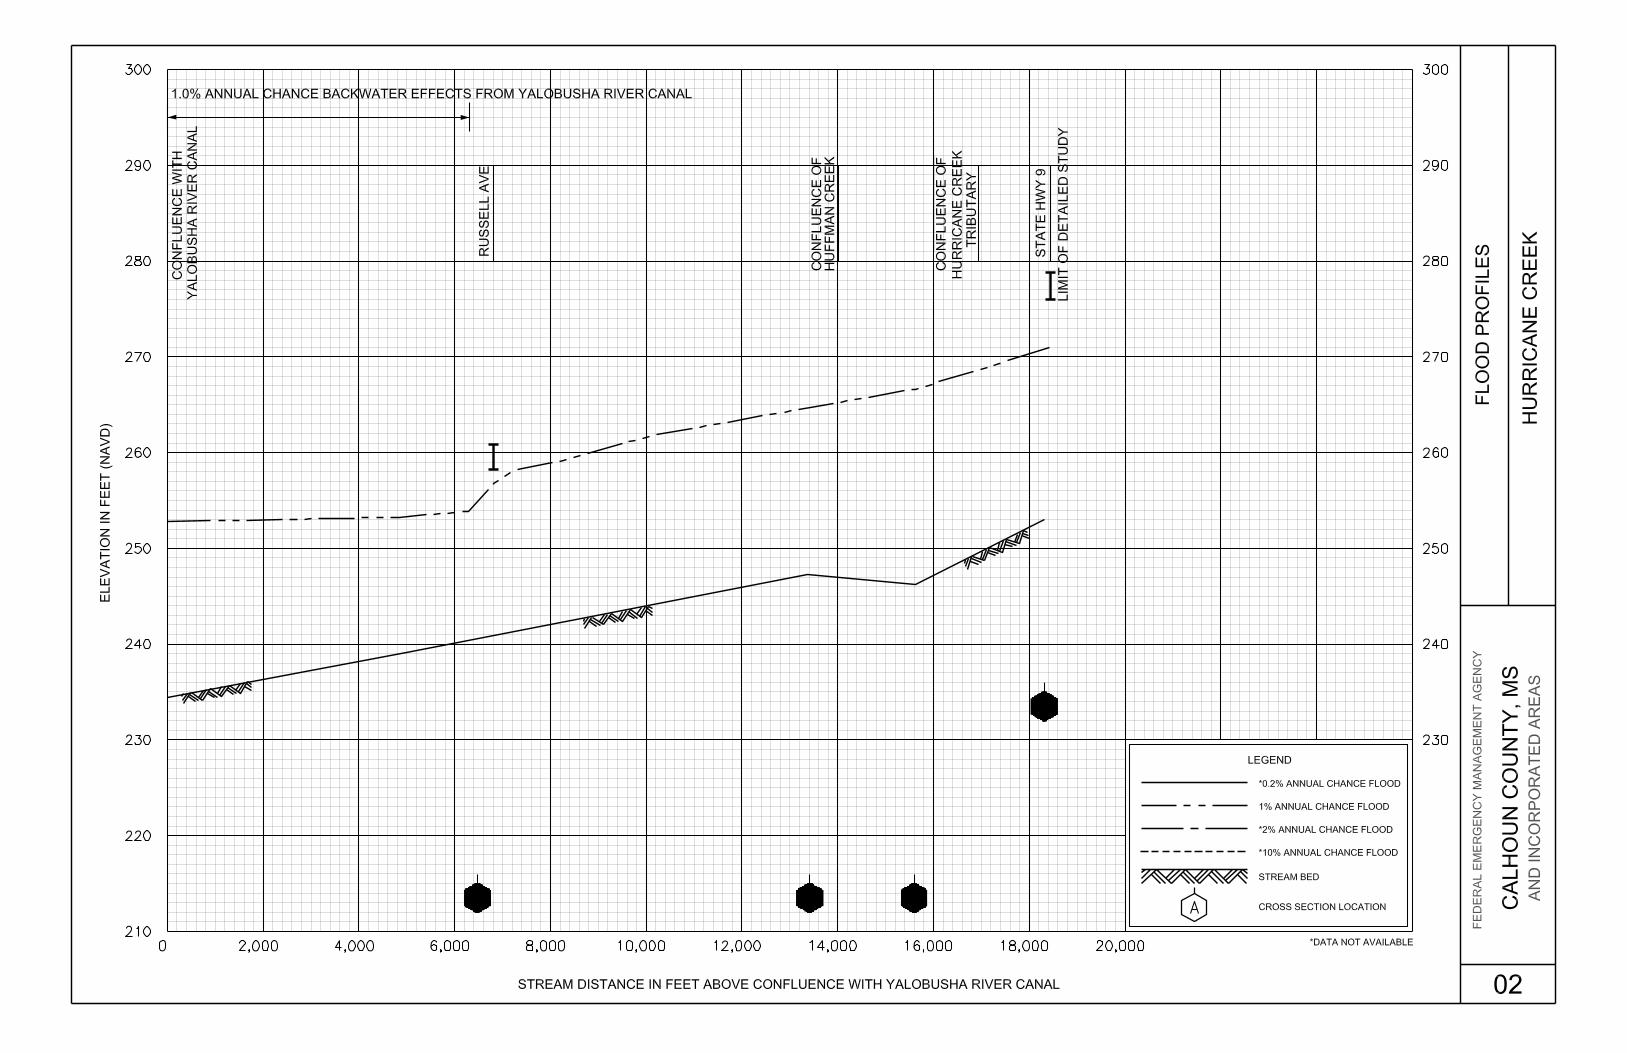
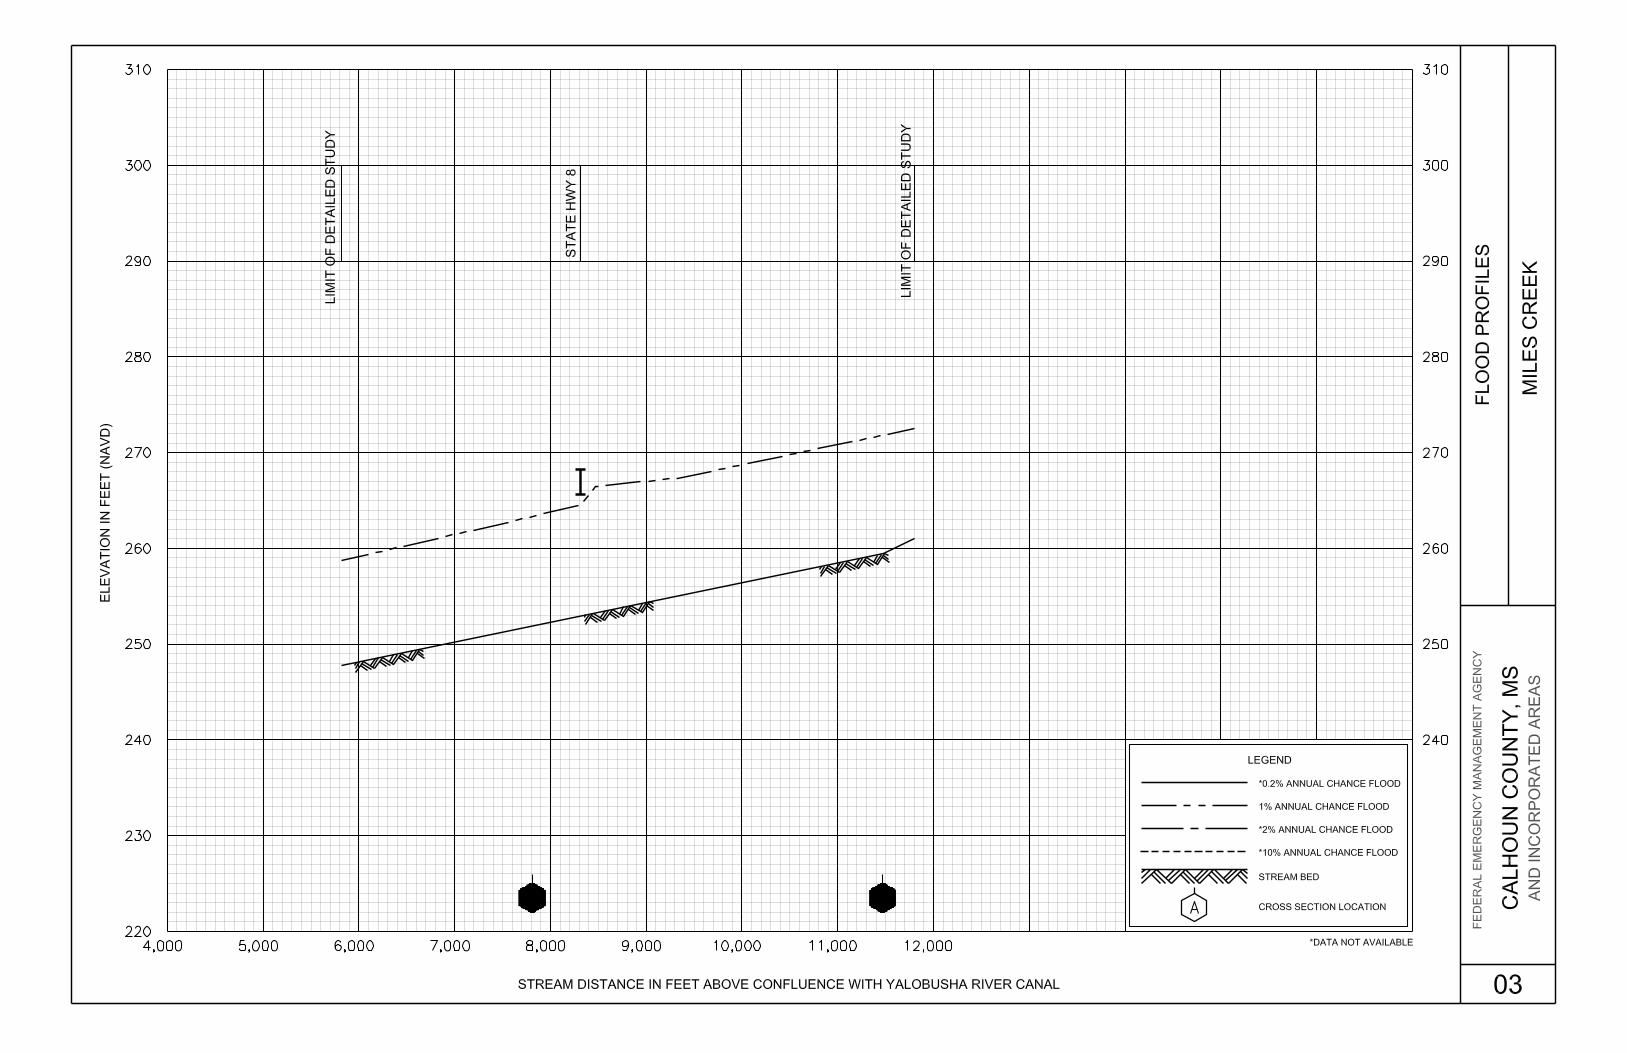
Exhibit 1 – Flood Profiles
Huffman Creek Panel 01
Hurricane Creek Panel 02
Miles Creek Panel 03
Skuna River Canal Panel 04
Yalobusha River Canal Panel 05

1
FLOOD INSURANCE STUDY CALHOUN COUNTY, MISSISSIPPI AND INCORPORATED AREAS
1.0 INTRODUCTION 1.1 Purpose of Study
This Flood Insurance Study revises and updates information on the existence and severity of flood hazards in the geographic area of Calhoun County, Mississippi, including the Cities of Bruce and Calhoun City; the Towns of Derma, Pittsboro and Vardaman; and the Villages of Big Creek, and Slate Springs; and the unincorporated areas of Calhoun County (referred to collectively herein as Calhoun County), and aids in the administration of the National Flood Insurance Act of 1968 and the Flood Disaster Protection Act of 1973. Please note that the Village of Slate Springs is non-floodprone. This study has developed flood-risk data for various areas of the community that will be used to establish actuarial flood insurance rates and to assist the community in its efforts to promote sound floodplain management. Minimum floodplain management requirements for participation in the National Flood Insurance Program (NFIP) are set forth in the Code of Federal Regulations at 44 CFR, 60.3. Please note the Village of Slate Springs has no mapped special flood hazard areas.
In some states or communities, floodplain management criteria or regulations may exist that are more restrictive or comprehensive than the minimum Federal requirements. In such cases, the more restrictive criteria take precedence and the State (or other jurisdictional agency) will be able to explain them.
1.2 Authority and Acknowledgments
The sources of authority for this Flood Insurance Study are the National Flood Insurance Act of 1968 and the Flood Disaster Protection Act of 1973. This FIS was prepared to include the unincorporated areas of, and incorporated communities within, Calhoun County in a countywide format. The hydrologic and hydraulic analyses for the January 3, 1990 study was performed by the U.S. Geological Survey (USGS)(the Study Contractor) for the Federal Emergency Management Agency (FEMA), under Interagency Agreement No. EMW-85-E-1823, Project Order No. 13. The study was completed in November 1987. For this countywide FIS, new hydrologic and hydraulic analyses were prepared by AECOM Water and the state of Mississippi for the Federal Emergency Management Agency (FEMA), under Contract No. EMA-2006-CA-5617. This study was completed in ---- 2009. Base map information shown on the FIRM was provided in digital format by the State of Mississippi and the U.S. Census Bureau. The digital orthoimagery was photogrammetrically compiled at a scale of 1:400 from aerial photography dated March 2006.

2
The digital FIRM was produced using the Mississippi State Plane Coordinate System, East Zone, FIPSZONE 2301. The horizontal datum was the North American Datum of 1983, GRS80 spheroid. Distance units were measured in U.S. feet.
1.3 Coordination
On February 14, 1989, the results of the January 3, 1990 Flood Insurance Study were reviewed and accepted at a final coordination meeting attended by representatives of the study contractor, FEMA, and the community. For this countywide FIS, an initial CCO meeting was held with the representatives from FEMA, the impacted communities, and the study contractor to explain the nature and purpose of a FIS, and to identify the streams to be studied by detailed methods on April 16, 2008. A final meeting, the Preliminary DFIRM Community Coordination (PDCC) was held on ________________ to review the results of this study. For this countywide FIS, the Project Scoping Meeting was held on April 16, 2008 in Calhoun County, MS. Attendees for these included representatives from the Mississippi Department of Environmental Quality, Mississippi Emergency Management Agency, FEM National Service Provider, Calhoun County, and Study Contractors. Coordination with county officials and Federal, State, and regional agencies produced a variety of information pertaining to floodplain regulations, available community maps, flood history, and other hydrologic data.
2.0 AREA STUDIED
2.1 Scope of Study
This Flood Insurance Study covers the geographic area of Calhoun County, Mississippi, including the incorporated communities listed in Section 1.1. No new detail studies have been performed for this countywide study. Studies of flooding caused by overflow of the Skuna River Canal, Yalobusha River Canal+, Hurricane Creek, Huffman Creek and Miles Creek were redelineated. An enhanced approximate study was performed along Cane Creek, Yalobusha River Tributary, Yalobusha River Tributary 2, Yalobusha River Tributary 2A and Yoda Creek Tributary. For this countywide study, enhanced approximate study streams are shown in Table 1. “Scope of Study.”
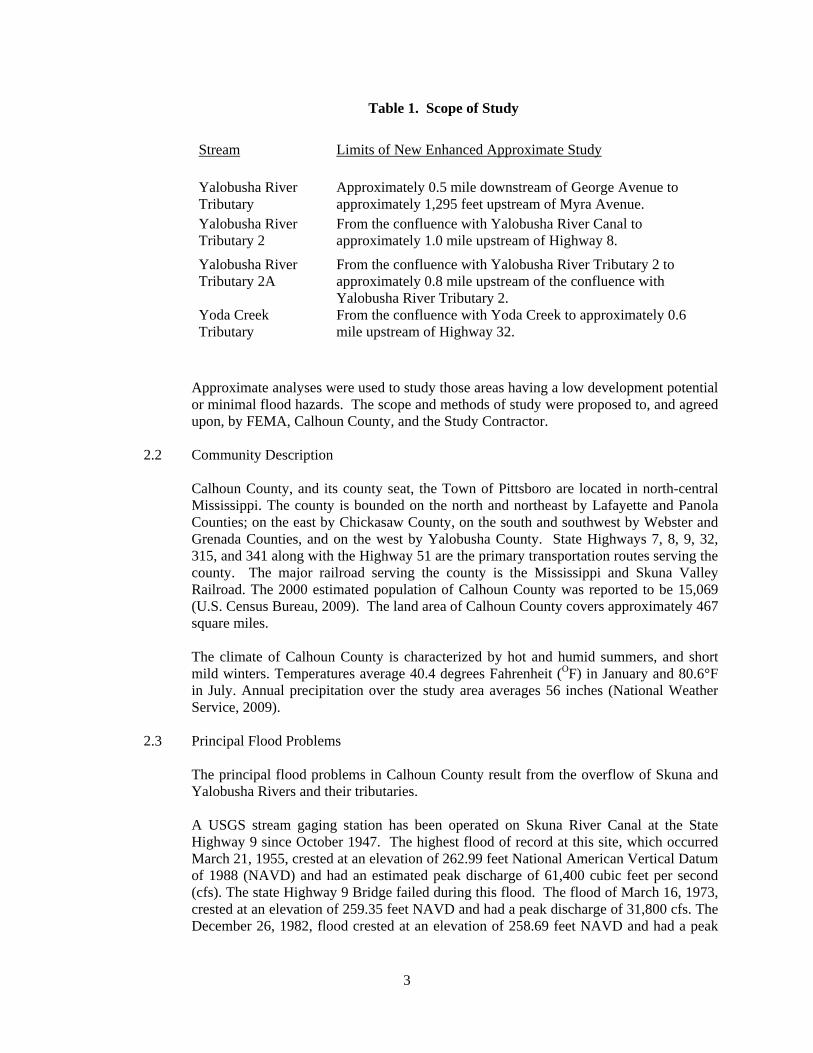
Table 1. Scope of Study
Stream Limits of New Enhanced Approximate Study
Cane Creek From the confluence with Yalobusha River Canal to approximately 925 feet upstream of County Road 428.
3
Table 1. Scope of Study
Stream Limits of New Enhanced Approximate Study
Yalobusha River Tributary
Approximately 0.5 mile downstream of George Avenue to approximately 1,295 feet upstream of Myra Avenue.
Yalobusha River Tributary 2
From the confluence with Yalobusha River Canal to approximately 1.0 mile upstream of Highway 8.
Yalobusha River Tributary 2A
From the confluence with Yalobusha River Tributary 2 to approximately 0.8 mile upstream of the confluence with Yalobusha River Tributary 2.
Yoda Creek Tributary
From the confluence with Yoda Creek to approximately 0.6 mile upstream of Highway 32.
Approximate analyses were used to study those areas having a low development potential or minimal flood hazards. The scope and methods of study were proposed to, and agreed upon, by FEMA, Calhoun County, and the Study Contractor.
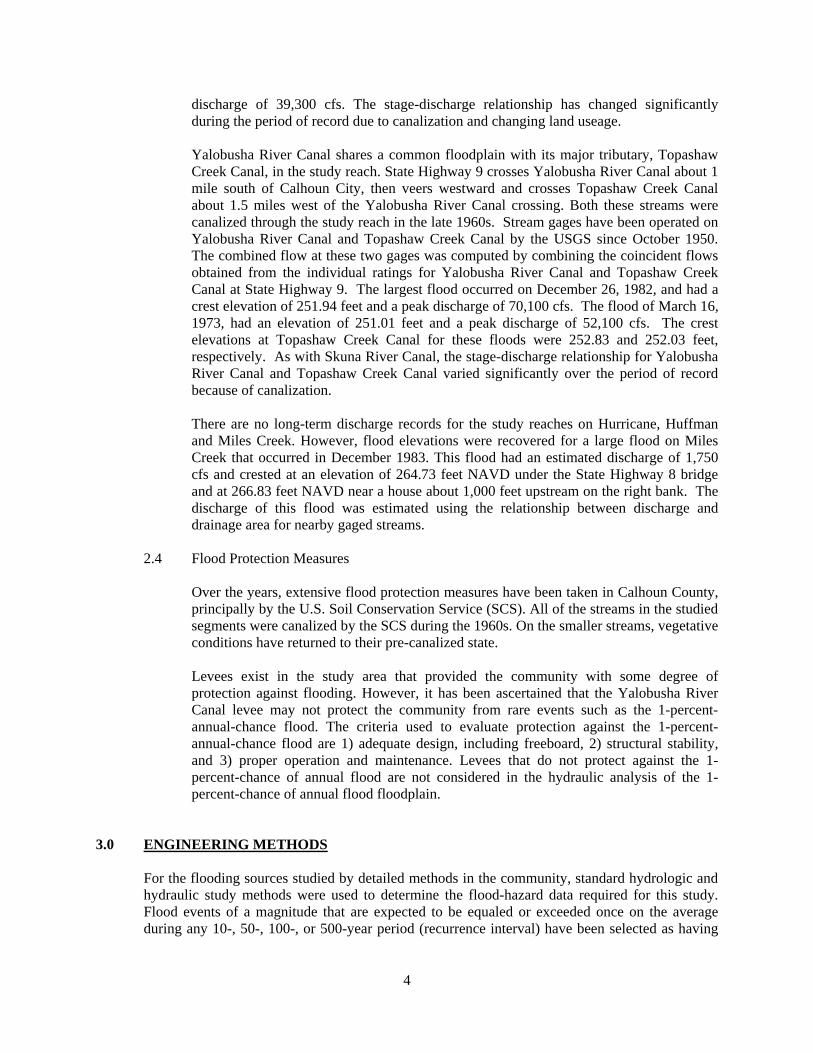
2.2 Community Description Calhoun County, and its county seat, the Town of Pittsboro are located in north-central
Mississippi. The county is bounded on the north and northeast by Lafayette and Panola Counties; on the east by Chickasaw County, on the south and southwest by Webster and Grenada Counties, and on the west by Yalobusha County. State Highways 7, 8, 9, 32, 315, and 341 along with the Highway 51 are the primary transportation routes serving the county. The major railroad serving the county is the Mississippi and Skuna Valley Railroad. The 2000 estimated population of Calhoun County was reported to be 15,069 (U.S. Census Bureau, 2009). The land area of Calhoun County covers approximately 467 square miles. The climate of Calhoun County is characterized by hot and humid summers, and short mild winters. Temperatures average 40.4 degrees Fahrenheit (OF) in January and 80.6°F in July. Annual precipitation over the study area averages 56 inches (National Weather Service, 2009).
2.3 Principal Flood Problems
The principal flood problems in Calhoun County result from the overflow of Skuna and Yalobusha Rivers and their tributaries. A USGS stream gaging station has been operated on Skuna River Canal at the State Highway 9 since October 1947. The highest flood of record at this site, which occurred March 21, 1955, crested at an elevation of 262.99 feet National American Vertical Datum of 1988 (NAVD) and had an estimated peak discharge of 61,400 cubic feet per second (cfs). The state Highway 9 Bridge failed during this flood. The flood of March 16, 1973, crested at an elevation of 259.35 feet NAVD and had a peak discharge of 31,800 cfs. The December 26, 1982, flood crested at an elevation of 258.69 feet NAVD and had a peak
4
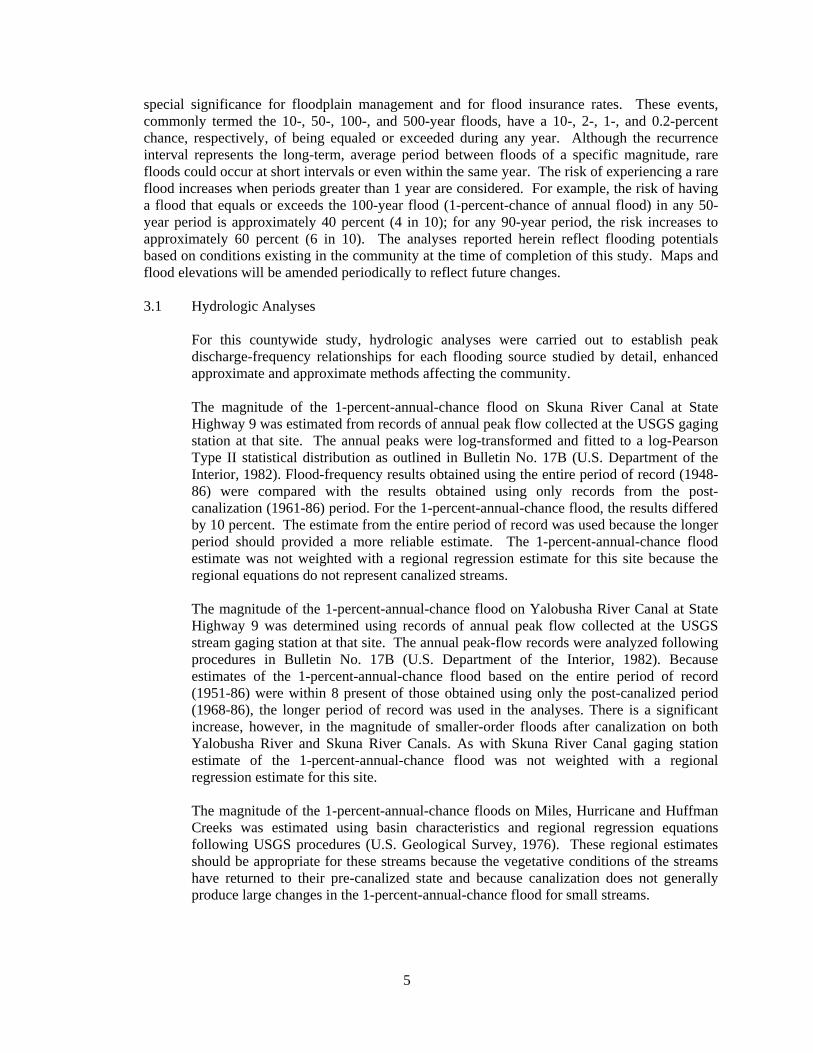
discharge of 39,300 cfs. The stage-discharge relationship has changed significantly during the period of record due to canalization and changing land useage. Yalobusha River Canal shares a common floodplain with its major tributary, Topashaw Creek Canal, in the study reach. State Highway 9 crosses Yalobusha River Canal about 1 mile south of Calhoun City, then veers westward and crosses Topashaw Creek Canal about 1.5 miles west of the Yalobusha River Canal crossing. Both these streams were canalized through the study reach in the late 1960s. Stream gages have been operated on Yalobusha River Canal and Topashaw Creek Canal by the USGS since October 1950. The combined flow at these two gages was computed by combining the coincident flows obtained from the individual ratings for Yalobusha River Canal and Topashaw Creek Canal at State Highway 9. The largest flood occurred on December 26, 1982, and had a crest elevation of 251.94 feet and a peak discharge of 70,100 cfs. The flood of March 16, 1973, had an elevation of 251.01 feet and a peak discharge of 52,100 cfs. The crest elevations at Topashaw Creek Canal for these floods were 252.83 and 252.03 feet, respectively. As with Skuna River Canal, the stage-discharge relationship for Yalobusha River Canal and Topashaw Creek Canal varied significantly over the period of record because of canalization. There are no long-term discharge records for the study reaches on Hurricane, Huffman and Miles Creek. However, flood elevations were recovered for a large flood on Miles Creek that occurred in December 1983. This flood had an estimated discharge of 1,750 cfs and crested at an elevation of 264.73 feet NAVD under the State Highway 8 bridge and at 266.83 feet NAVD near a house about 1,000 feet upstream on the right bank. The discharge of this flood was estimated using the relationship between discharge and drainage area for nearby gaged streams.
2.4 Flood Protection Measures
Over the years, extensive flood protection measures have been taken in Calhoun County, principally by the U.S. Soil Conservation Service (SCS). All of the streams in the studied segments were canalized by the SCS during the 1960s. On the smaller streams, vegetative conditions have returned to their pre-canalized state. Levees exist in the study area that provided the community with some degree of protection against flooding. However, it has been ascertained that the Yalobusha River Canal levee may not protect the community from rare events such as the 1-percent-annual-chance flood. The criteria used to evaluate protection against the 1-percent-annual-chance flood are 1) adequate design, including freeboard, 2) structural stability, and 3) proper operation and maintenance. Levees that do not protect against the 1-percent-chance of annual flood are not considered in the hydraulic analysis of the 1-percent-chance of annual flood floodplain.
3.0 ENGINEERING METHODS
For the flooding sources studied by detailed methods in the community, standard hydrologic and hydraulic study methods were used to determine the flood-hazard data required for this study. Flood events of a magnitude that are expected to be equaled or exceeded once on the average during any 10-, 50-, 100-, or 500-year period (recurrence interval) have been selected as having
5
special significance for floodplain management and for flood insurance rates. These events, commonly termed the 10-, 50-, 100-, and 500-year floods, have a 10-, 2-, 1-, and 0.2-percent chance, respectively, of being equaled or exceeded during any year. Although the recurrence interval represents the long-term, average period between floods of a specific magnitude, rare floods could occur at short intervals or even within the same year. The risk of experiencing a rare flood increases when periods greater than 1 year are considered. For example, the risk of having a flood that equals or exceeds the 100-year flood (1-percent-chance of annual flood) in any 50-year period is approximately 40 percent (4 in 10); for any 90-year period, the risk increases to approximately 60 percent (6 in 10). The analyses reported herein reflect flooding potentials based on conditions existing in the community at the time of completion of this study. Maps and flood elevations will be amended periodically to reflect future changes. 3.1 Hydrologic Analyses
For this countywide study, hydrologic analyses were carried out to establish peak discharge-frequency relationships for each flooding source studied by detail, enhanced approximate and approximate methods affecting the community. The magnitude of the 1-percent-annual-chance flood on Skuna River Canal at State Highway 9 was estimated from records of annual peak flow collected at the USGS gaging station at that site. The annual peaks were log-transformed and fitted to a log-Pearson Type II statistical distribution as outlined in Bulletin No. 17B (U.S. Department of the Interior, 1982). Flood-frequency results obtained using the entire period of record (1948-86) were compared with the results obtained using only records from the post-canalization (1961-86) period. For the 1-percent-annual-chance flood, the results differed by 10 percent. The estimate from the entire period of record was used because the longer period should provided a more reliable estimate. The 1-percent-annual-chance flood estimate was not weighted with a regional regression estimate for this site because the regional equations do not represent canalized streams. The magnitude of the 1-percent-annual-chance flood on Yalobusha River Canal at State Highway 9 was determined using records of annual peak flow collected at the USGS stream gaging station at that site. The annual peak-flow records were analyzed following procedures in Bulletin No. 17B (U.S. Department of the Interior, 1982). Because estimates of the 1-percent-annual-chance flood based on the entire period of record (1951-86) were within 8 present of those obtained using only the post-canalized period (1968-86), the longer period of record was used in the analyses. There is a significant increase, however, in the magnitude of smaller-order floods after canalization on both Yalobusha River and Skuna River Canals. As with Skuna River Canal gaging station estimate of the 1-percent-annual-chance flood was not weighted with a regional regression estimate for this site. The magnitude of the 1-percent-annual-chance floods on Miles, Hurricane and Huffman Creeks was estimated using basin characteristics and regional regression equations following USGS procedures (U.S. Geological Survey, 1976). These regional estimates should be appropriate for these streams because the vegetative conditions of the streams have returned to their pre-canalized state and because canalization does not generally produce large changes in the 1-percent-annual-chance flood for small streams.
6
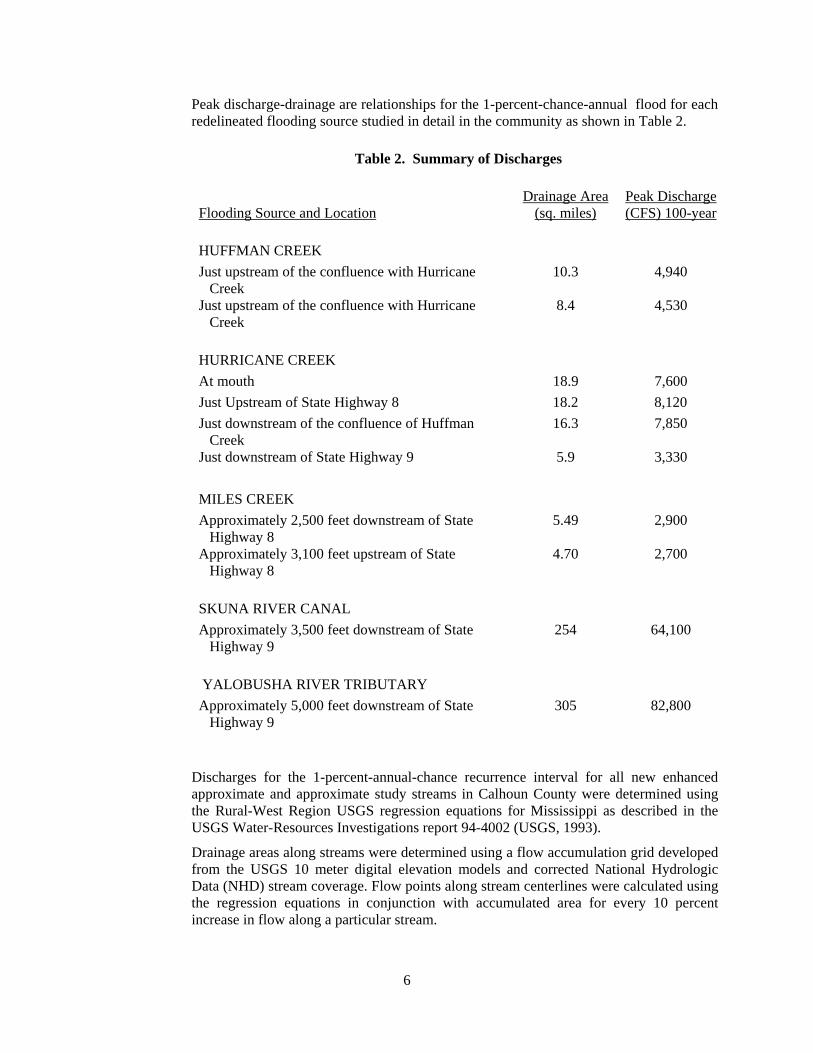
Peak discharge-drainage are relationships for the 1-percent-chance-annual flood for each redelineated flooding source studied in detail in the community as shown in Table 2.
Table 2. Summary of Discharges
Flooding Source and Location Drainage Area
(sq. miles) Peak Discharge (CFS) 100-year
HUFFMAN CREEK Just upstream of the confluence with Hurricane
Creek 10.3 4,940
Just upstream of the confluence with Hurricane Creek
8.4 4,530
HURRICANE CREEK At mouth 18.9 7,600 Just Upstream of State Highway 8 18.2 8,120 Just downstream of the confluence of Huffman
Creek 16.3 7,850
Just downstream of State Highway 9 5.9 3,330 MILES CREEK Approximately 2,500 feet downstream of State
Highway 8 5.49 2,900
Approximately 3,100 feet upstream of State Highway 8
4.70 2,700
SKUNA RIVER CANAL Approximately 3,500 feet downstream of State
Highway 9 254 64,100
YALOBUSHA RIVER TRIBUTARY Approximately 5,000 feet downstream of State
Highway 9 305 82,800
Discharges for the 1-percent-annual-chance recurrence interval for all new enhanced approximate and approximate study streams in Calhoun County were determined using the Rural-West Region USGS regression equations for Mississippi as described in the USGS Water-Resources Investigations report 94-4002 (USGS, 1993).
Drainage areas along streams were determined using a flow accumulation grid developed from the USGS 10 meter digital elevation models and corrected National Hydrologic Data (NHD) stream coverage. Flow points along stream centerlines were calculated using the regression equations in conjunction with accumulated area for every 10 percent increase in flow along a particular stream.
7
3.2 Hydraulic Analyses
Analyses of the hydraulic characteristics of flooding from the sources studied were carried out to provide estimates of the elevations of floods of the selected recurrence intervals. Users should be aware that flood elevations shown on the FIRM represent rounded whole-foot elevations and may not exactly reflect the elevations shown on the Flood Profiles or in the Floodway Data tables in the FIS report. Flood elevations shown on the FIRM are primarily intended for flood insurance rating purposes. For construction and/or floodplain management purposes, users are cautioned to use the flood elevation data presented in this FIS in conjunction with the data shown on the FIRM. Cross sections and structural geometry were obtained by field survey on Miles Creek, Huffman Creek and Hurricane Creek. Other historical data were used for Skuna River Canal and Yalobusha River Canal. Locations of selected cross sections used in the hydraulic analyses are shown on the Flood Profiles and on the Flood Insurance Rate Map. Roughness coefficients (Manning’s “n”) used in the hydraulic analyses were based on engineering judgment and field observation of the channel and floodplain areas. Average “n” values were, for Skuna River Canal, 0.035 for the channel and 0.15 for the overbank; for Miles Creek, 0.062 for the channel and 0.14 for the overbank; Hurricane Creek, 0.049 for the channel and 0.18 for the overbank; and for Huffman Creek, 0.046 for the channel and 0.13 for the overbank. The starting water-surface elevations for Miles Creek and Hurricane Creek were computed using slope-conveyance methods. The starting water-surface elevation for Huffman Creek was taken from the Hurricane Creek 1-percent-annual-chance profile at the confluence of Huffman Creek. The starting water-surface elevation for Skuna River anal was determined from a stage-discharge relationship developed from discharge measurements, conveyance computations, and discharge-conveyance ratios. The elevation of the 1-percent-annual-chance flood at State Highway 9 determined from this analysis compared favorably with the historical flood-elevation profile upstream from State Highway 9. The starting water-surface elevation for Yalobusha River Canal was determined by relating flood discharge measurements with corresponding stages. The flood elevation profiles for Miles Creek, Hurricane Creek and Huffman Creek were computed using WSPRO, a step-backwater computer program (U.S. Department of Transportation, 1986). Historical flood elevation profiles for Skuna River Canal and Yalobusha River Canal were used to correlate water-surface elevations for these two rivers. Flood profiles were drawn showing the computed water-surface elevations for floods of the selected recurrence intervals.
Analyses of the hydraulic characteristics of flooding from the sources studied by enhanced approximate and approximate methods were carried out to provide estimates of the elevations of floods of the selected recurrence intervals.
8
Water-surface profiles were computed for enhanced approximate and approximate study streams through the use of the U.S. Army Corps of Engineers HEC-RAS version 3.1.2 computer program (USACE, 2003). Water surface profiles were produced for the 1-percent-annual-chance storms for enhanced approximate and approximate studies.
The enhanced approximate and approximate study methodology used Watershed Information SystEm (WISE) (Watershed Concepts, 2008) as a preprocessor to HEC-RAS. Tools within WISE allowed the engineer to verify that the cross-section data was acceptable. The WISE program was used to generate the input data file for HEC-RAS. Then HEC-RAS was used to determine the flood elevation at each cross section of the modeled stream. No floodway was calculated for streams studied by approximate methods.
The hydraulic analyses for this study are based only on the effect on unobstructed flow. The flood elevations as shown on the profiles are thus considered valid only if hydraulic structures in general remain unobstructed and do not fail. Floodplains were mapped to include backwater effects that govern each flooding source near its downstream extent. Floodplains were reviewed for accuracy and adjusted as necessary. All qualifying bench marks within a given jurisdiction that are cataloged by the National Geodetic Survey (NGS) and entered into the National Spatial Reference System (SRS) as First or Second Order Vertical and have a vertical stability classification of A, B, or C are shown and labeled on the FIRM with their 6-character NSRS Permanent Identifier. Bench Marks cataloged by the NGS and entered into the NSRS vary widely in vertical stability classification. NSRS vertical stability classifications are as follows:
• Stability A: Monuments of the most reliable nature, expected to hold position/elevation well (e.g., mounted in bedrock)
• Stability B: Monuments which generally hold their position/elevation well (e.g., concrete bridge abutment)
• Stability C: Monuments which may be affected by surface ground movements
(e.g., concrete monument below frost line)
• Stability D: Mark of questionable or unknown vertical stability (e.g., concrete monument above frost line, or steel witness post)
In addition to NSRS bench marks, the FIRM may also show vertical control monuments established by a local jurisdiction; these monuments will be shown on the FIRM with the appropriate designations. Local monuments will only be placed on the FIRM if the community has requested that they be included, and if the monuments meet the aforementioned NSRS inclusion criteria. To obtain current elevation, description, and/or location information for bench marks shown on the FIRM for this jurisdiction, please contact the Information Services Branch of the NGS at (301) 713-3242, or visit their Web site at www.ngs.noaa.gov.

9
It is important to note that temporary vertical monuments are often established during the preparation of a flood hazard analysis for the purpose of establishing local vertical control. Although these monuments are not shown on the FIRM, they may be found in the Technical Support Data Notebook associated with this FIS and FIRM. Interested individuals mat contact FEMA to access this data.
3.3 Vertical Datum
All FIS reports and FIRMs are referenced to a specific vertical datum. The vertical datum provides a starting point against which flood, ground, and structure elevations can be referenced and compared. Until recently, the standard vertical datum in use for newly created or revised FIS reports and FIRMs was the National Geodetic Vertical Datum of 1929 (NGVD 29). With the finalization of the North American Vertical Datum of 1988 (NAVD 88), many FIS reports and FIRMs are being prepared using NAVD 88 as the referenced vertical datum. Flood elevations shown in this FIS report and on the FIRM are referenced to NAVD 88. These flood elevations must be compared to structure and ground elevations referenced to the same vertical datum. It is important to note that adjacent counties may be referenced to NGVD 29. This may result in differences in base flood elevations across county lines. The elevations shown in the FIS report and on the FIRM for Calhoun County are referenced to NAVD88. Ground, structure, and flood elevations may be compared and/or referenced to NGVD29, add 0.13 feet to the NAVD88 elevation. The 0.13 feet value is an average for the entire county. The BFEs shown on the FIRM represent whole-foot rounded values. For example, a BFE of 12.4 feet will appear as 12 feet on the FIRM and 12.6 feet as 13 feet. Users who wish to convert the elevations in this FIS report to NGVD29 should apply the stated conversion factor to elevations shown on the Flood Profiles and supporting data tables in the FIS report, which are shown at a minimum to the nearest 0.1 foot. For more information on NAVD 88, see Converting the National Flood Insurance Program to the North American Vertical Datum of 1988, FEMA Publication FI-20/June 1992, or contact the Vertical Network Branch, National Geodetic Survey, Coast and Geodetic Survey, National Oceanic and Atmospheric Administration, Rockville, Maryland 20910 (Internet address http: www.ngs.noaa.gov).
4.0 FLOODPLAIN MANAGEMENT APPLICATIONS
The NFIP encourages State and local governments to adopt sound floodplain management programs. To assist in this endeavor, each FIS report provides 1-percent-annual-chance floodplain data, which may include a combination of the following: 10-, 2-, 1-, and 0.2-percent-annual-chance flood elevations; delineations of the 1- and 0.2-percent-annual-chance floodplains; and a 1-percent-annual-chance floodway. This information is presented on the FIRM and in many components of the FIS report, including Flood Profiles, Floodway Data tables, and Summary of Stillwater Elevation tables. Users should reference the data presented in the FIS report as well as additional information that may be available at the local community map repository before making flood elevation and/or floodplain boundary determinations.
10
4.1 Floodplain Boundaries
To provide a national standard without regional discrimination, the 1-percent-annual-chance flood has been adopted by FEMA as the base flood for floodplain management purposes. The 0.2-percent-annual-chance flood is employed to indicate additional areas of flood risk in the community.
For each stream studied by detailed and enhanced approximate methods, the 1- and/or 0.2-percent-annual-chance floodplain boundaries have been delineated using the flood elevations determined at each cross section. Between cross sections, the detail boundaries were interpolated using topographic maps at a scale of 1:2400, with a contour interval of 20 feet (U.S. Geological Survey, 1983). The enhanced approximate boundaries were interpolated using 5-foot interval topographic mapping developed from USGS 10 meter digital elevation models (DEM) (USGS, 1984). For each streams studied by approximate method, the 1-percent-annual-chance floodplain boundaries have been delineated using interpolation of 5-foot interval topographic mapping developed from USGS 10 meter digital elevation models (DEM) (USGS, 1984). The 1- and 0.2-percent-annual-chance floodplain boundaries are shown on the FIRM (Exhibit 2). On this map, the 1 percent-annual-chance floodplain boundary corresponds to the boundary of the areas of special flood hazards (Zones A, AE and X), and the 0.2-percent-annual-chance floodplain boundary corresponds to the boundary of areas of moderate flood hazards. In cases where the 1- and 0.2-percent-annual-chance floodplain boundaries are close together, only the 1-percent-annual-chance floodplain boundary has been shown. Small areas within the floodplain boundaries may lie above the flood elevations, but cannot be shown due to limitations of the map scale and/or lack of detailed topographic data. For the streams studied by enhanced approximate and approximate method, only the 1-percent-annual-chance floodplain boundary is shown on the FIRM. Approximate 1-percent-annual-chance floodplain boundaries in some portions of the study area were taken directly from the Flood Hazard Boundary Map for the Town of Derma; the Cities of Bruce and Calhoun City; and the Village of Pittsboro.
4.2 Floodways
Encroachment on floodplains, such as structures and fill, reduces flood-carrying capacity, increases flood heights and velocities, and increases flood hazards in areas beyond the encroachment itself. One aspect of floodplain management involves balancing the economic gain from floodplain development against the resulting increase in flood hazard. For purposes of the NFIP, a floodway is used as a tool to assist local communities in this aspect of floodplain management. Under this concept, the area of the 1-percent-annual-chance floodplain is divided into a floodway and a floodway fringe. The floodway is the channel of a stream, plus any adjacent floodplain areas, that must be kept free of encroachment so that the 1-percent-annual-chance flood can be carried without substantial increases in flood heights. Minimum Federal standards limit such

increases to 1.0 foot, provided that hazardous velocities are not produced. The floodways in this study are presented to local agencies as minimum standards that can be adopted directly or that can be used as a basis for additional floodway studies.
Encroachment into areas subject to inundation by floodwaters having hazardous velocities aggravates the risk of flood damage and heightens potential flood hazards by further increasing velocities. To reduce the risk of property damage in areas where the stream velocities are high, the community may wish to restrict development in areas outside the floodway. Near the mouths of streams studied in detail, floodway computations are made without regard to flood elevations on the receiving water body.
Along streams where floodways have not been computed, the community must ensure
that the cumulative effect of development in the floodplain will not cause more than a 1.0-foot increase in the BFEs at any point within the community.
The area between the floodway and 1-percent-annual-chance floodplain boundaries is termed the floodway fringe. The floodway fringe encompasses the portion of the floodplain that could be completely obstructed without increasing the water-surface elevation of the 1-percent-annual-chance flood more than 1.0 foot at any point. Typical relationships between the floodway and the floodway fringe and their significance to floodplain development are shown in Figure 1, “Floodway Schematic.” No floodways were computed for streams studied by approximate methods because of limitations in the approximate study methodology.
Figure 1. Floodway Schematic
5.0 INSURANCE APPLICATION
Floodway Schematic
11

12
5.0 INSURANCE APPLICATION
For flood insurance rating purposes, flood insurance zone designations are assigned to a community based on the results of the engineering analyses. These zones are as follows: Zone A Zone A is the flood insurance rate zone that corresponds to the 1-percent-annual-chance floodplains that are determined in the Flood Insurance Study by approximate methods. Because detailed hydraulic analyses are not performed for such areas, no base (1-percent-annual-chance) flood elevations (BFEs) or depths are shown within this zone.
Zone AE Zone AE is the flood insurance rate zone that corresponds to the 1-percent-annual-chance floodplains that are determined in the FIS report by detailed methods. Whole foot BFEs derived from the detailed hydraulic analyses are shown at selected intervals within this zone. Zone X Zone X is the flood insurance rate zone that corresponds to areas outside the 0.2-percent-annual-chance floodplain, areas within the 0.2-percent-annual-chance floodplain, areas of 1-percent-annual-chance flooding where average depths are less than 1 foot, areas of 1-percent-annual-chance flooding where the contributing drainage area is less than 1 square mile (sq. mi.), and areas protected from the base flood by levees. No BFEs or depths are shown within this zone.
6.0 FLOOD INSURANCE RATE MAP
The FIRM is designed for flood insurance and floodplain management applications. For flood insurance applications, the map designates flood insurance rate zones as described in Section 5.0. Insurance agents use the zones and BFEs in conjunction with information on structures and their contents to assign premium rates for flood insurance policies. For floodplain management applications, the map shows by tints, screens, and symbols, the 1- and 0.2-percent-annual-chance floodplains, floodways, and the locations of selected cross sections used in the hydraulic analyses and floodway computation. The countywide Flood Insurance Rate Map presents flooding information for the entire geographic area of Calhoun County. Previously, Flood Insurance Rate Maps were prepared for each incorporated community and the unincorporated areas of the County identified as flood-prone. This countywide Flood Insurance Rate Map also includes flood-hazard information that was presented separately on Flood Boundary and Floodway Maps, where applicable. Historical data relating to the maps prepared for each community are presented in Table 3, “Community Map History.”
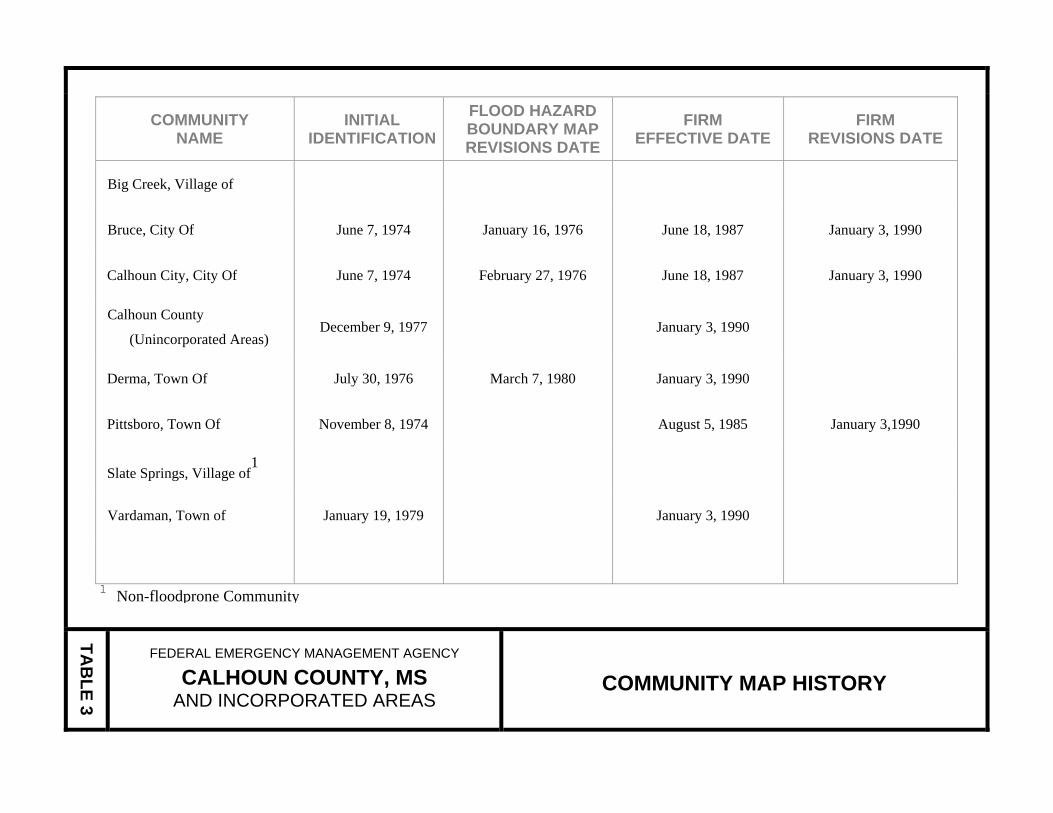
1 Non-floodprone Community
COMMUNITY NAME
INITIAL IDENTIFICATION
FLOOD HAZARD BOUNDARY MAP REVISIONS DATE
FIRM EFFECTIVE DATE
FIRM REVISIONS DATE
Big Creek, Village of
Bruce, City Of June 7, 1974 January 16, 1976 June 18, 1987 January 3, 1990
Calhoun City, City Of June 7, 1974 February 27, 1976 June 18, 1987 January 3, 1990
Calhoun County
(Unincorporated Areas) December 9, 1977 January 3, 1990
Derma, Town Of July 30, 1976 March 7, 1980 January 3, 1990
Pittsboro, Town Of November 8, 1974 August 5, 1985 January 3,1990
Slate Springs, Village of1
Vardaman, Town of January 19, 1979 January 3, 1990
TAB
LE 3
FEDERAL EMERGENCY MANAGEMENT AGENCY
CALHOUN COUNTY, MS AND INCORPORATED AREAS
COMMUNITY MAP HISTORY

14
7.0 OTHER STUDIES The Flood Insurance Rate Maps for Chickasaw, Grenada, Lafayette, Panola, Webster and Yalobusha Counties are in agreement with this study. Information pertaining to revised and unrevised flood hazards for each jurisdiction within Calhoun County has been compiled into this FIS. Therefore, this FIS report supersedes or is compatible with all previously printed FIS reports, FIRMs, and Flood Hazard Boundary Maps (FBFMs) for al jurisdictions within Calhoun County, and should be considered authoritative for the purposed of the NFIP.
8.0 LOCATION OF DATA
Information concerning the pertinent data used in the preparation of this FIS can be obtained by contacting FEMA, Federal Insurance and Mitigation Administration, Koger Center - Rutgers Building, 3003 Chamblee Tucker Road, Atlanta, Georgia 30341. Future revisions may be made that do not result in the republishing of the Flood Insurance Study report. To ensure that any user is aware of all revisions, it is advisable to contact the map repository of flood hazard data located in the community.
9.0 BIBLIOGRAPHY AND REFERENCES
Federal Emergency Management Agency, Flood Insurance Rate Map, City of Bruce, Calhoun County, Mississippi, June 1987.
Federal Emergency Management Agency, Flood Insurance Rate Map, City of Calhoun City, Calhoun County, Mississippi, June 1987.
Federal Emergency Management Agency, Flood Insurance Rate Map, Town of Derma, Calhoun County, Mississippi, September 1987.
Federal Emergency Management Agency, Flood Insurance Rate Map, Village of Pittsboro, Calhoun County, Mississippi, August 1985.
Federal Emergency Management Agency, Flood Insurance Rate Map, Webster County, Unincorporated Areas, Mississippi, September 1985.
Federal Emergency Management Agency, Flood Insurance Study, Calhoun County countywide and Incorporated Areas, Mississippi, January 1990.
Federal Emergency Management Agency, Flood Insurance Study, Yalobusha County and Incorporated Areas, Mississippi, September 1988.
National Weather Service Forecast Office, Tupelo, MS Climate Data, http://www.srh.noaa.gov/meg/tupcli.php. Accessed June 4, 2009.
15
U.S. Army Corps of Engineers Hydrologic Engineering Center, HEC-RAS River Analysis System User's Manual, Version 3.1.2, April 2003.
U.S. Census Bureau. http://www.census.gov/. Accessed February 4, 2009.
U.S. Department of Housing and Urban Development, Federal Insurance Administration, Flood Hazard Boundary Map, Town of Vardaman, Calhoun County, Mississippi, January 1979.
U.S. Department of Housing and Urban Development, Federal Insurance Administration, Flood Hazard Boundary Map, Calhoun County, Unincorporated Areas, Mississippi, December 1977.
U.S. Department of Housing and Urban Development, Federal Insurance Administration, Flood Insurance Rate Map, Grenada County, Unincorporated Areas, Mississippi, December 1978.
U.S. Department of the Interior, Geological Survey, Interagency Advisory Committee on Water Data, Office of Water Data Coordination, Hydrology Subcommittee, Bulletin No. 17B, Guidelines for Determining Flood Flow Frequency, September 1981, revised March 1982.
U.S. Department of Transportation, Federal Highway Administration, Report No. FHWA/RD-86/108, Bridge Waterways Analysis model: Research Report, J.O. Shearman, W.H/ Kirby, V.R. Snyder, and H.N. Flippo, July 1986.
U.S. Geological Survey, 7.5 Minute Series Topographic Maps, Scale 1:24000, Contour Interval 20 Feet: Atlanta, Mississippi, 1972; Sarepta, Mississippi, 1972; Tula, Mississippi, 1972; Vardaman, Mississippi, 1972; Bruce, Mississippi, 1983; Bellefontaine, Mississippi, 1983; Big Creek, Mississippi, 1983; Cadaretta, Mississippi, 1983; Calhoun City, Mississippi, 1983; and Skuna, Mississippi, 1983.
U.S. Geological Survey, 7.5 Minute Series Topographic Maps, Scale 1:24,000, Contour Interval 20 feet: Calhoun, Mississippi, 1984.
U.S. Geological Survey, in cooperation with the Mississippi State Highway Department, Flood Frequency of Mississippi Streams, B.E. Colson and J.W. Hudson, 1976.
U.S. Geological Survey, Nationwide Summary of U.S. Geological Survey Regional Regression Equations for Estimating Magnitude and Frequency of Floods for Ungaged Sites, U.S. Geological Survey Water-Resources Investigations Report 94-4002, 1993.
Watershed Concepts, a Division of AECOM, Watershed Information SystEm Version 3.1.1, Greensboro, NC, July 2008.