Embed Size (px)
Citation preview
3485
Fecundity and the demographic strategies of coral morphologiesMARIANA ÁLVAREZ-NORIEGA,1,2,5 ANDREW H. BAIRD,2 MARIA DORNELAS,3 JOSHUA S. MADIN,4 VIVIAN R. CUMBO,4
AND SEAN R. CONNOLLY1,2
1Marine Biology and Aquaculture, College of Science and Engineering, James Cook University, Townsville, Queensland 4811 Australia
2ARC Centre of Excellence for Coral Reef Studies, James Cook University, Townsville, Queensland 4811 Australia3Centre for Biological Diversity, Scottish Oceans Institute, University of St. Andrews, Scotland, KY16 9TH UK
4Department of Biological Sciences, Macquarie University, Sydney, New South Wales 2109 Australia
Abstract. Understanding species differences in demographic strategies is a fundamental goal of ecology. In scleractinian corals, colony morphology is tightly linked with many demographic traits, such as size- specific growth and morality. Here we test how well morphology predicts the colony size- fecundity relationship in eight species of broadcast- spawning corals. Variation in colony fecundity is greater among morphologies than between species with a similar morphology, demonstrating that colony morphology can be used as a quantitative proxy for demographic strategies. Additionally, we examine the relationship between size- specific colony fecundity and mechanical vulnerability (i.e., vulnerability to colony dislodgment). Interestingly, the relationship between size- specific fecundity and mechanical vulnerability varied among morphologies. For tabular species, the most fecund colonies are the most mechanically vulnerable, while the opposite is true for massive species. For corymbose and digitate colonies, mechanical vulnerability remains relatively constant as fecundity increases. These results reveal strong differences in the demographic tradeoffs among species of different morphologies. Using colony morphology as a quantitative proxy for demographic strategies can help predict coral community dynamics and responses to anthropogenic change.
Key words: demographic strategies; fecundity; morphology; reef coral; tradeoff.
INTRODUCTION
Understanding how differences in demographic strat-egies of organisms are related to functional traits can illuminate the processes shaping community structure. Recent studies have shifted the focus towards the inter-action of these traits with the abiotic and biotic envi-ronment and away from species- by- species examination of demographic responses to the environment (McGill et al. 2006, Adler et al. 2013). A functional trait is a readily measurable characteristic of an organism that affects its fitness (McGill et al. 2006). For example, phy-toplankton species with large cell sizes have a slower maximum growth rate than species with small cell sizes (Edwards et al. 2012). For a trait- based approach to be informative of community processes, there must be a strong relationship between the trait and demographic strategies. Consequently, the first step in trait- based approaches is to test whether demographic strategies are more similar between species that share the same func-tional trait than between species that diverge in func-tional traits. Trait- based approaches have been used to identify mechanisms maintaining biodiversity (Angert et al. 2009) and in explaining community composition across gradients (Moles et al. 2011, Edwards et al. 2013).
Demographic strategies are the possible pathways in the relationship between demographic rates and age or size that an organism can take (Pianka 1971). Tradeoffs arise when good performance of one ecological function by one trait compromises the performance of another ecological function by another trait (Stearns 1992). Traits have complex interactions and covariations with one another and negative interactions among some traits can result in positive interactions among others (Reznick et al. 2000). Examples of demographic tradeoffs are growth rate vs. tolerance to low resource levels (Teuschl et al. 2007), food acquisition vs. predation risk (Laurila et al. 2008), and number vs. size of offspring (Marshall and Keough 2005). Tradeoffs can favor species coex-istence by reducing differences in fitness between com-peting species, and by giving different species advantages under different environmental conditions (equalizing and stabilizing effects, respectively, sensu Chesson 2000). Tradeoffs can also influence which species are winners and losers as a consequence of environmental change, and thus influence community structure (Tilman and Pacala 1993).
Most trait- based approaches investigating demo-graphic tradeoffs have been conducted on plants. For example, wood density is positively related to mechanical support and resistance to rupture (Hacke et al. 2001) and negatively related to growth rate (Poorter et al. 2008), resulting in a tradeoff between survival and growth (Wright et al. 2010, Philipson et al. 2014). Some studies
Ecology, 97(12), 2016, pp. 3485–3493© 2016 by the Ecological Society of America
Manuscript received 2 March 2016; revised 28 August 2016; accepted 7 September 2016. Corresponding Editor: Richard B. Aronson.
5E-mail: [email protected]
3486 Ecology, Vol. 97, No. 12MARIANA ÁLVAREZ- NORIEGA ET AL.
have gone a step further and linked demographic tradeoffs to community ecology. Traits have been linked to envi-ronmental variables to explain the distribution of plant species (Pavoine et al. 2011, Sterck et al. 2011). Similarly, trait- based approaches have been used to identify the processes that contribute to community assembly in woody plants (Ackerly and Cornwell 2007, Kraft et al. 2008). Trait based approaches are likely to be particu-larly fruitful in species rich assemblages, such as reef corals, because it is impractical to quantify demographic rates on a species- by- species basis. Additionally, trait based approaches reduce the negative impacts of destructive sampling and build the foundation for a pre-dictive framework for community dynamics (McGill et al. 2006).
In reef corals, many demographic rates are qualita-tively associated with colony morphology (Jackson 1979, Hughes and Jackson 1985). Coral species can be grouped into a number of different morphologies, which often have similar demographic rates and responses to distur-bance. Morphology is a good predictor of colony growth rate (Darling et al. 2012, Pratchett et al. 2015, Madin et al. 2016) and mortality (Madin et al. 2014). Additionally, competitive dynamics are influenced by the morphology of competitors (Lang 1973, Porter 1974). Therefore, colony morphology is a promising trait to use as a quan-titative proxy for demographic strategies in corals.
Corals are colonial organisms composed of polyps. Polyp maturity is determined by colony size (Kojis and Quinn 1984, Sakai 1998) and polyp age (Kai and Sakai 2008, Graham and van Woesik 2013). The number of gametes per polyp is strongly limited by polyp volume and gamete size, and these constraints vary among species and genera (Harriott 1983, Hall and Hughes 1996). In general, energy content per gamete trades off against the number of gametes produced, and gametes with higher energy content are thought to have higher survival (Stearns 1992). Although there is no evidence for a fitness advantage with increasing gamete size in broadcast- spawning corals (Graham et al. 2008, 2013), higher sur-vival in better- provisioned offspring has been observed in other marine invertebrates (Jarrett and Pechenik 1997, Jarrett 2003, Marshall et al. 2006) and plants (Saverimuttu and Westoby 1996, Moles and Westoby 2004).
Population dynamics depend on two fundamental demographic processes: births and deaths. Tradeoffs between fecundity and mortality are common in many organisms (Schluter et al. 1991). On reefs, one major cause of mortality is hydrodynamic disturbance (De’ath et al. 2012). If strong, wave action can dislodge or break off coral colonies. The effects of hydrodynamic forces on coral colonies depend on the strength of the colony’s attachment to the substrate (Massel and Done 1993) and on the colony’s morphology (Madin and Connolly 2006). Wave action is an important factor shaping the size- structure and zonation patterns of species across the reef (Done 1982, Madin and Connolly 2006). Size- dependent mortality rates are closely linked to the
effects of wave action on colony morphology (Madin et al. 2014).
Here we assess whether colony morphology influences the relationship between colony size and colony fecundity, and we quantitatively characterize the demographic tradeoff between colony fecundity and colony vulnera-bility to dislodgment during hydrodynamic disturbance. We used a 5- yr data set, comprising four different mor-phologies with two coral species each. Our findings support to the hypothesis that morphology is good proxy for demographic traits: they show that fecundity schedules are strongly associated with colony mor-phology, and, more broadly, they move beyond our existing qualitative understanding to quantitatively char-acterize how morphology influences demographic tradeoffs in reef- building corals.
METHODS
Study location and data collection
The data were collected on Lizard Island in the northern Great Barrier Reef, from 2009 to 2014. The study site was located along 200 m of the northern semi- exposed reef crest between Palfrey Island and South Island (14.699839° S, 145.448674° E).
Corals are colonial organisms formed by the aggre-gation of polyps. In general, most polyps within a colony produce oocytes and therefore colony fecundity increases as colony size increases. Exceptions include the sterile zone on the tips of the branches within Acropora colonies (Wallace 1985) and the perimeter of massive colonies (Sakai 1998). However, comparisons among species are complicated by the fact that both polyp (Veron 2000) and oocyte size (Harrison and Wallace 1990) vary greatly among species. Even though there is no evidence linking oocyte size to larval survival in broadcast- spawning corals (Graham et al. 2008), it is possible that oocyte size affects early post- settlement survival. If oocyte size has no effect on fitness, the number of oocytes per colony would be a demographically meaningful currency for colony fecundity. In contrast, if oocyte size and provi-sioning strongly influences early post- settlement survival, oocyte energy content may be more demographically meaningful than the number of oocytes per colony. For that reason, we used both currencies to measure colony fecundity: number of oocytes per colony and colony reproductive investment. We define colony reproductive investment as the number of oocytes per polyp, multi-plied by the number of polyps in the colony and by the average carbon content per oocyte. All analyses were done twice, once with each currency.
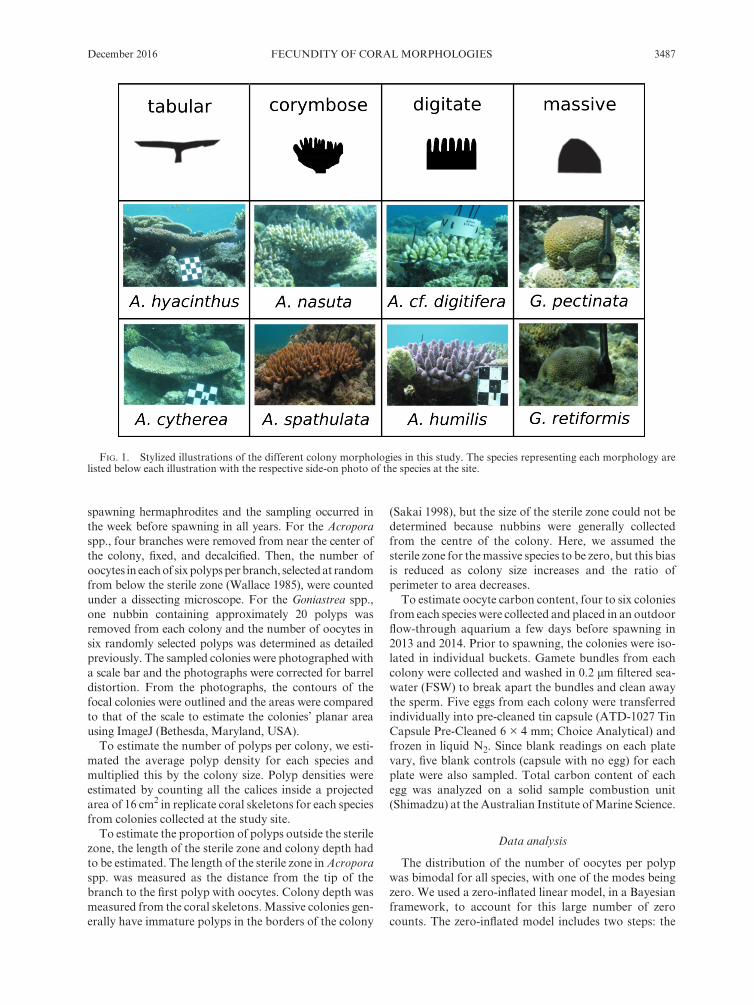
Thirty colonies from eight common species grouped into four morphologies were sampled each year from 2009 to 2013: tabular (Acropora cytherea and A. hyacinthus), corymbose (A. nasuta and A. spathulata), digitate (A. humilis and A. cf. digitifera) and massive (Goniastrea pectinata and G. retiformis; Fig. 1). All species are broadcast
FECUNDITY OF CORAL MORPHOLOGIESDecember 2016 3487
spawning hermaphrodites and the sampling occurred in the week before spawning in all years. For the Acropora spp., four branches were removed from near the center of the colony, fixed, and decalcified. Then, the number of oocytes in each of six polyps per branch, selected at random from below the sterile zone (Wallace 1985), were counted under a dissecting microscope. For the Goniastrea spp., one nubbin containing approximately 20 polyps was removed from each colony and the number of oocytes in six randomly selected polyps was determined as detailed previously. The sampled colonies were photographed with a scale bar and the photographs were corrected for barrel distortion. From the photographs, the contours of the focal colonies were outlined and the areas were compared to that of the scale to estimate the colonies’ planar area using ImageJ (Bethesda, Maryland, USA).
To estimate the number of polyps per colony, we esti-mated the average polyp density for each species and multiplied this by the colony size. Polyp densities were estimated by counting all the calices inside a projected area of 16 cm2 in replicate coral skeletons for each species from colonies collected at the study site.
To estimate the proportion of polyps outside the sterile zone, the length of the sterile zone and colony depth had to be estimated. The length of the sterile zone in Acropora spp. was measured as the distance from the tip of the branch to the first polyp with oocytes. Colony depth was measured from the coral skeletons. Massive colonies gen-erally have immature polyps in the borders of the colony
(Sakai 1998), but the size of the sterile zone could not be determined because nubbins were generally collected from the centre of the colony. Here, we assumed the sterile zone for the massive species to be zero, but this bias is reduced as colony size increases and the ratio of perimeter to area decreases.
To estimate oocyte carbon content, four to six colonies from each species were collected and placed in an outdoor flow- through aquarium a few days before spawning in 2013 and 2014. Prior to spawning, the colonies were iso-lated in individual buckets. Gamete bundles from each colony were collected and washed in 0.2 μm filtered sea-water (FSW) to break apart the bundles and clean away the sperm. Five eggs from each colony were transferred individually into pre- cleaned tin capsule (ATD- 1027 Tin Capsule Pre- Cleaned 6 × 4 mm; Choice Analytical) and frozen in liquid N2. Since blank readings on each plate vary, five blank controls (capsule with no egg) for each plate were also sampled. Total carbon content of each egg was analyzed on a solid sample combustion unit (Shimadzu) at the Australian Institute of Marine Science.
Data analysis
The distribution of the number of oocytes per polyp was bimodal for all species, with one of the modes being zero. We used a zero- inflated linear model, in a Bayesian framework, to account for this large number of zero counts. The zero- inflated model includes two steps: the
FIG. 1. Stylized illustrations of the different colony morphologies in this study. The species representing each morphology are listed below each illustration with the respective side- on photo of the species at the site.
3488 Ecology, Vol. 97, No. 12MARIANA ÁLVAREZ- NORIEGA ET AL.
first step analyzes the zero vs. non- zero data, which gives a posterior distribution of the parameter estimates pre-dicting the probability of a polyp being fecund; and the second step analyzes variation in counts for the non- zero observations, which gives the posterior distribution of the parameter estimates predicting the number of oocytes per fecund polyp. The models were first fitted for each species separately, and then for each morphology, grouping the pairs of species of each morphology. Both components of the zero- inflated model were explicit func-tions of colony size (as m2 on a natural logarithmic scale) and the relationship was constrained to be zero or pos-itive. The analysis was performed in R version 3.1.2 (R Core Team 2013), with the function ‘logit’ from the package ‘BayesLogit’ (Polson et al. 2013) being used for the binomial regression. The number of oocytes was esti-mated by maximizing the zero- truncated poisson log- likelihood. For the massive species, a zero- truncated negative binomial log- likelihood was used instead because the data were overdispersed. The Markov Chain Monte Carlo chains were generated with a Metropolis algorithm with the function ‘MCMCmetrop1’ from the package ‘MCMCpack’ (Martin et al. 2011). Similarly, we estimated the colony depth, the length of the sterile zone, polyp density, and carbon content per oocyte assuming a Gaussian distribution. All priors were uninformative. All parameter estimates are found in the Appendix S1: Tables S1–S5.
To estimate fecundity at the colony level, we had to combine information from multiple analyses: probability of fecundity as a function of colony size, number of oocytes per mature polyp as a function of colony size, polyp density, length of sterile zone, colony depth and energy content of eggs. Each of these quantities has uncertainty associated with it, and each of these uncer-tainties propagates through to the overall fecundity- colony size relationship. To rigorously account for this propagation of uncertainty, we employed a Bayesian approach. Bayesian methods yield a posterior proba-bility distribution of parameter values, given the data and any prior beliefs about those parameters. (We used uniform priors, to ensure that the posterior distribution depended only on the information in the data analyzed in this study.) To account for the propagation of uncer-tainty, we randomly selected, from our analyses of each component of colony fecundity, a set of parameters from the model fit’s posterior distribution, and we used these to compute colony fecundity as a function of size. By repeatedly and randomly selecting parameter sets from the relevant posterior distributions, we obtained a distri-bution of estimates of the colony size- fecundity rela-tionship, from which we calculated the median and the 95% credible interval (0.975 and 0.025 quantiles).
To estimate the number of oocytes per colony, we mul-tiplied the probability of a polyp being fecund, the number of oocytes per fecund polyp, and the number of fecund polyps in the colony. To estimate reproductive investment at the colony level, we multiplied the number
of oocytes per colony and the average carbon content per oocyte. To estimate the number of fecund polyps in the colony, we multiplied the polyp density (polyps/cm2), the proportion of the polyps outside the sterile zone (1- length of the sterile zone/colony depth), and the size of the colony (in cm2).
We calculated differences in colony size- fecundity rela-tionships (with fecundity measured both as number of oocytes per colony and as reproductive investment) in the following fashion. To estimate the differences in colony fecundity between species, we randomly drew values from the posterior distribution of the size- fecundity relationship for each species, and we calculated the difference between the colony fecundity of the two species as a function of size. By repeating this process 1,000 times, we obtained a posterior distribution of differences in colony fecundity. Differences in colony fecundity between morphologies were estimated in analogous fashion. If the 95% credible interval did not overlap zero, we inferred that the colony size- colony fecundity relationships were different.
To investigate the demographic strategy of species with respect to mechanical vulnerability and colony fecundity, we examined the relationship between colony shape factor (CSF) and colony fecundity across all observed sizes. CSF is a dimensionless measurement of mechanical susceptibility that has been developed for different coral morphologies (Madin and Connolly 2006). Larger CSF values correspond to higher mechanical vulnerability. CSF is reduced by wide colony bases and increased by increasing colony height and increasing colony width above the base relative to the width of the base. For example, tabular colonies, which are top- heavy, are more susceptible to mechanical disturbance and have a higher CSF than massive colonies, which are bottom- heavy. The different morphologies have different colony size- CSF relationships. As tabular and corymbose colonies grow, the weight of the top of the colony increases with respect to the base and therefore they become more vulnerable to mechanical dislodgment. In contrast, the base of digitate and massive colonies becomes wider with increasing colony size, and the CSF decreases. We used previously estimated CSF values for the same species at this site (Madin et al. 2014).
RESULTS
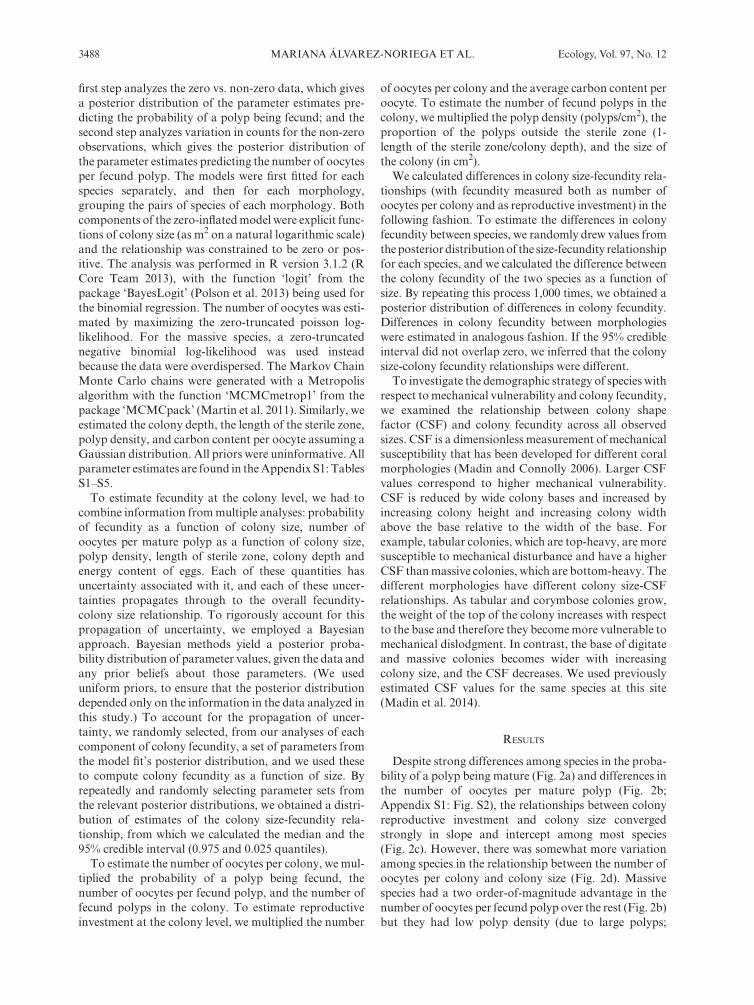
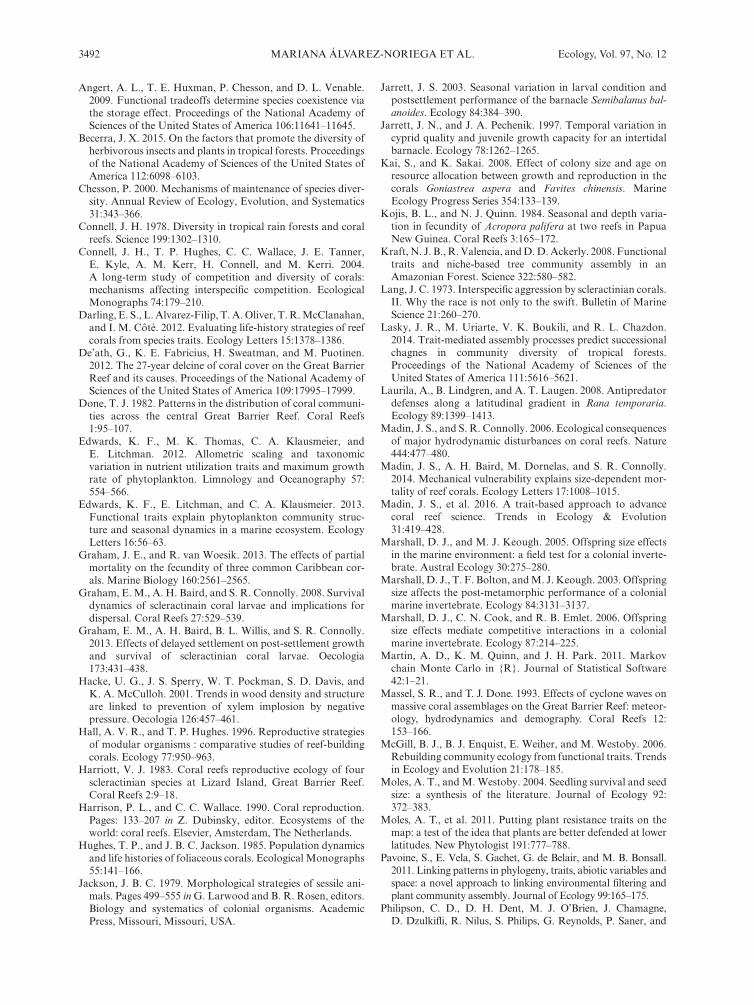
Despite strong differences among species in the proba-bility of a polyp being mature (Fig. 2a) and differences in the number of oocytes per mature polyp (Fig. 2b; Appendix S1: Fig. S2), the relationships between colony reproductive investment and colony size converged strongly in slope and intercept among most species (Fig. 2c). However, there was somewhat more variation among species in the relationship between the number of oocytes per colony and colony size (Fig. 2d). Massive species had a two order- of- magnitude advantage in the number of oocytes per fecund polyp over the rest (Fig. 2b) but they had low polyp density (due to large polyps;
FECUNDITY OF CORAL MORPHOLOGIESDecember 2016 3489
Appendix S1: Table S3), and the lowest carbon content per egg (Appendix S1: Table S4). The opposite was true for the tabular species. Species within morphology were not evidently more similar to each other than to species of different morphology in polyp maturity and number of oocytes per mature polyp, except for the digitate species, which had very similar polyp maturity probabil-ities (Appendix S1: Fig. S1).
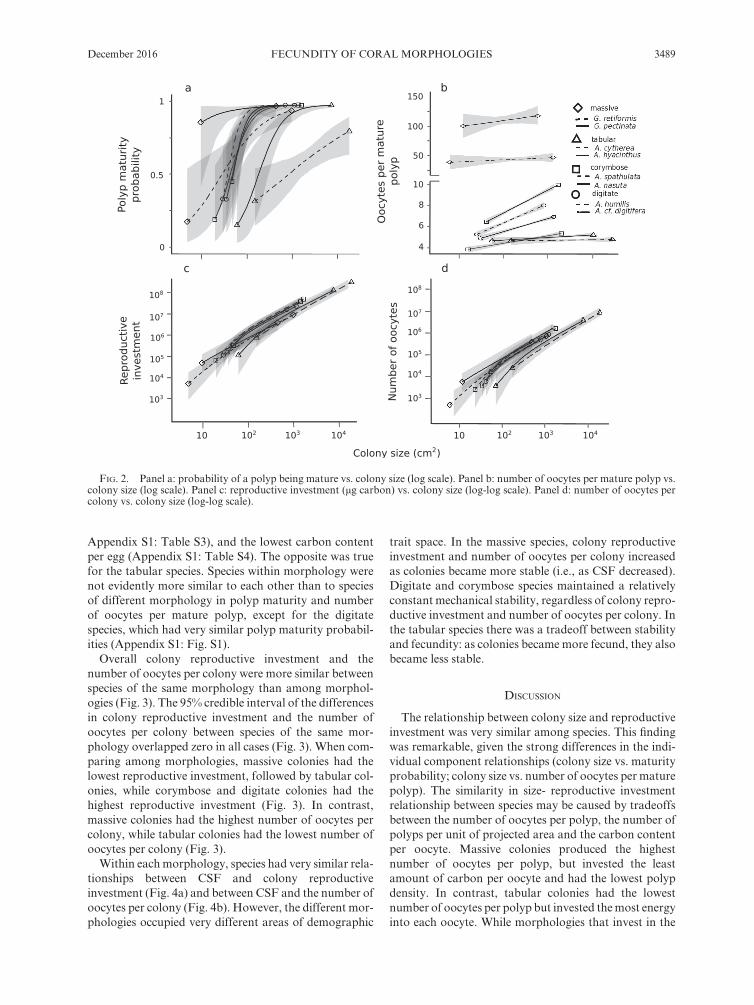
Overall colony reproductive investment and the number of oocytes per colony were more similar between species of the same morphology than among morphol-ogies (Fig. 3). The 95% credible interval of the differences in colony reproductive investment and the number of oocytes per colony between species of the same mor-phology overlapped zero in all cases (Fig. 3). When com-paring among morphologies, massive colonies had the lowest reproductive investment, followed by tabular col-onies, while corymbose and digitate colonies had the highest reproductive investment (Fig. 3). In contrast, massive colonies had the highest number of oocytes per colony, while tabular colonies had the lowest number of oocytes per colony (Fig. 3).
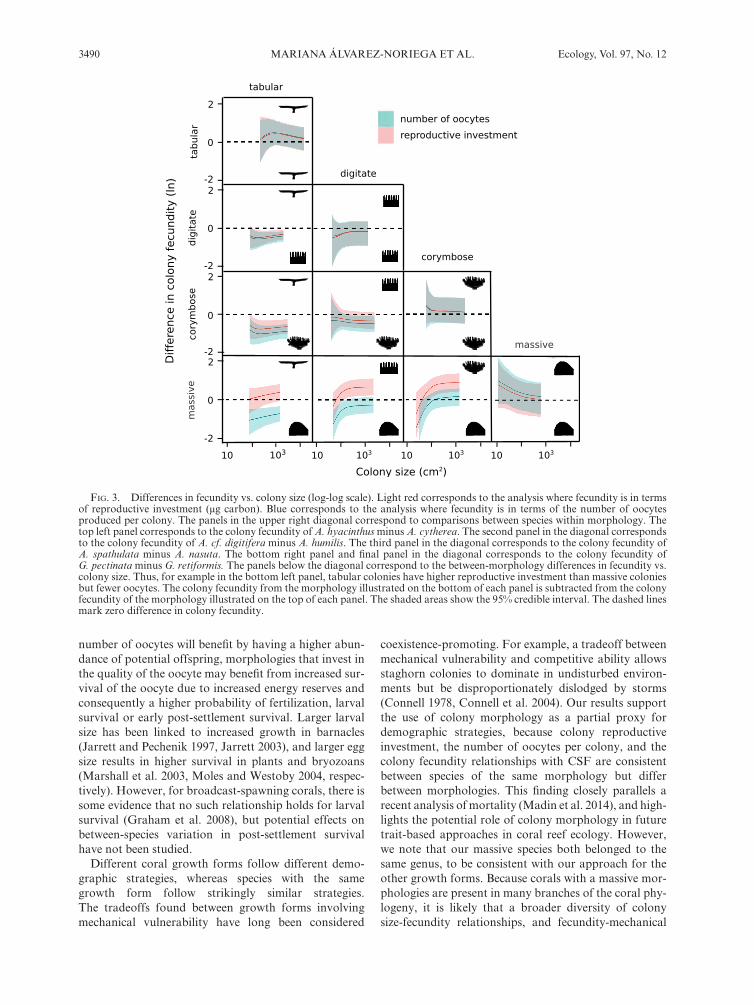
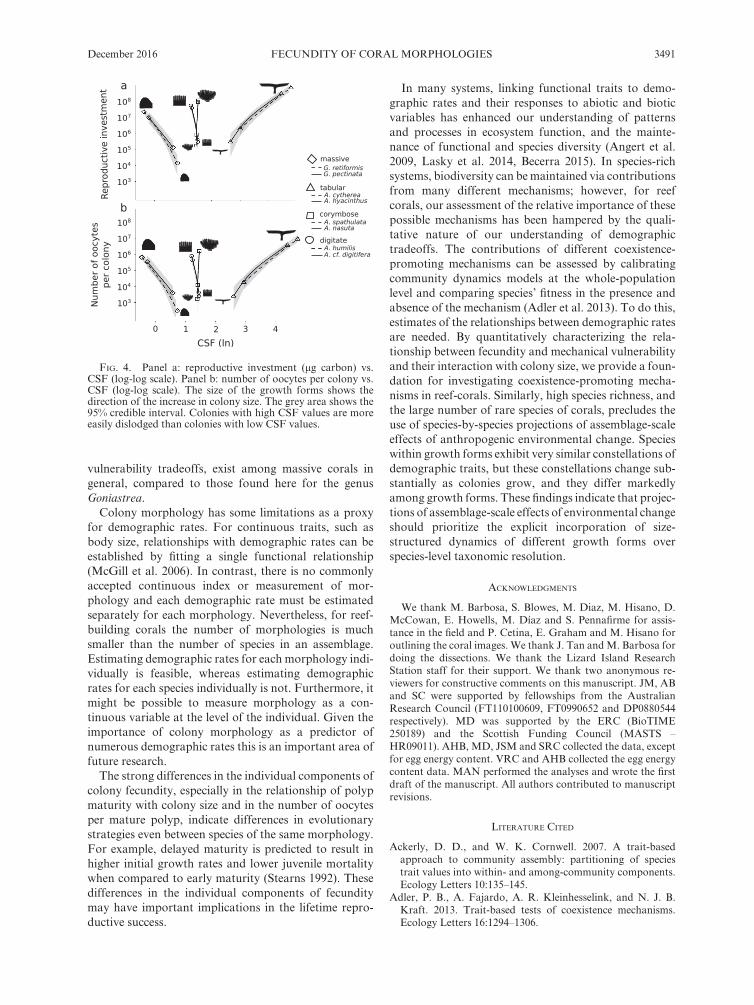
Within each morphology, species had very similar rela-tionships between CSF and colony reproductive investment (Fig. 4a) and between CSF and the number of oocytes per colony (Fig. 4b). However, the different mor-phologies occupied very different areas of demographic
trait space. In the massive species, colony reproductive investment and number of oocytes per colony increased as colonies became more stable (i.e., as CSF decreased). Digitate and corymbose species maintained a relatively constant mechanical stability, regardless of colony repro-ductive investment and number of oocytes per colony. In the tabular species there was a tradeoff between stability and fecundity: as colonies became more fecund, they also became less stable.
DISCUSSION
The relationship between colony size and reproductive investment was very similar among species. This finding was remarkable, given the strong differences in the indi-vidual component relationships (colony size vs. maturity probability; colony size vs. number of oocytes per mature polyp). The similarity in size- reproductive investment relationship between species may be caused by tradeoffs between the number of oocytes per polyp, the number of polyps per unit of projected area and the carbon content per oocyte. Massive colonies produced the highest number of oocytes per polyp, but invested the least amount of carbon per oocyte and had the lowest polyp density. In contrast, tabular colonies had the lowest number of oocytes per polyp but invested the most energy into each oocyte. While morphologies that invest in the
FIG. 2. Panel a: probability of a polyp being mature vs. colony size (log scale). Panel b: number of oocytes per mature polyp vs. colony size (log scale). Panel c: reproductive investment (μg carbon) vs. colony size (log- log scale). Panel d: number of oocytes per colony vs. colony size (log- log scale).
3490 Ecology, Vol. 97, No. 12MARIANA ÁLVAREZ- NORIEGA ET AL.
number of oocytes will benefit by having a higher abun-dance of potential offspring, morphologies that invest in the quality of the oocyte may benefit from increased sur-vival of the oocyte due to increased energy reserves and consequently a higher probability of fertilization, larval survival or early post- settlement survival. Larger larval size has been linked to increased growth in barnacles (Jarrett and Pechenik 1997, Jarrett 2003), and larger egg size results in higher survival in plants and bryozoans (Marshall et al. 2003, Moles and Westoby 2004, respec-tively). However, for broadcast- spawning corals, there is some evidence that no such relationship holds for larval survival (Graham et al. 2008), but potential effects on between- species variation in post- settlement survival have not been studied.
Different coral growth forms follow different demo-graphic strategies, whereas species with the same growth form follow strikingly similar strategies. The tradeoffs found between growth forms involving mechanical vulnerability have long been considered
coexistence- promoting. For example, a tradeoff between mechanical vulnerability and competitive ability allows staghorn colonies to dominate in undisturbed environ-ments but be disproportionately dislodged by storms (Connell 1978, Connell et al. 2004). Our results support the use of colony morphology as a partial proxy for demographic strategies, because colony reproductive investment, the number of oocytes per colony, and the colony fecundity relationships with CSF are consistent between species of the same morphology but differ between morphologies. This finding closely parallels a recent analysis of mortality (Madin et al. 2014), and high-lights the potential role of colony morphology in future trait- based approaches in coral reef ecology. However, we note that our massive species both belonged to the same genus, to be consistent with our approach for the other growth forms. Because corals with a massive mor-phologies are present in many branches of the coral phy-logeny, it is likely that a broader diversity of colony size- fecundity relationships, and fecundity- mechanical
FIG. 3. Differences in fecundity vs. colony size (log- log scale). Light red corresponds to the analysis where fecundity is in terms of reproductive investment (μg carbon). Blue corresponds to the analysis where fecundity is in terms of the number of oocytes produced per colony. The panels in the upper right diagonal correspond to comparisons between species within morphology. The top left panel corresponds to the colony fecundity of A. hyacinthus minus A. cytherea. The second panel in the diagonal corresponds to the colony fecundity of A. cf. digitifera minus A. humilis. The third panel in the diagonal corresponds to the colony fecundity of A. spathulata minus A. nasuta. The bottom right panel and final panel in the diagonal corresponds to the colony fecundity of G. pectinata minus G. retiformis. The panels below the diagonal correspond to the between- morphology differences in fecundity vs. colony size. Thus, for example in the bottom left panel, tabular colonies have higher reproductive investment than massive colonies but fewer oocytes. The colony fecundity from the morphology illustrated on the bottom of each panel is subtracted from the colony fecundity of the morphology illustrated on the top of each panel. The shaded areas show the 95% credible interval. The dashed lines mark zero difference in colony fecundity.
FECUNDITY OF CORAL MORPHOLOGIESDecember 2016 3491
vulnerability tradeoffs, exist among massive corals in general, compared to those found here for the genus Goniastrea.
Colony morphology has some limitations as a proxy for demographic rates. For continuous traits, such as body size, relationships with demographic rates can be established by fitting a single functional relationship (McGill et al. 2006). In contrast, there is no commonly accepted continuous index or measurement of mor-phology and each demographic rate must be estimated separately for each morphology. Nevertheless, for reef- building corals the number of morphologies is much smaller than the number of species in an assemblage. Estimating demographic rates for each morphology indi-vidually is feasible, whereas estimating demographic rates for each species individually is not. Furthermore, it might be possible to measure morphology as a con-tinuous variable at the level of the individual. Given the importance of colony morphology as a predictor of numerous demographic rates this is an important area of future research.
The strong differences in the individual components of colony fecundity, especially in the relationship of polyp maturity with colony size and in the number of oocytes per mature polyp, indicate differences in evolutionary strategies even between species of the same morphology. For example, delayed maturity is predicted to result in higher initial growth rates and lower juvenile mortality when compared to early maturity (Stearns 1992). These differences in the individual components of fecundity may have important implications in the lifetime repro-ductive success.
In many systems, linking functional traits to demo-graphic rates and their responses to abiotic and biotic variables has enhanced our understanding of patterns and processes in ecosystem function, and the mainte-nance of functional and species diversity (Angert et al. 2009, Lasky et al. 2014, Becerra 2015). In species- rich systems, biodiversity can be maintained via contributions from many different mechanisms; however, for reef corals, our assessment of the relative importance of these possible mechanisms has been hampered by the quali-tative nature of our understanding of demographic tradeoffs. The contributions of different coexistence- promoting mechanisms can be assessed by calibrating community dynamics models at the whole- population level and comparing species’ fitness in the presence and absence of the mechanism (Adler et al. 2013). To do this, estimates of the relationships between demographic rates are needed. By quantitatively characterizing the rela-tionship between fecundity and mechanical vulnerability and their interaction with colony size, we provide a foun-dation for investigating coexistence- promoting mecha-nisms in reef- corals. Similarly, high species richness, and the large number of rare species of corals, precludes the use of species- by- species projections of assemblage- scale effects of anthropogenic environmental change. Species within growth forms exhibit very similar constellations of demographic traits, but these constellations change sub-stantially as colonies grow, and they differ markedly among growth forms. These findings indicate that projec-tions of assemblage- scale effects of environmental change should prioritize the explicit incorporation of size- structured dynamics of different growth forms over species- level taxonomic resolution.
ACKNOWLEDGMENTS
We thank M. Barbosa, S. Blowes, M. Diaz, M. Hisano, D. McCowan, E. Howells, M. Díaz and S. Pennafirme for assis-tance in the field and P. Cetina, E. Graham and M. Hisano for outlining the coral images. We thank J. Tan and M. Barbosa for doing the dissections. We thank the Lizard Island Research Station staff for their support. We thank two anonymous re-viewers for constructive comments on this manuscript. JM, AB and SC were supported by fellowships from the Australian Research Council (FT110100609, FT0990652 and DP0880544 respectively). MD was supported by the ERC (BioTIME 250189) and the Scottish Funding Council (MASTS – HR09011). AHB, MD, JSM and SRC collected the data, except for egg energy content. VRC and AHB collected the egg energy content data. MAN performed the analyses and wrote the first draft of the manuscript. All authors contributed to manuscript revisions.
LITERATURE CITED
Ackerly, D. D., and W. K. Cornwell. 2007. A trait- based approach to community assembly: partitioning of species trait values into within- and among- community components. Ecology Letters 10:135–145.
Adler, P. B., A. Fajardo, A. R. Kleinhesselink, and N. J. B. Kraft. 2013. Trait- based tests of coexistence mechanisms. Ecology Letters 16:1294–1306.
FIG. 4. Panel a: reproductive investment (μg carbon) vs. CSF (log- log scale). Panel b: number of oocytes per colony vs. CSF (log- log scale). The size of the growth forms shows the direction of the increase in colony size. The grey area shows the 95% credible interval. Colonies with high CSF values are more easily dislodged than colonies with low CSF values.
3492 Ecology, Vol. 97, No. 12MARIANA ÁLVAREZ- NORIEGA ET AL.
Angert, A. L., T. E. Huxman, P. Chesson, and D. L. Venable. 2009. Functional tradeoffs determine species coexistence via the storage effect. Proceedings of the National Academy of Sciences of the United States of America 106:11641–11645.
Becerra, J. X. 2015. On the factors that promote the diversity of herbivorous insects and plants in tropical forests. Proceedings of the National Academy of Sciences of the United States of America 112:6098–6103.
Chesson, P. 2000. Mechanisms of maintenance of species diver-sity. Annual Review of Ecology, Evolution, and Systematics 31:343–366.
Connell, J. H. 1978. Diversity in tropical rain forests and coral reefs. Science 199:1302–1310.
Connell, J. H., T. P. Hughes, C. C. Wallace, J. E. Tanner, E. Kyle, A. M. Kerr, H. Connell, and M. Kerri. 2004. A long- term study of competition and diversity of corals: mechanisms affecting interspecific competition. Ecological Monographs 74:179–210.
Darling, E. S., L. Alvarez-Filip, T. A. Oliver, T. R. McClanahan, and I. M. Côté. 2012. Evaluating life- history strategies of reef corals from species traits. Ecology Letters 15:1378–1386.
De’ath, G., K. E. Fabricius, H. Sweatman, and M. Puotinen. 2012. The 27- year delcine of coral cover on the Great Barrier Reef and its causes. Proceedings of the National Academy of Sciences of the United States of America 109:17995–17999.
Done, T. J. 1982. Patterns in the distribution of coral communi-ties across the central Great Barrier Reef. Coral Reefs 1:95–107.
Edwards, K. F., M. K. Thomas, C. A. Klausmeier, and E. Litchman. 2012. Allometric scaling and taxonomic variation in nutrient utilization traits and maximum growth rate of phytoplankton. Limnology and Oceanography 57: 554–566.
Edwards, K. F., E. Litchman, and C. A. Klausmeier. 2013. Functional traits explain phytoplankton community struc-ture and seasonal dynamics in a marine ecosystem. Ecology Letters 16:56–63.
Graham, J. E., and R. van Woesik. 2013. The effects of partial mortality on the fecundity of three common Caribbean cor-als. Marine Biology 160:2561–2565.
Graham, E. M., A. H. Baird, and S. R. Connolly. 2008. Survival dynamics of scleractinain coral larvae and implications for dispersal. Coral Reefs 27:529–539.
Graham, E. M., A. H. Baird, B. L. Willis, and S. R. Connolly. 2013. Effects of delayed settlement on post- settlement growth and survival of scleractinian coral larvae. Oecologia 173:431–438.
Hacke, U. G., J. S. Sperry, W. T. Pockman, S. D. Davis, and K. A. McCulloh. 2001. Trends in wood density and structure are linked to prevention of xylem implosion by negative pressure. Oecologia 126:457–461.
Hall, A. V. R., and T. P. Hughes. 1996. Reproductive strategies of modular organisms : comparative studies of reef- building corals. Ecology 77:950–963.
Harriott, V. J. 1983. Coral reefs reproductive ecology of four scleractinian species at Lizard Island, Great Barrier Reef. Coral Reefs 2:9–18.
Harrison, P. L., and C. C. Wallace. 1990. Coral reproduction. Pages: 133–207 in Z. Dubinsky, editor. Ecosystems of the world: coral reefs. Elsevier, Amsterdam, The Netherlands.
Hughes, T. P., and J. B. C. Jackson. 1985. Population dynamics and life histories of foliaceous corals. Ecological Monographs 55:141–166.
Jackson, J. B. C. 1979. Morphological strategies of sessile ani-mals. Pages 499–555 in G. Larwood and B. R. Rosen, editors. Biology and systematics of colonial organisms. Academic Press, Missouri, Missouri, USA.
Jarrett, J. S. 2003. Seasonal variation in larval condition and postsettlement performance of the barnacle Semibalanus bal-anoides. Ecology 84:384–390.
Jarrett, J. N., and J. A. Pechenik. 1997. Temporal variation in cyprid quality and juvenile growth capacity for an intertidal barnacle. Ecology 78:1262–1265.
Kai, S., and K. Sakai. 2008. Effect of colony size and age on resource allocation between growth and reproduction in the corals Goniastrea aspera and Favites chinensis. Marine Ecology Progress Series 354:133–139.
Kojis, B. L., and N. J. Quinn. 1984. Seasonal and depth varia-tion in fecundity of Acropora palifera at two reefs in Papua New Guinea. Coral Reefs 3:165–172.
Kraft, N. J. B., R. Valencia, and D. D. Ackerly. 2008. Functional traits and niche- based tree community assembly in an Amazonian Forest. Science 322:580–582.
Lang, J. C. 1973. Interspecific aggression by scleractinian corals. II. Why the race is not only to the swift. Bulletin of Marine Science 21:260–270.
Lasky, J. R., M. Uriarte, V. K. Boukili, and R. L. Chazdon. 2014. Trait- mediated assembly processes predict successional chagnes in community diversity of tropical forests. Proceedings of the National Academy of Sciences of the United States of America 111:5616–5621.
Laurila, A., B. Lindgren, and A. T. Laugen. 2008. Antipredator defenses along a latitudinal gradient in Rana temporaria. Ecology 89:1399–1413.
Madin, J. S., and S. R. Connolly. 2006. Ecological consequences of major hydrodynamic disturbances on coral reefs. Nature 444:477–480.
Madin, J. S., A. H. Baird, M. Dornelas, and S. R. Connolly. 2014. Mechanical vulnerability explains size- dependent mor-tality of reef corals. Ecology Letters 17:1008–1015.
Madin, J. S., et al. 2016. A trait- based approach to advance coral reef science. Trends in Ecology & Evolution 31:419–428.
Marshall, D. J., and M. J. Keough. 2005. Offspring size effects in the marine environment: a field test for a colonial inverte-brate. Austral Ecology 30:275–280.
Marshall, D. J., T. F. Bolton, and M. J. Keough. 2003. Offspring size affects the post- metamorphic performance of a colonial marine invertebrate. Ecology 84:3131–3137.
Marshall, D. J., C. N. Cook, and R. B. Emlet. 2006. Offspring size effects mediate competitive interactions in a colonial marine invertebrate. Ecology 87:214–225.
Martin, A. D., K. M. Quinn, and J. H. Park. 2011. Markov chain Monte Carlo in {R}. Journal of Statistical Software 42:1–21.
Massel, S. R., and T. J. Done. 1993. Effects of cyclone waves on massive coral assemblages on the Great Barrier Reef: meteor-ology, hydrodynamics and demography. Coral Reefs 12: 153–166.
McGill, B. J., B. J. Enquist, E. Weiher, and M. Westoby. 2006. Rebuilding community ecology from functional traits. Trends in Ecology and Evolution 21:178–185.
Moles, A. T., and M. Westoby. 2004. Seedling survival and seed size: a synthesis of the literature. Journal of Ecology 92: 372–383.
Moles, A. T., et al. 2011. Putting plant resistance traits on the map: a test of the idea that plants are better defended at lower latitudes. New Phytologist 191:777–788.
Pavoine, S., E. Vela, S. Gachet, G. de Belair, and M. B. Bonsall. 2011. Linking patterns in phylogeny, traits, abiotic variables and space: a novel approach to linking environmental filtering and plant community assembly. Journal of Ecology 99:165–175.
Philipson, C. D., D. H. Dent, M. J. O’Brien, J. Chamagne, D. Dzulkifli, R. Nilus, S. Philips, G. Reynolds, P. Saner, and
FECUNDITY OF CORAL MORPHOLOGIESDecember 2016 3493
A. Hector. 2014. A trait- based tradeoff between growth and mortality: evidence from 15 tropical tree species using size- specific relative growth rates. Ecology and Evolution 4: 3675–3688.
Pianka, E. R. 1971. On r- and K- selection. American Naturalist 104:592–597.
Polson, N. G., J. G. Scott, and J. Windle. 2013. Bayesian infer-ence for logistic models using Polya-Gamma latent variables. http://arxiv.org/abs/1205.0310
Poorter, L., et al. 2008. Are functional traits good predictors of demographic rates? Evidence from five neotropical forests. Ecology 89:1908–1920.
Porter, J. W. 1974. Community structure of coral reefs on oppo-site sides of the Isthmus of Panama. Science 186:543–545.
Pratchett, M. S., K. Anderson, M. O. Hoogenboom, E. Widman, A. H. Baird, J. Pandolfi, P. J. Edmunds, and J. M. Lough. 2015. Spatial, temporal and taxonomic varia-tion in coral growth: implications for the structure and func-tion of coral reef ecosystems. Oceanography and Marine Biology: An Annual Review 53:215–295.
R Core Team. 2013. R: A language and environment for statis-tical computing. R Foundation for Statistical Computing, Vienna, Austria.
Reznick, D., L. Nunney, and A. Tessier. 2000. Big houses, big cars, superfleas and the costs of reproduction. Trends in Ecology and Evolution. 15:421–425.
Sakai, K. 1998. Effect of colony size, polyp size, and budding mode on egg production in a colonial coral. Biological Bulletin 195:319–325.
Saverimuttu, T., and M. Westoby. 1996. Seedling longevity under deep shade in relation to seed size. Journal of Ecology 84:681–689.
Schluter, D., T. D. Price, and L. Rowe. 1991. Conflicting selec-tion pressures and life history tradeoffs. Proceedings: Biological Sciences 246:11–17.
Stearns, C. S. 1992. The evolution of life histories. Oxford University Press, London, UK.
Sterck, F., L. Markesteijn, F. Schieving, and L. Poorter. 2011. Functional traits determine tradeoffs and niches in a tropical forest community. Proceedings of the National Academy of Sciences 108:20627–20632.
Teuschl, Y., C. Reim, and W. U. Blanckenhorn. 2007. Cor-related responses to artificial body size selection in growth, development, phenotypic plasticity and juvenile viability in yellow dung flies. Journal of Evolutionary Biology 20: 87–103.
Tilman, D., and S. Pacala. 1993. The maintenance of species richness in plant communities. Pages 113–125 in R. E. Ricklefs and D. Schluter, editors. Species diversity in ecolog-ical communities. University of Chicago Press, Chicago, Illinois, USA.
Veron, J. E. N. 2000. Corals of the world. Australian Institute of Marine Science, Townsville, Queensland, Australia.
Wallace, C. C. 1985. Reproduction, recruitment and fragmenta-tion nine sympatric species of the coral genus Acropora. Marine Biology 233:217–233.
Wright, S. J., et al. 2010. Functional traits and the growth- mortality tradeoff in tropical trees. Ecology 91:3664–3674.
SUPPORTING INFORMATION
Additional supporting information may be found in the online version of this article at http://onlinelibrary.wiley.com/doi/10.1002/ecy.1588/suppinfo