Embed Size (px)
Citation preview
ANALYSIS OF GERRARD RAINBOW TROUT SIZE, AGE, FECUNDITY AND GROWTH DATA
by
H. Andrusak and G. Andrusak
REDFISH CONSULTING LIMITED Nelson, British Columbia
May 2006

SUMMARY In late 2003 and most of 2004, biological data was collected from the Kootenay Lake rainbow trout sport fishery. The vast majority of data is from the Gerrard rainbow trout population. Scale samples were obtained from harvested trout with catch location, date, length, weight and sex recorded. Most scale samples were read to determine age, mean lengths at age, length-at-maturity, and growth. Ages of these trout ranged from ages 2+-8+ with spawners ≥ 5 years old. A large sample from the 1966 sport fishery was also aged, analyzed, and comparisons made with the 2004 data. Additional data from captured spawners at Gerrard over the 1980s and 1990s and some limited data from the 1980s sport fishery were also analyzed. Growth of fish ≥ 50 cm in 2004 appears to be higher than either 1966 or 1980s fish. There is some evidence that rainbow trout caught in 2004 have a higher condition factor (K) than previous years. It is speculated that lake fertilization is the primary reason for improved growth. Nineteen fecundity samples were also obtained. Mean eggs per female was 8,048, very similar to the estimate made in 1978 by Irvine (1978). Based on the 19 samples, a fecundity/length regression formula was generated that is remarkably similar to that developed by Acara (1969 unpublished.). It is recommended that more fecundity samples be obtained to improve on the accuracy of the regression formula. A year-long creel census on Kootenay Lake is overdue and is a primary recommendation of this report. Updated harvest estimates and statistical analysis of this fishery is required to ensure over fishing does not occur. Biological data collected during this study and that obtained from a creel census would be invaluable for management of this provincially important rainbow trout population.
REDFISH CONSULTING LIMITED Page i
ACKNOWLEDGEMENTS
Funding for this project was made available through the British Columbia Conservation Foundation and the Habitat Conservation Trust Fund. Funding was vital for data collection and analysis in understanding and conserving this exceptionally important wild trout population. Many thanks to former BC Fisheries personnel who were integral in data collection on Kootenay Lake since 1966. Les Fleck is also thanked for analysis of scale ages and an important historic perspective of Kootenay Lake fisheries. Special thanks to the resorts of Schroeder Creek, Woodbury, and Kaslo Marina for additional data collection in 2004. Marla Zarelli is thanked for her assistance in report preparation.
DNUNOTON ERV ISC
TTH IB
RUSTT
This project has been largely funded by the Habitat Conservation Trust Fund. The Habitat Conservation Trust Fund was created by an act of the legislature to preserve, restore and enhance key areas of habitat for fish and wildlife throughout British Columbia. Anglers, hunters, trappers and guides contribute to the projects of the Trust Fund through licence surcharges. Tax deductible donations to assist in the work of the Trust Fund are also welcomed.
REDFISH CONSULTING LIMITED Page ii
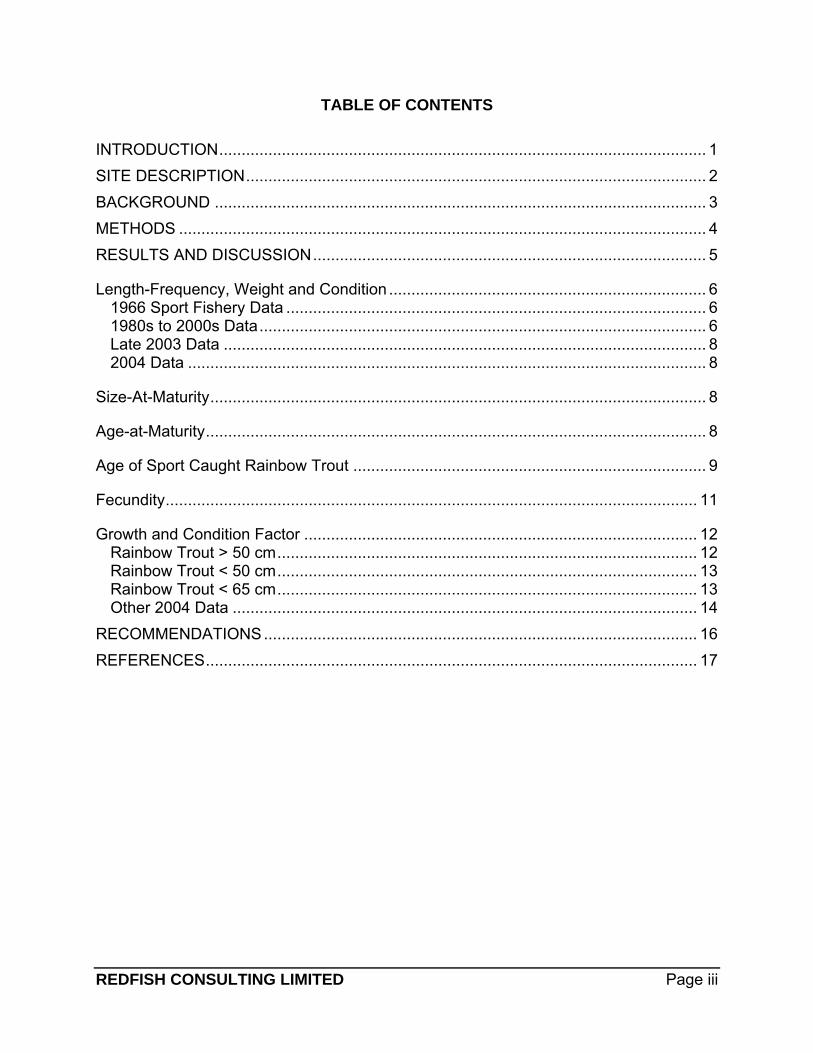
TABLE OF CONTENTS
INTRODUCTION............................................................................................................. 1 SITE DESCRIPTION....................................................................................................... 2 BACKGROUND .............................................................................................................. 3 METHODS ...................................................................................................................... 4 RESULTS AND DISCUSSION........................................................................................ 5
Length-Frequency, Weight and Condition ....................................................................... 6 1966 Sport Fishery Data .............................................................................................. 6 1980s to 2000s Data.................................................................................................... 6 Late 2003 Data ............................................................................................................ 8 2004 Data .................................................................................................................... 8
Size-At-Maturity............................................................................................................... 8
Age-at-Maturity................................................................................................................ 8
Age of Sport Caught Rainbow Trout ............................................................................... 9
Fecundity....................................................................................................................... 11
Growth and Condition Factor ........................................................................................ 12 Rainbow Trout > 50 cm.............................................................................................. 12 Rainbow Trout < 50 cm.............................................................................................. 13 Rainbow Trout < 65 cm.............................................................................................. 13 Other 2004 Data ........................................................................................................ 14
RECOMMENDATIONS................................................................................................. 16 REFERENCES.............................................................................................................. 17
REDFISH CONSULTING LIMITED Page iii
LIST OF TABLES Table 1. Kootenay Lake Gerrard rainbow trout length-weights in
categories of < 50 cm and > 50 cm and same sizes for the three periods of lake productivity.................................................................. 7
Table 2. Age, length-weight data, standard deviations and condition factor of Gerrard rainbow trout for the study years. .................................... 10
Table 3. Miscellaneous data from fish aged 5-8+ from 2004 sport fishery. .............. 15
LIST OF FIGURES Figure 1. Percent (%) length-frequency occurrence of rainbow trout caught in
Kootenay Lake during the winter, spring, summer, and fall months of 1966. ...................................................................................................... 19
Figure 2. Percent length-frequency of Gerrard rainbow trout spawners captured at Gerrard, BC for select years 1949-1959 and 1979-2000....................... 20
Figure 3. Mean size of male and female spawners captured at Gerrard, BC during hatchery brood stock collections...................................................... 20
Figure 4. Age-at-spawning for females captured at Gerrard, BC 1949-1959............. 21 Figure 5. Age-at-spawning for females captured at Gerrard, BC 1979-2000............. 21 Figure 6. Length-at-age and mean lengths of each age of rainbow trout
captured in Kootenay Lake, 1966. .............................................................. 22 Figure 7. Length-at-age and mean lengths of each age of rainbow trout
captured in Kootenay Lake, 2004. .............................................................. 22 Figure 8. Mean lengths-at-age for sport caught rainbow trout in Kootenay
Lake, 1966, 1973, and 2004....................................................................... 23 Figure 9. Scatter plot of Gerrard rainbow trout female egg numbers vs.
length transformed to a power formula. ...................................................... 24 Figure 10. Log 10 plot relationship of Gerrard rainbow trout female egg
numbers vs. length. .................................................................................... 24 Figure 11. Untransformed length-weight relationships for fish > 50 cm
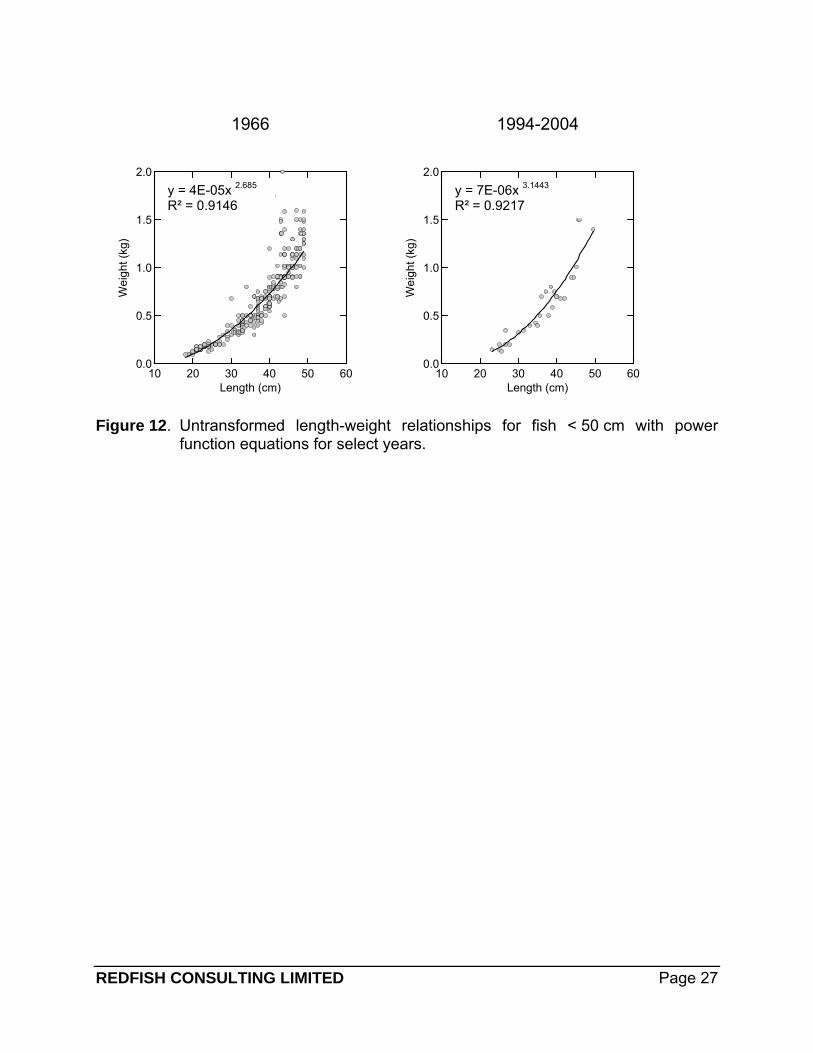
with power function equations for select years. .......................................... 26 Figure 12. Untransformed length-weight relationships for fish < 50 cm
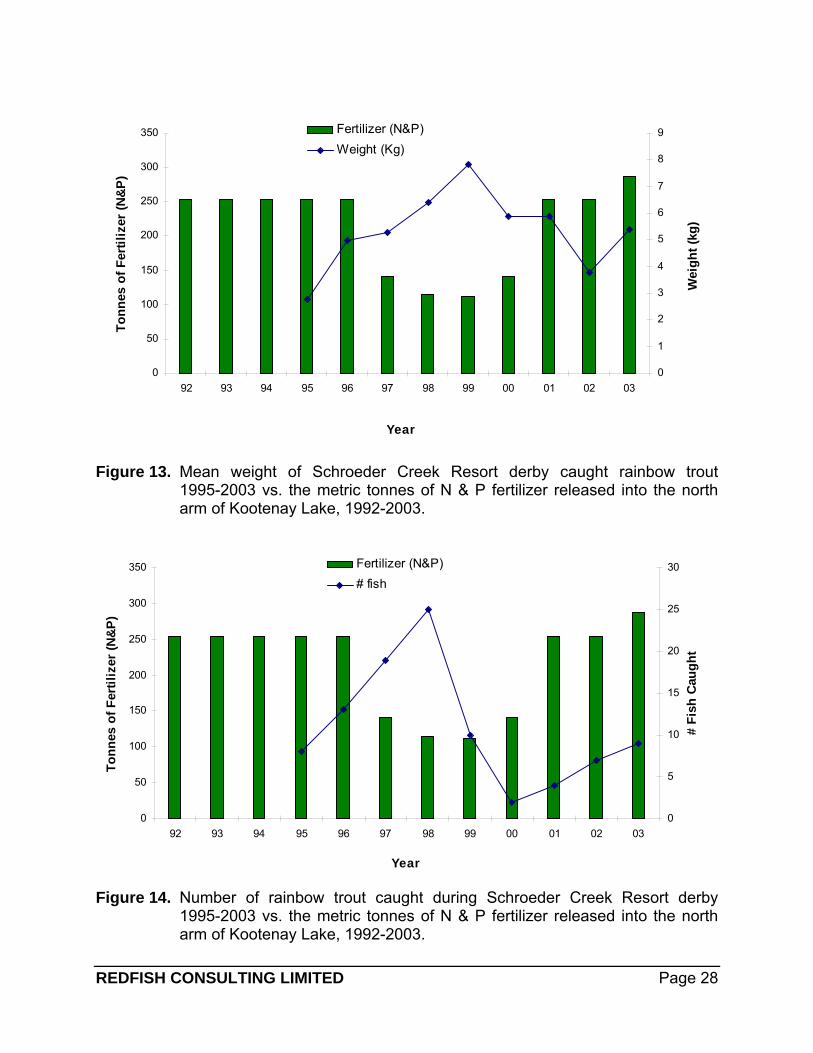
with power function equations for select years. .......................................... 27 Figure 13. Mean weight of Schroeder Creek Resort derby caught rainbow
trout 1995-2003 vs. the metric tonnes of N & P fertilizer released into the north arm of Kootenay Lake, 1992-2003. ...................................... 28
Figure 14. Number of rainbow trout caught during Schroeder Creek Resort derby 1995-2003 vs. the metric tonnes of N & P fertilzer released into the north arm of Kootenay Lake, 1992-2003. ...................................... 28
LIST OF APPENDIXES
Appendix 1. ................................................................................................................... 29
REDFISH CONSULTING LIMITED Page iv
ANALYSIS OF GERRARD RAINBOW TROUT SIZE, AGE, FECUNDITY AND GROWTH DATA
by
H. Andrusak1 and G. Andrusak1
INTRODUCTION The recreational sport fishery on Kootenay Lake, British Columbia, has long been one of North America's pre-eminent large lake fisheries. The lake and its supporting fisheries provide a significant benefit to the local eco/tourism economy and has been an integral part of the Kootenay region for residents of British Columbia, other residents of Canada and the United States for many decades. Predominantly, fishing effort is directed at kokanee (Oncorhynchus nerka), bull trout (Salvelinus confluentus), a littoral population of rainbow trout that feeds almost exclusively on invertebrates and is typically < 50 cm (Oncorhynchus mykiss), and, particularly, a population of pelagic piscivorous Gerrard rainbow trout (Oncorhynchus mykiss) that are considered the world’s largest, frequently obtaining sizes of 10-13 kg (Cartwright 1961; Ashley et al. 1999; Redfish Consulting Ltd. 2003. Not surprisingly, the lake has been the focus of several scientific studies for managing the various fisheries. Over the last half century substantial ecological alterations have taken place in Kootenay Lake and its tributaries. In particular, nutrient retention in upstream reservoirs formed by hydro electric dams on Kootenay Lake tributaries resulted in an ultra-oligotrophic condition (Daley et al. 1981; Ashley et al. 1997). The productivity decline in turn caused a near collapse of the kokanee population. The significant decline in kokanee abundance in the late 1980s, (Ashley et al. 1997), prompted alarm amongst fisheries managers and the public especially as it may impact the Gerrard rainbow trout and bull trout populations. Initiation of the Kootenay Lake fertilization project in 1992 (Ashley et al. 1997) was an attempt to restore the primary nutrient balance within the lake that had been changed as a result of closure of a fertilizer plant on a Kootenay River tributary and the two upstream reservoirs (Larkin 1998; Ashley et al. in: Murphy and Munawar 1999). The decline in lake productivity and possibly increased competition for food between mysids and kokanee led to a reduction in main lake kokanee size and numbers in the early 1990s (Ashley et al. 1997). After 12 years of intense monitoring it is quite apparent that fertilization is providing benefits to some of the higher trophic levels within Kootenay Lake. Most important, kokanee densities have rebounded to near historic levels (Andrusak 2004). Collection and analysis of biological data from the Gerrard rainbow trout fishery can be a valuable tool for fisheries managers in assessment of this trout population. Historically, collection of biological data by means of an annual creel census had been an integral part of monitoring this population (Andrusak 1987). Creel census surveys were conducted annually from the early 1960s to 1986 while a less intensive one 1 Redfish Consulting Ltd. 5244 HWY 3A Nelson BC V8L 6N6
REDFISH CONSULTING LTD. Page 1
continued through to 1989 when it was cancelled altogether. In 1987, the Fisheries Branch instituted the Kootenay Lake Rainbow Trout (KLRT) special license in attempt to obtain more sport fishery information and to assess the Gerrard rainbow trout population on Kootenay Lake (Redfish Consulting Ltd. 2003). It was imposed after Andrusak and Brown (1987) identified that the exploitation rate for these large trout could be as high as 80%. Presently however, no creel census is conducted and no appreciable amount of biological data has been collected from the fishery in over two decades. This report focuses on summary and analysis of biological data on Gerrard rainbow trout collected periodically from 1966 to the present. Surprisingly, this report represents the only written assessment on biological traits of this population since Cartwright (1961) and Irvine (1978). Data obtained in 2003 and 2004 provides a much needed update on age, length-at-age, age-at-maturity, growth, and fecundity. Sufficient data is also available to provide some initial insight into influences of major changes in lake productivity that has occurred over the last four decades. Arrow Lakes Reservoir has seen a significant increase in condition in both rainbow and bull trout populations because of increased kokanee densities due to upper Arrow Reservoir fertilization (Arndt 2004). This same response would be expected to occur with the top predators in Kootenay Lake. The biological data and age data for Gerrards also sets the stage for future modeling required for population estimation. The goal of this project is to provide a summary of biological data on Gerrard rainbow trout so that fisheries managers can ensure sustainability of this trout population and the recreational fishery. This goal has been achieved through: 1. Obtaining basic biological data such as length, weight, and good scale samples for
age determination and growth rates from a large sample of sport caught Gerrard rainbow trout.
2. Determining Gerrard rainbow trout fecundity from whole female gonads of near mature trout that have harvested in the fishery during the late fall and winter months.
3. Reviewing file data and summarizing relevant data to compare with 2003-2004 fishery data.
SITE DESCRIPTION Kootenay Lake, located in the upper Columbia River drainage of Southeast British Columbia, lies between the Selkirk and Purcell Mountain ranges. The main lake is 107 km long, approximately 4 km wide with a mean depth of 94 m and a maximum of 154 m (Daley et al. 1981). The lake is fed by two major river systems: the Lardeau/Duncan system at the north end and the Kootenay River that flows into the south end. The outlet of the main lake, at Balfour, British Columbia, forms the upper end of the West Arm. At this outlet, a sill lies at a depth of approximately 8 m producing a distinct boundary between the main lake and the West Arm. The West Arm is about 40 km long with a mean depth of only 13 m. It is physically and limnologically different from the main lake, comprised of a series of shallow basins interconnected by narrow
REDFISH CONSULTING LTD. Page 2
riverine sections. The West Arm of Kootenay Lake flows in a westerly direction becoming the lower Kootenay River, which flows into the Columbia River at Castlegar, BC. The entire West Arm has an annual mean retention time of about 5-6 days (Martin and Northcote 1991). The main basin of the lake has a retention time of 1.8 years (Daley et al. 1981). BACKGROUND Kootenay Lake is renowned for its exceptional fishing, particularly for the Gerrard rainbow trout and bull trout. It is the remarkable size of both the Gerrard rainbow trout and bull trout that make this fishery very popular. The trophy size of the Gerrard rainbow trout is directly attributed to their highly piscivorous behavior (Andrusak and Parkinson 1984) and reliance on kokanee as their primary food source. The fishery for Gerrard rainbow trout occurs throughout the year but the most productive and heavily fished months are November and May when these trout are especially vulnerable (Andrusak 1987). Comparatively, there is very little effort directed towards these trout during the summer months when they are in the deep, cooler water. A considerable amount of research has been dedicated to understanding the biology of the Gerrard rainbow trout, including a description of their general life history by Cartwright (1961), spawning behavior by Hartman (1969) and juvenile rearing requirements in the Lardeau River by Irvine (1978) and Slaney and Andrusak (2003). This unique trout population is entirely dependent upon the Lardeau River, the only remaining system within the basin where they are known to spawn and rear. Total numbers of spawners have been estimated at 800-1,200 annually (Irvine 1978; Hagen and Baxter 2002, draft report). Kootenay Lake has been the focus of intensive studies in the past decades. Early work by Larkin (1951) considered some of the basic limnology features; Northcote (1973) detailed the impacts on fish of early placer mining, intense logging practices, agricultural dyking and irrigation. Daley et al. (1981) summarized the decline in lake productivity due to upstream dams located on the major tributaries to Kootenay Lake. More recently, the limnology of Kootenay Lake and particularly the status of North Arm kokanee have been well documented as a result of a series of research initiatives designed to increase kokanee numbers (see Ashley et al. 1997; Ashley et al. in: Murphy and Munawar 1999; Ashley et al. 1999; Thompson 1999; Andrusak et al. 2004). In response to the dramatic decline in kokanee numbers in the 1980s, which the Gerrard rainbow trout are dependent upon for forage, fisheries managers undertook an ambitious experiment to fertilize a small portion of the North Arm of Kootenay Lake commencing in 1992. The primary objective of the fertilization experiment was to restore depressed nutrient levels in the lake resulting from the impoundment of nutrients in upstream reservoirs formed by the Duncan (1967) and Libby (1972) Dams and the operation of an upstream fertilizer plant between 1953 and 1973 (Larkin 1998; Ashley et al. 1999). By 1996, the North Arm kokanee population had recovered to near historical numbers (Ashley et al. 1997) and Meadow Creek escapements (the biggest spawning
REDFISH CONSULTING LTD. Page 3
population in the system) is once again supporting >1 million spawners (Andrusak et al. 2004). The Gerrard rainbow trout fishery from the early 1960s until the late 1980s was monitored by a whole lake creel census. Budget cuts in the late 1980s forced fisheries managers to eliminate the census program. Today the Gerrard rainbow trout fishery is monitored only through annual escapement counts at Gerrard, BC and the angler KLRT questionnaire survey. This mail-out survey provides trend data on the fishery with the most recent summary report completed by Redfish Consulting Ltd. (2003). The lack of a method of monitoring the status of this provincially important rainbow trout stock in Kootenay Lake is troubling given the value and importance of this unique race of trout. The intensity of the fishery is a concern since it is believed this stock has been over-fished in the past (Redfish Consulting Ltd. 2002). Collection of data (age, size-at-age and fecundity) from the sport fishery on the biology of these fish is considered vital in assessing the state of this stock and managing it sustainably. METHODS File data from Ministry of Environment (MOE) was reviewed and scale samples from creel census conducted during the 1960s to 1980s analyzed for age. These scale samples were linked to data on date of catch, locality, sex, length, and weight. This data was entered onto Excel spreadsheets by year. In most years there were < 50 samples but 1966 was a major exception with just under 700 samples available. For this particular year 100 ages were determined from selected size groups in 10 cm increments, i.e., 20 samples for sizes 30-40 cm; 20 samples for 41-50 cm; 20 (51-60); (61-70) 20 > 71 cm. All scales were cleaned and then mounted on 75 mm x 25 mm x 1 mm plastic microscope slides and viewed by a microfiche for age determination. Les Fleck, an experienced fisheries technician of 35 years, analyzed the scales to determine the number of annuli and noting possible spawn checks. He also did most of the ageing of Gerrard spawners and sport fish samples from 1970-2000. In about 10% of all samples there was uncertainty as to the correct age (e.g., age 4 vs. 5) in which case these were not included for data analysis. All data (date, locality sex, length, weight, comments) were entered into Excel spreadsheets for future use. Ages shown in this report are based on determination of the number of annuli. Since most of the sport fish data was collected from June to December there would be some summer growth, therefore, for example an age 6 fish is actually age 6+ etc. However, spawner data (April to May) is shown as age 6 with no summer growth, i.e., age 6. Data from 2003 and 2004 was primarily collected from local fisherman throughout the year with most obtained during the spring and fall months. Samples of scales, record of date, species, locality, sex, length, and weight were recorded using specially designed fish scale envelopes. The majority of large fish were sampled from fish derbies located at Woodbury Creek, Balfour Beach Inn, and Beachcombers in Kaslo, BC in an attempt
REDFISH CONSULTING LTD. Page 4
to obtain fecundity samples. For this reason this data cannot be considered as collected at random since derby-anglers were targeting larger fish. A high degree of catch and release of large and small trout was observed during data collection. Fecundity samples were also collected in late 2003 and fall, 2004. Harvested mature females were sampled with all eggs in skeins removed from the fish, labeled and frozen for later enumeration. Samples were then taken to a laboratory, thawed and boiled until hardened for ease of counting. All eggs were counted, i.e., no sub sampling. Preliminary analysis of the data was done using Excel. Calculations of general descriptive statistics were used for length, weight and condition factor for each year. Fulton’s condition factor (K = W/L3 x 100,000) was also calculated. Length-weight and length-egg relationships were plotted using regression functions within Excel. Untransformed length-weight relationships were fitted with a non-linear power function from the equation W=a (Lb). Untransformed length-egg relationships were also fitted using a non-linear power function from the equation F=a (Lb). However, the power function parameters are more difficult to interpret among populations due to the curvilinear relationship (Pope and Kruse 2001). Therefore, a log transformation of length-weight [log10 (W) = a +b*log10 (L)] and the fecundity data [log10 (F) = a +b*log10 (L)] was made (using SYSTAT 11.0). Length-weight data analysis was done using the REGRESS and ANCOVA analysis from SYSTAT 11.0 to measure if there were significant differences in these relationships in Kootenay Lake rainbow trout during three different periods of lake productivity. Analysis included fish sizes < 50 cm, > 50 cm, and > 65 cm for when the lake was considered highly productive (1966), unproductive [declining in nutrients] (1981-1992), and increasing in nutrients (1994-2004). Tom Johnston at MOE Ecosystems Branch at UBC, Vancouver, BC provided assistance with the analysis of fish > 65 cm. RESULTS and DISCUSSION An underlying assumption with all the data analysis presented below is that all records of lengths and weights are accurate measurements consistently recorded over time. A second assumption is that most rainbow trout > 50 cm are Gerrard rainbow trout and trout < 50 cm are the near-shore invertebrate feeding population. For this reason most data is analyzed by grouping fish < 50 cm and > 50 cm and treating them as separate populations. Analysis of growth and condition factor (K) included a number of statistical tests of the power length-weight function to understand if growth has changed since lake fertilization. Most of this data is not shown in this report but can be found in Appendix 1 or the Excel file. The purpose of this report was to consolidate and enter electronically as much of the data on Gerrard rainbow trout from the sport fishery and spawning ground information. The following data analysis is intended to highlight some of the important biological
REDFISH CONSULTING LTD. Page 5
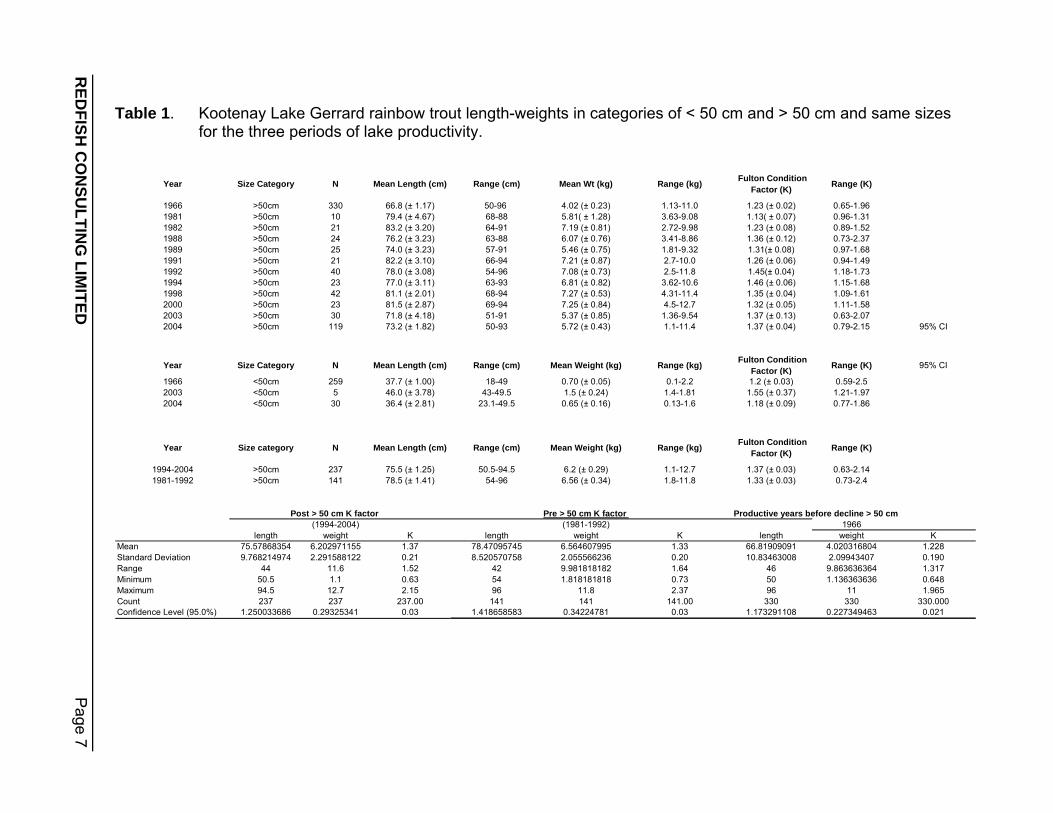
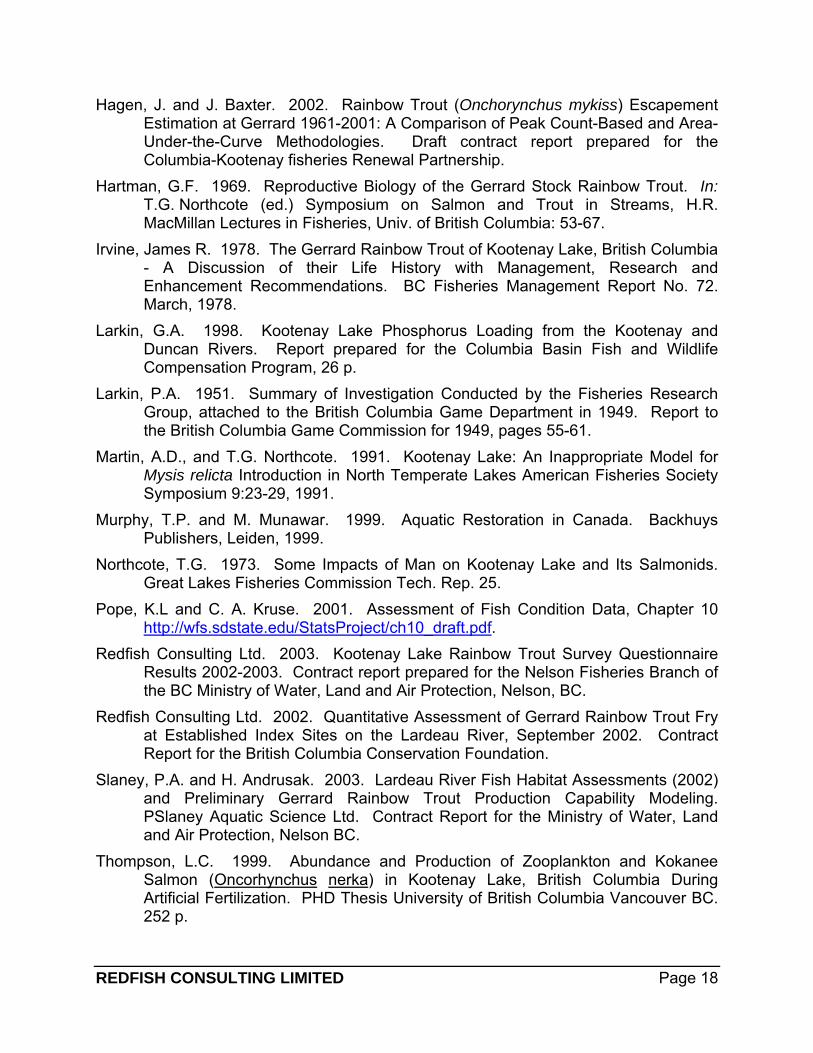
characteristics of the Gerrard population but it is not intended to be a complete analysis of all historical data, i.e., some additional data may exist on hard copy files. Length-Frequency, Weight and Condition 1966 Sport Fishery Data The largest sample of sport caught rainbow trout was found in the 1966 data set (N=685). Samples were available for every month of the year from the main lake fishery (excludes West Arm) including small fish (< 50 cm), therefore, at least some of the fish were probably not Gerrard rainbow trout. Regardless, the data does illustrate a few characteristics of the fishery and the rainbow trout population(s). The data was sorted into the four seasons of the year (Fig. 1) by 5 cm increments (e.g., 31-35 cm; 36-40 cm etc.). Size of fish caught ranged from 20-100 cm. Since there is considerable size overlap between ages (see age data below) distinct modes are not readily apparent from the seasonal histograms but some attributes are distinguishable. Firstly, recruitment of younger fish, some of which are most likely Gerrards, occurs from July to September, particularly September. Secondly, larger fish (60-75 cm) during winter (January to April) grow well during the following growing season and appear to contribute to the fall fishery at > 80 cm (Fig. 1). Also, smaller fish represent most of the summer catch while the larger fish (> 50 cm) are caught during the spring, fall, and winter months. Full recruitment to the fishery appears to be at approximately 35 cm. By size category, fish > 50 cm (n=330) had a mean length of 66.8 cm, mean weight was 4.02 kg, and mean condition factor (K) was 1.23 (Table 1). For fish < 50 cm (n=259), mean length was 37.7 cm, mean weight was 0.69 kg, and mean condition factor (K) was 1.20 (Table 1). 1980s to 2000s Data Very limited numbers of rainbow trout samples were periodically collected from the sport fishery during the 1980s-early 2000s. As well, samples were obtained from captured spawners at Gerrard with a bias towards females. This data is of limited value due to small sample size but has been entered into the Excel file database and is summarized in Table 1. As previously mentioned, not included is some good data collected during the 1970s that exists on file in Nelson MOE office.
REDFISH CONSULTING LTD. Page 6
RED
FISH C
ON
SULTIN
G LIM
ITED P
age 7
Table 1. Kootenay Lake Gerrard rainbow trout length-weights in categories of < 50 cm and > 50 cm and same sizes for the three periods of lake productivity.
Year Size Category N Mean Length (cm) Range (cm) Mean Wt (kg) Range (kg) Fulton Condition
Factor (K) Range (K)
1966 >50cm 330 66.8 (± 1.17) 50-96 4.02 (± 0.23) 1.13-11.0 1.23 (± 0.02) 0.65-1.961981 >50cm 10 79.4 (± 4.67) 68-88 5.81( ± 1.28) 3.63-9.08 1.13( ± 0.07) 0.96-1.311982 >50cm 21 83.2 (± 3.20) 64-91 7.19 (± 0.81) 2.72-9.98 1.23 (± 0.08) 0.89-1.521988 >50cm 24 76.2 (± 3.23) 63-88 6.07 (± 0.76) 3.41-8.86 1.36 (± 0.12) 0.73-2.371989 >50cm 25 74.0 (± 3.23) 57-91 5.46 (± 0.75) 1.81-9.32 1.31(± 0.08) 0.97-1.681991 >50cm 21 82.2 (± 3.10) 66-94 7.21 (± 0.87) 2.7-10.0 1.26 (± 0.06) 0.94-1.491992 >50cm 40 78.0 (± 3.08) 54-96 7.08 (± 0.73) 2.5-11.8 1.45(± 0.04) 1.18-1.731994 >50cm 23 77.0 (± 3.11) 63-93 6.81 (± 0.82) 3.62-10.6 1.46 (± 0.06) 1.15-1.681998 >50cm 42 81.1 (± 2.01) 68-94 7.27 (± 0.53) 4.31-11.4 1.35 (± 0.04) 1.09-1.612000 >50cm 23 81.5 (± 2.87) 69-94 7.25 (± 0.84) 4.5-12.7 1.32 (± 0.05) 1.11-1.582003 >50cm 30 71.8 (± 4.18) 51-91 5.37 (± 0.85) 1.36-9.54 1.37 (± 0.13) 0.63-2.072004 >50cm 119 73.2 (± 1.82) 50-93 5.72 (± 0.43) 1.1-11.4 1.37 (± 0.04) 0.79-2.15 95% CI
Year Size Category N Mean Length (cm) Range (cm) Mean Weight (kg) Range (kg) Fulton Condition Factor (K) Range (K) 95% CI
1966 <50cm 259 37.7 (± 1.00) 18-49 0.70 (± 0.05) 0.1-2.2 1.2 (± 0.03) 0.59-2.52003 <50cm 5 46.0 (± 3.78) 43-49.5 1.5 (± 0.24) 1.4-1.81 1.55 (± 0.37) 1.21-1.972004 <50cm 30 36.4 (± 2.81) 23.1-49.5 0.65 (± 0.16) 0.13-1.6 1.18 (± 0.09) 0.77-1.86
Year Size category N Mean Length (cm) Range (cm) Mean Weight (kg) Range (kg) Fulton Condition Factor (K) Range (K)
1994-2004 >50cm 237 75.5 (± 1.25) 50.5-94.5 6.2 (± 0.29) 1.1-12.7 1.37 (± 0.03) 0.63-2.141981-1992 >50cm 141 78.5 (± 1.41) 54-96 6.56 (± 0.34) 1.8-11.8 1.33 (± 0.03) 0.73-2.4
Post > 50 cm K factor Pre > 50 cm K factor Productive years before decline > 50 cm(1994-2004) (1981-1992) 1966
length weight K length weight K length weight KMean 75.57868354 6.202971155 1.37 78.47095745 6.564607995 1.33 66.81909091 4.020316804 1.228Standard Deviation 9.768214974 2.291588122 0.21 8.520570758 2.055566236 0.20 10.83463008 2.09943407 0.190Range 44 11.6 1.52 42 9.981818182 1.64 46 9.863636364 1.317Minimum 50.5 1.1 0.63 54 1.818181818 0.73 50 1.136363636 0.648Maximum 94.5 12.7 2.15 96 11.8 2.37 96 11 1.965Count 237 237 237.00 141 141 141.00 330 330 330.000Confidence Level (95.0%) 1.250033686 0.29325341 0.03 1.418658583 0.34224781 0.03 1.173291108 0.227349463 0.021
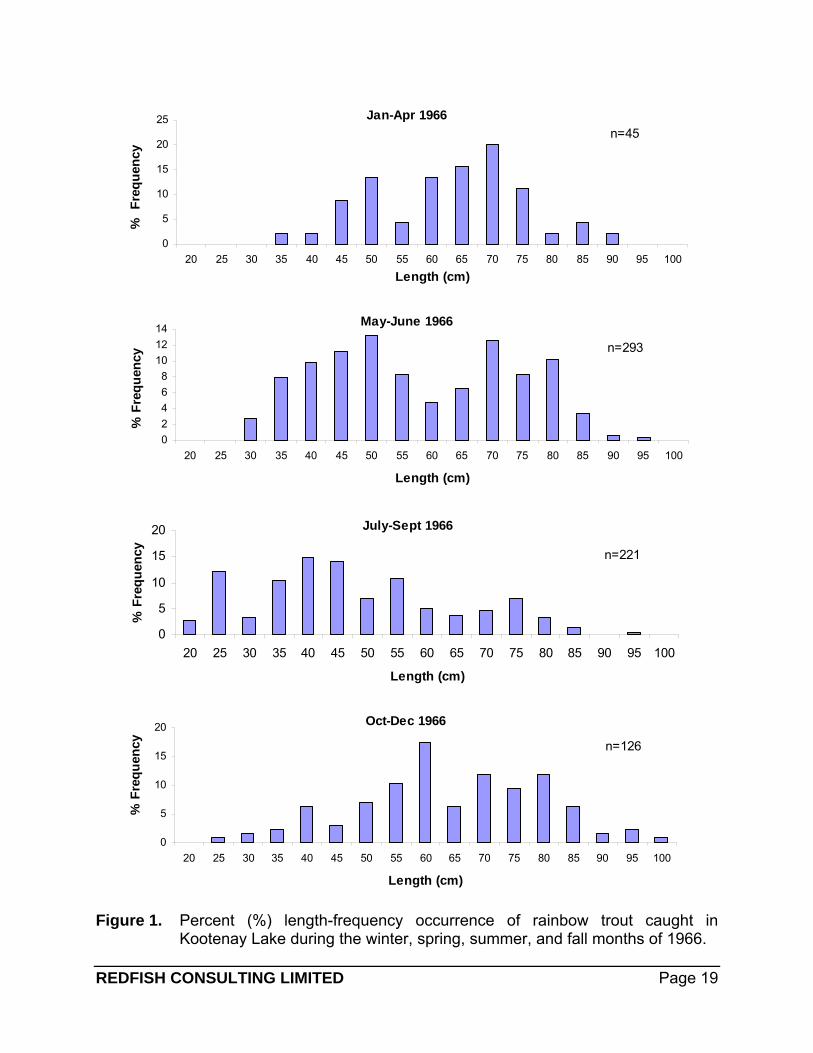
Late 2003 Data In October to December 2003 a total of 35 samples were collected from the sport fishery. By size category, fish > 50 cm (n=30) had a mean length of 72 cm, mean weight was 5.4 kg and mean condition factor (K) was 1.37. For the few fish < 50 cm (n=5), mean length was 46 cm, mean weight was 1.5 kg and mean condition factor (K) was 1.5. 2004 Data In 2004, a total of 149 samples were collected from the sport fishery but the samples were not randomly collected since the primary purpose was to collect fecundity samples, i.e., more effort was directed at obtaining samples in the fall to winter months when fecundity samples were potentially available. This means that the data cannot be used for catch curve analysis as the anglers deliberately released smaller fish; hence, the sampling was bias towards larger fish. This was particularly true when samples were obtained from derbies that imposed minimum size limit rules. By size category, fish > 50 cm (n=149) had a mean length of 73.2 cm, mean weight was 5.72 kg, and mean condition factor (K) was 1.37 (Table 1). For fish < 50 cm (n=30), mean length was 36.4 cm, mean weight was 0.65 kg, and mean condition factor (K) was 1.2. 2005 Data At time of writing some additional scale samples had accumulated but not processed or analyzed. Size-At-Maturity Limited numbers of Gerrard spawners have been weighed and measured after capture on the spawning grounds. The method of capture from 1949-1959 (hereto referred to as “older data”) was primarily by seine net with some trapping whereas from 1979-2000 (hereto referred to as “newer data”) spawners were trapped by means of a temporary fish fence located approximately 200 m downstream of the Gerrard Bridge. The different capture methods may account for some of the considerable differences in size frequency of the older data fish compared to the new data fish sizes (Fig. 2). Also, there may have been a few residual non Gerrards included since some hatchery plants were made at Gerrard in the 1940s (Irvine 1978; MOE web site stocking records). The more reasonable explanation may be due to real differences in population size discussed below. In any event, the contemporary data indicates that mean size of males has been close to 85 cm and females approximately 77 cm (Fig. 3). Only two fish (total=202) measuring < 60 cm were captured during the years and the largest fish was 97.8 cm (Fig. 2). Age-at-Maturity A key characteristic of the biology of Gerrard rainbow trout aside from their large size is their relatively late age-at-maturity. Most southern BC rainbow stocks mature at ages
REDFISH CONSULTING LIMITED Page 8
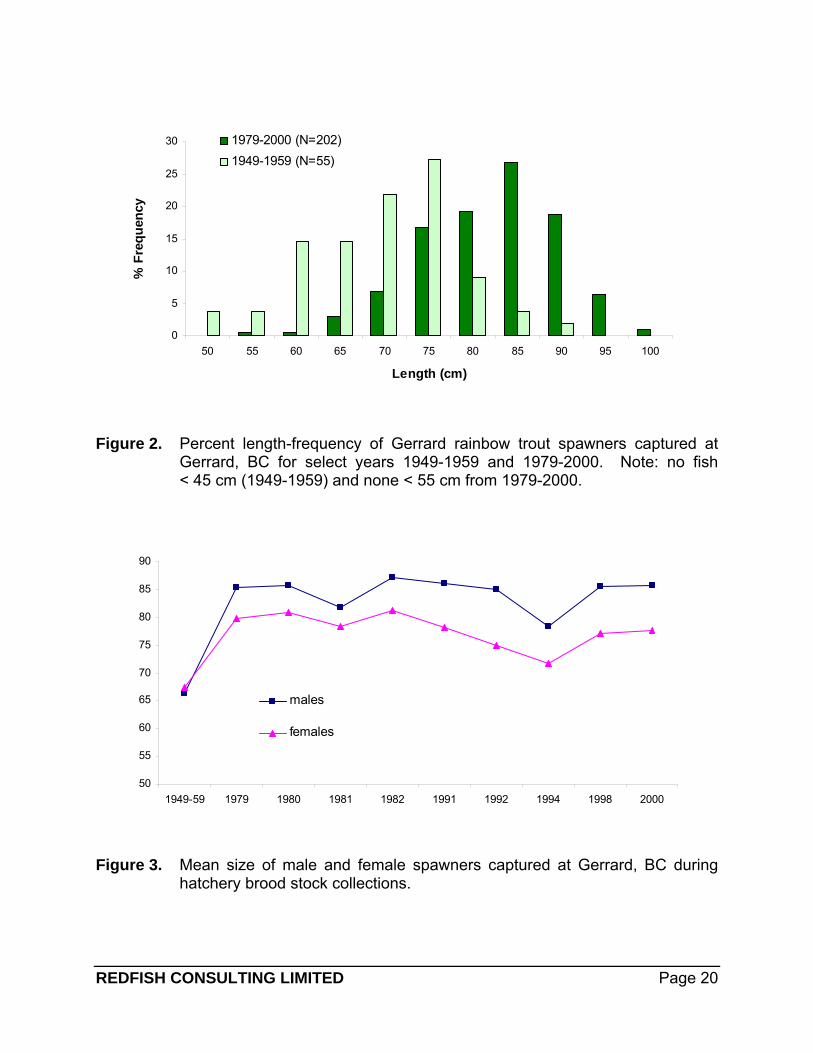
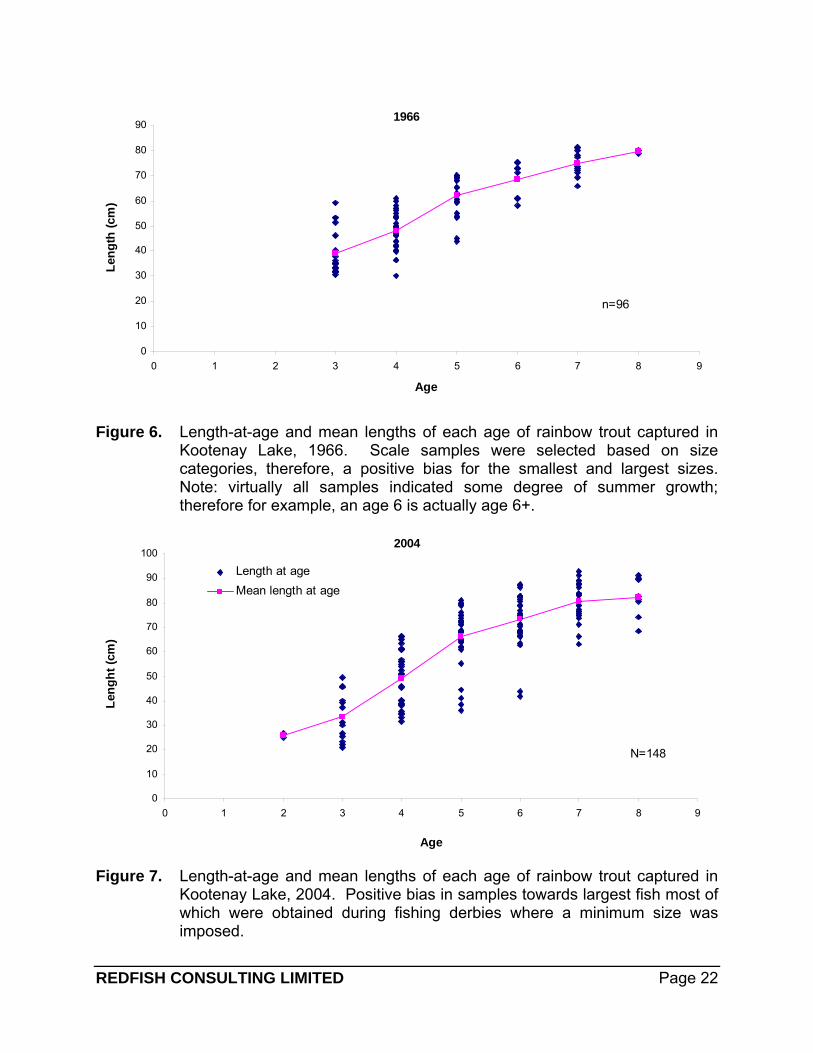
2-4 with only a few other piscivorous rainbow populations known to mature at older ages (Andrusak et al. 2005, draft report). A limited amount of ageing by scale analysis has been done on some of the spawning fish captured at Gerrard. Since the majority of fish were captured for egg collection purposes most were females and therefore ageing was only determined from female scale samples. Cartwright (1961) aged 37 females collected from the older data and the majority was ages 5 and 6 with one age 4 and one age 7 (Table 2; Fig. 4). The newer data (Fig. 5) indicates the majority of females were ages 6 and 7 with only 3 fish age 5 and no fish age 4. Mean size for each age group were higher during 1979-2000 (Fig. 3). It is possible that different ages were assigned between the two data sets since different scale readers were involved. On the other hand the data may be illustrating real differences. With the exception of mean size of age 6 fish, the means of the other ages were much smaller for the older data compared to the more recent data although the ranges overlap. Were the older data fish actually maturing earlier, hence more age fives due to low total numbers (Cartwright 1961) and improved growth, hence earlier age-at-maturity? Cartwright (1961) discusses how the total numbers of spawners had been depopulated due to intensive egg collections that had greatly reduced total spawner numbers. Given the small samples sizes there is no definitive answer to explain the differences in age between the two sets of data. It should be mentioned that a few fish were aged as 8+ from the 2004 sport fish data. It is quite likely that a few such old fish, especially males, (e.g., ages 8 and 9) were present as spawners at Gerrard in earlier years but simply were not captured. It is also quite likely that these older fish were “under-aged” due to scale resorption. For example, some larger fish (11-12 kg) were captured late in the 2004 fishery and it appears the population may be increasing. If the population is increasing then it is predictable that a few fish will be caught in 2005 as large as 13-13.5 kg with a few exceptionally larger ones present at Gerrard. Age of Sport Caught Rainbow Trout The only data available that represents the sport fish harvest over the entire season is from 1966. Andrusak and Parkinson (1984) also reported size-at-age for the 1973 June to December North Arm fishery and there are old file hard copy reports in the Nelson MOE office that has far more data that needs to be entered into the Excel database. Age analysis of the 1966 data was limited to 100 samples (total ≈ 600 samples) due to budget constraints. A minimum of 20 were randomly selected from the following size categories: 20 samples from 30-40 cm; 20 (41-50 cm); 20 (51-60); 20 (61-70 cm); 20 (> 71 cm). The ages of these samples ranged from age 3+ to age 8+ with the majority found to be age 4+ (Fig. 6). Due to sample size selectivity fish < 30 cm were not aged but these would almost certainly be ages 2+ or 3+ unless non-Gerrards were present.
REDFISH CONSULTING LIMITED Page 9
RED
FISH C
ON
SULTIN
G LIM
ITED P
age 10
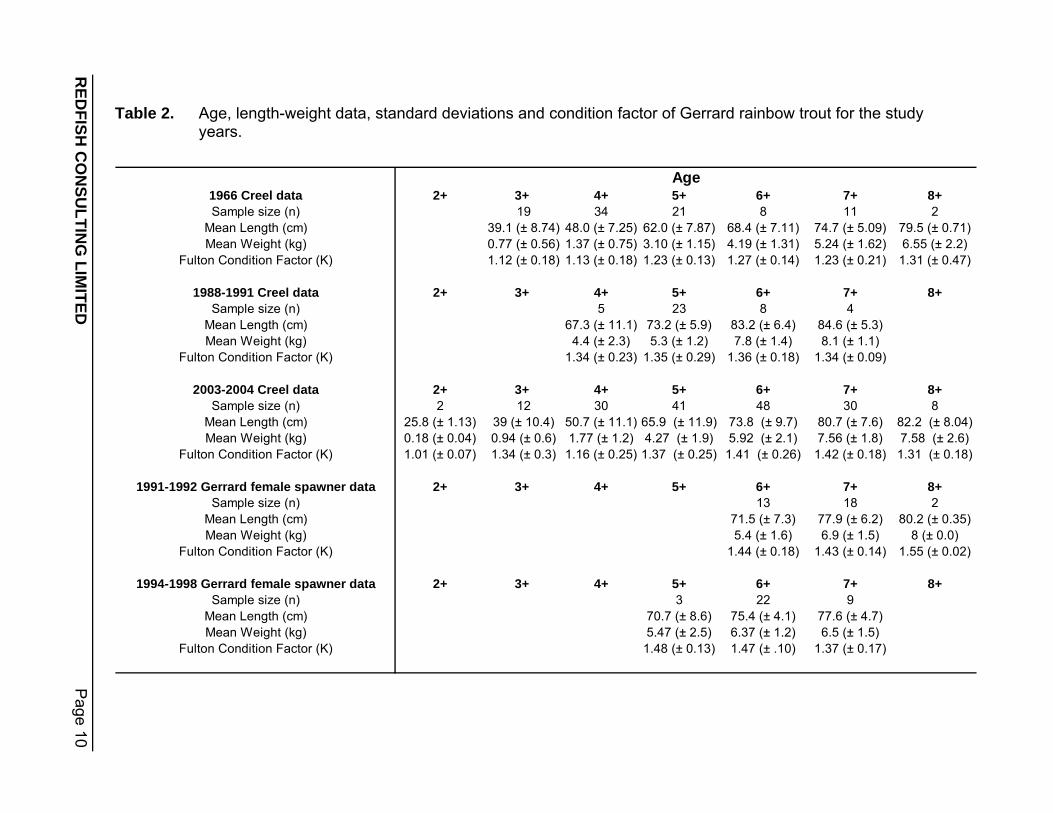
Table 2. Age, length-weight data, standard deviations and condition factor of Gerrard rainbow trout for the study years.
1966 Creel data 2+ 3+ 4+ 5+ 6+ 7+ 8+Sample size (n) 19 34 21 8 11 2
Mean Length (cm) 39.1 (± 8.74) 48.0 (± 7.25) 62.0 (± 7.87) 68.4 (± 7.11) 74.7 (± 5.09) 79.5 (± 0.71)Mean Weight (kg) 0.77 (± 0.56) 1.37 (± 0.75) 3.10 (± 1.15) 4.19 (± 1.31) 5.24 (± 1.62) 6.55 (± 2.2)
Fulton Condition Factor (K) 1.12 (± 0.18) 1.13 (± 0.18) 1.23 (± 0.13) 1.27 (± 0.14) 1.23 (± 0.21) 1.31 (± 0.47)
1988-1991 Creel data 2+ 3+ 4+ 5+ 6+ 7+ 8+Sample size (n) 5 23 8 4
Mean Length (cm) 67.3 (± 11.1) 73.2 (± 5.9) 83.2 (± 6.4) 84.6 (± 5.3)Mean Weight (kg) 4.4 (± 2.3) 5.3 (± 1.2) 7.8 (± 1.4) 8.1 (± 1.1)
Fulton Condition Factor (K) 1.34 (± 0.23) 1.35 (± 0.29) 1.36 (± 0.18) 1.34 (± 0.09)
2003-2004 Creel data 2+ 3+ 4+ 5+ 6+ 7+ 8+Sample size (n) 2 12 30 41 48 30 8
Mean Length (cm) 25.8 (± 1.13) 39 (± 10.4) 50.7 (± 11.1) 65.9 (± 11.9) 73.8 (± 9.7) 80.7 (± 7.6) 82.2 (± 8.04)Mean Weight (kg) 0.18 (± 0.04) 0.94 (± 0.6) 1.77 (± 1.2) 4.27 (± 1.9) 5.92 (± 2.1) 7.56 (± 1.8) 7.58 (± 2.6)
Fulton Condition Factor (K) 1.01 (± 0.07) 1.34 (± 0.3) 1.16 (± 0.25) 1.37 (± 0.25) 1.41 (± 0.26) 1.42 (± 0.18) 1.31 (± 0.18)
1991-1992 Gerrard female spawner data 2+ 3+ 4+ 5+ 6+ 7+ 8+Sample size (n) 13 18 2
Mean Length (cm) 71.5 (± 7.3) 77.9 (± 6.2) 80.2 (± 0.35)Mean Weight (kg) 5.4 (± 1.6) 6.9 (± 1.5) 8 (± 0.0)
Fulton Condition Factor (K) 1.44 (± 0.18) 1.43 (± 0.14) 1.55 (± 0.02)
1994-1998 Gerrard female spawner data 2+ 3+ 4+ 5+ 6+ 7+ 8+Sample size (n) 3 22 9
Mean Length (cm) 70.7 (± 8.6) 75.4 (± 4.1) 77.6 (± 4.7)Mean Weight (kg) 5.47 (± 2.5) 6.37 (± 1.2) 6.5 (± 1.5)
Fulton Condition Factor (K) 1.48 (± 0.13) 1.47 (± .10) 1.37 (± 0.17)
Age
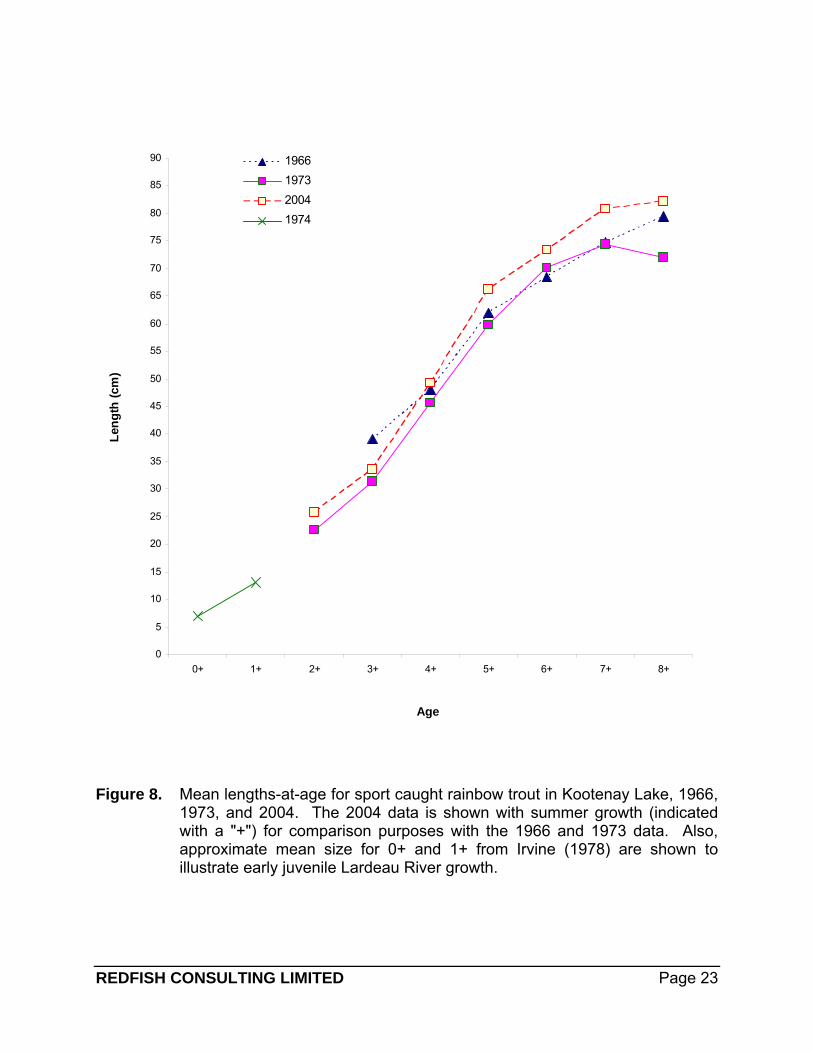
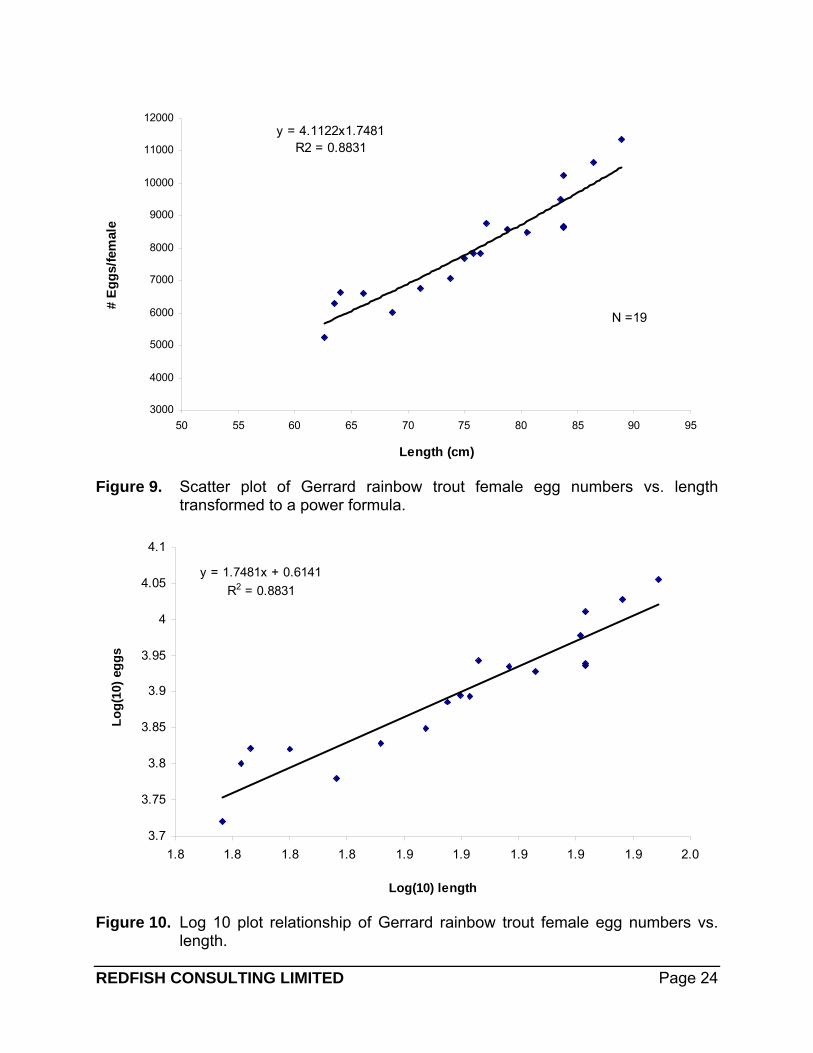
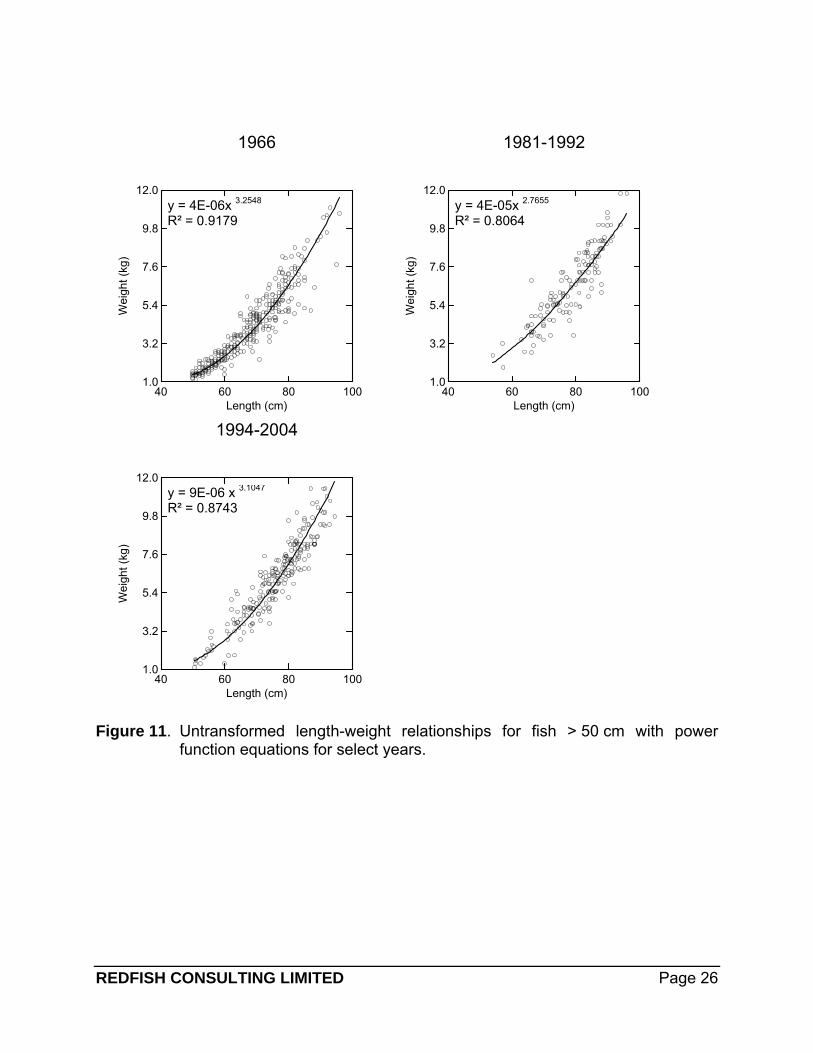
From the 2004 scale samples collected, 148 were deemed to be reliably aged (Fig. 7), i.e., no uncertainty as to age assigned. The 2004 data shows a similar length-at-age pattern to the 1966 data except that two fish were aged as age 2+ (Table 2). These two fish and several age 3+ were specifically sampled from a shoreline fishing site at Lost Ledge 20 km north of Kaslo, BC. This fishery occurs in September and early October when small rainbow trout are caught on shore at or near the surface. There is interest in understanding if these fish are young Gerrards that may be in transition, still insectivorous but switching over to piscivorous behavior. DNA samples were collected from these fish for future analysis. There appears to be some outliers in the length-at-age data shown in Figure 7. Four fish age 5 are < 40 cm and two fish age 6 were also < 40 cm. These fish do not appear to be Gerrard rainbow trout given their comparatively small size vs. age. Mean lengths-at-age for 1966, 1973, and 2004 are illustrated in Figure 8. The means are quite similar for each age, especially for the younger fish but growth appears to be better in 2004 for the older age groups. This is somewhat surprising since the 1966 and 1973 fish grew in the lake during a period of high productivity and high kokanee numbers (Ashley et al. 1999; Andrusak et al. 2004). The 2004 fish inhabited the lake when it was far less productive and when kokanee numbers were lower but increasing. Other factors could be at play to explain the different growth patterns including differences in seasonal sample size (e.g., more summer caught fish in 1966), other predator numbers, and or harvest rates. Angling effort was probably less in the earlier years but most fish in those days were harvested compared to 2004 when considerable catch and release occurred. On the other hand, perhaps the differences are real and reflect the beneficial influence of lake fertilization? A limited amount of data presented below tends to support this notion. Fecundity A primary objective of this project was to obtain egg samples from mature females to determine Gerrard rainbow trout fecundity. Irvine (1978) used a formula from Acara (1969, draft report) but the raw data could not be found to verify the validity of the formula. A total of 22 samples were obtained in late 2003 and in the fall 2004. Three of these samples were rejected because it was quite apparent that eggs had either been crushed or were indistinguishable when counting. Using SYSTAT-11.0 analysis also confirmed these fish to be outliers. The remaining 19 samples were plotted by a length-egg relationship that was fitted using a non-linear power function in the form of F=a (Lb) (Fig. 9). The data was transformed using the Log10 (Fig. 10) and the resulting formula can be used to estimate fecundity when only lengths are known:
Log10 (F) = 1.7481*Log10 (L) +0.6141 Interestingly, this formula is virtually identical to that of Acara (1970, draft report) and therefore, serves to validate his formula. From the 19 samples egg numbers per female
REDFISH CONSULTING LIMITED Page 11
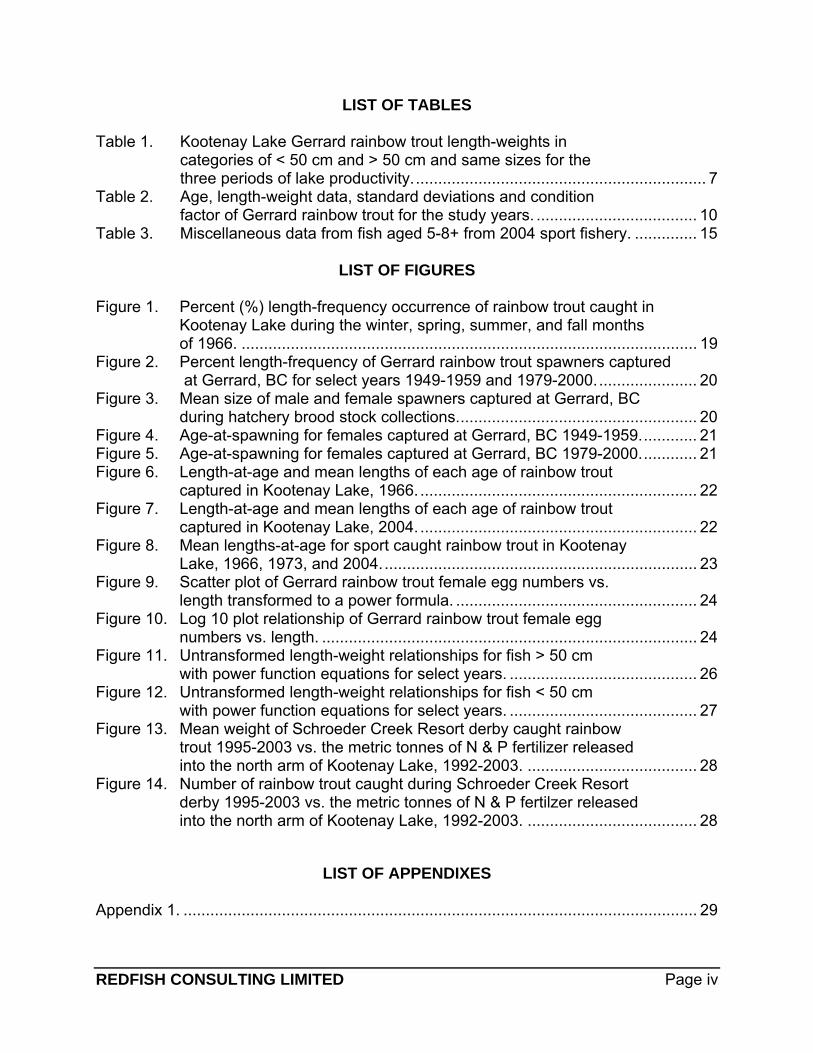
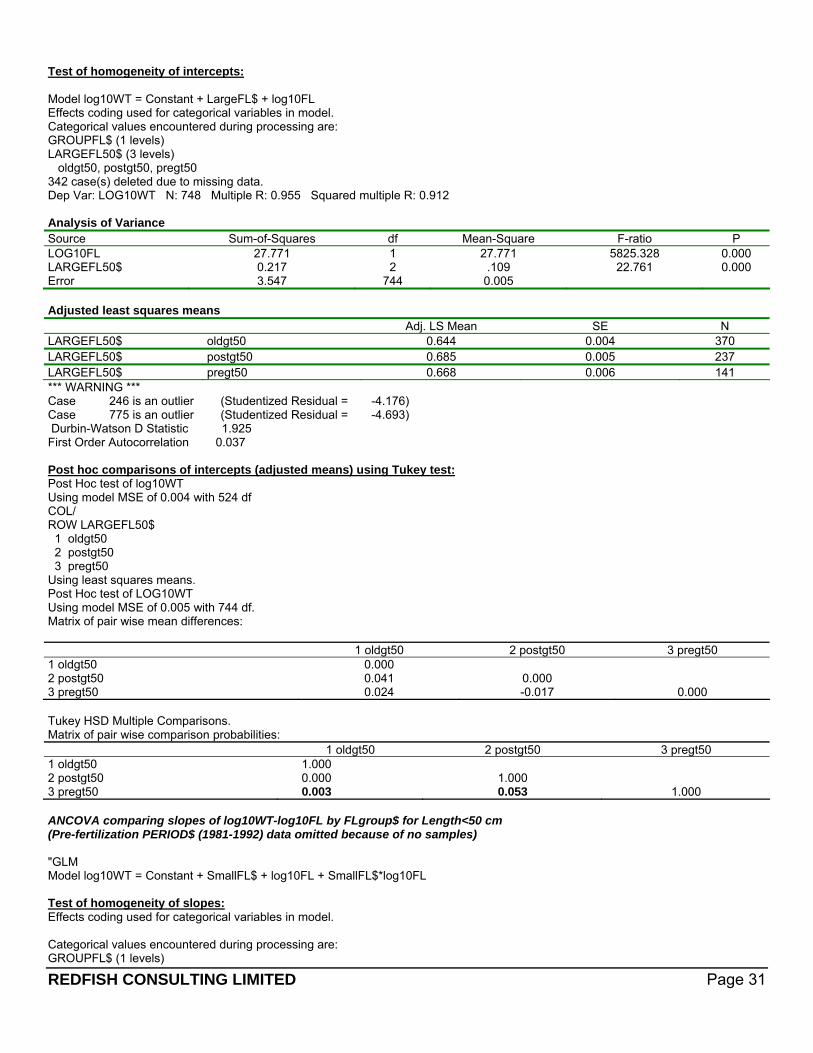
ranged from 5,245-11,356 and the mean number was 8,048, almost identical to the number (8,076) derived by Irvine (1978) using the Acara formula. Growth and Condition Factor The question has been asked by many anglers about the condition of the 2004 fish with most believing they are in much better condition than previous years. As well, there is interest within the scientific community as to whether or not benefits of lake fertilization are now reflected in all trophic levels. Fulton’s condition factor (K) was calculated for most of the data (Table 1) as an indicator of condition of the fish. The 2004 fish had the highest condition factor compared to the other periods. However, it is acknowledged that fish condition varies seasonally and is influenced by prey densities, competition from other predators, as well as possible environmental differences (Pope and Kruse 2001). Growth, particularly weight-at-size, and condition factor were analyzed for fish sizes < 50 cm and > 50 cm, for three periods of recent lake productivity. Data was analyzed from 1966 when the lake was considered highly productive [see Northcote 1973; Daley et al. 1981]; from a small sample of fish from the unproductive period due to decline in nutrients (1981-1992); and from samples recently (1994-2004) obtained once lake fertilization had started (referred to below as post-fertilization fish). In addition, fish > 65 cm were also analyzed separately for weight at size by Tom Johnston at UBC Fisheries Research. It is acknowledged that it is difficult to attribute any small differences detected in weight-at-size solely to the fertilization treatment. Uncertainties about sport fishery harvest effects on growth rates, small rainbow trout sample sizes for pre-fertilization years, and differences in prey and predator numbers (rainbow trout and other predators) confound any growth analysis (Tom Johnston, UBC Fisheries Research, pers comm.). Despite these limitations it was felt that analysis of rainbow trout growth was important since the ultimate goal of lake fertilization is to provide benefits to the predators (rainbow trout and bull trout) that are so highly sought in the sport fishery. With the above-noted limitations in mind, regressions of transformed length-weight relationships were performed from comparative years. Testing significant differences in the length-weight regression lines was done using analysis of covariance (ANCOVA) and by comparing confidence intervals around the coefficients generated by the regression analysis. In addition, calculation of the condition factor was also performed by size category for each productivity period. Rainbow Trout > 50 cm The analysis of the slope and intercept of the regression lines indicates mean weights at a given length for RBT > 50 cm were significantly greater (P< 0.01) in the periods 1981-1992 and 1994-2004 than in the highly productive period (1966) [Appendix 1]. The mean weights at a given length for RBT > 50 cm were significantly greater (P< 0.01) in the post-fertilization period (1994-2004) than in the pre-fertilization period 1981-1992. It
REDFISH CONSULTING LIMITED Page 12
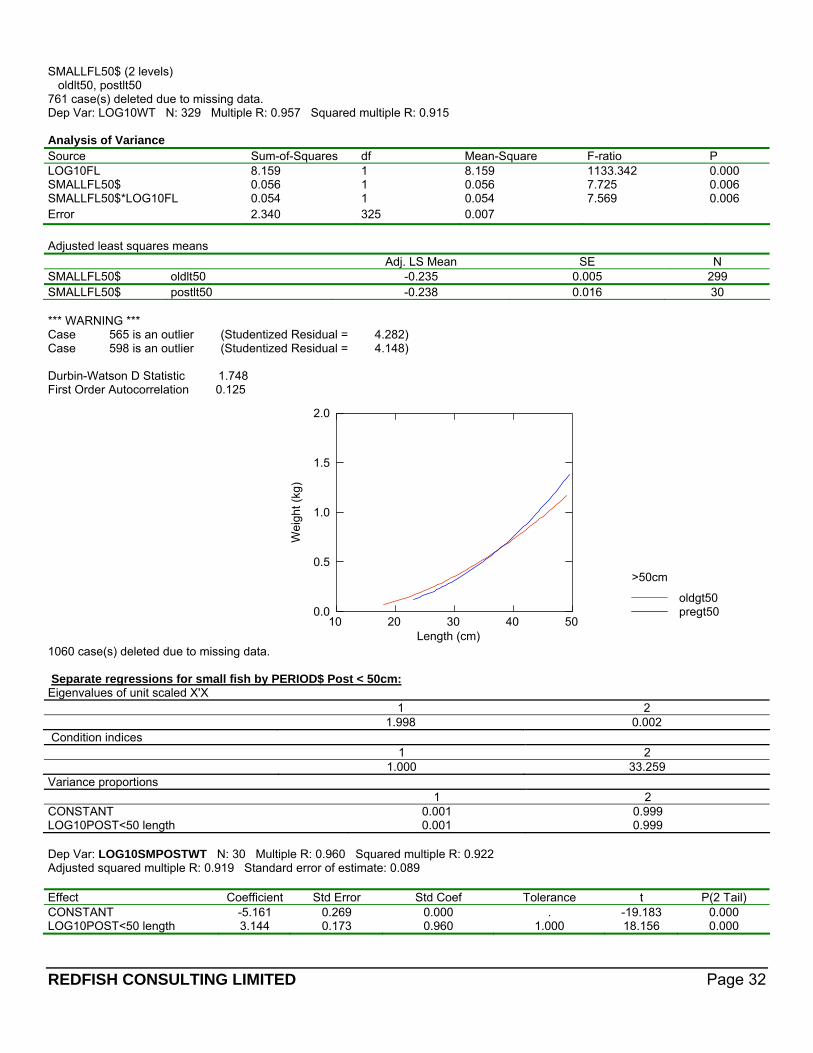
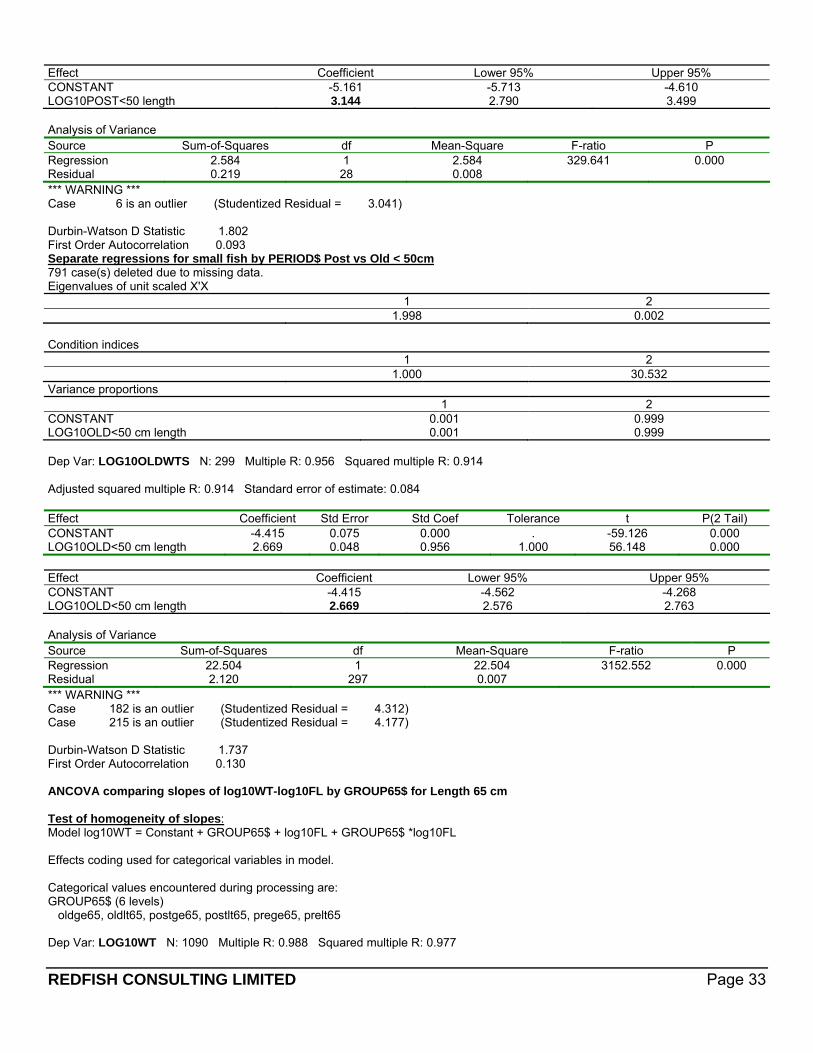
should be noted however that on closer examination, the pre-fertilization regressions for the smaller sizes (50-65 cm) indicates that growth was actually higher than either the post-fertilization or the highly productive period (1966). These results should be viewed with caution however since the pre-fertilization sample size (n=6) was far too small for meaningful statistical analysis. Interestingly, the slope of the power length-weight function for 1966 and 1994-2004 was > 3.0 (Fig. 11) indicating fish > 50 cm became more rotund as they increased in length (Anderson and Neumann 1996). In comparison, the slope for the 1981-1992 data was < 3.0, suggesting fish > 50 cm were less rotund as they increased in length. In addition, mean condition factor was higher in 1994-2004 (1.37) compared to the 1966 and 1981-1992 (Table 1). Rainbow Trout < 50 cm A comparison was made of confidence intervals around the coefficients generated by the regression analysis for fish < 50 cm. For this size category there is considerable uncertainty about the results since probably more than one stock with variable growth rates were included. The analysis shows that the mean weights at a given length for RBT < 50 cm were significantly greater in 1966 than in the post-fertilization period (Appendix 1). The slope of the power length-weight function for 1994-2004 fish was > 3.0 (Fig. 12), and indicating fish < 50 cm became more rotund as they increased in length (Anderson and Neumann 1996), while in 1966 the slope of the power function was < 3.0, indicating the opposite. However, mean condition factor was calculated to be similar in both years (Table 1). Rainbow Trout ≥ 65 cm If there are real differences in growth between pre- and post-fertilization fish they should be most easily detected in the largest fish. The analysis indicted that mean weights at a given length for RBT ≥ 65 cm were significantly greater (P< 0.001) in the periods 1981-1992 and 1994-2004 compared to the highly productive period (1966) (Appendix1). The mean weights at a given length for RBT ≥ 65 cm were significantly greater in the post-fertilization period 1994-2004 compared to the pre-fertilization period 1981-1994. Note however, that the size differences were actually quite small (roughly 4-8%). Results of analysis of growth and condition (Table 2) between the three periods of Kootenay Lake’s changing productivity were somewhat surprising. It was expected that growth from 1996 would be higher than the pre- and post-fertilization periods but the analysis did not support this notion. Growth of the post-fertilization fish was higher than either 1966 fish or the pre-fertilization fish. It is possible that because samples in 1966 were taken over the whole year that spawned out fish in poor condition influenced the analysis. Additional analysis should be conducted to test this suggestion. Statistically significant differences in growth (P< 0.05) were detected between the pre- and post-fertilization samples. As noted, there are a number of factors at play that influence
REDFISH CONSULTING LIMITED Page 13
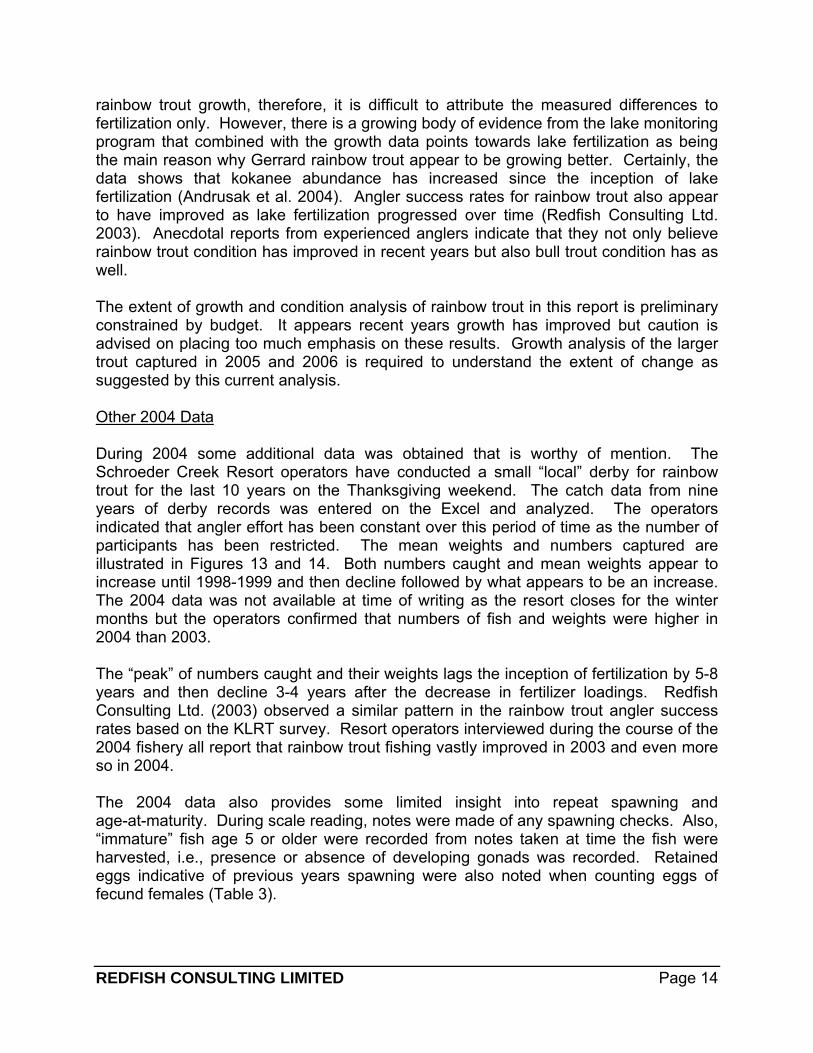
rainbow trout growth, therefore, it is difficult to attribute the measured differences to fertilization only. However, there is a growing body of evidence from the lake monitoring program that combined with the growth data points towards lake fertilization as being the main reason why Gerrard rainbow trout appear to be growing better. Certainly, the data shows that kokanee abundance has increased since the inception of lake fertilization (Andrusak et al. 2004). Angler success rates for rainbow trout also appear to have improved as lake fertilization progressed over time (Redfish Consulting Ltd. 2003). Anecdotal reports from experienced anglers indicate that they not only believe rainbow trout condition has improved in recent years but also bull trout condition has as well. The extent of growth and condition analysis of rainbow trout in this report is preliminary constrained by budget. It appears recent years growth has improved but caution is advised on placing too much emphasis on these results. Growth analysis of the larger trout captured in 2005 and 2006 is required to understand the extent of change as suggested by this current analysis. Other 2004 Data During 2004 some additional data was obtained that is worthy of mention. The Schroeder Creek Resort operators have conducted a small “local” derby for rainbow trout for the last 10 years on the Thanksgiving weekend. The catch data from nine years of derby records was entered on the Excel and analyzed. The operators indicated that angler effort has been constant over this period of time as the number of participants has been restricted. The mean weights and numbers captured are illustrated in Figures 13 and 14. Both numbers caught and mean weights appear to increase until 1998-1999 and then decline followed by what appears to be an increase. The 2004 data was not available at time of writing as the resort closes for the winter months but the operators confirmed that numbers of fish and weights were higher in 2004 than 2003. The “peak” of numbers caught and their weights lags the inception of fertilization by 5-8 years and then decline 3-4 years after the decrease in fertilizer loadings. Redfish Consulting Ltd. (2003) observed a similar pattern in the rainbow trout angler success rates based on the KLRT survey. Resort operators interviewed during the course of the 2004 fishery all report that rainbow trout fishing vastly improved in 2003 and even more so in 2004. The 2004 data also provides some limited insight into repeat spawning and age-at-maturity. During scale reading, notes were made of any spawning checks. Also, “immature” fish age 5 or older were recorded from notes taken at time the fish were harvested, i.e., presence or absence of developing gonads was recorded. Retained eggs indicative of previous years spawning were also noted when counting eggs of fecund females (Table 3).
REDFISH CONSULTING LIMITED Page 14
Table 3. Miscellaneous data from fish aged 5-8+ from 2004 sport fishery.
Ages 5-8 Repeat spawners Immature “Others”
N= 104 Spawning Checks
Egg Retention % Immature @ ages 5 & 6 Non-Gerrards
11 3 5 4
% 13.5% 5% 4% Evidence of repeat spawning was observed in 14 fish out of the 104 fish aged. Five fish were recorded as “immature”, i.e., had not spawned. This estimate should be considered low as some fish were not categorized. Four fish were considered as “non-Gerrards” based on early sexual maturity or scale analysis that indicated slow growth and small size. For example, one such fish was a ripe male caught by the author that was only 34.5 cm. This size of fish is not observed at Gerrard and probably spawns in one of the South Arm tributaries or possibly the West Arm. The limited 2004 fecundity data from the sport fishery indicates fish > 3.9 kg are potential pre-spawners and all the Gerrard data collected from spawners in the Lardeau River indicates few fish spawn < 4 kg. In future, creel censuses of Kootenay Lake Gerrard fisherman should record all “ripe” > 4.0 kg fish harvested as well as total fish > 4.0 kg (whether ripe or not) so that a crude estimate of total numbers > 4.0 kg can be determined based on an estimate of total spawner population for that year. Total Population # > 4.0 kg = total harvest > 4.0 kg x (# spawners @ Gerrard) # ripe fish > 4 kg in fishery This estimate would give some insight into numbers of fish ages 4-8. It could also be used for large fish only (> 7 kg) as initially suggested by Irvine (1978) thus giving a means of estimating numbers of ages 6-8.
REDFISH CONSULTING LIMITED Page 15
RECOMMENDATIONS 1. Conduct a year round creel census to obtain biological data that can be used to
generate catch curves to ascertain fishing mortality rates. 2. Continue to add to the fecundity data to increase sample size. 3. Digitize and compile a library of all scale samples that were used for ageing in this
report. 4. The creel census should record all large fish (> 4 kg) that are “ripe” vs. all large fish
harvested. 5. Initiate a program of rainbow trout stock identification using age and growth
analysis combined with DNA analysis. 6. Use the Excel files provided from this project as the start of a permanent electronic
file for Gerrard rainbow trout. Provision should be made that only one ministry person make changes to this file.
7. Conduct a file search for older data in the MOE office and other locations that can
be added to the database. 8. Undertake an analysis of other large piscivores in Kootenay Lake (e.g., bull trout)
to determine if changes in growth over time documented in this report are corroborated by other species.
9. Combine the information in this report with fry and parr sampling from the Lardeau
River to develop conservation reference points for the Gerrard rainbow trout in Kootenay Lake.
REDFISH CONSULTING LIMITED Page 16
REFERENCES
Acara, A. H. 1969. Kootenay Lake Rainbow Trout-Fry Production, Fry and Spawner Survival. B.C. Fish and Wildlife Branch, Misc. Report, 35p MS.
Anderson, R. O., and R. M. Neumann. 1996. Length, Weight and Associated Structural Indices. CH. 15 Pages 447-482 in B R. Murphy and D. W. Willis, editors. Fisheries techniques, 2nd edition. American Fisheries Society, Bethesda, Maryland.
Andrusak, H. and E.A. Parkinson. 1984. Food Habits of Gerrard Stock Rainbow Trout in Kootenay Lake, British Columbia. B.C. Ministry of Environment, Fish and Wildlife Branch, Fisheries Technical Circular No. 60. 1984.
Andrusak, H. 1987. Kootenay Lake Sport Fishery 1984-86 unpublished MS, Fisheries Branch, Nelson, BC Report No. KO-19 31 p.
Andrusak, H., and C. Brown. 1987. Kootenay Lake Fisheries Management Plan 1987-89. B.C. Ministry of Environment, 56 pp.
Andrusak, H., D. Sebastian, G. Scholten and P. Woodruff. 2004. Response of Kokanee and Gerrard Rainbow Trout to Experimental Fertilization of the North Arm of Kootenay Lake in 2002 and 2003. Contract Report for the CBFWCP Nelson, BC.
Andrusak, H., R. Bison, B. Hebden, and A. Morris. 2005. Biology and Current Status of Rainbow Trout and Lake Char in Shuswap Lake. Draft Contract report Redfish Consulting Ltd. for the Ministry of Water, Land and Air Protection. Kamloops BC.
Arndt, S. 2004. Post-Fertilization Diet, Condition and Growth of Bull Trout and Rainbow Trout in Arrow Lakes Reservoir. Report for the Columbia Basin Fish & Wildlife Program 28 p.
Ashley, Ken, Lisa C. Thompson, David C. Lasenby, Laurie McEachern, Karen E. Smokorowski, and Dale Sebastian. 1997. Restoration of an Interior Lake Ecosystem: the Kootenay Lake Fertilization Experiment. Water Qual. Res. J. Canada, 1997 Volume 32 No. 295-323.
Ashley, K., Thompson, Lombard, D. P., Yang, Y-R., Pick, F. R., Hamilton, Lasenby, D.B. Smokorowski, K, E., McEachern, L., P.B., Sebastian D. C and George Scholten. 1999. Kootenay Lake Fertilization Experiment- Year 5 (1996/97) Report. Fisheries Project Report No. 65, 1999, Province of BC Ministry of Fisheries, Fisheries Management Branch.
Cartwright, J.W. 1961. Investigations of the Rainbow Trout of Kootenay Lake, British Columbia with Special Reference to the Lardeau River. BC. Fish and Wildlife Branch, Mngt. Publ. 7, 46p.
Daley, R.J., E.C. Carmack, C.B.J. Gray, C.H. Pharo, S. Jasper, and R.C. Wiegand. 1981. The Effects of Upstream Impoundments on Kootenay Lake, B.C. Canada Inland Waters Directorate, Research Institute, Scientific Series, West Vancouver, British Columbia.
REDFISH CONSULTING LIMITED Page 17
Hagen, J. and J. Baxter. 2002. Rainbow Trout (Onchorynchus mykiss) Escapement Estimation at Gerrard 1961-2001: A Comparison of Peak Count-Based and Area-Under-the-Curve Methodologies. Draft contract report prepared for the Columbia-Kootenay fisheries Renewal Partnership.
Hartman, G.F. 1969. Reproductive Biology of the Gerrard Stock Rainbow Trout. In: T.G. Northcote (ed.) Symposium on Salmon and Trout in Streams, H.R. MacMillan Lectures in Fisheries, Univ. of British Columbia: 53-67.
Irvine, James R. 1978. The Gerrard Rainbow Trout of Kootenay Lake, British Columbia - A Discussion of their Life History with Management, Research and Enhancement Recommendations. BC Fisheries Management Report No. 72. March, 1978.
Larkin, G.A. 1998. Kootenay Lake Phosphorus Loading from the Kootenay and Duncan Rivers. Report prepared for the Columbia Basin Fish and Wildlife Compensation Program, 26 p.
Larkin, P.A. 1951. Summary of Investigation Conducted by the Fisheries Research Group, attached to the British Columbia Game Department in 1949. Report to the British Columbia Game Commission for 1949, pages 55-61.
Martin, A.D., and T.G. Northcote. 1991. Kootenay Lake: An Inappropriate Model for Mysis relicta Introduction in North Temperate Lakes American Fisheries Society Symposium 9:23-29, 1991.
Murphy, T.P. and M. Munawar. 1999. Aquatic Restoration in Canada. Backhuys Publishers, Leiden, 1999.
Northcote, T.G. 1973. Some Impacts of Man on Kootenay Lake and Its Salmonids. Great Lakes Fisheries Commission Tech. Rep. 25.
Pope, K.L and C. A. Kruse. 2001. Assessment of Fish Condition Data, Chapter 10 http://wfs.sdstate.edu/StatsProject/ch10_draft.pdf.
Redfish Consulting Ltd. 2003. Kootenay Lake Rainbow Trout Survey Questionnaire Results 2002-2003. Contract report prepared for the Nelson Fisheries Branch of the BC Ministry of Water, Land and Air Protection, Nelson, BC.
Redfish Consulting Ltd. 2002. Quantitative Assessment of Gerrard Rainbow Trout Fry at Established Index Sites on the Lardeau River, September 2002. Contract Report for the British Columbia Conservation Foundation.
Slaney, P.A. and H. Andrusak. 2003. Lardeau River Fish Habitat Assessments (2002) and Preliminary Gerrard Rainbow Trout Production Capability Modeling. PSlaney Aquatic Science Ltd. Contract Report for the Ministry of Water, Land and Air Protection, Nelson BC.
Thompson, L.C. 1999. Abundance and Production of Zooplankton and Kokanee Salmon (Oncorhynchus nerka) in Kootenay Lake, British Columbia During Artificial Fertilization. PHD Thesis University of British Columbia Vancouver BC. 252 p.
REDFISH CONSULTING LIMITED Page 18
Jan-Apr 1966
0
5
10
15
20
25
20 25 30 35 40 45 50 55 60 65 70 75 80 85 90 95 100Length (cm)
% F
requ
ency
n=45
May-June 1966
02468
101214
20 25 30 35 40 45 50 55 60 65 70 75 80 85 90 95 100
Length (cm)
% F
requ
ency
n=293
July-Sept 1966
0
5
10
15
20
20 25 30 35 40 45 50 55 60 65 70 75 80 85 90 95 100
Length (cm)
% F
requ
ency n=221
Oct-Dec 1966
0
5
10
15
20
20 25 30 35 40 45 50 55 60 65 70 75 80 85 90 95 100
Length (cm)
% F
requ
ency n=126
Figure 1. Percent (%) length-frequency occurrence of rainbow trout caught in
Kootenay Lake during the winter, spring, summer, and fall months of 1966.
REDFISH CONSULTING LIMITED Page 19
0
5
10
15
20
25
30
50 55 60 65 70 75 80 85 90 95 100
Length (cm)
% F
requ
ency
1979-2000 (N=202)1949-1959 (N=55)
Figure 2. Percent length-frequency of Gerrard rainbow trout spawners captured at
Gerrard, BC for select years 1949-1959 and 1979-2000. Note: no fish < 45 cm (1949-1959) and none < 55 cm from 1979-2000.
50
55
60
65
70
75
80
85
90
1949-59 1979 1980 1981 1982 1991 1992 1994 1998 2000
males
females
Figure 3. Mean size of male and female spawners captured at Gerrard, BC during
hatchery brood stock collections.
REDFISH CONSULTING LIMITED Page 20
1949-1959(N=37)
0
10
20
30
40
50
60
70
80
90
100
0 1 2 3 4 5 6 7
Age-at-Spawning
Leng
th (c
m)
8
Figure 4. Age-at-spawning for females captured at Gerrard, BC 1949-1959. Data
from Cartwright (1961).
1979-2000(N= 42)
0
10
20
30
40
50
60
70
80
90
100
0 1 2 3 4 5 6 7
Age-at-Spawning
Leen
gth
(cm
)
8
Figure 5. Age-at-spawning for females captured at Gerrard, BC 1979-2000. Data
from Ministry MOE files Nelson, BC.
REDFISH CONSULTING LIMITED Page 21
1966
0
10
20
30
40
50
60
70
80
90
0 1 2 3 4 5 6 7 8 9
Age
Leng
th (c
m)
n=96
Figure 6. Length-at-age and mean lengths of each age of rainbow trout captured in
Kootenay Lake, 1966. Scale samples were selected based on size categories, therefore, a positive bias for the smallest and largest sizes. Note: virtually all samples indicated some degree of summer growth; therefore for example, an age 6 is actually age 6+.
2004
0
10
20
30
40
50
60
70
80
90
100
0 1 2 3 4 5 6 7 8 9
Age
Leng
ht (c
m)
Length at ageMean length at age
N=148
Figure 7. Length-at-age and mean lengths of each age of rainbow trout captured in
Kootenay Lake, 2004. Positive bias in samples towards largest fish most of which were obtained during fishing derbies where a minimum size was imposed.
REDFISH CONSULTING LIMITED Page 22
0
5
10
15
20
25
30
35
40
45
50
55
60
65
70
75
80
85
90
0+ 1+ 2+ 3+ 4+ 5+ 6+ 7+ 8+
Age
Leng
th (c
m)
1966197320041974
Figure 8. Mean lengths-at-age for sport caught rainbow trout in Kootenay Lake, 1966,
1973, and 2004. The 2004 data is shown with summer growth (indicated with a "+") for comparison purposes with the 1966 and 1973 data. Also, approximate mean size for 0+ and 1+ from Irvine (1978) are shown to illustrate early juvenile Lardeau River growth.
REDFISH CONSULTING LIMITED Page 23
y = 4.1122x1.7481R2 = 0.8831
3000
4000
5000
6000
7000
8000
9000
10000
11000
12000
50 55 60 65 70 75 80 85 90 95
Length (cm)
# E
ggs/
fem
ale
N =19
Figure 9. Scatter plot of Gerrard rainbow trout female egg numbers vs. length
transformed to a power formula.
y = 1.7481x + 0.6141R2 = 0.8831
3.7
3.75
3.8
3.85
3.9
3.95
4
4.05
4.1
1.8 1.8 1.8 1.8 1.9 1.9 1.9 1.9 1.9 2.0
Log(10) length
Log(
10) e
ggs
Figure 10. Log 10 plot relationship of Gerrard rainbow trout female egg numbers vs.
length.
REDFISH CONSULTING LIMITED Page 24

REDFISH CONSULTING LIMITED Page 25
1966
40 60 80 100Length (cm)
1.0
3.2
5.4
7.6
9.8
12.0
Wei
ght (
kg)
1981-1992
40 60 80 100Length (cm)
1.0
3.2
5.4
7.6
9.8
12.0
Wei
ght (
kg)
1994-2004
40 60 80 100Length (cm)
1.0
3.2
5.4
7.6
9.8
12.0
Wei
ght (
kg)
y = 4E-06x 3.2548
R² = 0.9179 y = 4E-05x 2.7655
R² = 0.8064
y = 9E-06 x 3.1047
R² = 0.8743
Figure 11. Untransformed length-weight relationships for fish > 50 cm with power function equations for select years.
REDFISH CONSULTING LIMITED Page 26
1966
10 20 30 40 50 60Length (cm)
0.0
0.5
1.0
1.5
2.0
Wei
ght (
kg)
1994-2004
10 20 30 40 50 60Length (cm)
0.0
0.5
1.0
1.5
2.0
Wei
ght (
kg)
y = 4E-05x 2.685
R² = 0.9146 y = 7E-06x 3.1443
R² = 0.9217
Figure 12. Untransformed length-weight relationships for fish < 50 cm with power function equations for select years.
REDFISH CONSULTING LIMITED Page 27
0
50
100
150
200
250
300
350
92 93 94 95 96 97 98 99 00 01 02 03
Year
Tonn
es o
f Fer
tiliz
er (N
&P)
0
1
2
3
4
5
6
7
8
9
Wei
ght (
kg)
Fertilizer (N&P)Weight (Kg)
Figure 13. Mean weight of Schroeder Creek Resort derby caught rainbow trout
1995-2003 vs. the metric tonnes of N & P fertilizer released into the north arm of Kootenay Lake, 1992-2003.
0
50
100
150
200
250
300
350
92 93 94 95 96 97 98 99 00 01 02 03
Year
Tonn
es o
f Fer
tiliz
er (N
&P)
0
5
10
15
20
25
30
# Fi
sh C
augh
t
Fertilizer (N&P)# fish
Figure 14. Number of rainbow trout caught during Schroeder Creek Resort derby
1995-2003 vs. the metric tonnes of N & P fertilizer released into the north arm of Kootenay Lake, 1992-2003.
REDFISH CONSULTING LIMITED Page 28
REDFISH CONSULTING LIMITED Page 29
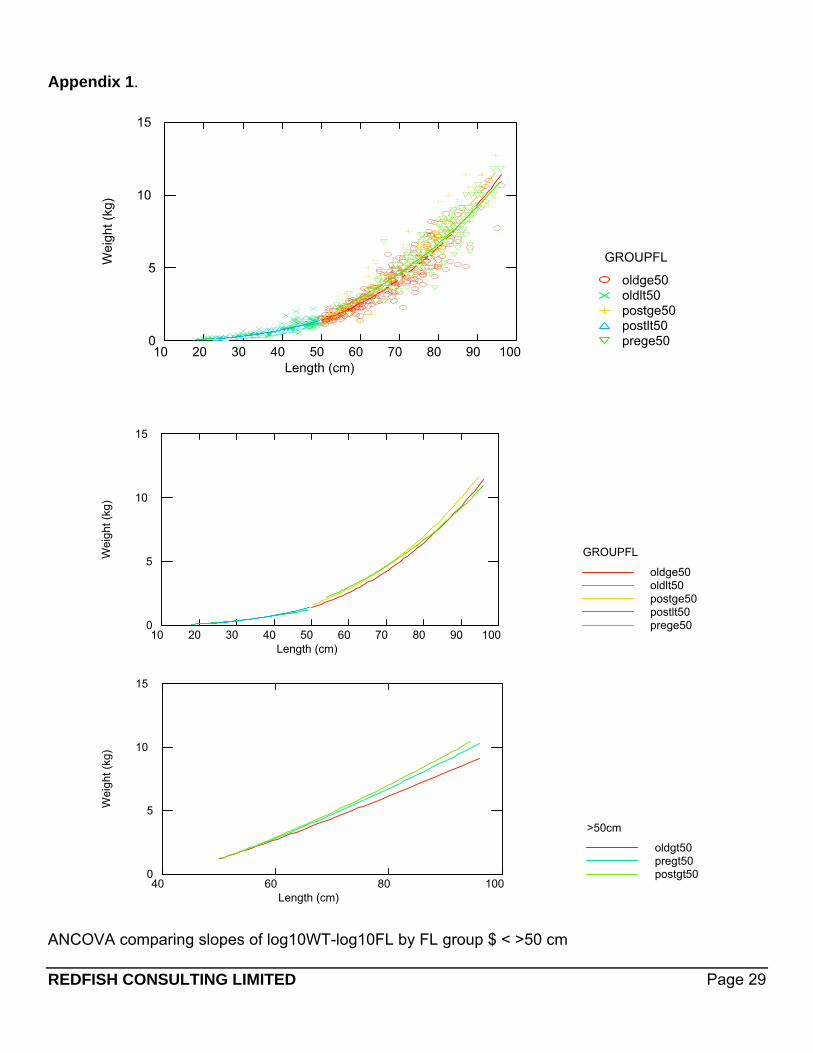
Appendix 1.
10 20 30 40 50 60 70 80 90 100Length (cm)
0
5
10
15W
eigh
t (kg
)
prege50postlt50postge50oldlt50oldge50
GROUPFL
10 20 30 40 50 60 70 80 90 100Length (cm)
0
5
10
15
Wei
ght (
kg)
prege50postlt50postge50oldlt50oldge50
GROUPFL
40 60 80 100Length (cm)
0
5
10
15
Wei
g ht (
kg)
postgt50pregt50oldgt50
>50cm
ANCOVA comparing slopes of log10WT-log10FL by FL group $ < >50 cm
REDFISH CONSULTING LIMITED Page 30
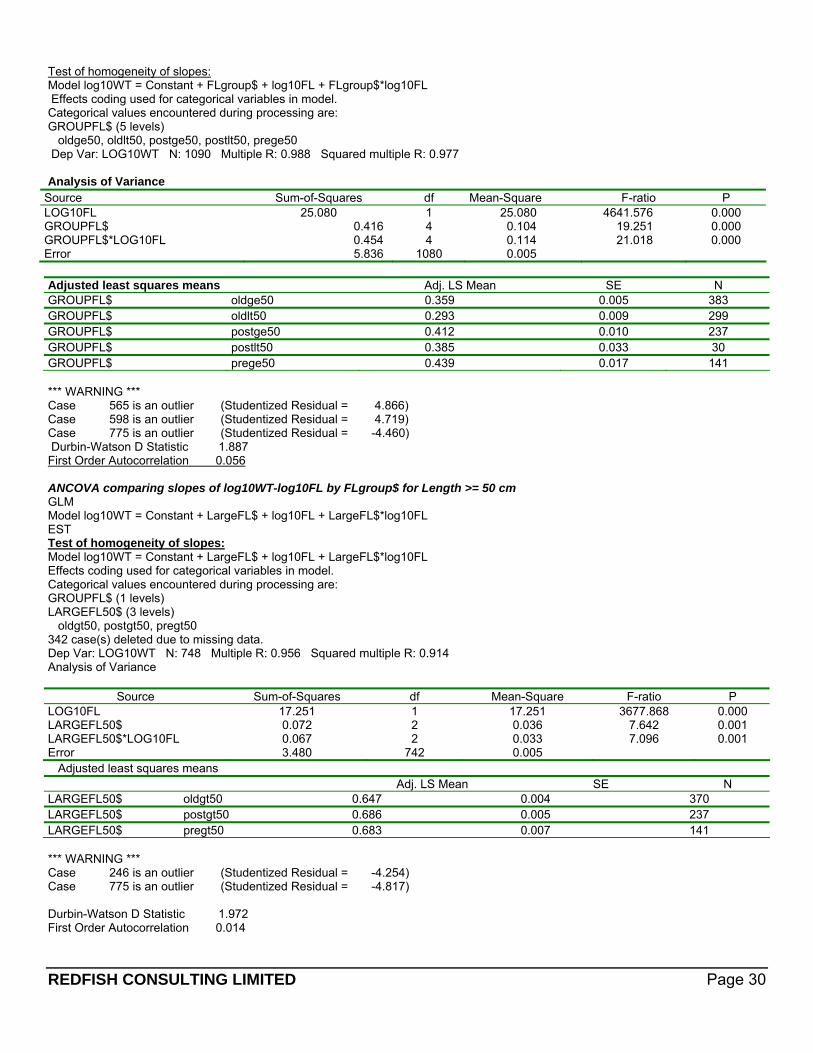
Test of homogeneity of slopes: Model log10WT = Constant + FLgroup$ + log10FL + FLgroup$*log10FL Effects coding used for categorical variables in model. Categorical values encountered during processing are: GROUPFL$ (5 levels) oldge50, oldlt50, postge50, postlt50, prege50 Dep Var: LOG10WT N: 1090 Multiple R: 0.988 Squared multiple R: 0.977 Analysis of Variance
Source Sum-of-Squares df Mean-Square F-ratio P LOG10FL 25.080 1 25.080 4641.576 0.000 GROUPFL$ 0.416 4 0.104 19.251 0.000 GROUPFL$*LOG10FL 0.454 4 0.114 21.018 0.000 Error 5.836 1080 0.005
Adjusted least squares means Adj. LS Mean SE N GROUPFL$ oldge50 0.359 0.005 383 GROUPFL$ oldlt50 0.293 0.009 299 GROUPFL$ postge50 0.412 0.010 237 GROUPFL$ postlt50 0.385 0.033 30 GROUPFL$ prege50 0.439 0.017 141 *** WARNING *** Case 565 is an outlier (Studentized Residual = 4.866) Case 598 is an outlier (Studentized Residual = 4.719) Case 775 is an outlier (Studentized Residual = -4.460) Durbin-Watson D Statistic 1.887 First Order Autocorrelation 0.056 ANCOVA comparing slopes of log10WT-log10FL by FLgroup$ for Length >= 50 cm GLM Model log10WT = Constant + LargeFL$ + log10FL + LargeFL$*log10FL EST Test of homogeneity of slopes: Model log10WT = Constant + LargeFL$ + log10FL + LargeFL$*log10FL Effects coding used for categorical variables in model. Categorical values encountered during processing are: GROUPFL$ (1 levels) LARGEFL50$ (3 levels) oldgt50, postgt50, pregt50 342 case(s) deleted due to missing data. Dep Var: LOG10WT N: 748 Multiple R: 0.956 Squared multiple R: 0.914 Analysis of Variance
Source Sum-of-Squares df Mean-Square F-ratio P LOG10FL 17.251 1 17.251 3677.868 0.000 LARGEFL50$ 0.072 2 0.036 7.642 0.001 LARGEFL50$*LOG10FL 0.067 2 0.033 7.096 0.001 Error 3.480 742 0.005 Adjusted least squares means
Adj. LS Mean SE N LARGEFL50$ oldgt50 0.647 0.004 370 LARGEFL50$ postgt50 0.686 0.005 237 LARGEFL50$ pregt50 0.683 0.007 141 *** WARNING *** Case 246 is an outlier (Studentized Residual = -4.254) Case 775 is an outlier (Studentized Residual = -4.817) Durbin-Watson D Statistic 1.972 First Order Autocorrelation 0.014
REDFISH CONSULTING LIMITED Page 31
Test of homogeneity of intercepts: Model log10WT = Constant + LargeFL$ + log10FL Effects coding used for categorical variables in model. Categorical values encountered during processing are: GROUPFL$ (1 levels) LARGEFL50$ (3 levels) oldgt50, postgt50, pregt50 342 case(s) deleted due to missing data. Dep Var: LOG10WT N: 748 Multiple R: 0.955 Squared multiple R: 0.912 Analysis of Variance Source Sum-of-Squares df Mean-Square F-ratio P LOG10FL 27.771 1 27.771 5825.328 0.000 LARGEFL50$ 0.217 2 .109 22.761 0.000 Error 3.547 744 0.005 Adjusted least squares means Adj. LS Mean SE N LARGEFL50$ oldgt50 0.644 0.004 370 LARGEFL50$ postgt50 0.685 0.005 237 LARGEFL50$ pregt50 0.668 0.006 141 *** WARNING *** Case 246 is an outlier (Studentized Residual = -4.176) Case 775 is an outlier (Studentized Residual = -4.693) Durbin-Watson D Statistic 1.925 First Order Autocorrelation 0.037 Post hoc comparisons of intercepts (adjusted means) using Tukey test:Post Hoc test of log10WT Using model MSE of 0.004 with 524 df COL/ ROW LARGEFL50$ 1 oldgt50 2 postgt50 3 pregt50 Using least squares means. Post Hoc test of LOG10WT Using model MSE of 0.005 with 744 df. Matrix of pair wise mean differences: 1 oldgt50 2 postgt50 3 pregt50 1 oldgt50 0.000 2 postgt50 0.041 0.000 3 pregt50 0.024 -0.017 0.000 Tukey HSD Multiple Comparisons. Matrix of pair wise comparison probabilities:
1 oldgt50 2 postgt50 3 pregt50 1 oldgt50 1.000 2 postgt50 0.000 1.000 3 pregt50 0.003 0.053 1.000 ANCOVA comparing slopes of log10WT-log10FL by FLgroup$ for Length<50 cm (Pre-fertilization PERIOD$ (1981-1992) data omitted because of no samples) "GLM Model log10WT = Constant + SmallFL$ + log10FL + SmallFL$*log10FL Test of homogeneity of slopes: Effects coding used for categorical variables in model. Categorical values encountered during processing are: GROUPFL$ (1 levels)
REDFISH CONSULTING LIMITED Page 32
SMALLFL50$ (2 levels) oldlt50, postlt50 761 case(s) deleted due to missing data. Dep Var: LOG10WT N: 329 Multiple R: 0.957 Squared multiple R: 0.915 Analysis of Variance Source Sum-of-Squares df Mean-Square F-ratio P LOG10FL 8.159 1 8.159 1133.342 0.000 SMALLFL50$ 0.056 1 0.056 7.725 0.006 SMALLFL50$*LOG10FL 0.054 1 0.054 7.569 0.006 Error 2.340 325 0.007 Adjusted least squares means Adj. LS Mean SE N SMALLFL50$ oldlt50 -0.235 0.005 299 SMALLFL50$ postlt50 -0.238 0.016 30 *** WARNING *** Case 565 is an outlier (Studentized Residual = 4.282) Case 598 is an outlier (Studentized Residual = 4.148) Durbin-Watson D Statistic 1.748 First Order Autocorrelation 0.125
1060 case(s) deleted due to missing data.
10 20 30 40 50Length (cm)
0.0
0.5
1.0
1.5
2.0
Wei
g ht (
kg)
pregt50oldgt50
>50cm
Separate regressions for small fish by PERIOD$ Post < 50cm: Eigenvalues of unit scaled X'X 1 2 1.998 0.002 Condition indices 1 2 1.000 33.259 Variance proportions
1 2 CONSTANT 0.001 0.999 LOG10POST<50 length 0.001 0.999 Dep Var: LOG10SMPOSTWT N: 30 Multiple R: 0.960 Squared multiple R: 0.922 Adjusted squared multiple R: 0.919 Standard error of estimate: 0.089 Effect Coefficient Std Error Std Coef Tolerance t P(2 Tail) CONSTANT -5.161 0.269 0.000 . -19.183 0.000 LOG10POST<50 length 3.144 0.173 0.960 1.000 18.156 0.000
REDFISH CONSULTING LIMITED Page 33
Effect Coefficient Lower 95% Upper 95% CONSTANT -5.161 -5.713 -4.610 LOG10POST<50 length 3.144 2.790 3.499 Analysis of Variance Source Sum-of-Squares df Mean-Square F-ratio P Regression 2.584 1 2.584 329.641 0.000 Residual 0.219 28 0.008 *** WARNING *** Case 6 is an outlier (Studentized Residual = 3.041) Durbin-Watson D Statistic 1.802 First Order Autocorrelation 0.093 Separate regressions for small fish by PERIOD$ Post vs Old < 50cm 791 case(s) deleted due to missing data. Eigenvalues of unit scaled X'X 1 2 1.998 0.002 Condition indices 1 2 1.000 30.532 Variance proportions 1 2 CONSTANT 0.001 0.999 LOG10OLD<50 cm length 0.001 0.999 Dep Var: LOG10OLDWTS N: 299 Multiple R: 0.956 Squared multiple R: 0.914 Adjusted squared multiple R: 0.914 Standard error of estimate: 0.084 Effect Coefficient Std Error Std Coef Tolerance t P(2 Tail) CONSTANT -4.415 0.075 0.000 . -59.126 0.000 LOG10OLD<50 cm length 2.669 0.048 0.956 1.000 56.148 0.000 Effect Coefficient Lower 95% Upper 95% CONSTANT -4.415 -4.562 -4.268 LOG10OLD<50 cm length 2.669 2.576 2.763 Analysis of Variance Source Sum-of-Squares df Mean-Square F-ratio P Regression 22.504 1 22.504 3152.552 0.000 Residual 2.120 297 0.007 *** WARNING *** Case 182 is an outlier (Studentized Residual = 4.312) Case 215 is an outlier (Studentized Residual = 4.177) Durbin-Watson D Statistic 1.737 First Order Autocorrelation 0.130 ANCOVA comparing slopes of log10WT-log10FL by GROUP65$ for Length 65 cm Test of homogeneity of slopes: Model log10WT = Constant + GROUP65$ + log10FL + GROUP65$ *log10FL Effects coding used for categorical variables in model. Categorical values encountered during processing are: GROUP65$ (6 levels) oldge65, oldlt65, postge65, postlt65, prege65, prelt65 Dep Var: LOG10WT N: 1090 Multiple R: 0.988 Squared multiple R: 0.977
REDFISH CONSULTING LIMITED Page 34
Analysis of Variance
Source Sum-of-Squares df Mean-Square F-ratio P
LOG10FL 1.361 1 1.361 248.385 0.000 GROUP65$ 0.167 5 0.033 6.079 0.000 GROUP65$*LOG10FL 0.174 5 0.035 6.338 0.000 Error 5.906 1078 0.005 Adjusted least squares means Adj. LS Mean SE N
GROUP65$ 1966>65 0.416 0.016 219 GROUP65$ 1966<65 0.333 0.005 463 GROUP65$ 1994-2004>65 0.443 0.018 203 GROUP65$ 1994-2004<65 0.406 0.012 64 GROUP65$ 1981-1992>65 0.445 0.021 135 GROUP65$ 1981-1992<65 0.429 0.033 6 *** WARNING *** Case 212 is an outlier (Studentized Residual = 4.616) Case 245 is an outlier (Studentized Residual = 4.410) Case 422 is an outlier (Studentized Residual = -4.406) Durbin-Watson D Statistic 1.863 First Order Autocorrelation 0.068 ANCOVA comparing slopes of log10WT-log10FL by GROUP65$ for Length >65 cm Test of homogeneity of slopes Effects coding used for categorical variables in model. Categorical values encountered during processing are: GROUP65FL$ (3 levels) 1966, 1981-1992, 1994-2004 533 case(s) deleted due to missing data. Dep Var: LOG10WT N: 557 Multiple R: 0.884 Squared multiple R: 0.781 Analysis of Variance Source Sum-of-Squares df Mean-Square F-ratio P LOG10FL 6.549 1 6.549 1608.215 0.000 GROUP65FL$ 0.003 2 0.001 0.317 0.728 GROUP65FL$*LOG10FL 0.003 2 0.002 0.389 0.678 Error 2.244 551 0.004 Adjusted least squares means Adj. LS Mean SE N GROUP65FL$ 1966 0.750 0.005 219 GROUP65FL$ 1981-1992 0.775 0.006 135 GROUP65FL$ 1994-2004 0.790 0.005 203 *** WARNING *** Case 953 is an outlier (Studentized Residual = -4.833) Durbin-Watson D Statistic 1.875 First Order Autocorrelation 0.062 Test of homogeneity of intercepts Effects coding used for categorical variables in model. Categorical values encountered during processing are: GROUP65FL$ (3 levels) 1966, 1981-1992, 1994-2004 533 case(s) deleted due to missing data.
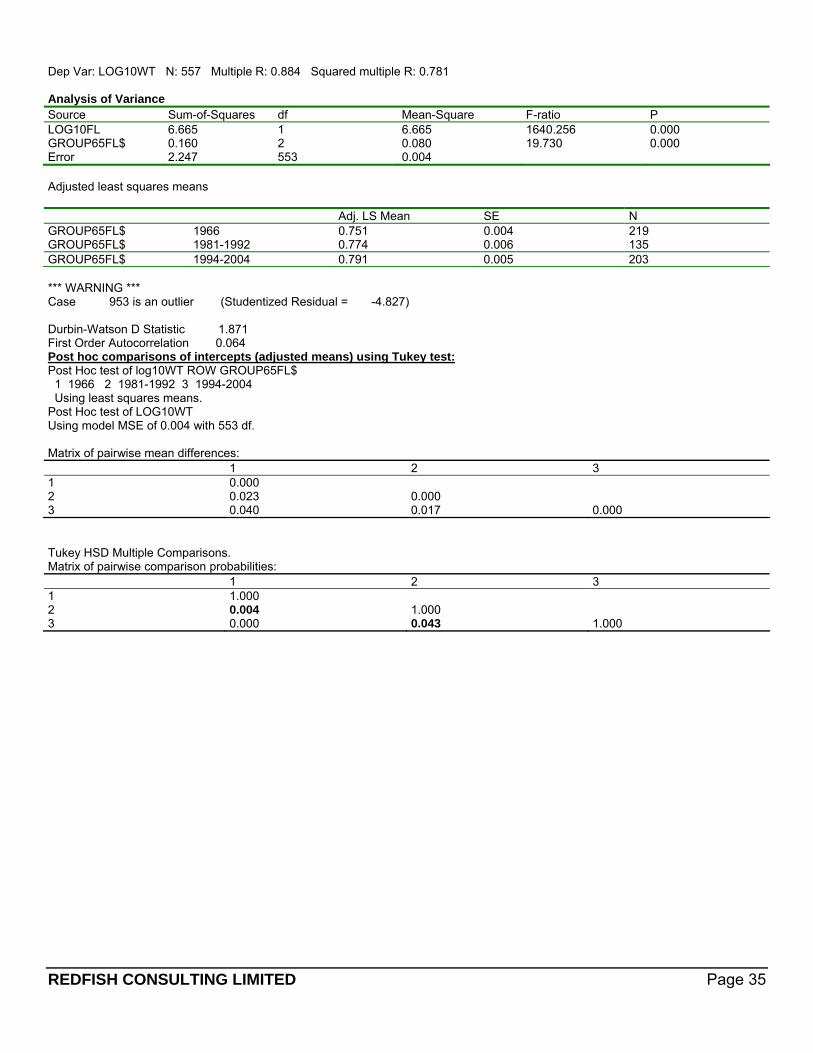
REDFISH CONSULTING LIMITED Page 35
Dep Var: LOG10WT N: 557 Multiple R: 0.884 Squared multiple R: 0.781 Analysis of Variance Source Sum-of-Squares df Mean-Square F-ratio P LOG10FL 6.665 1 6.665 1640.256 0.000 GROUP65FL$ 0.160 2 0.080 19.730 0.000 Error 2.247 553 0.004 Adjusted least squares means Adj. LS Mean SE N GROUP65FL$ 1966 0.751 0.004 219 GROUP65FL$ 1981-1992 0.774 0.006 135 GROUP65FL$ 1994-2004 0.791 0.005 203 *** WARNING *** Case 953 is an outlier (Studentized Residual = -4.827) Durbin-Watson D Statistic 1.871 First Order Autocorrelation 0.064 Post hoc comparisons of intercepts (adjusted means) using Tukey test:Post Hoc test of log10WT ROW GROUP65FL$ 1 1966 2 1981-1992 3 1994-2004 Using least squares means. Post Hoc test of LOG10WT Using model MSE of 0.004 with 553 df. Matrix of pairwise mean differences: 1 2 3 1 0.000 2 0.023 0.000 3 0.040 0.017 0.000 Tukey HSD Multiple Comparisons. Matrix of pairwise comparison probabilities: 1 2 3 1 1.000 2 0.004 1.000 3 0.000 0.043 1.000


![The Fecundity of Freshwater Prawn (Macrobrachiumrosenbergii) … · According to [14], [7] and [9] the fecundity of wild population of giant freshwater prawn is ranged from 60000](https://img.pdfslide.us/doc/110x75/6129d6536ff061635c49ba2f/the-fecundity-of-freshwater-prawn-macrobrachiumrosenbergii-according-to-14.jpg)