Embed Size (px)
Citation preview
FLORIDA DEPARTMENT OF ENVIRONMENTAL PROTECTION
Division of Environmental Assessment and Restoration, Bureau of Watershed Restoration
SOUTHWEST DISTRICT • TAMPA BAY BASIN
Final TMDL Report
Fecal Coliform TMDL for Alligator Creek (WBID 1574)
David Tyler
August 19, 2009
TMDL Report: Tampa Bay Basin, Alligator Creek (WBID 1574), Fecal Coliform, August 2009
Florida Department of Environmental Protection
ii
Acknowledgments
This Total Maximum Daily Load (TMDL) analysis could not have been accomplished without significant contributions from staff in Pinellas County, the Florida Department of Environmental Protection’s Southwest District Office, and its Watershed Evaluation and TMDL Section in Tallahassee. Editorial assistance provided by Jan Mandrup-Poulsen and Linda Lord. For additional information on the watershed management approach and impaired waters in the Tampa Bay Basin, contact: Terry Hansen Florida Department of Environmental Protection Bureau of Watershed Restoration Watershed Planning and Coordination Section 2600 Blair Stone Road, Mail Station 3565 Tallahassee, FL 32399-2400 Email: [email protected] Phone: (850) 245–8561 Fax: (850) 245–8434 Access to all data used in the development of this report can be obtained by contacting: David Tyler Florida Department of Environmental Protection Bureau of Watershed Restoration Watershed Evaluation and TMDL Section 2600 Blair Stone Road, Mail Station 3555 Tallahassee, FL 32399-2400 Email: [email protected] Phone: (850) 245–8458 Fax: (850) 245–8536
TMDL Report: Tampa Bay Basin, Alligator Creek (WBID 1574), Fecal Coliform, August 2009
Florida Department of Environmental Protection
iii
Contents
Chapter 1: INTRODUCTION ___________________________________ 1
1.1 Purpose of Report _____________________________________________ 1
1.2 Identification of Waterbody ______________________________________ 1
1.3 Background __________________________________________________ 1
Chapter 2: DESCRIPTION OF WATER QUALITY PROBLEM ________ 5
2.1 Statutory Requirements and Rulemaking History ___________________ 5 2.2 Information on Verified Impairment _______________________________ 5
Chapter 3. DESCRIPTION OF APPLICABLE WATER QUALITY STANDARDS AND TARGETS _______________________ 7
3.1 Classification of the Waterbody and Criteria Applicable to the TMDL ___ 7
3.2 Applicable Water Quality Standards and Numeric Water Quality Target ______________________________________________________ 7
Chapter 4: ASSESSMENT OF SOURCES ________________________ 8
4.1 Types of Sources ______________________________________________ 8
4.2 Potential Sources of Fecal Coliform in the Alligator Creek Watershed ___________________________________________________ 8 4.2.1 Point Sources ___________________________________________ 8
Municipal Separate Storm Sewer System Permittees _________________________ 8 4.2.2 Land Uses and Nonpoint Sources ___________________________ 8
Wildlife ______________________________________________________________ 9 Agricultural Animals ____________________________________________________ 9 Land Uses ___________________________________________________________ 9 Urban Development___________________________________________________ 10 Septic Tanks ________________________________________________________ 13 Sanitary Sewer Overflows ______________________________________________ 15 Nonpoint Source Summary _____________________________________________ 16
Chapter 5: DETERMINATION OF ASSIMILATIVE CAPACITY _______ 17
5.1 Determination of Loading Capacity ______________________________ 17 5.1.1 Data Used in the Determination of the TMDL __________________ 17 5.1.2 TMDL Development Process for Alligator Creek _______________ 17
Develop the Flow Duration Curve ________________________________________ 17 Develop the Load Duration Curves for Both the Allowable Load and Existing Loading Capacity ______________________________________________ 19 Define the Critical Condition ____________________________________________ 20
TMDL Report: Tampa Bay Basin, Alligator Creek (WBID 1574), Fecal Coliform, August 2009
Florida Department of Environmental Protection
iv
Establish the Needed Load Reduction by Comparing the Existing Load with the Allowable Load under the Critical Condition _____________________________ 21
5.1.3 Critical Condition/Seasonality ______________________________ 22 5.1.4 Spatial Patterns _________________________________________ 23
Chapter 6: DETERMINATION OF THE TMDL ____________________ 24
6.1 Expression and Allocation of the TMDL __________________________ 24
6.2 Load Allocation ______________________________________________ 25
6.3 Wasteload Allocation __________________________________________ 25 6.3.1 NPDES Wastewater Discharges ____________________________ 25 6.3.2 NPDES Stormwater Discharges ____________________________ 25
6.4 Margin of Safety ______________________________________________ 25
Chapter 7: NEXT STEPS: IMPLEMENTATION PLAN DEVELOPMENT AND BEYOND _____________________ 26
7.1 Basin Management Action Plan _________________________________ 26
References _______________________________________________ 27
Appendices _______________________________________________ 29
Appendix A: Background Information on Federal and State Stormwater Programs ___________________________________________________ 29
TMDL Report: Tampa Bay Basin, Alligator Creek (WBID 1574), Fecal Coliform, August 2009
Florida Department of Environmental Protection
v
List of Tables
Table 2.1. Verified Impairments for Alligator Creek (WBID 1574) ....................... 6 Table 2.2. Summary of Fecal Coliform Data for Alligator Creek (WBID
1574) During the Verified Period (January 1, 2000–June 30, 2007) ....................................................................................................... 6
Table 4.1. Classification of Land Use Categories for the Alligator Creek Watershed (WBID 1574) ...................................................................... 10
Table 4.2. Concentrations (Geometric Mean Colonies/100 mL) of Fecal Coliform from Urban Source Areas (Steuer et al., 1997; Bannerman et al., 1993) ....................................................................... 12
Table 4.3. Dog Population Density, Wasteload, and Fecal Coliform Density .................................................................................................. 12
Table 4.4. Estimated Septic Numbers and Septic Failure Rates for Pinellas County, 2002–07 .................................................................... 15
Table 4.5. Estimated Fecal Coliform Loadings from Dogs, Septic Tanks, and SSOs in the Alligator Creek Watershed (WBID 1574) ................ 16
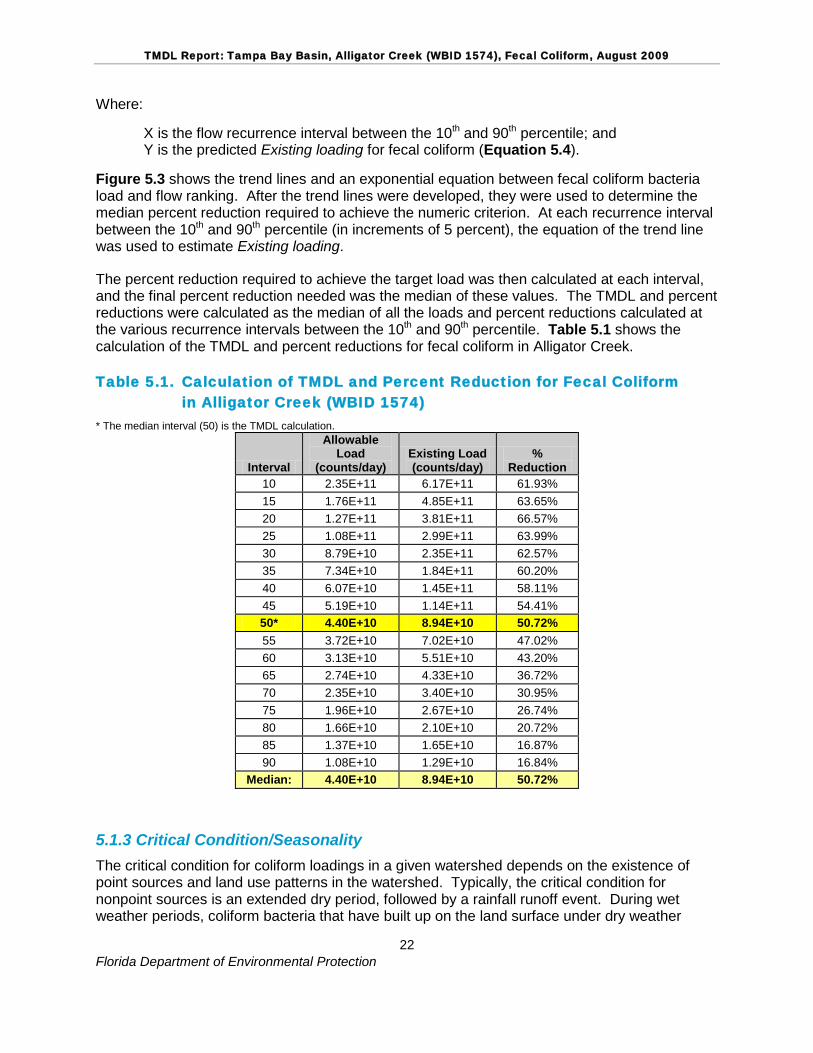
Table 5.1. Calculation of TMDL and Percent Reduction for Fecal Coliform in Alligator Creek (WBID 1574) ........................................................... 22
Table 5.2. Station Summary Statistics of Fecal Coliform Data for Alligator Creek (WBID 1574) ............................................................................... 23
Table 6.1. TMDL Components for Fecal Coliform in Alligator Creek (WBID 1574) ..................................................................................................... 25
TMDL Report: Tampa Bay Basin, Alligator Creek (WBID 1574), Fecal Coliform, August 2009
Florida Department of Environmental Protection
vi
List of Figures
Figure 1.1. Location of the Alligator Creek Watershed in the Tampa Bay Basin and Major Geopolitical Features in the Area ............................ 2
Figure 1.2. Location of Alligator Creek (WBID 1574) in the Cities of Clearwater and Safety Harbor............................................................... 3
Figure 2.1. Fecal Coliform Measurements for Alligator Creek (WBID 1574) During the Verified Period (January 2000–June 2007) ....................... 6
Figure 4.1. Principal Land Uses in the Alligator Creek Watershed (WBID 1574) in 2006 ........................................................................................ 11
Figure 4.2. Distribution of Onsite Sewage Systems (Septic Tanks) in the Alligator Creek Watershed (WBID 1574) ............................................ 14
Figure 5.1. Locations of Water Quality Stations for Alligator Creek (WBID 1574) ..................................................................................................... 18
Figure 5.2. Flow Duration Curve for USGS Gage 02307671 (1982–2009) ........... 19 Figure 5.3. Load Duration Curve for Fecal Coliform in Alligator Creek
(WBID 1574) .......................................................................................... 21
TMDL Report: Tampa Bay Basin, Alligator Creek (WBID 1574), Fecal Coliform, August 2009
Florida Department of Environmental Protection
vii
Websites
Florida Department of Environmental Protection, Bureau of Watershed Restoration
TMDL Program
http://www.dep.state.fl.us/water/tmdl/index.htm
Identification of Impaired Surface Waters Rule
http://www.dep.state.fl.us/legal/Rules/shared/62-303/62-303.pdf
STORET Program
http://www.dep.state.fl.us/water/storet/index.htm
2008 Integrated Report
http://www.dep.state.fl.us/water/docs/2008_Integrated_Report.pdf
Criteria for Surface Water Quality Classifications
http://www.dep.state.fl.us/water/wqssp/classes.htm
Basin Status Report for the Tampa Bay Basin
http://www.dep.state.fl.us/water/basin411/tampa/status.htm
Basin Water Quality Assessment Report for the Tampa Bay Basin
http://www.dep.state.fl.us/water/basin411/tampa/assessment.htm U.S. Environmental Protection Agency
Region 4: Total Maximum Daily Loads in Florida
http://www.epa.gov/region4/water/tmdl/florida/
National STORET Program
http://www.epa.gov/storet/

TMDL Report: Tampa Bay Basin, Alligator Creek (WBID 1574), Fecal Coliform, August 2009
Florida Department of Environmental Protection
1
Chapter 1: INTRODUCTION
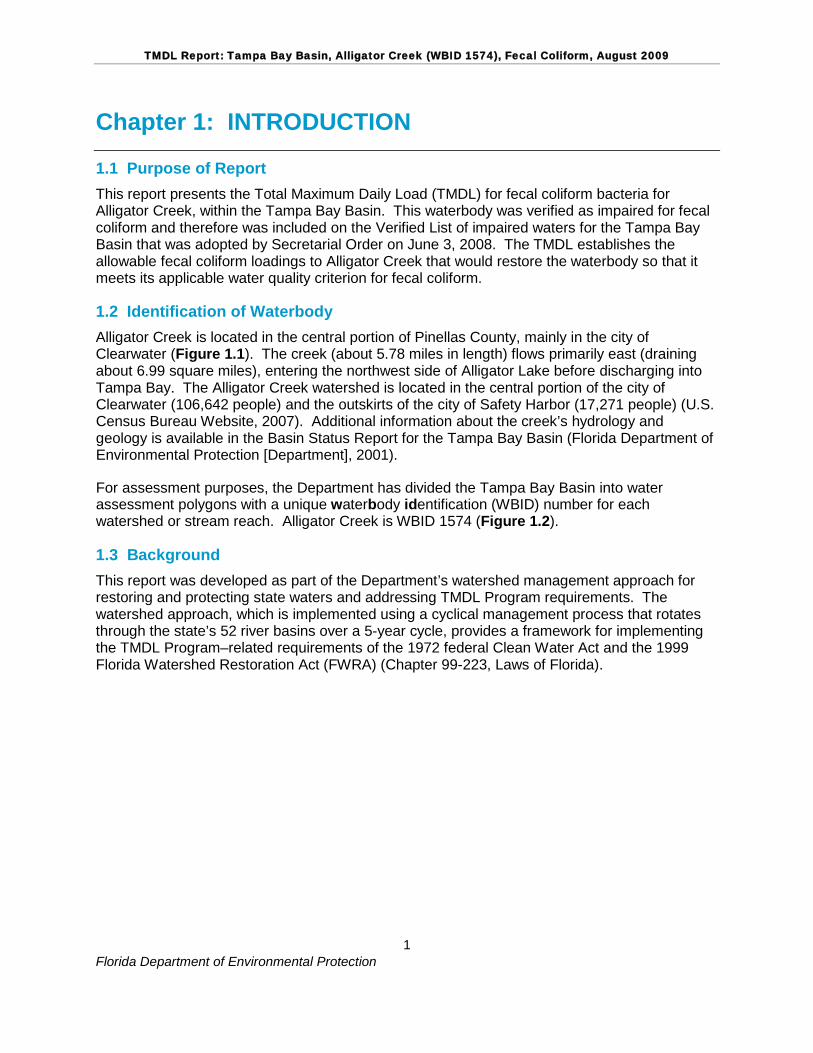
1.1 Purpose of Report This report presents the Total Maximum Daily Load (TMDL) for fecal coliform bacteria for Alligator Creek, within the Tampa Bay Basin. This waterbody was verified as impaired for fecal coliform and therefore was included on the Verified List of impaired waters for the Tampa Bay Basin that was adopted by Secretarial Order on June 3, 2008. The TMDL establishes the allowable fecal coliform loadings to Alligator Creek that would restore the waterbody so that it meets its applicable water quality criterion for fecal coliform.
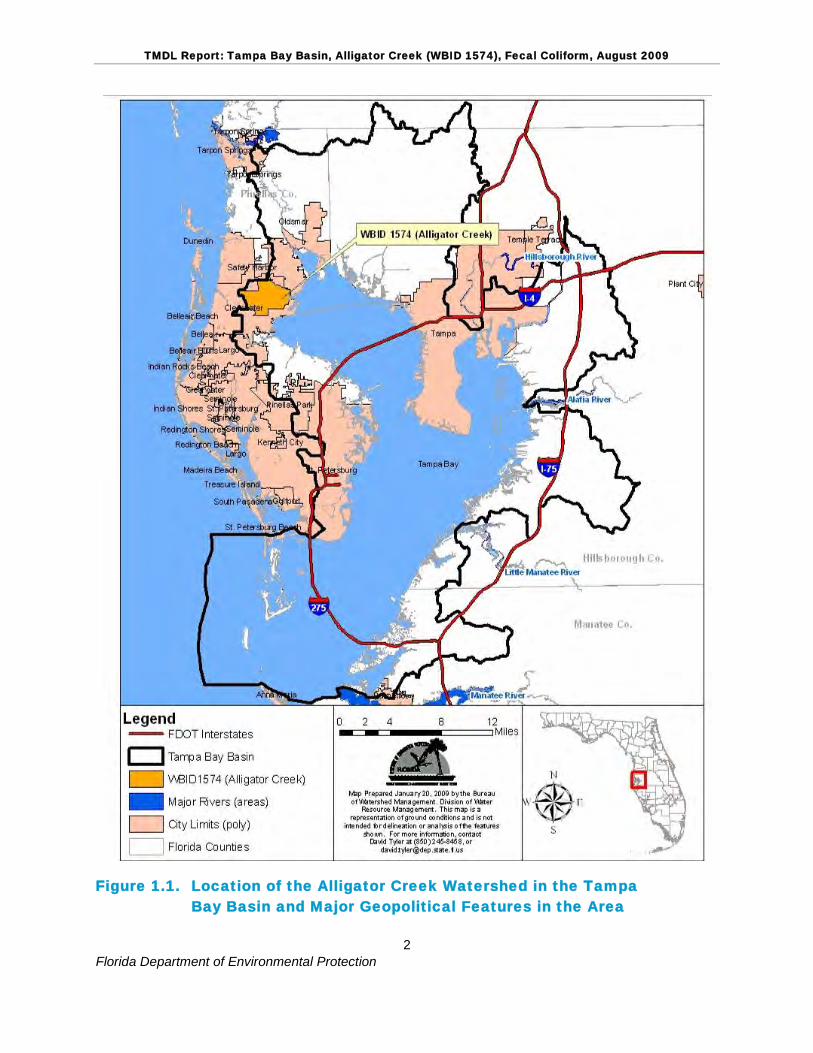
1.2 Identification of Waterbody Alligator Creek is located in the central portion of Pinellas County, mainly in the city of Clearwater (Figure 1.1). The creek (about 5.78 miles in length) flows primarily east (draining about 6.99 square miles), entering the northwest side of Alligator Lake before discharging into Tampa Bay. The Alligator Creek watershed is located in the central portion of the city of Clearwater (106,642 people) and the outskirts of the city of Safety Harbor (17,271 people) (U.S. Census Bureau Website, 2007). Additional information about the creek’s hydrology and geology is available in the Basin Status Report for the Tampa Bay Basin (Florida Department of Environmental Protection [Department], 2001).
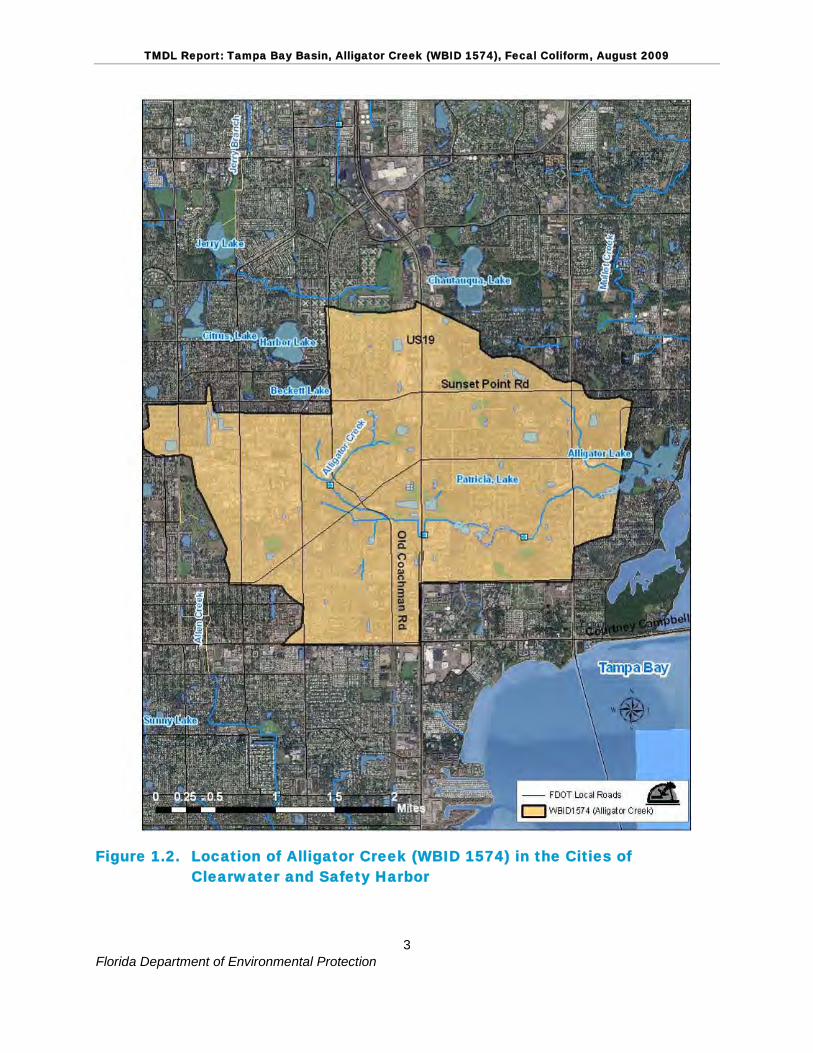
For assessment purposes, the Department has divided the Tampa Bay Basin into water assessment polygons with a unique waterbody identification (WBID) number for each watershed or stream reach. Alligator Creek is WBID 1574 (Figure 1.2).
1.3 Background This report was developed as part of the Department’s watershed management approach for restoring and protecting state waters and addressing TMDL Program requirements. The watershed approach, which is implemented using a cyclical management process that rotates through the state’s 52 river basins over a 5-year cycle, provides a framework for implementing the TMDL Program–related requirements of the 1972 federal Clean Water Act and the 1999 Florida Watershed Restoration Act (FWRA) (Chapter 99-223, Laws of Florida).
TMDL Report: Tampa Bay Basin, Alligator Creek (WBID 1574), Fecal Coliform, August 2009
Florida Department of Environmental Protection
2
Figure 1.1. Location of the Alligator Creek Watershed in the Tampa Bay Basin and Major Geopolitical Features in the Area
TMDL Report: Tampa Bay Basin, Alligator Creek (WBID 1574), Fecal Coliform, August 2009
Florida Department of Environmental Protection
3
Figure 1.2. Location of Alligator Creek (WBID 1574) in the Cities of Clearwater and Safety Harbor
TMDL Report: Tampa Bay Basin, Alligator Creek (WBID 1574), Fecal Coliform, August 2009
Florida Department of Environmental Protection
4
A TMDL represents the maximum amount of a given pollutant that a waterbody can assimilate and still meet water quality standards, including its applicable water quality criteria and its designated uses. TMDLs are developed for waterbodies that are verified as not meeting their water quality standards. They provide important water quality restoration goals that will guide restoration activities.
This TMDL Report will be followed by the development and implementation of a Basin Management Action Plan, or BMAP, designed to reduce the amount of fecal coliform that caused the verified impairment of Alligator Creek (WBID 1574). These activities will depend heavily on the active participation of the Southwest Florida Water Management District (SWFWMD), Pinellas County’s Department of Environmental Management (PDEM), local governments, businesses, and other stakeholders. The Department will work with these organizations and individuals to undertake or continue reductions in the discharge of pollutants and achieve the established TMDLs for impaired waterbodies.
TMDL Report: Tampa Bay Basin, Alligator Creek (WBID 1574), Fecal Coliform, August 2009
Florida Department of Environmental Protection
5
Chapter 2: DESCRIPTION OF WATER QUALITY
PROBLEM
2.1 Statutory Requirements and Rulemaking History Section 303(d) of the federal Clean Water Act requires states to submit to the U.S. Environmental Protection Agency (EPA) lists of surface waters that do not meet applicable water quality standards (impaired waters) and establish a TMDL for each pollutant causing impairment of listed waters on a schedule. The Department has developed such lists, commonly referred to as 303(d) lists, since 1992. The list of impaired waters in each basin, referred to as the Verified List, is also required by the FWRA (Subsection 403.067[4], Florida Statutes [F.S.]); the state’s 303(d) list is amended annually to include basin updates.
Florida’s 1998 303(d) list included 47 waterbodies in the Tampa Bay Basin. However, the FWRA (Section 403.067, F.S.) stated that all previous Florida 303(d) lists were for planning purposes only and directed the Department to develop, and adopt by rule, a new science-based methodology to identify impaired waters. After a long rulemaking process, the Environmental Regulation Commission adopted the new methodology as Rule 62-303, Florida Administrative Code (F.A.C.) (Identification of Impaired Surface Waters Rule, or IWR), in April 2001; the rule was modified in 2006 and 2007.
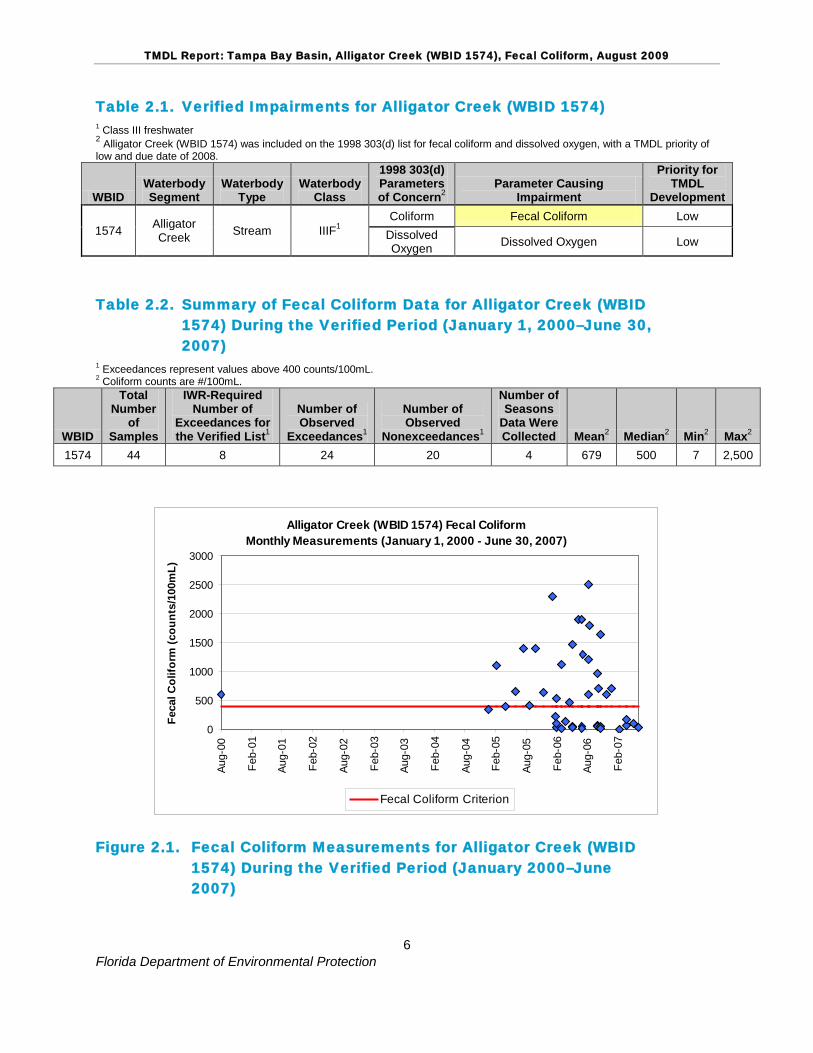
2.2 Information on Verified Impairment The Department used the IWR to assess water quality impairments in Alligator Creek and verified the impairments during the second cycle of the TMDL Program (Table 2.1). Table 2.2 summarizes the fecal coliform data collected during the verified period (January 1, 2000, through June 30, 2007). The projected year for the 1998 303(d) listed fecal coliform bacteria TMDL for Alligator Creek was 2008, but the Settlement Agreement between the EPA and Earthjustice, which drives the TMDL development schedule for waters on the 1998 303(d) list, allows an additional nine months to complete the TMDL. As such, this TMDL must be adopted and submitted to the EPA by September 30, 2009.
This waterbody was verified as impaired based on fecal coliform because, using the IWR methodology, more than 10 percent of the values exceeded the Class III freshwater criterion of 400 counts per 100 milliliters (counts/100mL) for fecal coliform (24 out of 44 samples in the verified period exceeded the criterion). The fecal coliform data used in this report are based on the IWR Run35 database.
The verified impairments were based on data collected by Pinellas County and the Department’s Southwest District. Figure 1.2 shows the WBID location, and Figure 5.1 shows the STORET monitoring stations. Figure 2.1 displays the fecal coliform data collected during the verified period (January 1, 2000–June 30, 2007) for Alligator Creek.
TMDL Report: Tampa Bay Basin, Alligator Creek (WBID 1574), Fecal Coliform, August 2009
Florida Department of Environmental Protection
6
Table 2.1. Verified Impairments for Alligator Creek (WBID 1574) 1 Class III freshwater 2 Alligator Creek (WBID 1574) was included on the 1998 303(d) list for fecal coliform and dissolved oxygen, with a TMDL priority of low and due date of 2008.
WBID Waterbody Segment
Waterbody Type
Waterbody Class
1998 303(d) Parameters of Concern2
Parameter Causing Impairment
Priority for TMDL
Development
1574 Alligator Creek Stream IIIF
Coliform 1
Fecal Coliform Low Dissolved Oxygen Dissolved Oxygen Low
Table 2.2. Summary of Fecal Coliform Data for Alligator Creek (WBID 1574) During the Verified Period (January 1, 2000–June 30, 2007)
1 Exceedances represent values above 400 counts/100mL. 2
WBID
Coliform counts are #/100mL. Total
Number of
Samples
IWR-Required Number of
Exceedances for the Verified List
Number of Observed
Exceedances1
Number of Observed
Nonexceedances1
Number of Seasons
Data Were Collected 1 Mean Median2 Min2 Max2
1574
2 44 8 24 20 4 679 500 7 2,500
Figure 2.1. Fecal Coliform Measurements for Alligator Creek (WBID 1574) During the Verified Period (January 2000–June 2007)
Alligator Creek (WBID 1574) Fecal Coliform Monthly Measurements (January 1, 2000 - June 30, 2007)
0
500
1000
1500
2000
2500
3000
Aug-
00
Feb-
01
Aug-
01
Feb-
02
Aug-
02
Feb-
03
Aug-
03
Feb-
04
Aug-
04
Feb-
05
Aug-
05
Feb-
06
Aug-
06
Feb-
07
Feca
l Col
iform
(cou
nts/
100m
L)
Fecal Coliform Criterion
TMDL Report: Tampa Bay Basin, Alligator Creek (WBID 1574), Fecal Coliform, August 2009
Florida Department of Environmental Protection
7
Chapter 3. DESCRIPTION OF APPLICABLE WATER
QUALITY STANDARDS AND TARGETS
3.1 Classification of the Waterbody and Criteria Applicable to the TMDL Florida’s surface waters are protected for five designated use classifications, as follows:
Class I Potable water supplies Class II Shellfish propagation or harvesting Class III Recreation, propagation, and maintenance of a healthy, well-
balanced population of fish and wildlife Class IV Agricultural water supplies Class V Navigation, utility, and industrial use (there are no state waters
currently in this class) Alligator Creek (WBID 1574) is a Class III waterbody, with a designated use of recreation, propagation, and the maintenance of a healthy, well-balanced population of fish and wildlife. The criterion applicable to this TMDL is the Class III criterion for fecal coliform.
3.2 Applicable Water Quality Standards and Numeric Water Quality Target Numeric criteria for bacterial quality are expressed in terms of fecal coliform bacteria concentration. The water quality criterion for the protection of Class III waters, as established by Rule 62-302, F.A.C., states the following:
Fecal Coliform Bacteria: The most probable number (MPN) or membrane filter (MF) counts per 100 mL of fecal coliform bacteria shall not exceed a monthly average of 200, nor exceed 400 in 10 percent of the samples, nor exceed 800 on any one day.
The criterion states state that monthly averages shall be expressed as geometric means based on a minimum of 10 samples taken over a 30-day period. During the development of the TMDL (as described in subsequent sections), there were insufficient data (fewer than 10 samples in a given month) available to evaluate the geometric mean criterion for fecal coliform bacteria. Therefore, the criterion selected for the TMDL was not to exceed 400 MPN/100mL in any sampling event for fecal coliform. The 10 percent exceedance allowed by the water quality criterion for fecal coliform bacteria was not used directly in estimating the target load, but was included in the TMDL margin of safety (as described in subsequent chapters).
TMDL Report: Tampa Bay Basin, Alligator Creek (WBID 1574), Fecal Coliform, August 2009
Florida Department of Environmental Protection
8
Chapter 4: ASSESSMENT OF SOURCES
4.1 Types of Sources An important part of the TMDL analysis is the identification of pollutant source categories, source subcategories, or individual sources of pollutants in the impaired waterbody and the amount of pollutant loadings contributed by each of these sources. Sources are broadly classified as either “point sources” or “nonpoint sources.” Historically, the term “point sources” has meant discharges to surface waters that typically have a continuous flow via a discernable, confined, and discrete conveyance, such as a pipe. Domestic and industrial wastewater treatment facilities (WWTFs) are examples of traditional point sources. In contrast, the term “nonpoint sources” was used to describe intermittent, rainfall-driven, diffuse sources of pollution associated with everyday human activities, including runoff from urban land uses, agriculture, silviculture, and mining; discharges from failing septic systems; and atmospheric deposition.
However, the 1987 amendments to the Clean Water Act redefined certain nonpoint sources of pollution as point sources subject to regulation under the EPA’s National Pollutant Discharge Elimination System (NPDES) Program. These nonpoint sources included certain urban stormwater discharges, such as those from local government master drainage systems, construction sites over five acres, and a wide variety of industries (see Appendix A for background information on the federal and state stormwater programs).
To be consistent with Clean Water Act definitions, the term “point source” will be used to describe traditional point sources (such as domestic and industrial wastewater discharges) and stormwater systems requiring an NPDES stormwater permit when allocating pollutant load reductions required by a TMDL (see Section 6.1). However, the methodologies used to estimate nonpoint source loads do not distinguish between NPDES stormwater discharges and non-NPDES stormwater discharges, and as such, this source assessment section does not make any distinction between the two types of stormwater.
4.2 Potential Sources of Fecal Coliform in the Alligator Creek Watershed 4.2.1 Point Sources There is one NPDES permitted facility (FL0186261–City of Clearwater Master Reuse System) located in the Alligator Creek watershed; however, it does not directly discharge fecal coliform bacteria directly or indirectly into Alligator Creek.
Municipal Separate Storm Sewer System Permittees The stormwater collection systems owned and operated by Pinellas County and co-permittees (Florida Department of Transportation [FDOT] District 7, city of Clearwater, and city of Safety Harbor) are covered by a Phase I NPDES municipal separate storm sewer system (MS4) permit (FLS000005). There are no Phase II MS4 permits identified for Alligator Creek.
4.2.2 Land Uses and Nonpoint Sources Nonpoint source pollution, unlike pollution from industrial and sewage treatment plants, comes from many diffuse sources. Nonpoint pollution is caused by rainfall moving over and through the ground. As the runoff moves, it picks up and carries away natural and human-made pollutants, finally depositing them into lakes, rivers, wetlands, coastal waters, and even
TMDL Report: Tampa Bay Basin, Alligator Creek (WBID 1574), Fecal Coliform, August 2009
Florida Department of Environmental Protection
9
underground sources of drinking water (EPA, 1994). Potential nonpoint sources of coliform include loadings from surface runoff, wildlife, livestock, pets, leaking sewer lines, and leaking septic tanks. Table 4.5 provides estimated fecal coliform loadings from dogs, septic tanks, and sanitary sewer overflows (SSOs) for the Alligator Creek watershed. The information provided for septic tanks and sewers in this report is for information purposes only, and is designed to give a rough estimate of the fecal coliform counts/day from septic tank leakage and SSOs.
Wildlife Wildlife deposit coliform bacteria with their feces onto land surfaces, where they can be transported during storm events to nearby streams. Some wildlife (such as otters, beavers, raccoons, and birds) deposit their feces directly into the water. The bacterial load from naturally occurring wildlife is assumed to be background. In addition, any strategy employed to control this source would probably have a negligible impact on attaining water quality standards.
Agricultural Animals Agricultural animals are the source of several types of coliform loading to streams. Agricultural activities, including runoff from pastureland and cattle in streams, can affect water quality. Agriculture occupies less than 1 percent of the total land area of the Alligator Creek watershed.
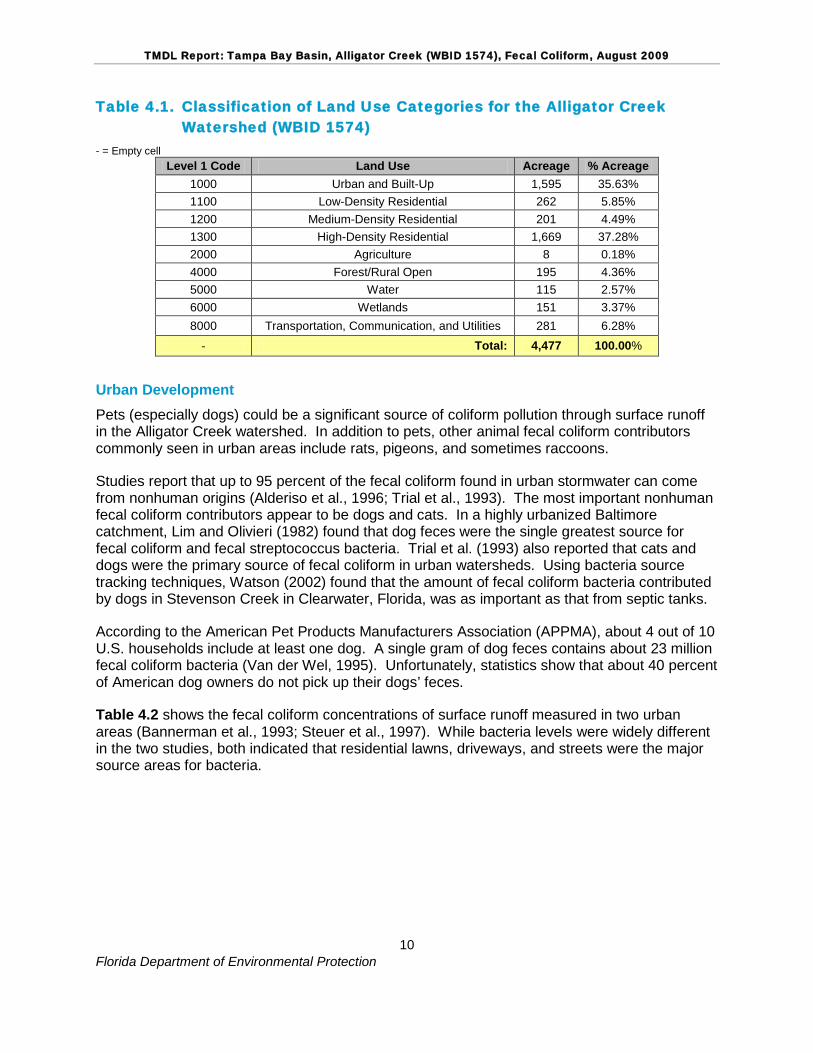
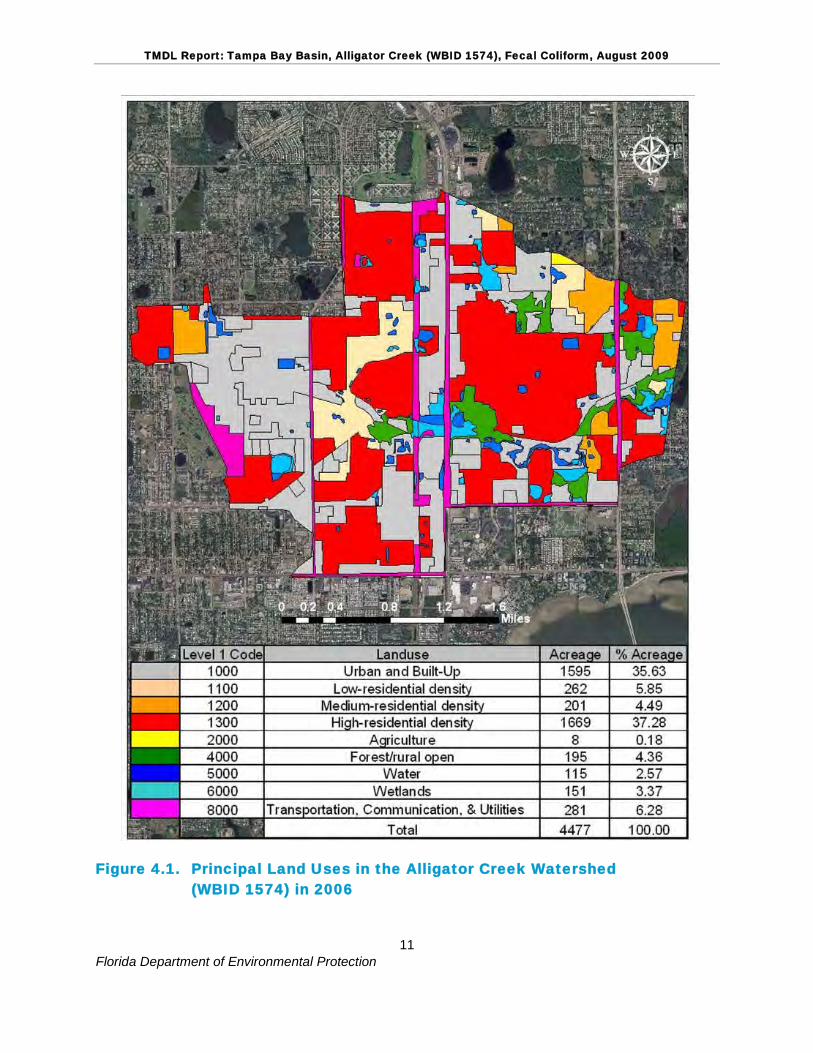
Land Uses The spatial distribution and acreage of different land use categories were identified using the SWFWMD’s 2006 land use coverage (scale 1:40,000) contained in the Department’s geographic information system (GIS) library. Land use categories in the watershed were aggregated using the simplified Level 1 codes and tabulated in Table 4.1. Figure 4.1 shows the acreage of the principal land uses in the watershed. As shown in Table 4.1, the Alligator Creek watershed drains about 4,477 acres of land. The dominant land use category is urban land (urban and built-up; low-, medium-, and high-density residential; and transportation, communication, and utilities), which accounts for 90 percent of the watershed’s total area. Natural land uses, which include forest/rural open and water/wetlands, occupy about 10 percent of the total watershed area.
TMDL Report: Tampa Bay Basin, Alligator Creek (WBID 1574), Fecal Coliform, August 2009
Florida Department of Environmental Protection
10
Table 4.1. Classification of Land Use Categories for the Alligator Creek Watershed (WBID 1574)
- = Empty cell Level 1 Code Land Use Acreage % Acreage
1000 Urban and Built-Up 1,595 35.63% 1100 Low-Density Residential 262 5.85% 1200 Medium-Density Residential 201 4.49% 1300 High-Density Residential 1,669 37.28% 2000 Agriculture 8 0.18% 4000 Forest/Rural Open 195 4.36% 5000 Water 115 2.57% 6000 Wetlands 151 3.37% 8000 Transportation, Communication, and Utilities 281 6.28%
- Total: 4,477 100.00%
Urban Development Pets (especially dogs) could be a significant source of coliform pollution through surface runoff in the Alligator Creek watershed. In addition to pets, other animal fecal coliform contributors commonly seen in urban areas include rats, pigeons, and sometimes raccoons.
Studies report that up to 95 percent of the fecal coliform found in urban stormwater can come from nonhuman origins (Alderiso et al., 1996; Trial et al., 1993). The most important nonhuman fecal coliform contributors appear to be dogs and cats. In a highly urbanized Baltimore catchment, Lim and Olivieri (1982) found that dog feces were the single greatest source for fecal coliform and fecal streptococcus bacteria. Trial et al. (1993) also reported that cats and dogs were the primary source of fecal coliform in urban watersheds. Using bacteria source tracking techniques, Watson (2002) found that the amount of fecal coliform bacteria contributed by dogs in Stevenson Creek in Clearwater, Florida, was as important as that from septic tanks.
According to the American Pet Products Manufacturers Association (APPMA), about 4 out of 10 U.S. households include at least one dog. A single gram of dog feces contains about 23 million fecal coliform bacteria (Van der Wel, 1995). Unfortunately, statistics show that about 40 percent of American dog owners do not pick up their dogs’ feces.
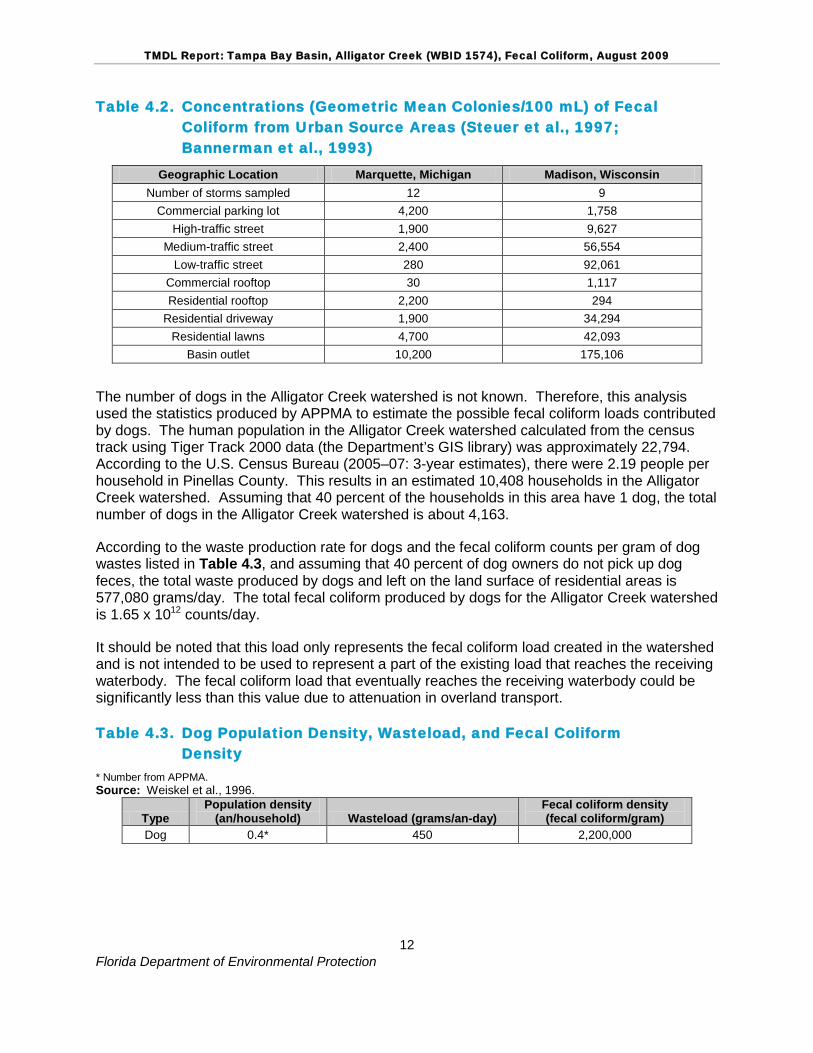
Table 4.2 shows the fecal coliform concentrations of surface runoff measured in two urban areas (Bannerman et al., 1993; Steuer et al., 1997). While bacteria levels were widely different in the two studies, both indicated that residential lawns, driveways, and streets were the major source areas for bacteria.
TMDL Report: Tampa Bay Basin, Alligator Creek (WBID 1574), Fecal Coliform, August 2009
Florida Department of Environmental Protection
11
Figure 4.1. Principal Land Uses in the Alligator Creek Watershed (WBID 1574) in 2006
TMDL Report: Tampa Bay Basin, Alligator Creek (WBID 1574), Fecal Coliform, August 2009
Florida Department of Environmental Protection
12
Table 4.2. Concentrations (Geometric Mean Colonies/100 mL) of Fecal Coliform from Urban Source Areas (Steuer et al., 1997; Bannerman et al., 1993)
Geographic Location Marquette, Michigan Madison, Wisconsin Number of storms sampled 12 9
Commercial parking lot 4,200 1,758 High-traffic street 1,900 9,627
Medium-traffic street 2,400 56,554 Low-traffic street 280 92,061
Commercial rooftop 30 1,117 Residential rooftop 2,200 294
Residential driveway 1,900 34,294 Residential lawns 4,700 42,093
Basin outlet 10,200 175,106 The number of dogs in the Alligator Creek watershed is not known. Therefore, this analysis used the statistics produced by APPMA to estimate the possible fecal coliform loads contributed by dogs. The human population in the Alligator Creek watershed calculated from the census track using Tiger Track 2000 data (the Department’s GIS library) was approximately 22,794. According to the U.S. Census Bureau (2005–07: 3-year estimates), there were 2.19 people per household in Pinellas County. This results in an estimated 10,408 households in the Alligator Creek watershed. Assuming that 40 percent of the households in this area have 1 dog, the total number of dogs in the Alligator Creek watershed is about 4,163.
According to the waste production rate for dogs and the fecal coliform counts per gram of dog wastes listed in Table 4.3, and assuming that 40 percent of dog owners do not pick up dog feces, the total waste produced by dogs and left on the land surface of residential areas is 577,080 grams/day. The total fecal coliform produced by dogs for the Alligator Creek watershed is 1.65 x 10¹²
It should be noted that this load only represents the fecal coliform load created in the watershed and is not intended to be used to represent a part of the existing load that reaches the receiving waterbody. The fecal coliform load that eventually reaches the receiving waterbody could be significantly less than this value due to attenuation in overland transport.
counts/day.
Table 4.3. Dog Population Density, Wasteload, and Fecal Coliform Density
* Number from APPMA. Source: Weiskel et al., 1996.
Type Population density
(an/household) Wasteload (grams/an-day) Fecal coliform density (fecal coliform/gram)
Dog 0.4* 450 2,200,000
TMDL Report: Tampa Bay Basin, Alligator Creek (WBID 1574), Fecal Coliform, August 2009
Florida Department of Environmental Protection
13
Septic Tanks Septic tanks are another potentially important source of coliform pollution in urban watersheds. When properly installed, most of the coliform from septic tanks should be removed within 50 meters of the drainage field (Minnesota Pollution Control Agency, 1999). However, in areas with a relatively high ground water table, the drainage field can be flooded during the rainy season, and coliform bacteria can pollute the surface water through storm runoff. Septic tanks may also cause coliform pollution when they are built too close to irrigation wells. Any well that is installed in the surficial aquifer system will cause a drawdown. If the septic tank system is built too close to the well (e.g., less than 75 feet), the septic tank discharge will be within the cone of influence of the well. As a result, septic tank effluent may go into the well and once the polluted water is used to irrigate lawns, coliform bacteria may reach the land surface and wash into surface waters during the rainy season. A rough estimate of fecal coliform loads from failed septic tanks in each watershed can be made using Equation 4.1:
L = 37.85* N * Q * C * F (Equation 4.1) Where:
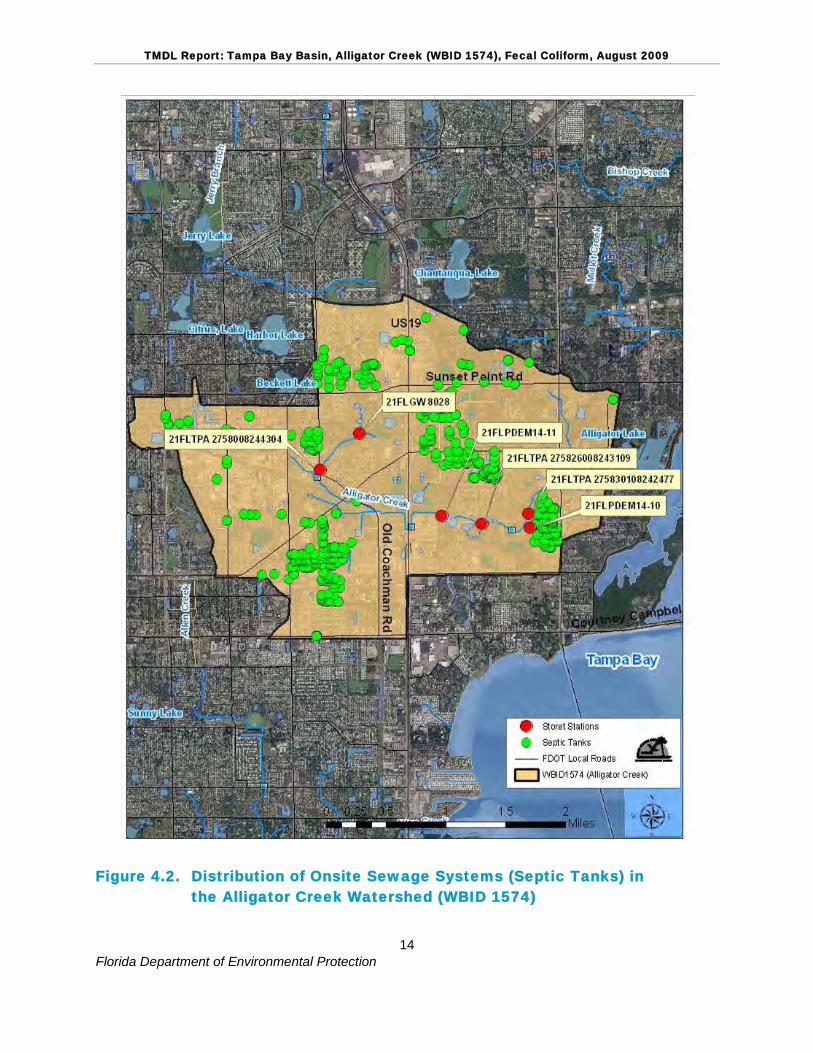
L is the fecal coliform daily load (counts/day); N is the total number of septic tanks in the watershed (septic tanks); Q is the discharge rate for each septic tank; C is the fecal coliform concentration for the septic tank discharge; and F is the septic tank failure rate.
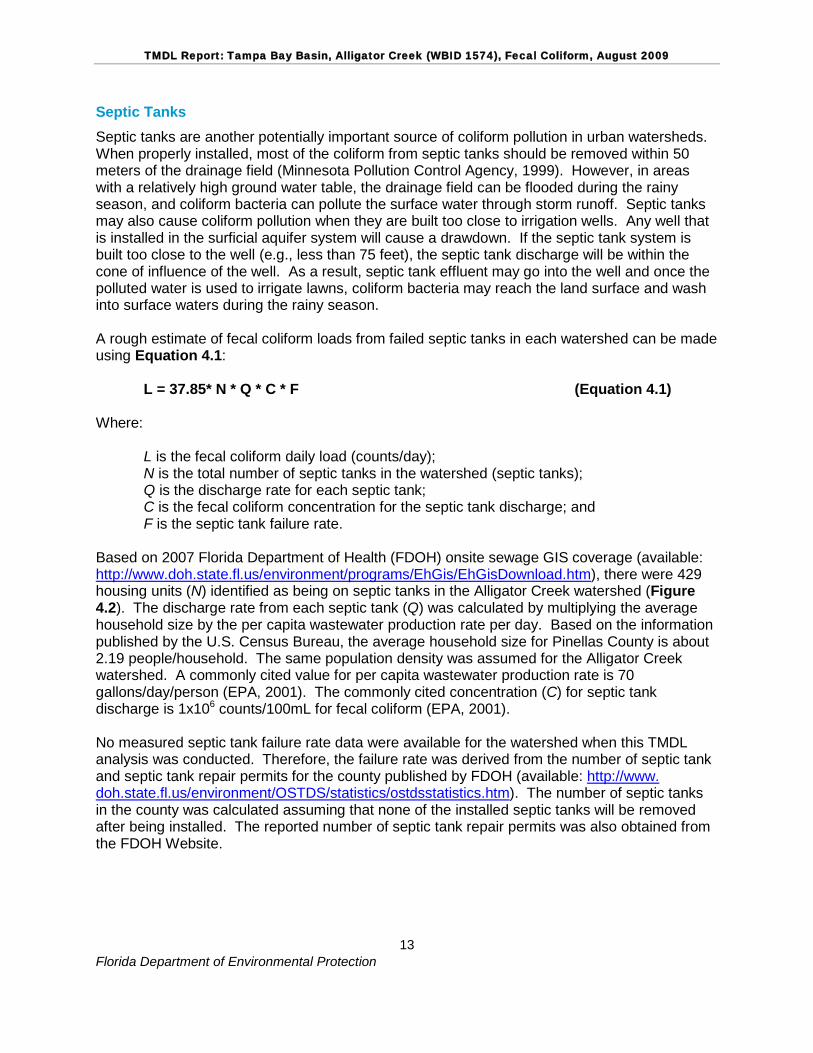
Based on 2007 Florida Department of Health (FDOH) onsite sewage GIS coverage (available: http://www.doh.state.fl.us/environment/programs/EhGis/EhGisDownload.htm), there were 429 housing units (N) identified as being on septic tanks in the Alligator Creek watershed (Figure 4.2). The discharge rate from each septic tank (Q) was calculated by multiplying the average household size by the per capita wastewater production rate per day. Based on the information published by the U.S. Census Bureau, the average household size for Pinellas County is about 2.19 people/household. The same population density was assumed for the Alligator Creek watershed. A commonly cited value for per capita wastewater production rate is 70 gallons/day/person (EPA, 2001). The commonly cited concentration (C) for septic tank discharge is 1x10⁶ counts/100mL for fecal coliform (EPA, 2001).
No measured septic tank failure rate data were available for the watershed when this TMDL analysis was conducted. Therefore, the failure rate was derived from the number of septic tank and septic tank repair permits for the county published by FDOH (available: http://www. doh.state.fl.us/environment/OSTDS/statistics/ostdsstatistics.htm). The number of septic tanks in the county was calculated assuming that none of the installed septic tanks will be removed after being installed. The reported number of septic tank repair permits was also obtained from the FDOH Website.
TMDL Report: Tampa Bay Basin, Alligator Creek (WBID 1574), Fecal Coliform, August 2009
Florida Department of Environmental Protection
14
Figure 4.2. Distribution of Onsite Sewage Systems (Septic Tanks) in the Alligator Creek Watershed (WBID 1574)
TMDL Report: Tampa Bay Basin, Alligator Creek (WBID 1574), Fecal Coliform, August 2009
Florida Department of Environmental Protection
15
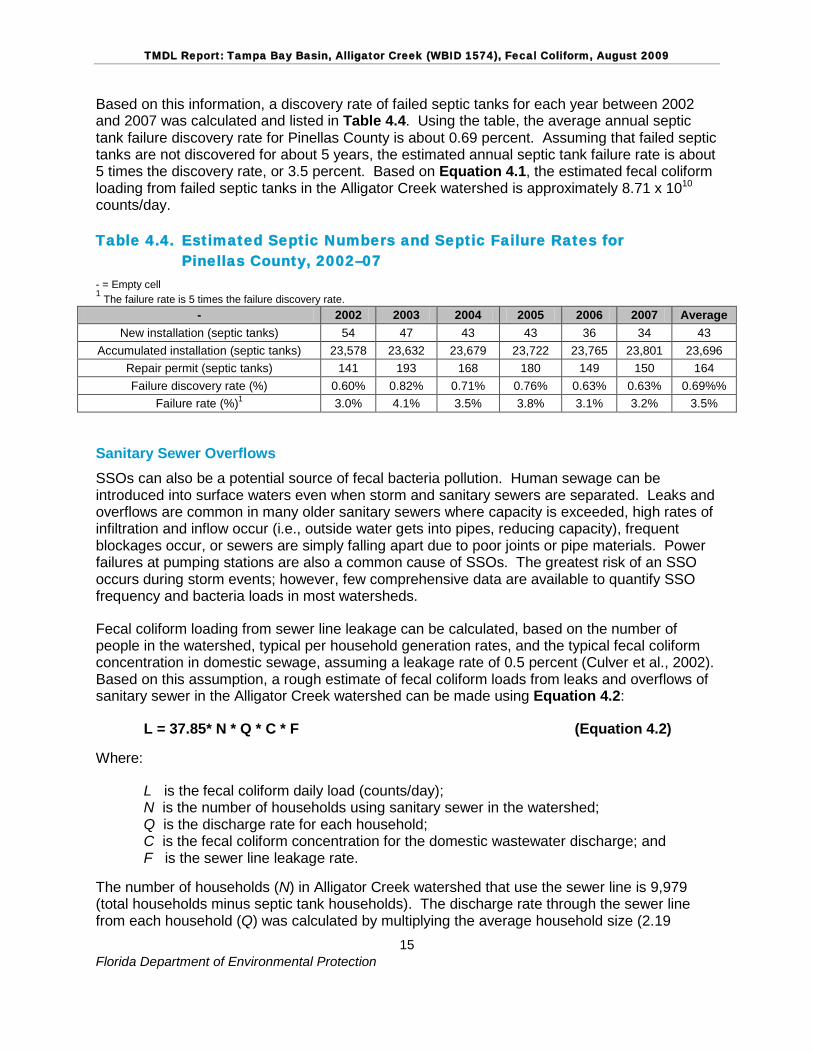
Based on this information, a discovery rate of failed septic tanks for each year between 2002 and 2007 was calculated and listed in Table 4.4. Using the table, the average annual septic tank failure discovery rate for Pinellas County is about 0.69 percent. Assuming that failed septic tanks are not discovered for about 5 years, the estimated annual septic tank failure rate is about 5 times the discovery rate, or 3.5 percent. Based on Equation 4.1, the estimated fecal coliform loading from failed septic tanks in the Alligator Creek watershed is approximately 8.71 x 10¹⁰
Table 4.4. Estimated Septic Numbers and Septic Failure Rates for Pinellas County, 2002–07
counts/day.
- = Empty cell 1 The failure rate is 5 times the failure discovery rate.
- 2002 2003 2004 2005 2006 2007 Average New installation (septic tanks) 54 47 43 43 36 34 43
Accumulated installation (septic tanks) 23,578 23,632 23,679 23,722 23,765 23,801 23,696 Repair permit (septic tanks) 141 193 168 180 149 150 164 Failure discovery rate (%) 0.60% 0.82% 0.71% 0.76% 0.63% 0.63% 0.69%%
Failure rate (%) 3.0% 1 4.1% 3.5% 3.8% 3.1% 3.2% 3.5%
Sanitary Sewer Overflows SSOs can also be a potential source of fecal bacteria pollution. Human sewage can be introduced into surface waters even when storm and sanitary sewers are separated. Leaks and overflows are common in many older sanitary sewers where capacity is exceeded, high rates of infiltration and inflow occur (i.e., outside water gets into pipes, reducing capacity), frequent blockages occur, or sewers are simply falling apart due to poor joints or pipe materials. Power failures at pumping stations are also a common cause of SSOs. The greatest risk of an SSO occurs during storm events; however, few comprehensive data are available to quantify SSO frequency and bacteria loads in most watersheds.
Fecal coliform loading from sewer line leakage can be calculated, based on the number of people in the watershed, typical per household generation rates, and the typical fecal coliform concentration in domestic sewage, assuming a leakage rate of 0.5 percent (Culver et al., 2002). Based on this assumption, a rough estimate of fecal coliform loads from leaks and overflows of sanitary sewer in the Alligator Creek watershed can be made using Equation 4.2:
L = 37.85* N * Q * C * F (Equation 4.2) Where:
L is the fecal coliform daily load (counts/day); N is the number of households using sanitary sewer in the watershed; Q is the discharge rate for each household; C is the fecal coliform concentration for the domestic wastewater discharge; and F is the sewer line leakage rate.
The number of households (N) in Alligator Creek watershed that use the sewer line is 9,979 (total households minus septic tank households). The discharge rate through the sewer line from each household (Q) was calculated by multiplying the average household size (2.19
TMDL Report: Tampa Bay Basin, Alligator Creek (WBID 1574), Fecal Coliform, August 2009
Florida Department of Environmental Protection
16
people) by the per capita wastewater production rate per day (70 gallons). The commonly cited concentration (C) for domestic wastewater is 1x10⁶ counts/100mL for fecal coliform (EPA, 2001). Of the total number of households using the sewer line, 0.5 percent (F) was assumed as the sewer line leakage rate (Culver et al., 2002). Based on Equation 4.2, the estimated fecal coliform loading from sewer line leakage in the Alligator Creek watershed is about 2.90 x 10¹¹
Nonpoint Source Summary
counts/day.
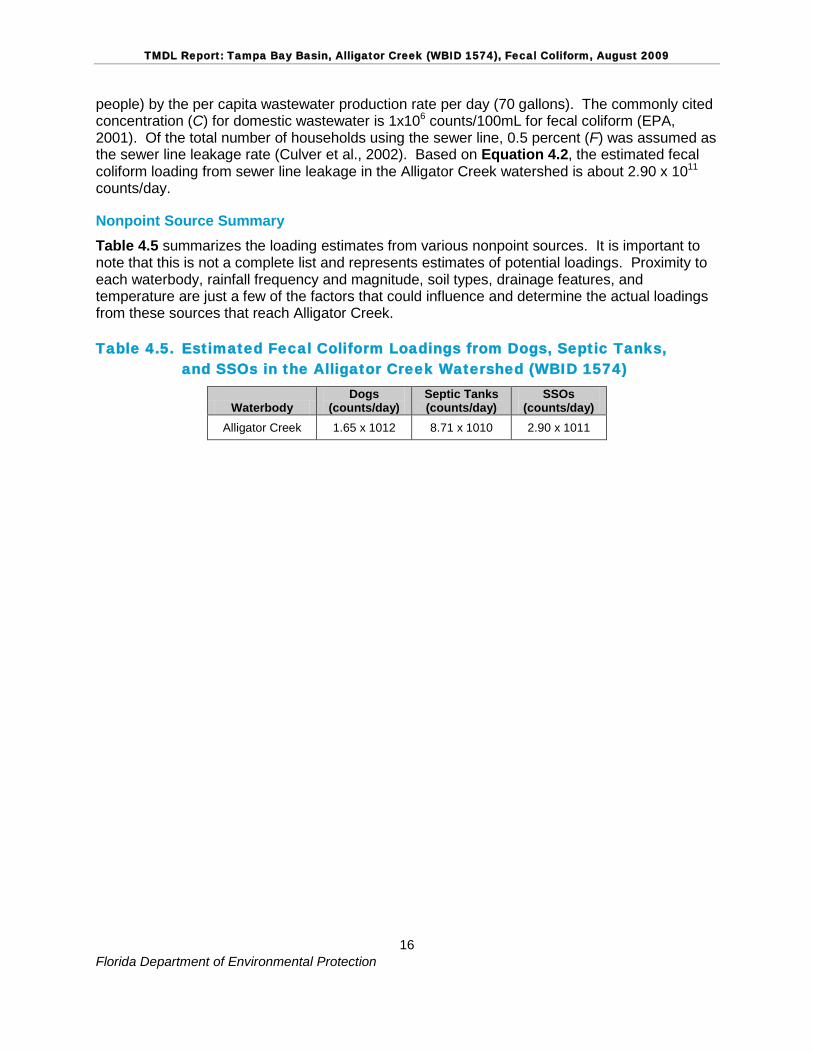
Table 4.5 summarizes the loading estimates from various nonpoint sources. It is important to note that this is not a complete list and represents estimates of potential loadings. Proximity to each waterbody, rainfall frequency and magnitude, soil types, drainage features, and temperature are just a few of the factors that could influence and determine the actual loadings from these sources that reach Alligator Creek.
Table 4.5. Estimated Fecal Coliform Loadings from Dogs, Septic Tanks, and SSOs in the Alligator Creek Watershed (WBID 1574)
Waterbody Dogs
(counts/day) Septic Tanks (counts/day)
SSOs (counts/day)
Alligator Creek 1.65 x 10¹² 8.71 x 10¹⁰ 2.90 x 10¹¹
TMDL Report: Tampa Bay Basin, Alligator Creek (WBID 1574), Fecal Coliform, August 2009
Florida Department of Environmental Protection
17
Chapter 5: DETERMINATION OF ASSIMILATIVE
CAPACITY
5.1 Determination of Loading Capacity The TMDL methodology used for Alligator Creek is the load duration curve. Also known as the “Kansas approach” because it was developed by the state of Kansas, this method has been well documented in the literature, with improved modifications used by the EPA, Region 4. Basically, the method relates the pollutant concentration to the flow of the stream, in order to establish the existing loading capacity and the allowable pollutant load (TMDL) under a spectrum of flow conditions. It then determines the maximum allowable pollutant load and load reduction requirement based on the analysis of the critical flow conditions. This method requires four steps to develop the TMDL and establish the required load reduction:
1. Develop the flow duration curve; 2. Develop the load duration curve for both the allowable load and existing loading
capacity; 3. Define the critical condition; and 4. Establish the needed load reduction by comparing the existing loading with the allowable
load under the critical condition.
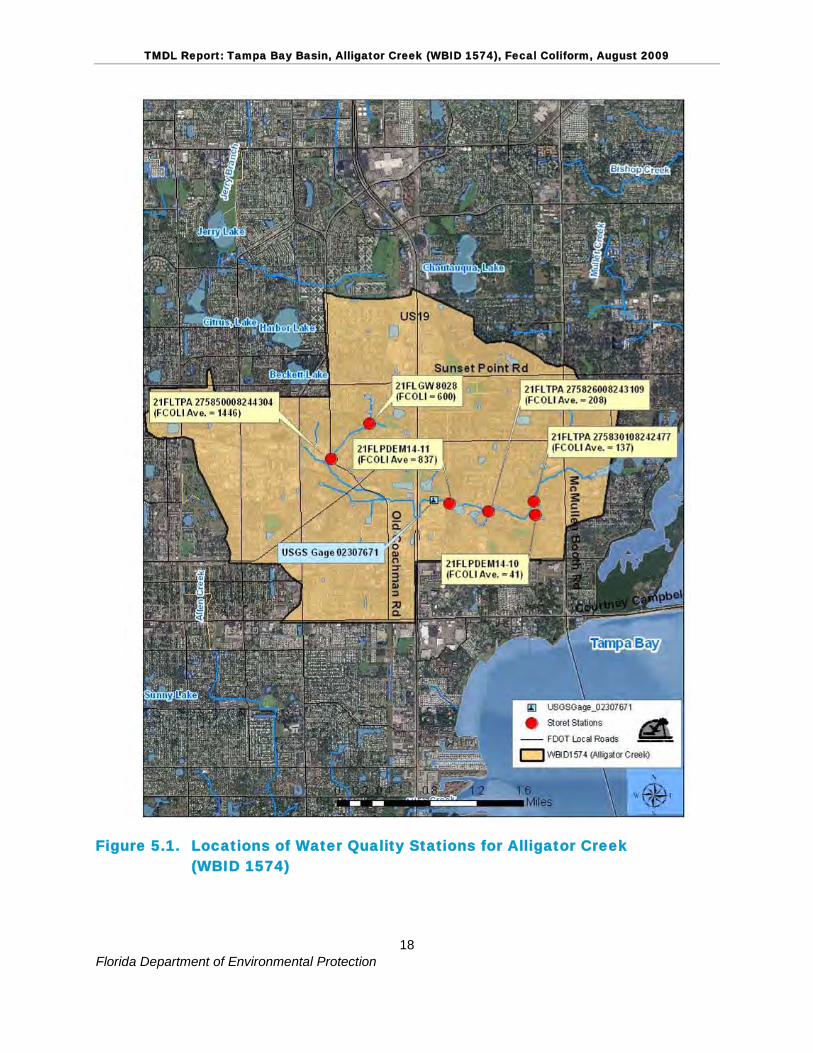
5.1.1 Data Used in the Determination of the TMDL The data used for this TMDL report were provided by Pinellas County (Stations: 21FLPDEM14-10 and 21FLPDEM14-11), the Department’s Southwest District (Stations: 21FLTPA - 275826008243109, 275830108242477, and 275850008244304), and the Department of Environmental Protection (Station: 21FLGW 8028) (Table 5.1). Figure 5.1 shows the locations of the flow gage and the water quality sites where fecal coliform data were collected. Figure 2.1 displays the data for fecal coliform used in this analysis.
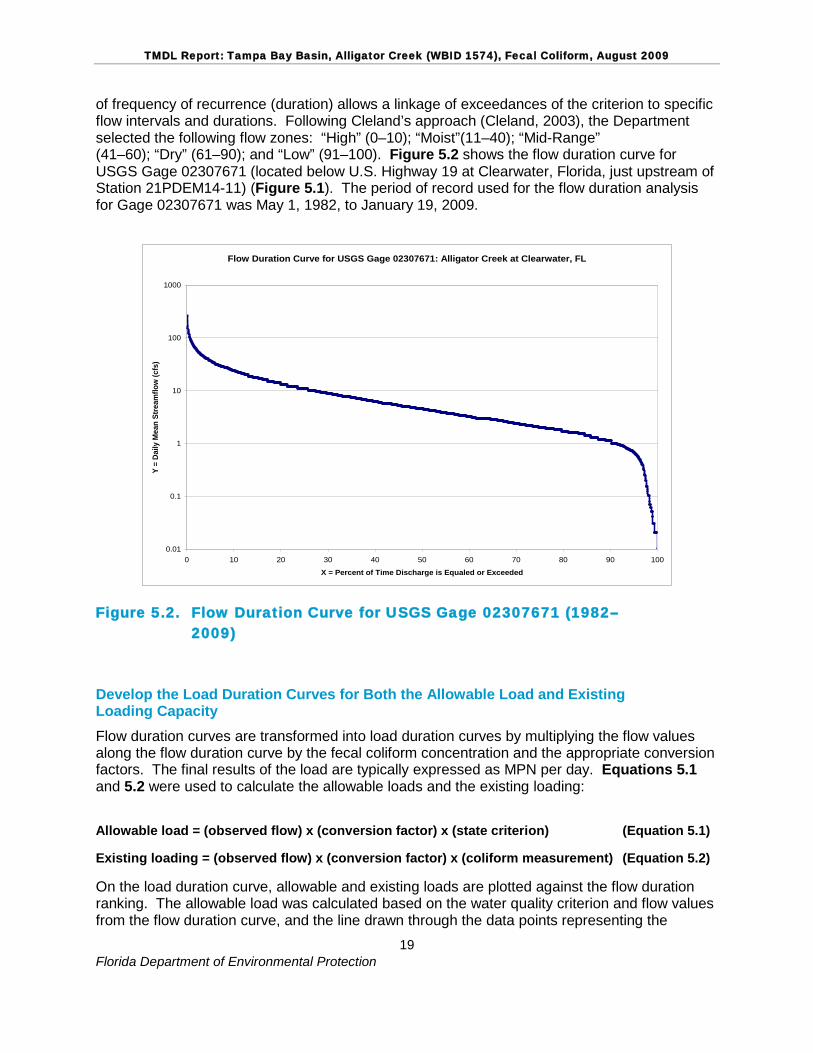
5.1.2 TMDL Development Process for Alligator Creek Develop the Flow Duration Curve The first step in the development of load duration curves is to create flow duration curves. A flow duration curve displays the cumulative frequency distribution of daily flow data over the period of record. The duration curve relates flow values measured at a monitoring station to the percent of time the flow values were equaled or exceeded. Flows are ranked from low, which are exceeded nearly 100 percent of the time, to high, which are exceeded less than 1 percent of the time.
The range of flows from the U.S. Geological Survey (USGS) flow gage was divided into “flow zones.” The concept of zones is adopted from Dr. Bruce Cleland (Cleland, 2002). The purpose of the zones is to demarcate hydrologic conditions between drought and peak flood into flow ranges such as low, dry, average, moist, and high. Expressing the flows in terms
TMDL Report: Tampa Bay Basin, Alligator Creek (WBID 1574), Fecal Coliform, August 2009
Florida Department of Environmental Protection
18
Figure 5.1. Locations of Water Quality Stations for Alligator Creek (WBID 1574)
TMDL Report: Tampa Bay Basin, Alligator Creek (WBID 1574), Fecal Coliform, August 2009
Florida Department of Environmental Protection
19
of frequency of recurrence (duration) allows a linkage of exceedances of the criterion to specific flow intervals and durations. Following Cleland’s approach (Cleland, 2003), the Department selected the following flow zones: “High” (0–10); “Moist”(11–40); “Mid-Range” (41–60); “Dry” (61–90); and “Low” (91–100). Figure 5.2 shows the flow duration curve for USGS Gage 02307671 (located below U.S. Highway 19 at Clearwater, Florida, just upstream of Station 21PDEM14-11) (Figure 5.1). The period of record used for the flow duration analysis for Gage 02307671 was May 1, 1982, to January 19, 2009.
Figure 5.2. Flow Duration Curve for USGS Gage 02307671 (1982–2009)
Develop the Load Duration Curves for Both the Allowable Load and Existing Loading Capacity Flow duration curves are transformed into load duration curves by multiplying the flow values along the flow duration curve by the fecal coliform concentration and the appropriate conversion factors. The final results of the load are typically expressed as MPN per day. Equations 5.1 and 5.2 were used to calculate the allowable loads and the existing loading:
Allowable load = (observed flow) x (conversion factor) x (state criterion) (Equation 5.1) Existing loading = (observed flow) x (conversion factor) x (coliform measurement) (Equation 5.2) On the load duration curve, allowable and existing loads are plotted against the flow duration ranking. The allowable load was calculated based on the water quality criterion and flow values from the flow duration curve, and the line drawn through the data points representing the
Flow Duration Curve for USGS Gage 02307671: Alligator Creek at Clearwater, FL
0.01
0.1
1
10
100
1000
0 10 20 30 40 50 60 70 80 90 100
X = Percent of Time Discharge is Equaled or Exceeded
Y =
Daily
Mea
n St
ream
flow
(cfs
)
TMDL Report: Tampa Bay Basin, Alligator Creek (WBID 1574), Fecal Coliform, August 2009
Florida Department of Environmental Protection
20
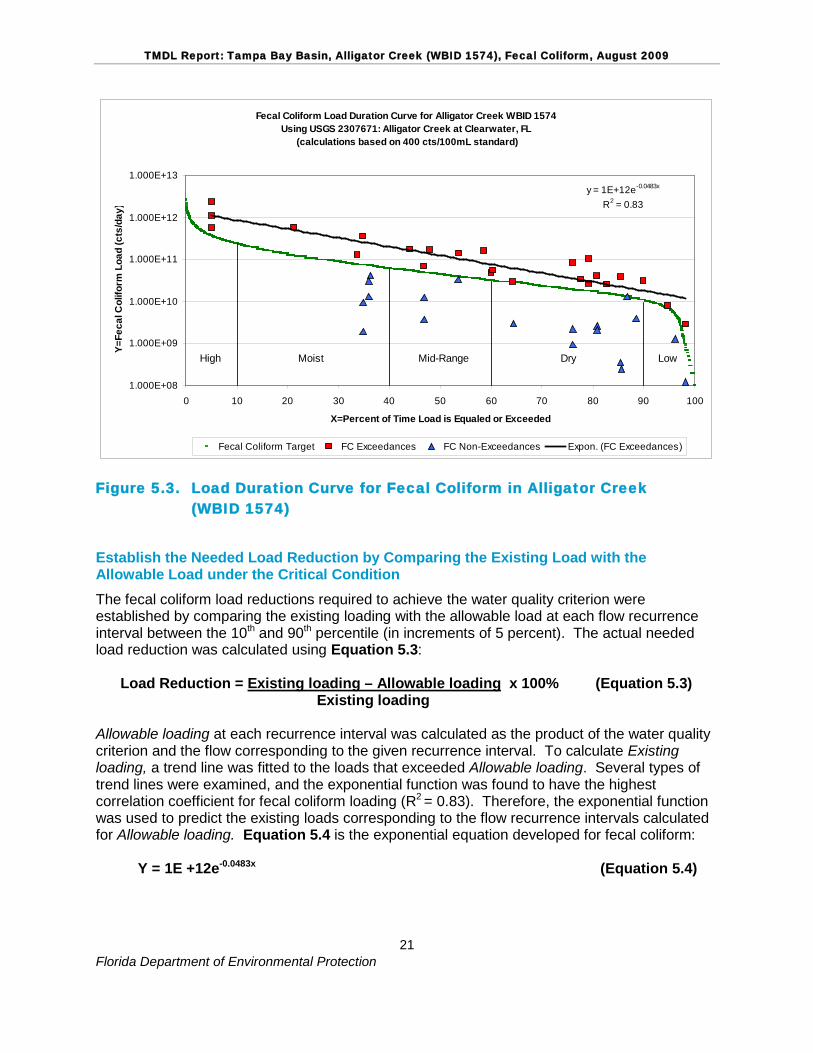
allowable load is called the target line. The existing loads are based on the in-stream fecal coliform concentrations measured during ambient monitoring and an estimate of flow in the stream at the time of sampling. As noted previously, because insufficient data were collected to evaluate the fecal coliform geometric mean, 400 MPN/100mL was used as the target criterion for fecal coliform. Figure 5.3 shows both the allowable loads and the existing loads over the flow duration ranking for Alligator Creek. The points of the existing load that were higher than the allowable load at a given flow duration ranking were considered an exceedance of the criterion.
As shown in Figure 5.3, exceedances of the fecal coliform criterion in Alligator Creek occur across the entire span of the flow record. In general, exceedances on the right side of the curve typically occur during low-flow events, implying a contribution from either point sources or baseflow that could come from the load from failed septic tanks and sewer line leakage interacting with surface water. The exceedances that appear on the left side of the curve usually represent loading from stormwater-related sources. In this case, the potential sources may include contributions from pets, such as dogs and cats, wild animals, failed septic tanks, and sewer line leakage.
Define the Critical Condition The critical condition for coliform loadings in a given watershed depends on many factors, including the presence of point sources and the land use pattern in the watershed. Typically, the critical condition for nonpoint sources is an extended dry period followed by a rainfall runoff event. During the wet weather period, rainfall washes off coliform bacteria that have built up on the land surface under dry conditions, resulting in the wet weather exceedances. However, significant nonpoint source contributions can also appear under dry conditions without any major surface runoff event. This usually happens when nonpoint sources contaminate the surficial aquifer, and fecal coliform bacteria are brought into the receiving waters through baseflow. In addition, wildlife having direct access to the receiving water can contribute to an exceedance during dry weather. The critical condition for point source loading typically occurs during periods of low stream flow, when dilution is minimized.
For Alligator Creek, because exceedances occur throughout the flow record, no critical flow condition was defined for this TMDL. The Department used the flow records and water quality data available between the 10th to 90th
percentile flow duration interval for the TMDL analysis. Flow conditions that were exceeded less than 10 percent of the time were not used because they represent abnormally high-flow events, and flow conditions occurring more than 90 percent of the time were not used because they are extreme low-flow events.
TMDL Report: Tampa Bay Basin, Alligator Creek (WBID 1574), Fecal Coliform, August 2009
Florida Department of Environmental Protection
21
Figure 5.3. Load Duration Curve for Fecal Coliform in Alligator Creek (WBID 1574)
Establish the Needed Load Reduction by Comparing the Existing Load with the Allowable Load under the Critical Condition The fecal coliform load reductions required to achieve the water quality criterion were established by comparing the existing loading with the allowable load at each flow recurrence interval between the 10th and 90th percentile (in increments of 5 percent). The actual needed load reduction was calculated using Equation 5.3: Load Reduction = Existing loading – Allowable loading x 100% (Equation 5.3) Existing loading Allowable loading at each recurrence interval was calculated as the product of the water quality criterion and the flow corresponding to the given recurrence interval. To calculate Existing loading, a trend line was fitted to the loads that exceeded Allowable loading. Several types of trend lines were examined, and the exponential function was found to have the highest correlation coefficient for fecal coliform loading (R2 = 0.83). Therefore, the exponential function was used to predict the existing loads corresponding to the flow recurrence intervals calculated for Allowable loading. Equation 5.4 is the exponential equation developed for fecal coliform:
Y = 1E +12e-0.0483x (Equation 5.4)
Fecal Coliform Load Duration Curve for Alligator Creek WBID 1574 Using USGS 2307671: Alligator Creek at Clearwater, FL
(calculations based on 400 cts/100mL standard)
y = 1E+12e-0.0483x
R2 = 0.83
1.000E+08
1.000E+09
1.000E+10
1.000E+11
1.000E+12
1.000E+13
0 10 20 30 40 50 60 70 80 90 100
X=Percent of Time Load is Equaled or Exceeded
Y=Fe
cal C
olifo
rm L
oad
(cts
/day
)
Fecal Coliform Target FC Exceedances FC Non-Exceedances Expon. (FC Exceedances)
High Moist Mid-Range Dry Low
TMDL Report: Tampa Bay Basin, Alligator Creek (WBID 1574), Fecal Coliform, August 2009
Florida Department of Environmental Protection
22
Where:
X is the flow recurrence interval between the 10th and 90th percentile; and Y is the predicted Existing loading for fecal coliform (Equation 5.4).
Figure 5.3 shows the trend lines and an exponential equation between fecal coliform bacteria load and flow ranking. After the trend lines were developed, they were used to determine the median percent reduction required to achieve the numeric criterion. At each recurrence interval between the 10th and 90th
The percent reduction required to achieve the target load was then calculated at each interval, and the final percent reduction needed was the median of these values. The TMDL and percent reductions were calculated as the median of all the loads and percent reductions calculated at the various recurrence intervals between the 10
percentile (in increments of 5 percent), the equation of the trend line was used to estimate Existing loading.
th and 90th
Table 5.1. Calculation of TMDL and Percent Reduction for Fecal Coliform in Alligator Creek (WBID 1574)
percentile. Table 5.1 shows the calculation of the TMDL and percent reductions for fecal coliform in Alligator Creek.
* The median interval (50) is the TMDL calculation.
Interval
Allowable Load
(counts/day) Existing Load (counts/day)
% Reduction
10 2.35E+11 6.17E+11 61.93% 15 1.76E+11 4.85E+11 63.65% 20 1.27E+11 3.81E+11 66.57% 25 1.08E+11 2.99E+11 63.99% 30 8.79E+10 2.35E+11 62.57% 35 7.34E+10 1.84E+11 60.20% 40 6.07E+10 1.45E+11 58.11% 45 5.19E+10 1.14E+11 54.41% 50* 4.40E+10 8.94E+10 50.72% 55 3.72E+10 7.02E+10 47.02% 60 3.13E+10 5.51E+10 43.20% 65 2.74E+10 4.33E+10 36.72% 70 2.35E+10 3.40E+10 30.95% 75 1.96E+10 2.67E+10 26.74% 80 1.66E+10 2.10E+10 20.72% 85 1.37E+10 1.65E+10 16.87% 90 1.08E+10 1.29E+10 16.84%
Median: 4.40E+10 8.94E+10 50.72%
5.1.3 Critical Condition/Seasonality The critical condition for coliform loadings in a given watershed depends on the existence of point sources and land use patterns in the watershed. Typically, the critical condition for nonpoint sources is an extended dry period, followed by a rainfall runoff event. During wet weather periods, coliform bacteria that have built up on the land surface under dry weather
TMDL Report: Tampa Bay Basin, Alligator Creek (WBID 1574), Fecal Coliform, August 2009
Florida Department of Environmental Protection
23
conditions are washed off by rainfall, resulting in wet weather exceedances. However, significant nonpoint source contributions could also occur under dry weather conditions without any major surface runoff event. This usually happens when nonpoint sources contaminate the surficial aquifer and coliform bacteria are brought into the receiving waters through baseflow. The critical condition for point source loading typically occurs during periods of low stream flow, when dilution is minimized.
Exceedances occurred over the entire range of flow conditions in the Alligator Creek watershed, as shown in Figure 5.3. Based on the dominant type of land use (urban land) in the watershed, it is likely that many of the exceedances in each of the flow intervals are from nonpoint sources and MS4s entering the waters through surface runoff. Table 5.2 indicates that moist conditions are congruent with higher fecal coliform loads and the percent reductions needed in the watershed. This could indicate that fecal coliform builds up on the land during dry periods and washes off into local waters during rain events. Critical conditions are accounted for in the load curve analysis by using the flow records and water quality data available in the 10th
to 90th
5.1.4 Spatial Patterns
percentile flow duration interval.
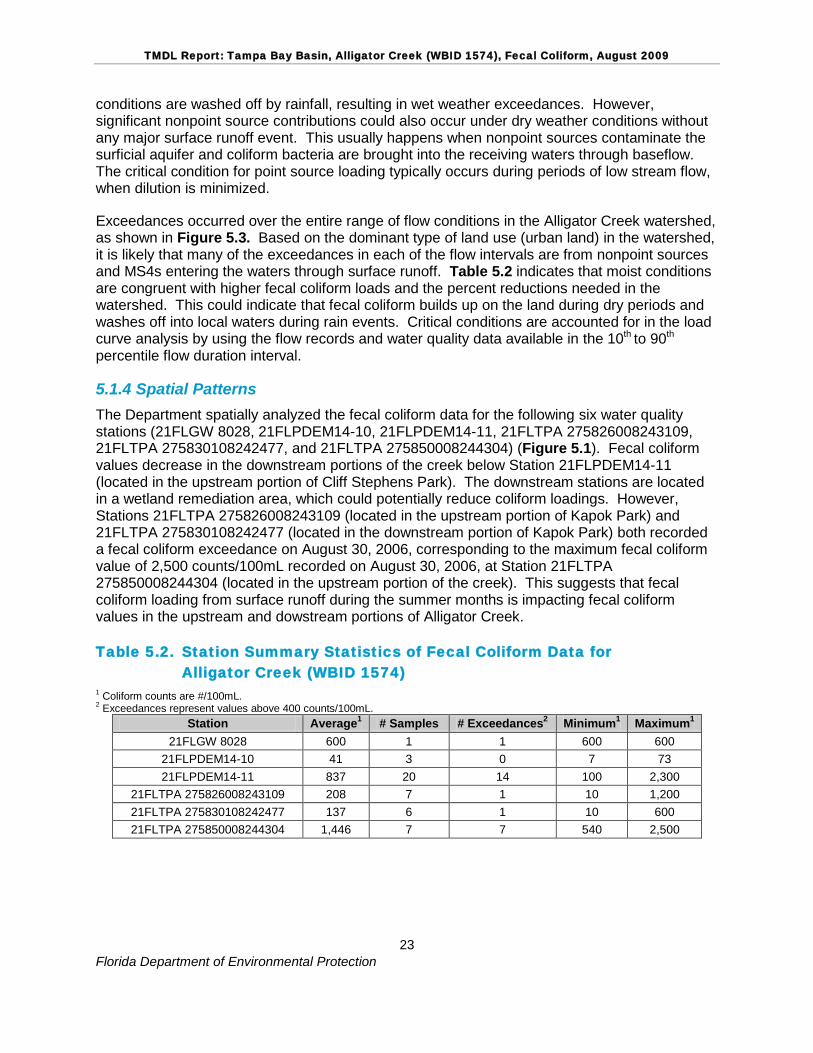
The Department spatially analyzed the fecal coliform data for the following six water quality stations (21FLGW 8028, 21FLPDEM14-10, 21FLPDEM14-11, 21FLTPA 275826008243109, 21FLTPA 275830108242477, and 21FLTPA 275850008244304) (Figure 5.1). Fecal coliform values decrease in the downstream portions of the creek below Station 21FLPDEM14-11 (located in the upstream portion of Cliff Stephens Park). The downstream stations are located in a wetland remediation area, which could potentially reduce coliform loadings. However, Stations 21FLTPA 275826008243109 (located in the upstream portion of Kapok Park) and 21FLTPA 275830108242477 (located in the downstream portion of Kapok Park) both recorded a fecal coliform exceedance on August 30, 2006, corresponding to the maximum fecal coliform value of 2,500 counts/100mL recorded on August 30, 2006, at Station 21FLTPA 275850008244304 (located in the upstream portion of the creek). This suggests that fecal coliform loading from surface runoff during the summer months is impacting fecal coliform values in the upstream and dowstream portions of Alligator Creek.
Table 5.2. Station Summary Statistics of Fecal Coliform Data for Alligator Creek (WBID 1574)
1 Coliform counts are #/100mL. 2 Exceedances represent values above 400 counts/100mL.
Station Average1 # Samples # Exceedances2 Minimum1 Maximum21FLGW 8028
1 600 1 1 600 600
21FLPDEM14-10 41 3 0 7 73 21FLPDEM14-11 837 20 14 100 2,300
21FLTPA 275826008243109 208 7 1 10 1,200 21FLTPA 275830108242477 137 6 1 10 600 21FLTPA 275850008244304 1,446 7 7 540 2,500
TMDL Report: Tampa Bay Basin, Alligator Creek (WBID 1574), Fecal Coliform, August 2009
Florida Department of Environmental Protection
24
Chapter 6: DETERMINATION OF THE TMDL 6.1 Expression and Allocation of the TMDL The objective of a TMDL is to provide a basis for allocating acceptable loads among all of the known pollutant sources in a watershed so that appropriate control measures can be implemented and water quality standards achieved. A TMDL is expressed as the sum of all point source loads (wasteload allocations, or WLAs), nonpoint source loads (load allocations, or LAs), and an appropriate margin of safety (MOS), which takes into account any uncertainty concerning the relationship between effluent limitations and water quality:
TMDL = ∑ WLAs + ∑ LAs + MOS
As discussed earlier, the WLA is broken out into separate subcategories for wastewater discharges and stormwater discharges regulated under the NPDES Program:
TMDL ≅ ∑ WLAswastewater + ∑ WLAsNPDES Stormwater
+ ∑ LAs + MOS
It should be noted that the various components of the revised TMDL equation may not sum up to the value of the TMDL because (a) the WLA for NPDES stormwater is typically based on the percent reduction needed for nonpoint sources and is also accounted for within the LA, and (b) TMDL components can be expressed in different terms (for example, the WLA for stormwater is typically expressed as a percent reduction, and the WLA for wastewater is typically expressed as mass per day).
WLAs for stormwater discharges are typically expressed as “percent reduction” because it is very difficult to quantify the loads from MS4s (given the numerous discharge points) and to distinguish loads from MS4s from other nonpoint sources (given the nature of stormwater transport). The permitting of stormwater discharges also differs from the permitting of most wastewater point sources. Because stormwater discharges cannot be centrally collected, monitored, and treated, they are not subject to the same types of effluent limitations as wastewater facilities, and instead are required to meet a performance standard of providing treatment to the “maximum extent practical” through the implementation of best management practices (BMPs).
This approach is consistent with federal regulations (40 CFR § 130.2[I]), which state that TMDLs can be expressed in terms of mass per time (e.g., pounds per day), toxicity, or other appropriate measure. The TMDL for Alligator Creek is expressed in terms of counts/day and percent reduction, and represents the maximum daily fecal coliform loads the creek can assimilate and maintain the fecal coliform criterion (Table 6.1).
TMDL Report: Tampa Bay Basin, Alligator Creek (WBID 1574), Fecal Coliform, August 2009
Florida Department of Environmental Protection
25
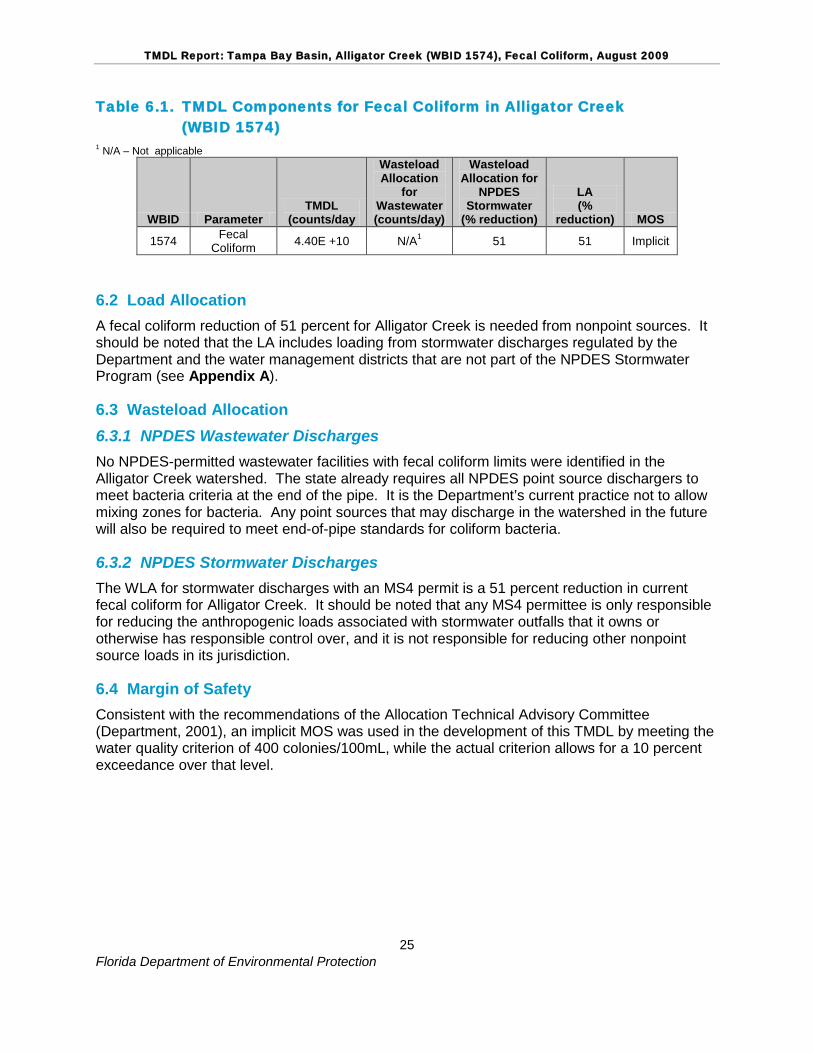
Table 6.1. TMDL Components for Fecal Coliform in Alligator Creek (WBID 1574)
1 N/A – Not applicable
WBID Parameter TMDL
(counts/day
Wasteload Allocation
for Wastewater (counts/day)
Wasteload Allocation for
NPDES Stormwater
(% reduction)
LA (%
reduction) MOS
1574 Fecal Coliform 4.40E +10 N/A 51 1 51 Implicit
6.2 Load Allocation A fecal coliform reduction of 51 percent for Alligator Creek is needed from nonpoint sources. It should be noted that the LA includes loading from stormwater discharges regulated by the Department and the water management districts that are not part of the NPDES Stormwater Program (see Appendix A).
6.3 Wasteload Allocation 6.3.1 NPDES Wastewater Discharges No NPDES-permitted wastewater facilities with fecal coliform limits were identified in the Alligator Creek watershed. The state already requires all NPDES point source dischargers to meet bacteria criteria at the end of the pipe. It is the Department’s current practice not to allow mixing zones for bacteria. Any point sources that may discharge in the watershed in the future will also be required to meet end-of-pipe standards for coliform bacteria.
6.3.2 NPDES Stormwater Discharges The WLA for stormwater discharges with an MS4 permit is a 51 percent reduction in current fecal coliform for Alligator Creek. It should be noted that any MS4 permittee is only responsible for reducing the anthropogenic loads associated with stormwater outfalls that it owns or otherwise has responsible control over, and it is not responsible for reducing other nonpoint source loads in its jurisdiction.
6.4 Margin of Safety Consistent with the recommendations of the Allocation Technical Advisory Committee (Department, 2001), an implicit MOS was used in the development of this TMDL by meeting the water quality criterion of 400 colonies/100mL, while the actual criterion allows for a 10 percent exceedance over that level.
TMDL Report: Tampa Bay Basin, Alligator Creek (WBID 1574), Fecal Coliform, August 2009
Florida Department of Environmental Protection
26
Chapter 7: NEXT STEPS: IMPLEMENTATION PLAN
DEVELOPMENT AND BEYOND
7.1 Basin Management Action Plan Following the adoption of this TMDL by rule, the next step in the TMDL process is to develop an implementation plan for the TMDL, referred to as the BMAP. This document will be developed over the next year in cooperation with local stakeholders, who will attempt to reach consensus on detailed allocations and on how load reductions will be accomplished. The BMAP will include, among other things:
• Appropriate load reduction allocations among the affected parties;
• A description of the load reduction activities to be undertaken, including structural projects, nonstructural BMPs, and public education and outreach;
• A description of further research, data collection, or source identification needed in order to achieve the TMDL;
• Timetables for implementation;
• Confirmed and potential funding mechanisms;
• Any applicable signed agreement(s);
• Local ordinances defining actions to be taken or prohibited;
• Any applicable local water quality standards, permits, or load limitation agreements;
• Milestones for implementation and water quality improvement; and
• Implementation tracking, water quality monitoring, and follow-up measures. An assessment of progress toward the BMAP milestones will be conducted every five years, and revisions to the plan will be made as appropriate, in cooperation with basin stakeholders.
Pinellas County, the city of Clearwater, the EPA, and other local entities have engaged in stormwater treatment and restoration projects throughout the Alligator Creek watershed to address water quality issues and to provide essential habitat for wildlife. During the BMAP process, current and future restoration projects will be evaluated by all participants, in order to develop a comprehensive BMAP for the watershed.
TMDL Report: Tampa Bay Basin, Alligator Creek (WBID 1574), Fecal Coliform, August 2009
Florida Department of Environmental Protection
27
References Alderiso, K., D. Wait, and M. Sobsey. 1996. Detection and characterization of make-specific
RNA coliphages in a New York City reservoir to distinguish between human and nonhuman sources of contamination. In: Proceedings of a Symposium on New York City Water Supply Studies, J.J. McDonnell et al. (eds.). TPS-96-2. Herndon, VA: American Water Resources Association.
Association of Metropolitan Sewerage Agencies. 1994. Separate sanitary sewer overflows: What do we currently know? Washington, DC.
Bannerman, R., D. Owens, R. Dodds, and N. Hornewer. 1993. Sources of pollutants in Wisconsin stormwater. Water Science and Technology 28(3-5): 241-259.
Cleland, B. August 15, 2002. TMDL development from the bottom up–Part II: Using load duration curves to connect the pieces. Washington, DC: America’s Clean Water Foundation.
Cleland, B. September 2003. TMDL development from the bottom up–Part III: Duration curves and wet-weather assessments. Washington, DC: America’s Clean Water Foundation.
Culver, T.B. Y. Jia, R. Tikoo, J. Simsic, and R. Garwood. 2002. Development of the Total Maximum Daily Load (TMDL) for fecal coliform bacteria in Moore’s Creek, Albemarle County, Virginia. Virginia Department of Environmental Quality.
Florida Administrative Code. Rule 62-302, Surface water quality standards.
———. Rule 62-303, Identification of impaired surface waters.
Florida Department of Environmental Protection. February 2001. A report to the Governor and the Legislature on the allocation of Total Maximum Daily Loads in Florida. Tallahassee, FL: Bureau of Watershed Management.
———. November 2001. Basin status report: Tampa Bay Basin. Tallahassee, FL: Bureau of Watershed Management.
———. Septermber 2003. Water quality assessment report: Tampa Bay Basin. Tallahassee, FL: Bureau of Watershed Management.
Florida Department of Health Website. 2008. Onsite sewage programs statistical data. Available: http://www.doh.state.fl.us/environment/OSTDS/statistics/ostdsstatistics.htm.
Florida Watershed Restoration Act. Chapter 99-223, Laws of Florida.
Lim, S., and V. Olivieri. 1982. Sources of microorganisms in urban runoff. Jones Falls Urban Runoff Project. Baltimore, MD: Johns Hopkins School of Public Health and Hygiene.
Minnesota Pollution Control Agency. 1999. Effect of septic systems on ground water quality. Ground Water and Assessment Program. Baxter, MN.
TMDL Report: Tampa Bay Basin, Alligator Creek (WBID 1574), Fecal Coliform, August 2009
Florida Department of Environmental Protection
28
Steuer, J., W. Selbig, N. Hornewer, and J. Prey. 1997. Sources of contamination in an urban basin in Marquette, Michigan, and an analysis of concentrations, loads, and data quality. U.S. Geological Survey Water Resources Investigation Report 97-4242. Middleton, MI.
Stiles, T. 2002. A simple method to define bacteria TMDLs in Kansas. Topeka, KS: Department of Health and Environment.
Trial, W., et al. 1993. Bacterial source tracking: Studies in an urban Seattle watershed. Puget Sound Notes 30: 1-3.
U.S. Census Bureau Website. 2007. Available: http://www.census.gov/.
U.S. Department of Agriculture. 2002. Agricultural census report.
U.S. Environmental Protection Agency. January 2001. Protocol for developing pathogen TMDLs. 1st ed. Washington, DC: Assessment and Watershed Protection Division. EPA 841-R-00-002.
———. 1994. Nonpoint source pollution: The nation's largest water quality problem. Pointer No. 1. EPA-841-F-94-005. Available: http://www.epa.gov/owow/nps/facts/point1.htm.
Van der Wel, B. 1995. Dog pollution. The Magazine of the Hydrological Society of South Australia, 2(1) 1.
Watson, T. June 6, 2002. Dog waste poses threat to water. USA Today.
Weiskel, P.K., B.L Howes, and G.R. Heufflder. 1996. Coliform contamination of a coastal embayment: Sources and transport pathway. Environmental Science and Technology 1872-1881.
TMDL Report: Tampa Bay Basin, Alligator Creek (WBID 1574), Fecal Coliform, August 2009
Florida Department of Environmental Protection
29
Appendices
Appendix A: Background Information on Federal and State Stormwater Programs
In 1982, Florida became the first state in the country to implement statewide regulations to address the issue of nonpoint source pollution by requiring new development and redevelopment to treat stormwater before it is discharged. The Stormwater Rule, as authorized in Chapter 403, F.S., was established as a technology-based program that relies on the implementation of BMPs that are designed to achieve a specific level of treatment (i.e., performance standards) as set forth in Rule 62-40, F.A.C. In 1994, the Department’s stormwater treatment requirements were integrated with the stormwater flood control requirements of the water management districts, along with wetland protection requirements, into the Environmental Resource Permit regulations.
Rule 62-40, F.A.C., also requires the state’s water management districts to establish stormwater pollutant load reduction goals (PLRGs) and adopt them as part of a Surface Water Improvement and Management (SWIM) plan, other watershed plan, or rule. Stormwater PLRGs are a major component of the load allocation part of a TMDL. To date, stormwater PLRGs have been established for Tampa Bay, Lake Thonotosassa, the Winter Haven Chain of Lakes, the Everglades, Lake Okeechobee, and Lake Apopka.
In 1987, the U.S. Congress established Section 402(p) as part of the federal Clean Water Act Reauthorization. This section of the law amended the scope of the federal NPDES permitting program to designate certain stormwater discharges as “point sources” of pollution. The EPA promulgated regulations and began implementing the Phase I NPDES Stormwater Program in 1990. These stormwater discharges include certain discharges that are associated with industrial activities designated by specific standard industrial classification (SIC) codes, construction sites disturbing 5 or more acres of land, and the master drainage systems of local governments with a population above 100,000, which are better known as MS4s. However, because the master drainage systems of most local governments in Florida are interconnected, the EPA implemented Phase I of the MS4 permitting program on a countywide basis, which brought in all cities (incorporated areas), Chapter 298 urban water control districts, and the FDOT throughout the 15 counties meeting the population criteria. The Department received authorization to implement the NPDES Stormwater Program in 2000.
An important difference between the federal NPDES and the state’s stormwater/environmental resource permitting programs is that the NPDES Program covers both new and existing discharges, while the state’s program focus on new discharges only. Additionally, Phase II of the NPDES Program, implemented in 2003, expands the need for these permits to construction sites between 1 and 5 acres, and to local governments with as few as 1,000 people. While these urban stormwater discharges are now technically referred to as “point sources” for the purpose of regulation, they are still diffuse sources of pollution that cannot be easily collected and treated by a central treatment facility, as are other point sources of pollution such as domestic and industrial wastewater discharges. It should be noted that all MS4 permits issued in Florida include a reopener clause that allows permit revisions to implement TMDLs when the implementation plan is formally adopted.


Florida Department of Environmental Protection Division of Environmental Assessment and Restoration
Bureau of Watershed Restoration 2600 Blair Stone Road, Mail Station 3565
Tallahassee, Florida 32399-2400