Embed Size (px)
Citation preview
The 2020/21 National Historic Vehicle Survey
The Federation of British Historic Vehicle ClubsPublished by
SUMMARY REPORT
THE 2020/21 NATIONAL HISTORIC VEHICLE SURVEY
FEBRUARY 2021

About the Federation of British Historic Vehicle ClubsThe Federation of British Historic Vehicle Clubs Ltd (FBHVC) exists to uphold the
freedom to use historic vehicles on the road. It does this by representing the interests
of owners of such vehicles to politicians, government officials, and legislators.
There are over 500 subscriber organisations representing a total membership of over
250,000 historic vehicle owners, in addition to individual and trade supporters.
www.fbhvc.co.uk
Registered address:
Federation of British Historic Vehicle Clubs Ltd,
PO Box 295, Upminster, Essex, RM14 9DG
What is a historic vehicle?
For the purposes of this National Historic Vehicle Survey, the FBHVC has followed the
international definition of Historic Vehicle; any form of mechanically propelled vehicle
that is over 30 years old, is preserved and maintained in a historically correct condition,
is not routinely used as daily transport and is part of our technical and cultural heritage.
This definition should not be confused with the UK Government’s criteria for historic
vehicle tax exemption which is based on vehicles more than 40 years old, nor with
HMRC’s definition of classic and historic cars for import duty and benefit in kind
purposes. The Federation recognises that there are many newer vehicles that attract the
term ‘classic’ rather than ‘historic’, particularly classic cars and motorcycles that
are sought after and valuable vehicles. These vehicles are not included in the survey.
JDA Insight & StrategyJDA is a consultancy that works with market research data to develop strategic thinking
for industry. JDA focuses on design, managing, executing, analysing and delivering
insight projects that inform and guide decision making across multiple sectors including
Motor, Sport, Manufacturing and Energy.
www.jdaresearch.co.uk
Unauthorised copying, adaptation, lending, re-sale charging for use, broadcast, cable
transmission, distribution or extraction of this work is prohibited. Findings from this
report may only be reproduced with the specific permission of the FBHVC.
Report designed by Matt Walker DVLA data supplied by GMAP Analytics
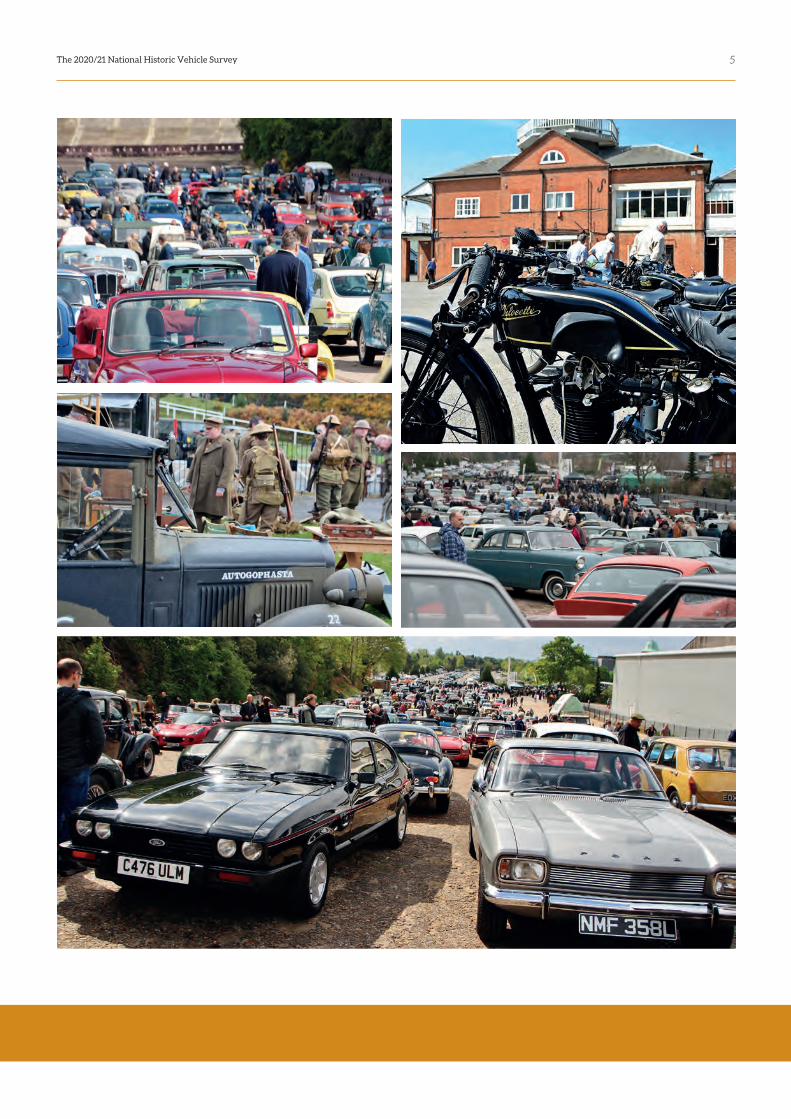
Photo credits: Page 5: Katherine Allen - Brooklands Museum, Tim Morris - Brooklands Museum, Katherine Allen - Brooklands Museum, Jason Dodd - Brooklands Museum, Katherine Allen - Brooklands Museum, Page 9: Katherine Allen - Brooklands Museum, Page 10/11 John Retter, Brooklands Museum, Page 12: Tim Morris, Brooklands Museum, Katherine Allen, Brooklands Museum, Page 13: John Retter, Brooklands Museum, Page 16: Stefan Land - Brooklands Museum, Page 17: Katherine Allen - Brooklands Museum, Page 18/19 Jason Dodd - Brooklands Museum.
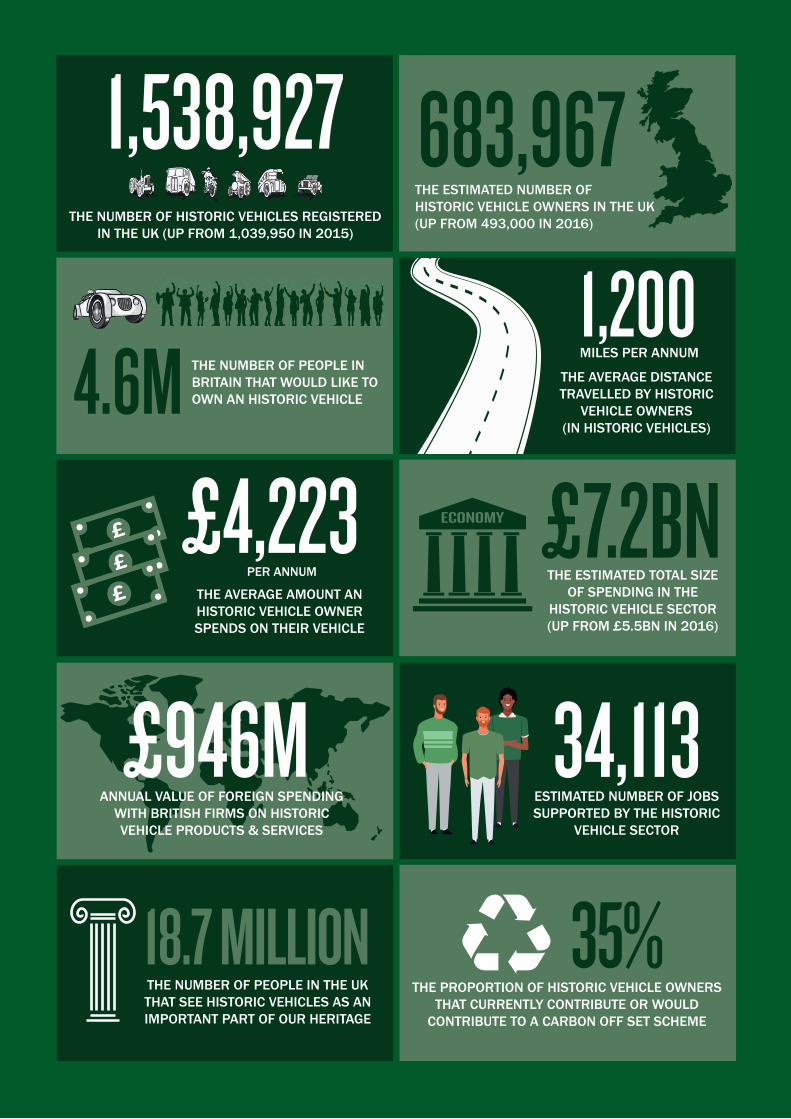
683,967
4.6M1,200
THE ESTIMATED NUMBER OF HISTORIC VEHICLE OWNERS IN THE UK(UP FROM 493,000 IN 2016)
THE NUMBER OF PEOPLE IN BRITAIN THAT WOULD LIKE TO OWN AN HISTORIC VEHICLE
MILES PER ANNUM
THE AVERAGE DISTANCE TRAVELLED BY HISTORIC
VEHICLE OWNERS (IN HISTORIC VEHICLES)
£7.2BN£4,223PER ANNUM
THE AVERAGE AMOUNT AN HISTORIC VEHICLE OWNER SPENDS ON THEIR VEHICLE
THE ESTIMATED TOTAL SIZE OF SPENDING IN THE
HISTORIC VEHICLE SECTOR(UP FROM £5.5BN IN 2016)
£946MANNUAL VALUE OF FOREIGN SPENDING
WITH BRITISH FIRMS ON HISTORIC VEHICLE PRODUCTS & SERVICES
34,113
18.7 MILLION 35%THE NUMBER OF PEOPLE IN THE UK THAT SEE HISTORIC VEHICLES AS AN IMPORTANT PART OF OUR HERITAGE
THE PROPORTION OF HISTORIC VEHICLE OWNERS THAT CURRENTLY CONTRIBUTE OR WOULD
CONTRIBUTE TO A CARBON OFF SET SCHEME
ESTIMATED NUMBER OF JOBS SUPPORTED BY THE HISTORIC
VEHICLE SECTOR
1,538,927THE NUMBER OF HISTORIC VEHICLES REGISTERED
IN THE UK (UP FROM 1,039,950 IN 2015)

The 2020/21 National Historic Vehicle Survey
FOREWORDfrom the Chairman
The Federation has been in existence for over 32 years and
its first major research project was undertaken 23 years
ago in 1997 when it was recognised that to be an effective
lobbying organisation, it needed facts about the historic vehicle
movement, facts that were not available from other sources.
The 2020 National Historic Vehicle Survey is our fifth major
research project. The results show a significant increase in both
historic vehicles and owners. On the face of it those facts alone
suggest a thriving movement. However while it sounds like a
cliché to say that we live in times of unprecedented change,
it is true. The threats to vehicles driven by the internal
combustion engine have never been greater. There is a huge
job to do to ensure Government and the public at large
recognise the importance of historic vehicles.
Nobody could have predicted the impact of the Covid pandemic
and the move towards electric vehicles has moved on at an ever
increasing rate. The introduction of electric vehicles of itself
will not affect historic vehicles based on the internal combustion
engine. What will affect our movement is the effect increasing
numbers of electric vehicles will have on the availability of
petrol and diesel and how historic vehicles will interact with
modern vehicles as they move towards autonomous driving
and other forms of automatic control. Our research seeks to
demonstrate the importance of historic vehicles both to the UK
economy and as heritage assets that should not be consigned
to the scrap heap of history.
I would like to thank all the contributors to our survey,
without your input, our research would not be as robust and
authoritative. This summary report identifies key statistics that
will be used in representations to Government and Government
agencies. There is a great deal of further information behind the
headlines and we have been releasing this through our Fact File
format. This has allowed us to successfully direct attention to
key survey findings and specific issues of importance.
I would also like to thank JDA Research for their work in
designing the enthusiast, club and trade surveys and for their
expertise in drawing out and presenting the key threads from
the survey results.
I hope you enjoy reading the report and that its content will
cause you to reflect on how important the historic vehicle
community is to the United Kingdom.
David Whale
Chairman
February 2021
David Whale
4
The 2020/21 National Historic Vehicle Survey 5

The 2020/21 National Historic Vehicle Survey
The number of registered historic vehicles in the UK
Over the next 5 years we estimate that the number of vehicles
defined as historic will grow by an additional 600K meaning
the total number will exceed 2 million vehicles by 2025.
The number of registered young timer vehicles in the UK
(manufactured between 1991 and 1995)
Chart 1: Growth in registered historic vehicles (2015-2020)Source: Analysis of the DVLA database registered vehicles.
GROWTH IN HISTORIC VEHICLES 5 YEAR TREND
PROFILE OF HISTORIC VEHICLES BY TYPE & MAKE
The figure for historic vehicles now stands at more than 1.5 million, an increase of nearly 50% since December 2015. Historic vehicles account for just 3.4% of all vehicles registered on the DVLA database, but fewer than half of these vehicles (44%) are licensed for on-road use.
The rapid growth in historic vehicles
1,538,927 584,393
6
Cars Agricultural Tractors (2018 includes ‘others’)
Motorcycles Other (vans, buses/coaches, motorhomes and other)
Plant 1%
CARS 774,649 (50%) MOTORCYCLE
S 417
,535
(27%
)Ag
. Tra
ctor
144,
815
(10%
)
Vans, Bus/Coach
Motorhome & Other
201,978 (13%)
CARS 512,499 (49%) MOTORYCLES 296,9
36 (2
9%)
AG. T
RACT
ORS)
MOTORHOME & OTHER
VANS, BUS & COACH
105,7
03 (1
0%)
124,812 (12%)
2020
774,659607,240
512,499
296,936
105,703
124,812
344,131
290,492
417,535
144,815
201,928
20182015RESISTERED HISTORIC VEHICLES IN THE UK
1,039,950
1,241,863
1,538,927
2015
2020
Note: Thanks to GMAP Analytics Ltd for
provision of data for DVLA analysis.
The 2020/21 National Historic Vehicle Survey
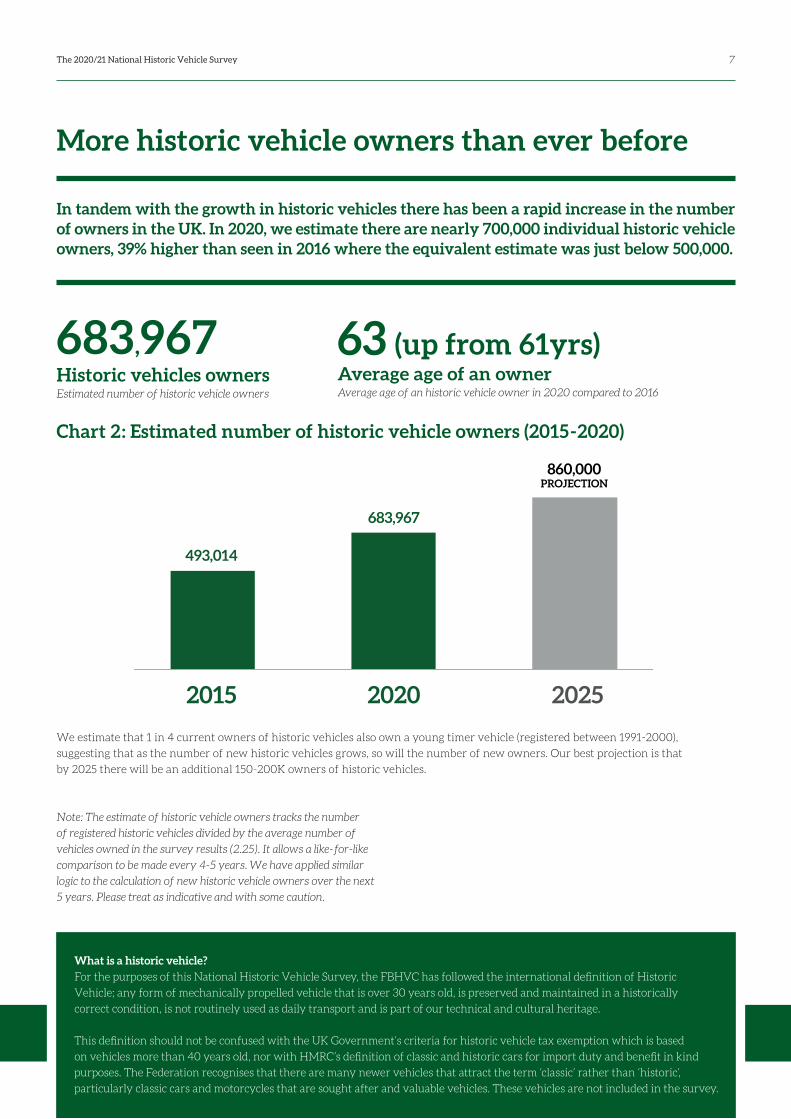
We estimate that 1 in 4 current owners of historic vehicles also own a young timer vehicle (registered between 1991-2000),
suggesting that as the number of new historic vehicles grows, so will the number of new owners. Our best projection is that
by 2025 there will be an additional 150-200K owners of historic vehicles.
Note: The estimate of historic vehicle owners tracks the number
of registered historic vehicles divided by the average number of
vehicles owned in the survey results (2.25). It allows a like-for-like
comparison to be made every 4-5 years. We have applied similar
logic to the calculation of new historic vehicle owners over the next
5 years. Please treat as indicative and with some caution.
Average age of an ownerAverage age of an historic vehicle owner in 2020 compared to 2016
Chart 2: Estimated number of historic vehicle owners (2015-2020)
In tandem with the growth in historic vehicles there has been a rapid increase in the number of owners in the UK. In 2020, we estimate there are nearly 700,000 individual historic vehicle owners, 39% higher than seen in 2016 where the equivalent estimate was just below 500,000.
More historic vehicle owners than ever before
(up from 61yrs)683,967 63
2020 20252015
493,014
683,967
860,000PROJECTION
7
Historic vehicles ownersEstimated number of historic vehicle owners
What is a historic vehicle?
For the purposes of this National Historic Vehicle Survey, the FBHVC has followed the international definition of Historic
Vehicle; any form of mechanically propelled vehicle that is over 30 years old, is preserved and maintained in a historically
correct condition, is not routinely used as daily transport and is part of our technical and cultural heritage.
This definition should not be confused with the UK Government’s criteria for historic vehicle tax exemption which is based
on vehicles more than 40 years old, nor with HMRC’s definition of classic and historic cars for import duty and benefit in kind
purposes. The Federation recognises that there are many newer vehicles that attract the term ‘classic’ rather than ‘historic’,
particularly classic cars and motorcycles that are sought after and valuable vehicles. These vehicles are not included in the survey.

The 2020/21 National Historic Vehicle Survey
The average mileage driven or ridden per annum in a historic vehicle is 1,200 miles.
This estimate remains virtually unchanged from 2015 (1,124 miles) indicating that
use of historic vehicles has changed little in that time.
At the time of our survey only 44% of historic vehicles are licensed for the road and
are used, on average, around 16 times per annum.
Many owners (54%) use their vehicles for short runs, or to attend related events (46%).
Overall, we estimate that historic vehicles account for fewer than 800 million miles
per annum. This equates to 0.2% of all miles driven by all forms of motor transport
in the UK.
Historic vehicle owners are environmentally aware with 35% saying they would,
or already do, contribute to a carbon offset scheme, and more than half (52%)
believing that zero emissions is a good idea.
Note: Total mileage percentage estimate is based on a total of 356.6 billion miles driven
by all UK vehicles according to DVLA.
Miles per annumAverage miles driven per annum in a
historic vehicles (no change from 2016)
Million milesMileage driven or ridden by historic
vehicles per annum (an estimated 0.2%
of all miles driven or ridden in the UK)
1,200Used for short runsProportion of historic vehicles used
for short runs (no change from 2016)
54%
Times per annumAverage naumber of times an historic
vehicle is driven or ridden on the road
per annum (no change from 2016)
of all miles travelled on UK roads The proportion of all miles accounted
for by historic vehicles
16 0.2%
800Environmentally awareHistoric vehicle owners that currently
contribute or would contribute to a
carbon off set scheme
35%
8
Few historic vehicles are used for regular transport
The 2020/21 National Historic Vehicle Survey
The 2020/21 National Historic Vehicle Survey
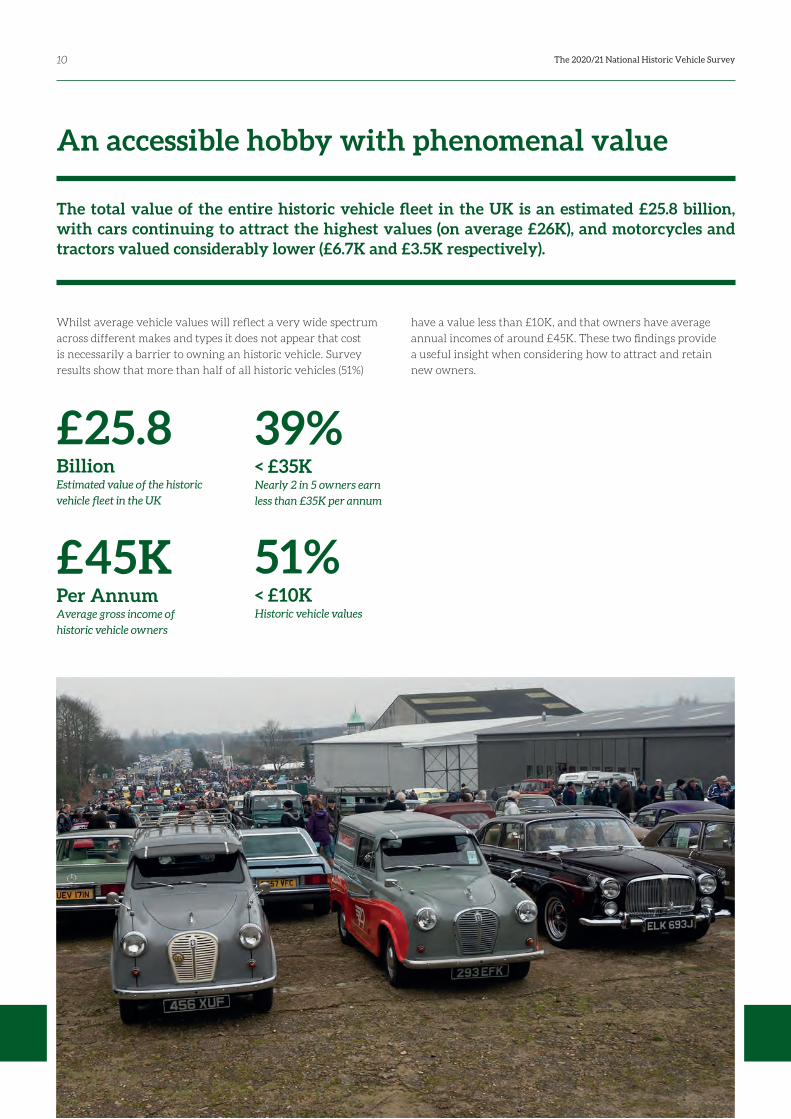
The total value of the entire historic vehicle fleet in the UK is an estimated £25.8 billion, with cars continuing to attract the highest values (on average £26K), and motorcycles and tractors valued considerably lower (£6.7K and £3.5K respectively).
Whilst average vehicle values will reflect a very wide spectrum
across different makes and types it does not appear that cost
is necessarily a barrier to owning an historic vehicle. Survey
results show that more than half of all historic vehicles (51%)
An accessible hobby with phenomenal value
have a value less than £10K, and that owners have average
annual incomes of around £45K. These two findings provide
a useful insight when considering how to attract and retain
new owners.
BillionEstimated value of the historic
vehicle fleet in the UK
Per AnnumAverage gross income of
historic vehicle owners
£25.8
£45K< £10KHistoric vehicle values
51%
< £35KNearly 2 in 5 owners earn
less than £35K per annum
39%
10
The 2020/21 National Historic Vehicle Survey
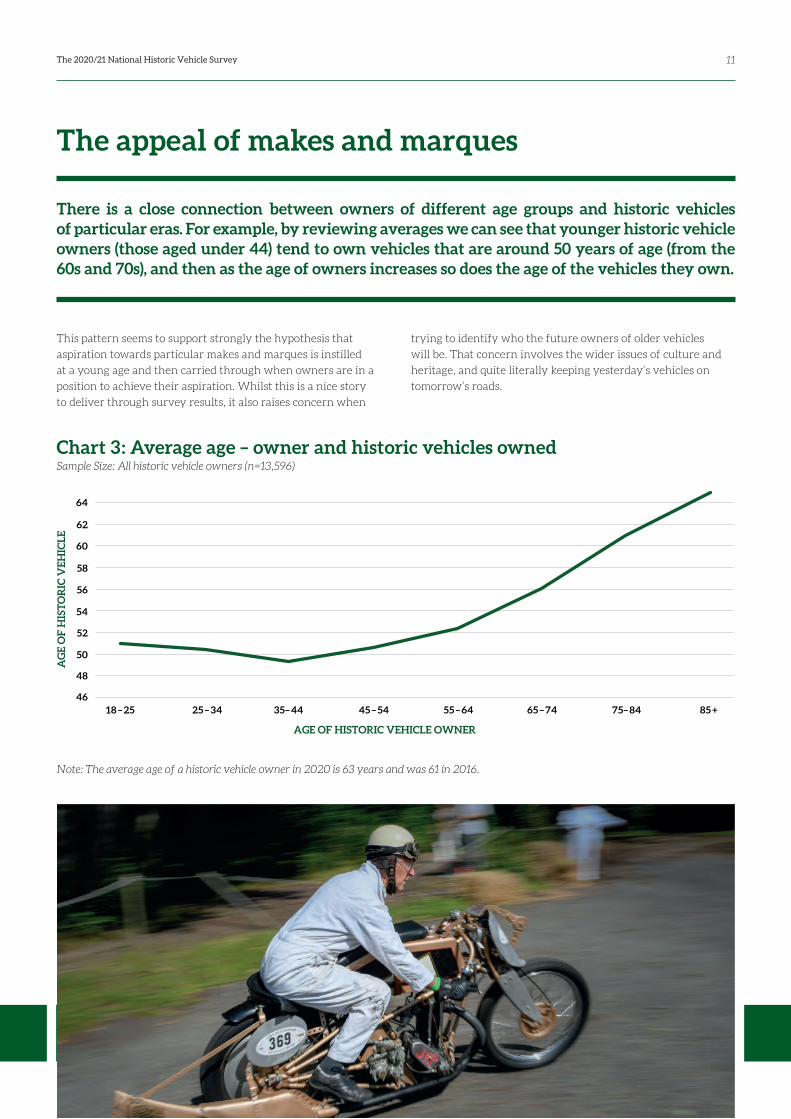
This pattern seems to support strongly the hypothesis that
aspiration towards particular makes and marques is instilled
at a young age and then carried through when owners are in a
position to achieve their aspiration. Whilst this is a nice story
to deliver through survey results, it also raises concern when
Note: The average age of a historic vehicle owner in 2020 is 63 years and was 61 in 2016.
There is a close connection between owners of different age groups and historic vehicles of particular eras. For example, by reviewing averages we can see that younger historic vehicle owners (those aged under 44) tend to own vehicles that are around 50 years of age (from the 60s and 70s), and then as the age of owners increases so does the age of the vehicles they own.
The appeal of makes and marques
trying to identify who the future owners of older vehicles
will be. That concern involves the wider issues of culture and
heritage, and quite literally keeping yesterday’s vehicles on
tomorrow’s roads.
Sample Size: All historic vehicle owners (n=13,596)
Chart 3: Average age – owner and historic vehicles owned
11
18 – 2546
48
50
52
54
56
58
60
62
64
25 – 34 35– 44 45 – 54 55 – 64 65 – 74 75– 84 85 +
AGE OF HISTORIC VEHICLE OWNER
The 2020/21 National Historic Vehicle Survey
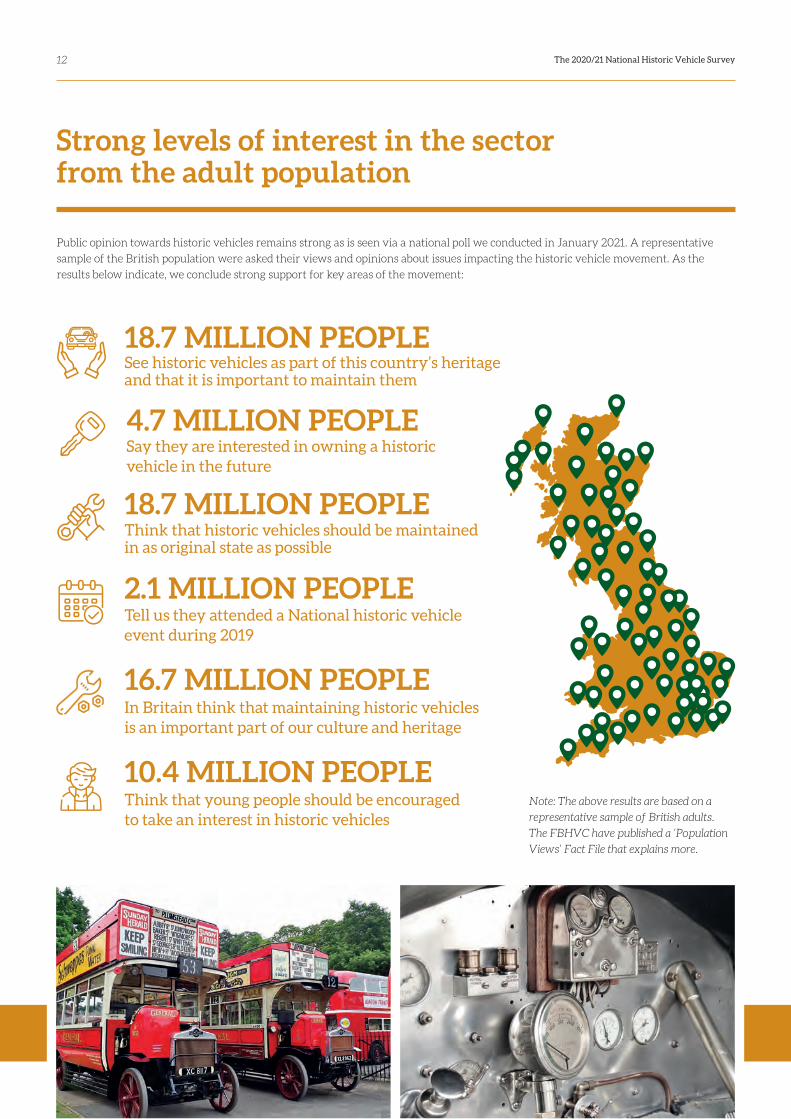
Public opinion towards historic vehicles remains strong as is seen via a national poll we conducted in January 2021. A representative
sample of the British population were asked their views and opinions about issues impacting the historic vehicle movement. As the
results below indicate, we conclude strong support for key areas of the movement:
Note: The above results are based on a
representative sample of British adults.
The FBHVC have published a ‘Population
Views’ Fact File that explains more.
Strong levels of interest in the sector from the adult population
See historic vehicles as part of this country’s heritage and that it is important to maintain them
18.7 MILLION PEOPLE
Tell us they attended a National historic vehicle event during 2019
2.1 MILLION PEOPLE
In Britain think that maintaining historic vehicles is an important part of our culture and heritage
16.7 MILLION PEOPLE
Think that young people should be encouraged to take an interest in historic vehicles
10.4 MILLION PEOPLE
Think that historic vehicles should be maintained in as original state as possible
18.7 MILLION PEOPLE
Say they are interested in owning a historic vehicle in the future
4.7 MILLION PEOPLE
12
The 2020/21 National Historic Vehicle Survey
The 2020/21 National Historic Vehicle Survey
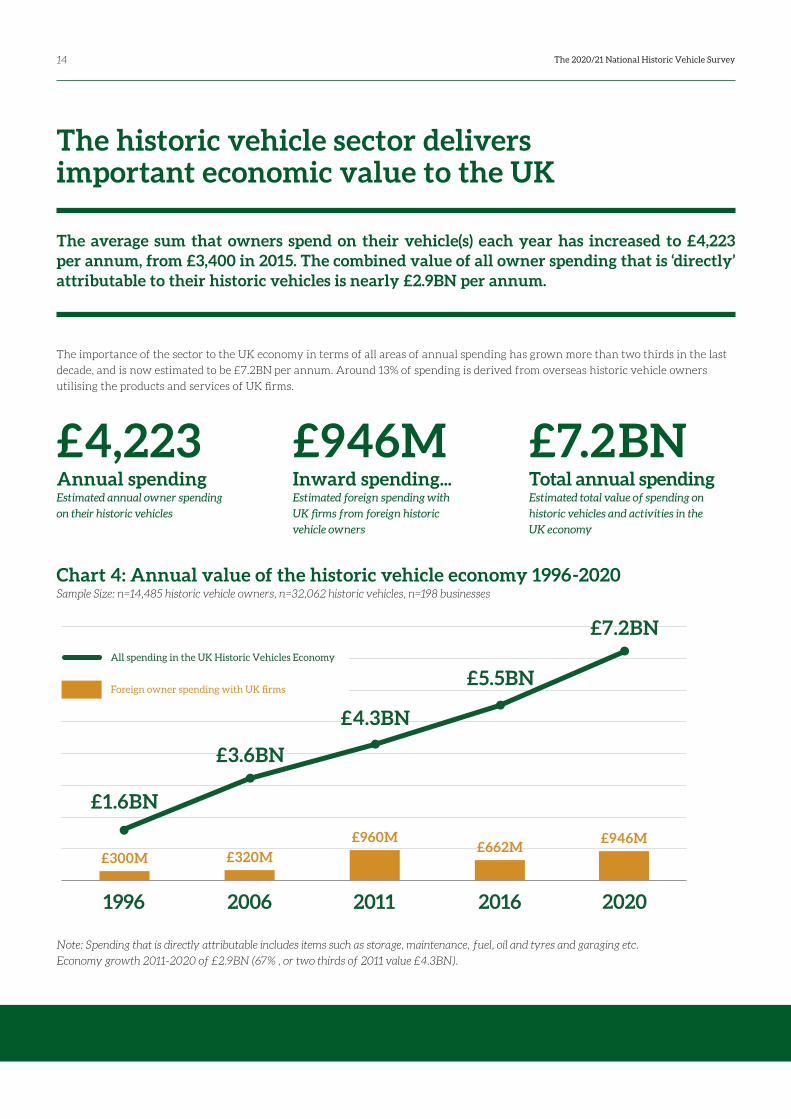
The average sum that owners spend on their vehicle(s) each year has increased to £4,223 per annum, from £3,400 in 2015. The combined value of all owner spending that is ‘directly’ attributable to their historic vehicles is nearly £2.9BN per annum.
The importance of the sector to the UK economy in terms of all areas of annual spending has grown more than two thirds in the last
decade, and is now estimated to be £7.2BN per annum. Around 13% of spending is derived from overseas historic vehicle owners
utilising the products and services of UK firms.
Note: Spending that is directly attributable includes items such as storage, maintenance, fuel, oil and tyres and garaging etc.
Economy growth 2011-2020 of £2.9BN (67% , or two thirds of 2011 value £4.3BN).
The historic vehicle sector delivers important economic value to the UK
Chart 4: Annual value of the historic vehicle economy 1996-2020 Sample Size: n=14,485 historic vehicle owners, n=32,062 historic vehicles, n=198 businesses
Annual spendingEstimated annual owner spending
on their historic vehicles
£4,223Total annual spendingEstimated total value of spending on
historic vehicles and activities in the
UK economy
£7.2BNInward spending...Estimated foreign spending with
UK firms from foreign historic
vehicle owners
£946M
14
2020
£7.2BN
£5.5BN
£4.3BN
£3.6BN
£1.6BN
2016201120061996
£946M£662M
£960M
£320M£300M
All spending in the UK Historic Vehicles Economy
Foreign owner spending with UK firms
The 2020/21 National Historic Vehicle Survey
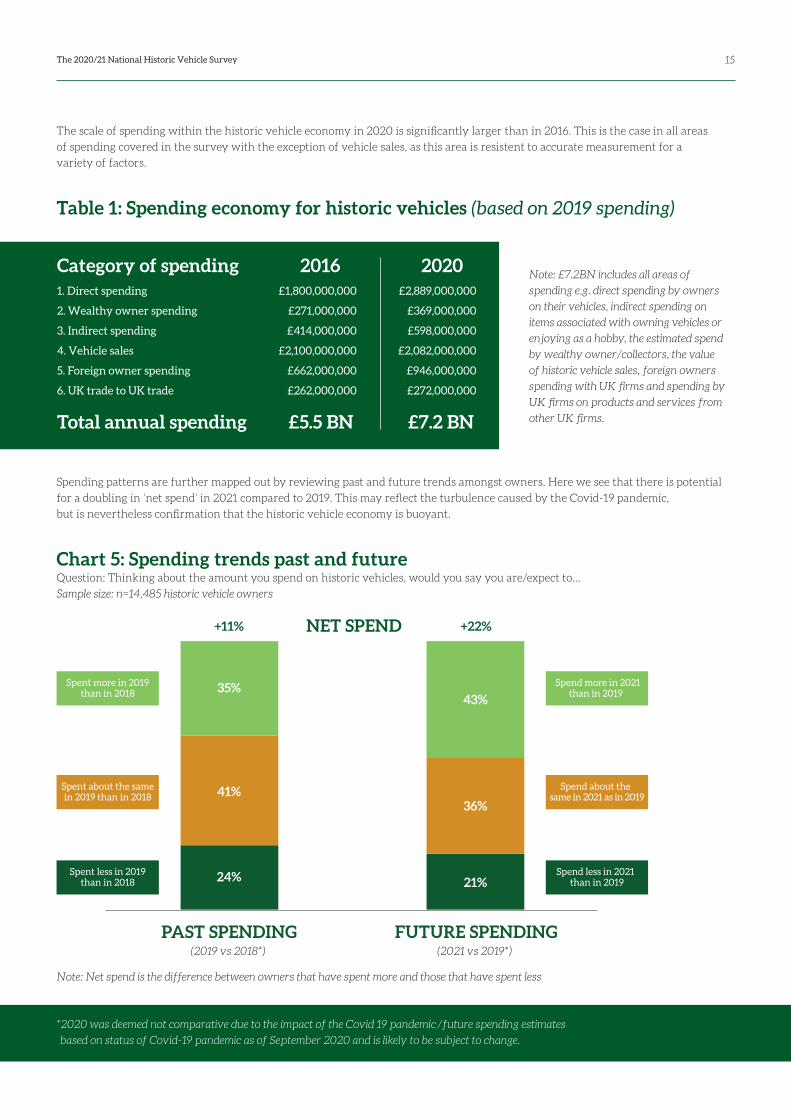
The scale of spending within the historic vehicle economy in 2020 is significantly larger than in 2016. This is the case in all areas
of spending covered in the survey with the exception of vehicle sales, as this area is resistent to accurate measurement for a
variety of factors.
Note: £7.2BN includes all areas of
spending e.g. direct spending by owners
on their vehicles, indirect spending on
items associated with owning vehicles or
enjoying as a hobby, the estimated spend
by wealthy owner/collectors, the value
of historic vehicle sales, foreign owners
spending with UK firms and spending by
UK firms on products and services from
other UK firms.
Spending patterns are further mapped out by reviewing past and future trends amongst owners. Here we see that there is potential
for a doubling in ‘net spend’ in 2021 compared to 2019. This may reflect the turbulence caused by the Covid-19 pandemic,
but is nevertheless confirmation that the historic vehicle economy is buoyant.
Table 1: Spending economy for historic vehicles (based on 2019 spending)
Chart 5: Spending trends past and future Question: Thinking about the amount you spend on historic vehicles, would you say you are/expect to…
Sample size: n=14,485 historic vehicle owners
Category of spending1. Direct spending
2. Wealthy owner spending
3. Indirect spending
4. Vehicle sales
5. Foreign owner spending
6. UK trade to UK trade
2016£1,800,000,000
£271,000,000
£414,000,000
£2,100,000,000
£662,000,000
£262,000,000
2020£2,889,000,000
£369,000,000
£598,000,000
£2,082,000,000
£946,000,000
£272,000,000
Total annual spending £5.5 BN £7.2 BN
15
FUTURE SPENDING
NET SPEND
PAST SPENDING
35%
+11% +22%
41%
24% 21%
36%
43%
Spent more in 2019 than in 2018
Spent about the same in 2019 than in 2018
Spent less in 2019than in 2018
Spend more in 2021 than in 2019
Spend about the same in 2021 as in 2019
Spend less in 2021 than in 2019
Note: Net spend is the difference between owners that have spent more and those that have spent less
(2019 vs 2018*) (2021 vs 2019*)
*2020 was deemed not comparative due to the impact of the Covid 19 pandemic/future spending estimates
based on status of Covid-19 pandemic as of September 2020 and is likely to be subject to change.
The 2020/21 National Historic Vehicle Survey
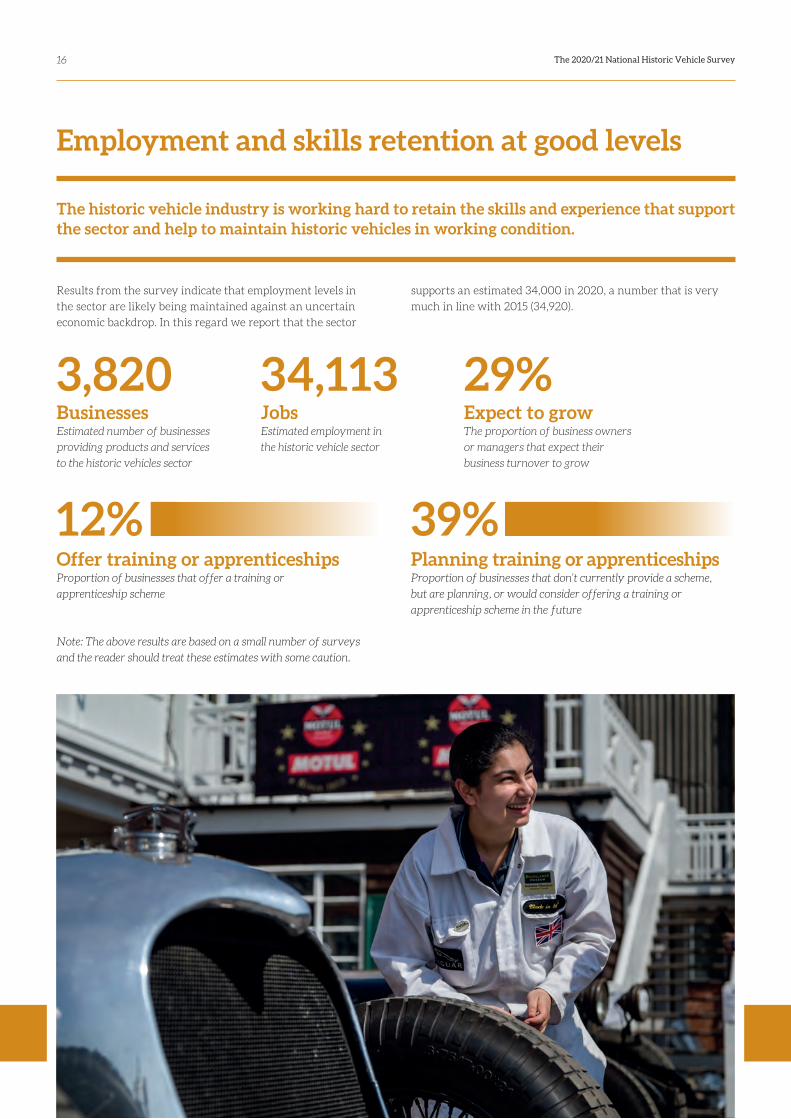
Results from the survey indicate that employment levels in
the sector are likely being maintained against an uncertain
economic backdrop. In this regard we report that the sector
The historic vehicle industry is working hard to retain the skills and experience that support the sector and help to maintain historic vehicles in working condition.
Employment and skills retention at good levels
BusinessesEstimated number of businesses
providing products and services
to the historic vehicles sector
Expect to growThe proportion of business owners
or managers that expect their
business turnover to grow
JobsEstimated employment in
the historic vehicle sector
3,820 29%34,113
Offer training or apprenticeshipsProportion of businesses that offer a training or
apprenticeship scheme
Planning training or apprenticeshipsProportion of businesses that don’t currently provide a scheme,
but are planning, or would consider offering a training or
apprenticeship scheme in the future
12% 39%
16
Note: The above results are based on a small number of surveys
and the reader should treat these estimates with some caution.
supports an estimated 34,000 in 2020, a number that is very
much in line with 2015 (34,920).
The 2020/21 National Historic Vehicle Survey
The 2020/21 National Historic Vehicle Survey
Methodology summary
Scope of the report
The objectives of this report are to highlight some headline results from the 2020
National Historic Vehicle Survey. We have drawn results from a range of sources
to give you, the reader, a wide perspective of the historic vehicle movement in the
United Kingdom.
Our hope is that the findings provide a valuable resource to the industry and further
stimulate understanding of the sector across an important range of stakeholders
including government, politicians, international partner bodies, together with historic
vehicle enthusiasts and other interests groups amongst the British population.
Methodology
The results presented in this report have been taken from three stages of primary
research undertaken by JDA Research:
1. 15,422 online surveys with historic vehicle owners (n=14,485) and enthusiasts
(n=937) were completed between May and October 2020. The survey questionnaire
was approximately 15 minutes in length and included questions on interest,
ownership, cost of ownership, together with a range of questions about behaviours
associated with the historic vehicles sector e.g. event attendance. The survey was
promoted by the FBHVC and via clubs, on social media and through events
media partners.
2. 206 online surveys with businesses that provide products and services to the historic
vehicle sector were completed between September and October 2020. These include
a range of different types of business from repair and restoration to museums and
events. The survey questionnaire was approximately 15 minutes in length and
included questions on attitudes and opinions and level of turnover and export.
Please note: This survey was not structured to be representative of the sector and only
provides an indicative level of insight that can be measured against the equivalent
survey in 2016. Treat with caution.
3. 2,500 online surveys with a representative sample of the GB population were
conducted by Kantar research in January 2021. All surveys were conducted via an
online panel of respondents and representative of the population by age, gender and
region. The survey asked questions that aimed to measure public opinions, attitudes
and levels of interest in historic vehicles.
General notes to reader:
While every care has been taken to ensure accuracy in presenting these results, there
is nevertheless the need to review these findings with a critical eye. The sector is
resistant to a complete review due to its complexity and, indeed, this survey does not
attempt to conduct a complete analysis. Assumptions made in this survey may be
different to other surveys conducted in the sector.
For the purpose of clarification, where appropriate we refer to the British Population
(relating to England, Scotland and Wales). This is to help the reader appreciate the scale
and volume of opinion associated with our areas of investigation when surveying the
British population. For the purposes of estimating population sizes, we have based
grossing up on the adult (16+) population estimate of 51.9 million people).
18
The 2020/21 National Historic Vehicle Survey

The Federation of British Historic Vehicle Clubs
Federation of British Historic Vehicle Clubs Ltd, PO Box 295, Upminster, Essex, RM14 9DG
t: 01708 223111 e: [email protected] w: www.fbhvc.co.uk