Embed Size (px)
Citation preview
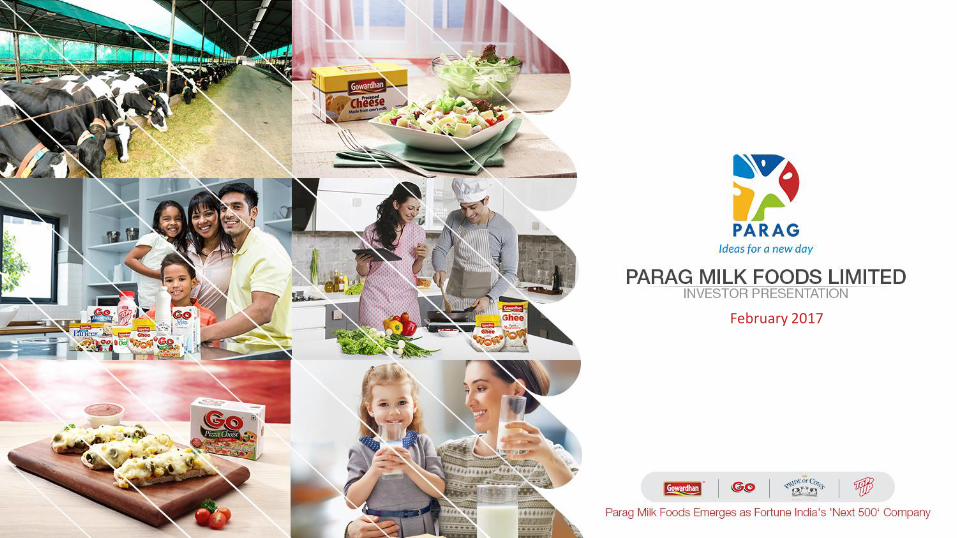
February 2017
Company Overview
Competitive Strengths
Strategic Initiatives & Outlook
Q3 & 9M FY17 Result highlights
Financial Outlook
1
2
3
4
5
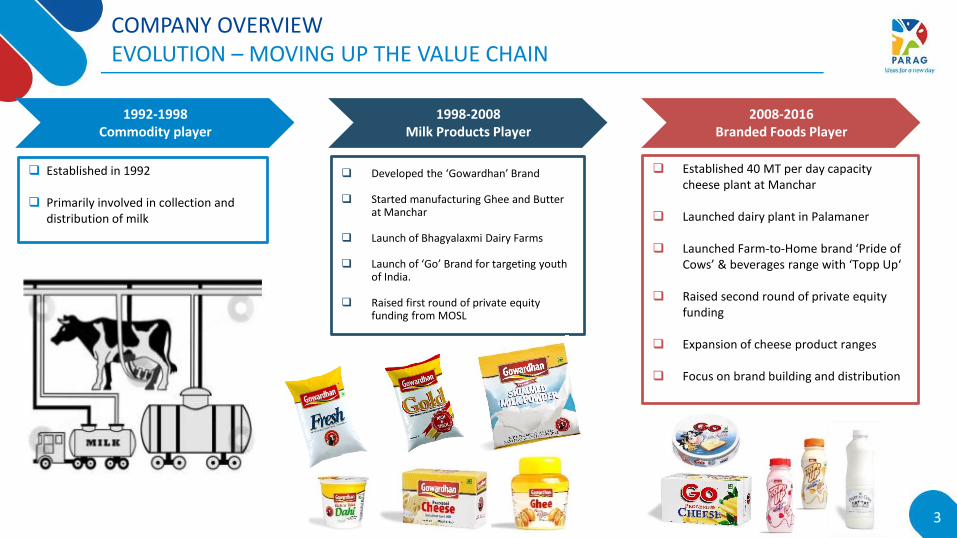
COMPANY OVERVIEWEVOLUTION – MOVING UP THE VALUE CHAIN
1992-1998Commodity player
Established in 1992
Primarily involved in collection and distribution of milk
Developed the ‘Gowardhan’ Brand
Started manufacturing Ghee and Butter at Manchar
Launch of Bhagyalaxmi Dairy Farms
Launch of ‘Go’ Brand for targeting youth of India.
Raised first round of private equity funding from MOSL
Established 40 MT per day capacity cheese plant at Manchar
Launched dairy plant in Palamaner
Launched Farm-to-Home brand ‘Pride of Cows’ & beverages range with ‘Topp Up‘
Raised second round of private equity funding
Expansion of cheese product ranges
Focus on brand building and distribution
1998-2008Milk Products Player
2008-2016Branded Foods Player
3
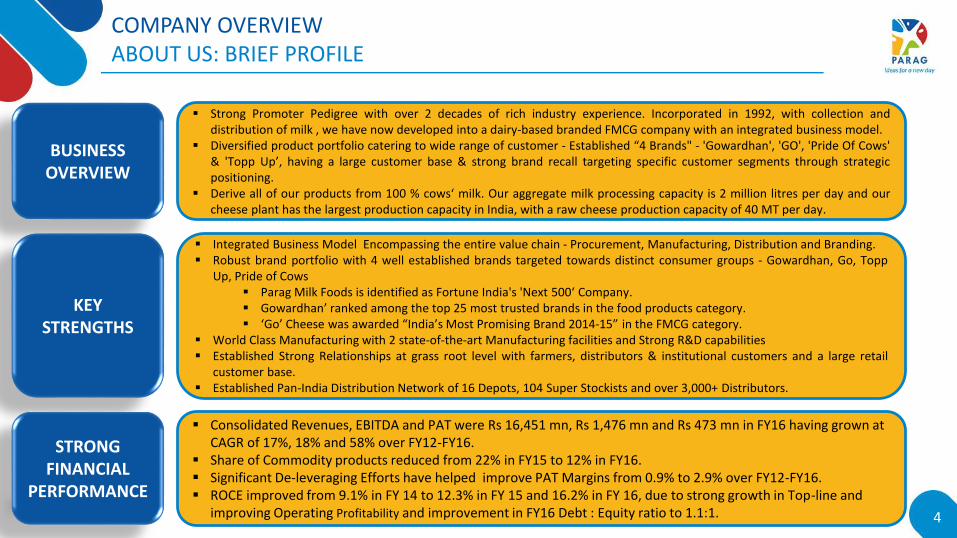
COMPANY OVERVIEWABOUT US: BRIEF PROFILE
BUSINESS OVERVIEW
KEY STRENGTHS
Strong Promoter Pedigree with over 2 decades of rich industry experience. Incorporated in 1992, with collection anddistribution of milk , we have now developed into a dairy-based branded FMCG company with an integrated business model.
Diversified product portfolio catering to wide range of customer - Established “4 Brands" - 'Gowardhan', 'GO', 'Pride Of Cows'& 'Topp Up’, having a large customer base & strong brand recall targeting specific customer segments through strategicpositioning.
Derive all of our products from 100 % cows‘ milk. Our aggregate milk processing capacity is 2 million litres per day and ourcheese plant has the largest production capacity in India, with a raw cheese production capacity of 40 MT per day.
Integrated Business Model Encompassing the entire value chain - Procurement, Manufacturing, Distribution and Branding. Robust brand portfolio with 4 well established brands targeted towards distinct consumer groups - Gowardhan, Go, Topp
Up, Pride of Cows Parag Milk Foods is identified as Fortune India's 'Next 500‘ Company. Gowardhan’ ranked among the top 25 most trusted brands in the food products category. ‘Go’ Cheese was awarded “India’s Most Promising Brand 2014-15” in the FMCG category.
World Class Manufacturing with 2 state-of-the-art Manufacturing facilities and Strong R&D capabilities Established Strong Relationships at grass root level with farmers, distributors & institutional customers and a large retail
customer base. Established Pan-India Distribution Network of 16 Depots, 104 Super Stockists and over 3,000+ Distributors.
STRONG FINANCIAL
PERFORMANCE
Consolidated Revenues, EBITDA and PAT were Rs 16,451 mn, Rs 1,476 mn and Rs 473 mn in FY16 having grown at CAGR of 17%, 18% and 58% over FY12-FY16.
Share of Commodity products reduced from 22% in FY15 to 12% in FY16. Significant De-leveraging Efforts have helped improve PAT Margins from 0.9% to 2.9% over FY12-FY16. ROCE improved from 9.1% in FY 14 to 12.3% in FY 15 and 16.2% in FY 16, due to strong growth in Top-line and
improving Operating Profitability and improvement in FY16 Debt : Equity ratio to 1.1:1. 4
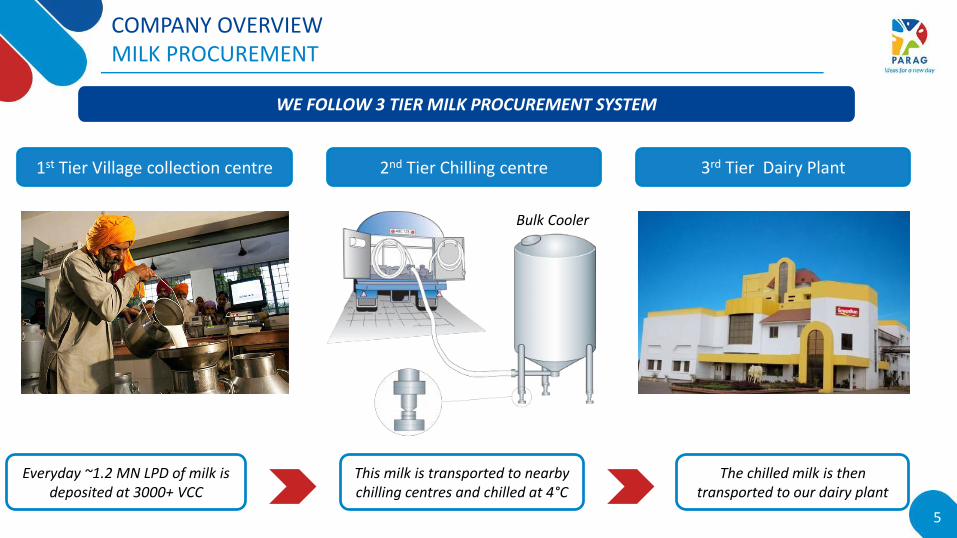
COMPANY OVERVIEWMILK PROCUREMENT
WE FOLLOW 3 TIER MILK PROCUREMENT SYSTEM
1st Tier Village collection centre 2nd Tier Chilling centre 3rd Tier Dairy Plant
Everyday ~1.2 MN LPD of milk is deposited at 3000+ VCC
This milk is transported to nearby chilling centres and chilled at 4°C
The chilled milk is then transported to our dairy plant
Bulk Cooler
5
Company Overview
Competitive Strengths
Strategic Initiatives & Outlook
Q3 & 9M FY17 Result highlights
Financial Outlook
1
2
3
4
5
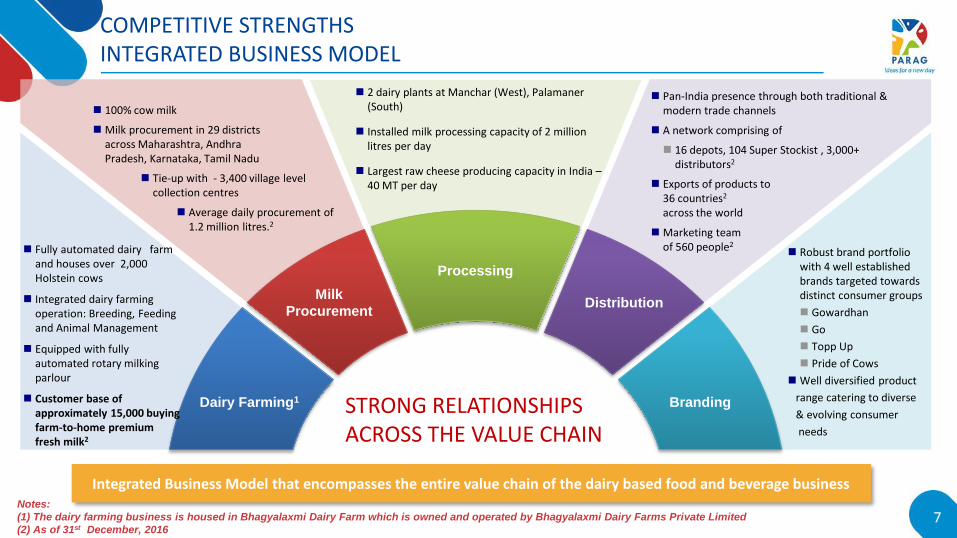
COMPETITIVE STRENGTHSINTEGRATED BUSINESS MODEL
Integrated Business Model that encompasses the entire value chain of the dairy based food and beverage business
2 dairy plants at Manchar (West), Palamaner (South)
Installed milk processing capacity of 2 million litres per day
Largest raw cheese producing capacity in India –40 MT per day
Branding
Processing
Dairy Farming1
Milk
ProcurementDistribution
100% cow milk
Milk procurement in 29 districts across Maharashtra, Andhra Pradesh, Karnataka, Tamil Nadu
Tie-up with - 3,400 village level collection centres
Average daily procurement of 1.2 million litres.2
Fully automated dairy farm and houses over 2,000 Holstein cows
Integrated dairy farming operation: Breeding, Feeding and Animal Management
Equipped with fully automated rotary milking parlour
Customer base of approximately 15,000 buying farm-to-home premium fresh milk2
Pan-India presence through both traditional & modern trade channels
A network comprising of
16 depots, 104 Super Stockist , 3,000+ distributors2
Exports of products to 36 countries2
across the world
Marketing team of 560 people2
Robust brand portfolio with 4 well established brands targeted towards distinct consumer groups
Gowardhan
Go
Topp Up
Pride of Cows
Well diversified product
range catering to diverse
& evolving consumer
needs
STRONG RELATIONSHIPS ACROSS THE VALUE CHAIN
Notes:
(1) The dairy farming business is housed in Bhagyalaxmi Dairy Farm which is owned and operated by Bhagyalaxmi Dairy Farms Private Limited
(2) As of 31st December, 20167
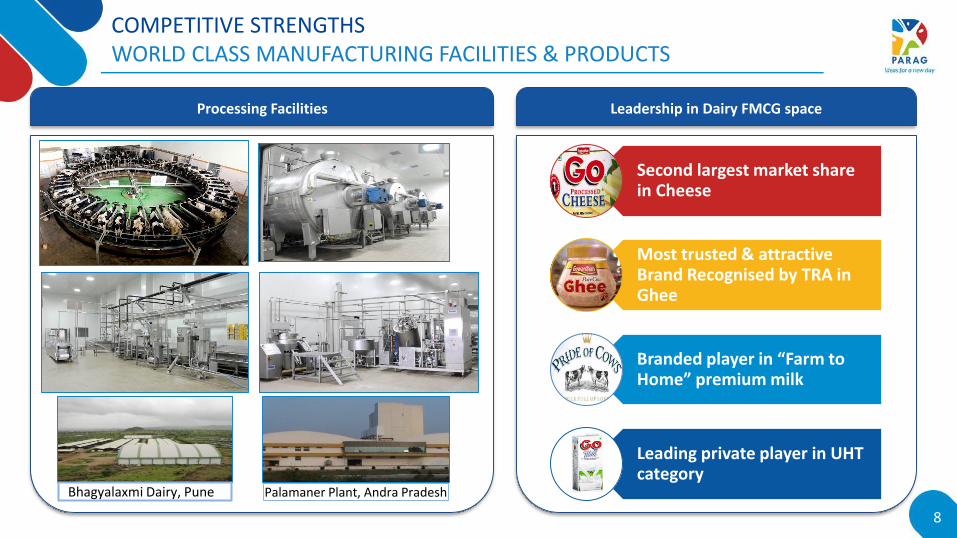
COMPETITIVE STRENGTHSWORLD CLASS MANUFACTURING FACILITIES & PRODUCTS
Processing Facilities
Bhagyalaxmi Dairy, Pune Palamaner Plant, Andra Pradesh
8
Leadership in Dairy FMCG space
Second largest market share in Cheese
Most trusted & attractive Brand Recognised by TRA in Ghee
Branded player in “Farm to Home” premium milk
Leading private player in UHT category
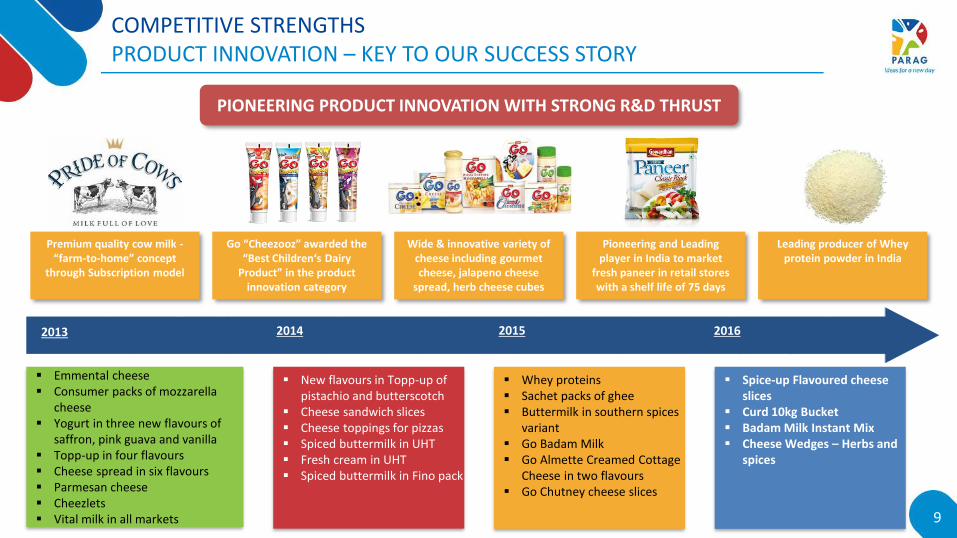
COMPETITIVE STRENGTHSPRODUCT INNOVATION – KEY TO OUR SUCCESS STORY
Source: IMARC Report dated July 30, 2015
Premium quality cow milk -“farm-to-home” concept
through Subscription model
Go “Cheezooz” awarded the “Best Children‘s Dairy
Product” in the product innovation category
Wide & innovative variety of cheese including gourmet cheese, jalapeno cheese
spread, herb cheese cubes
Pioneering and Leading player in India to market
fresh paneer in retail stores with a shelf life of 75 days
Leading producer of Whey protein powder in India
PIONEERING PRODUCT INNOVATION WITH STRONG R&D THRUST
201520142013
Emmental cheese Consumer packs of mozzarella
cheese Yogurt in three new flavours of
saffron, pink guava and vanilla Topp-up in four flavours Cheese spread in six flavours Parmesan cheese Cheezlets Vital milk in all markets
New flavours in Topp-up of pistachio and butterscotch
Cheese sandwich slices Cheese toppings for pizzas Spiced buttermilk in UHT Fresh cream in UHT Spiced buttermilk in Fino pack
Whey proteins Sachet packs of ghee Buttermilk in southern spices
variant Go Badam Milk Go Almette Creamed Cottage
Cheese in two flavours Go Chutney cheese slices
2016
Spice-up Flavoured cheese slices
Curd 10kg Bucket Badam Milk Instant Mix Cheese Wedges – Herbs and
spices
9
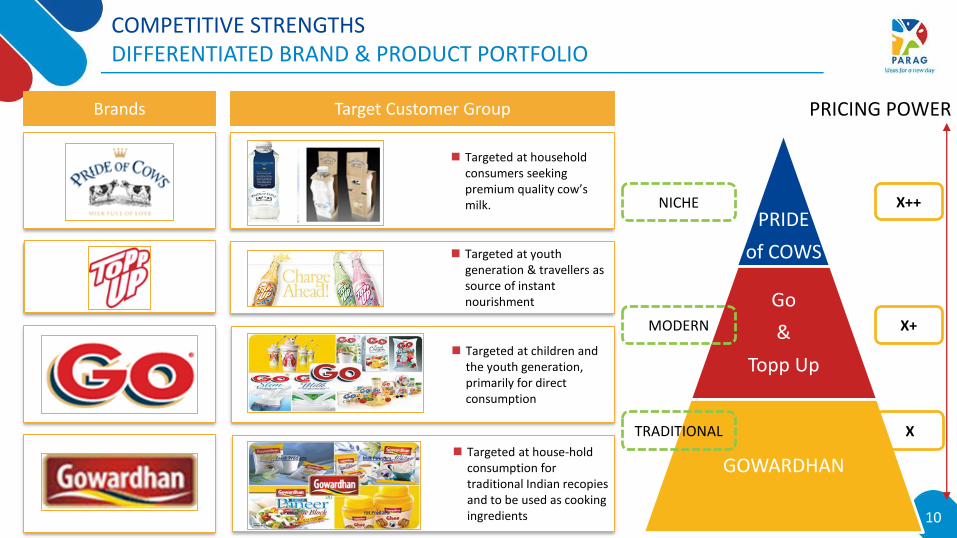
Targeted at house-hold consumption for traditional Indian recopies and to be used as cooking ingredients
COMPETITIVE STRENGTHSDIFFERENTIATED BRAND & PRODUCT PORTFOLIO
Brands Target Customer Group
Targeted at children and the youth generation, primarily for direct consumption
Targeted at household consumers seeking premium quality cow’s milk.
Targeted at youth generation & travellers as source of instant nourishment
10
PRIDE
of COWS
Go
&
Topp Up
GOWARDHAN
PRICING POWER
X
X+
X++
TRADITIONAL
MODERN
NICHE
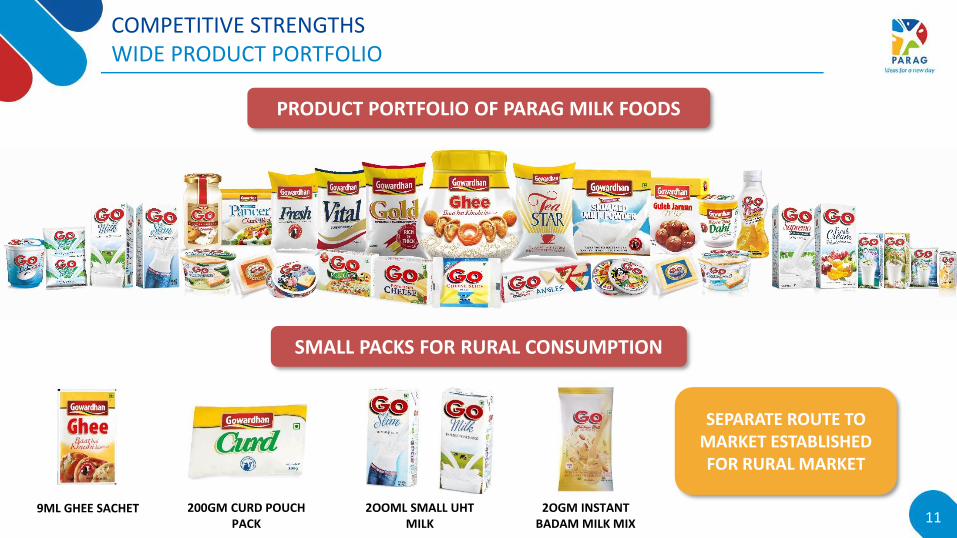
COMPETITIVE STRENGTHSWIDE PRODUCT PORTFOLIO
SMALL PACKS FOR RURAL CONSUMPTION
9ML GHEE SACHET
SEPARATE ROUTE TO MARKET ESTABLISHED FOR RURAL MARKET
200GM CURD POUCH PACK
2OOML SMALL UHT MILK
2OGM INSTANT BADAM MILK MIX 11
PRODUCT PORTFOLIO OF PARAG MILK FOODS
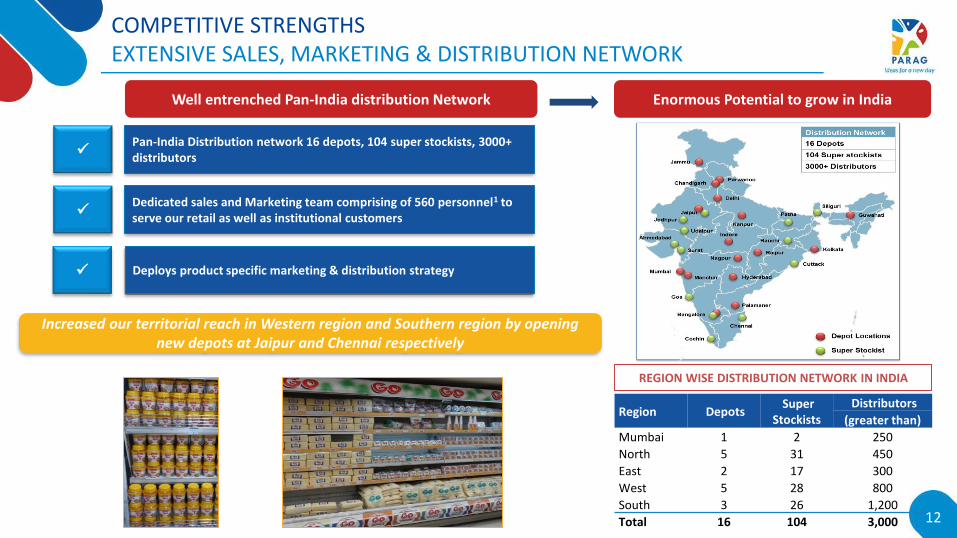
COMPETITIVE STRENGTHSEXTENSIVE SALES, MARKETING & DISTRIBUTION NETWORK
REGION WISE DISTRIBUTION NETWORK IN INDIA
Enormous Potential to grow in India
Region Depots Super
Stockists Distributors
(greater than)
Mumbai 1 2 250
North 5 31 450
East 2 17 300
West 5 28 800
South 3 26 1,200
Total 16 104 3,000
Well entrenched Pan-India distribution Network
Pan-India Distribution network 16 depots, 104 super stockists, 3000+ distributors
Dedicated sales and Marketing team comprising of 560 personnel1 to serve our retail as well as institutional customers
Deploys product specific marketing & distribution strategy
Increased our territorial reach in Western region and Southern region by opening new depots at Jaipur and Chennai respectively
12
Company Overview
Competitive Strengths
Strategic Initiatives & Outlook
Q3 & 9M FY17 Result highlights
Financial Outlook
1
2
3
4
5
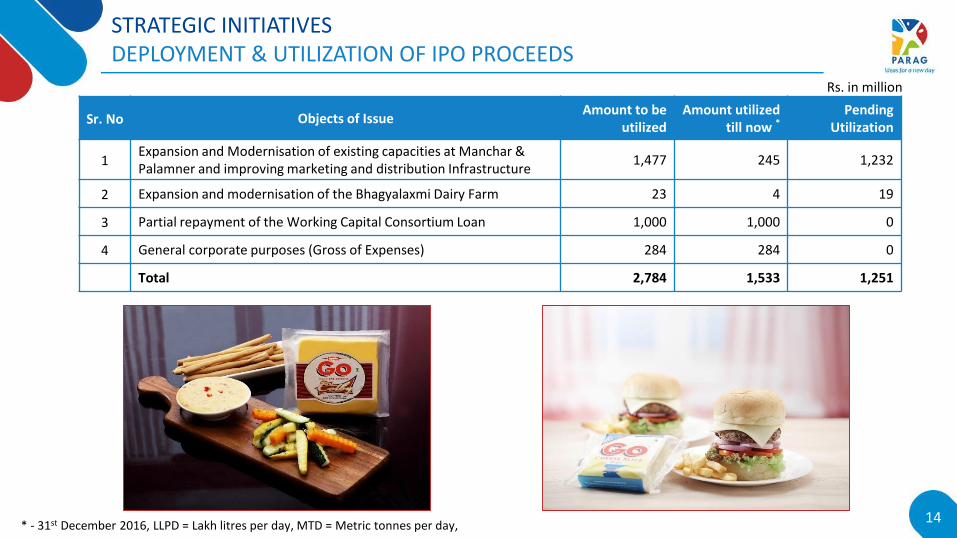
STRATEGIC INITIATIVESDEPLOYMENT & UTILIZATION OF IPO PROCEEDS
Sr. No Objects of IssueAmount to be
utilizedAmount utilized
till now *Pending
Utilization
1Expansion and Modernisation of existing capacities at Manchar & Palamner and improving marketing and distribution Infrastructure
1,477 245 1,232
2 Expansion and modernisation of the Bhagyalaxmi Dairy Farm 23 4 19
3 Partial repayment of the Working Capital Consortium Loan 1,000 1,000 0
4 General corporate purposes (Gross of Expenses) 284 284 0
Total 2,784 1,533 1,251
* - 31st December 2016, LLPD = Lakh litres per day, MTD = Metric tonnes per day, 14
Rs. in million
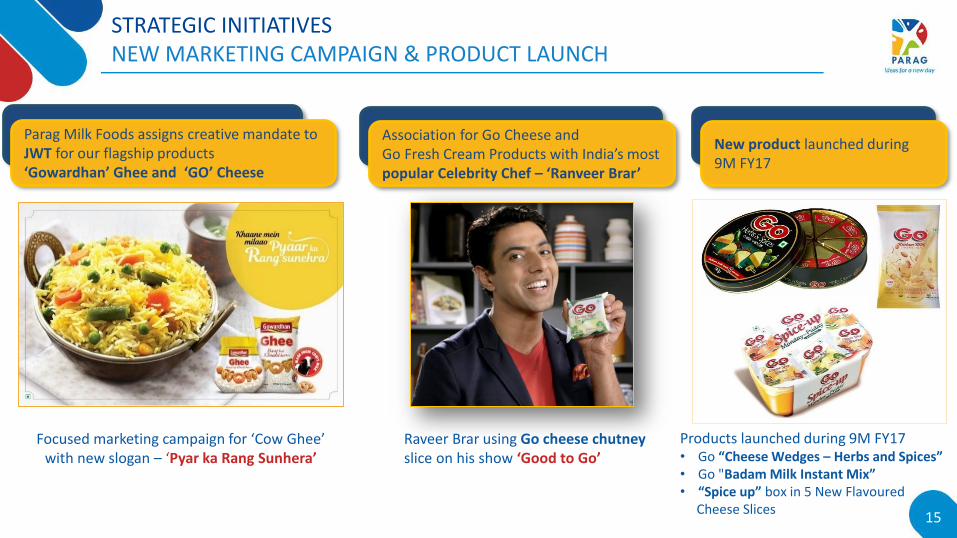
STRATEGIC INITIATIVESNEW MARKETING CAMPAIGN & PRODUCT LAUNCH
Parag Milk Foods assigns creative mandate toJWT for our flagship products ‘Gowardhan’ Ghee and ‘GO’ Cheese
15
Association for Go Cheese and Go Fresh Cream Products with India’s most popular Celebrity Chef – ‘Ranveer Brar’
New product launched during 9M FY17
Raveer Brar using Go cheese chutney slice on his show ‘Good to Go’
Focused marketing campaign for ‘Cow Ghee’ with new slogan – ‘Pyar ka Rang Sunhera’
Products launched during 9M FY17• Go “Cheese Wedges – Herbs and Spices”• Go "Badam Milk Instant Mix”• “Spice up” box in 5 New Flavoured
Cheese Slices
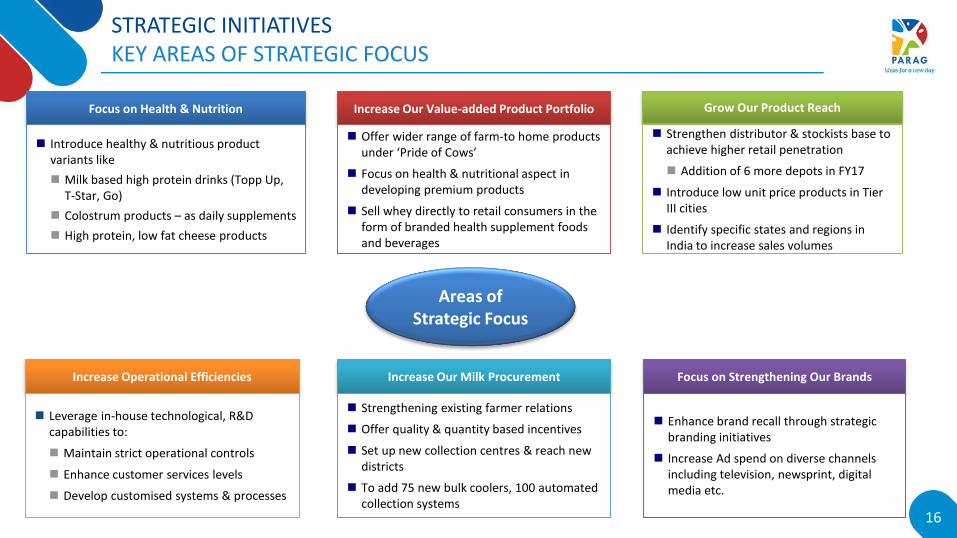
STRATEGIC INITIATIVESKEY AREAS OF STRATEGIC FOCUS
Increase Our Value-added Product PortfolioFocus on Health & Nutrition
Introduce healthy & nutritious product variants like
Milk based high protein drinks (Topp Up, T-Star, Go)
Colostrum products – as daily supplements
High protein, low fat cheese products
Offer wider range of farm-to home products under ‘Pride of Cows’
Focus on health & nutritional aspect in developing premium products
Sell whey directly to retail consumers in the form of branded health supplement foods and beverages
Focus on Strengthening Our Brands
Enhance brand recall through strategic branding initiatives
Increase Ad spend on diverse channels including television, newsprint, digital media etc.
Increase Our Milk Procurement
Strengthening existing farmer relations
Offer quality & quantity based incentives
Set up new collection centres & reach new districts
To add 75 new bulk coolers, 100 automated collection systems
Increase Operational Efficiencies
Grow Our Product Reach
Strengthen distributor & stockists base to achieve higher retail penetration
Addition of 6 more depots in FY17
Introduce low unit price products in Tier III cities
Identify specific states and regions in India to increase sales volumes
Leverage in-house technological, R&D capabilities to:
Maintain strict operational controls
Enhance customer services levels
Develop customised systems & processes
Areas of Strategic Focus
16
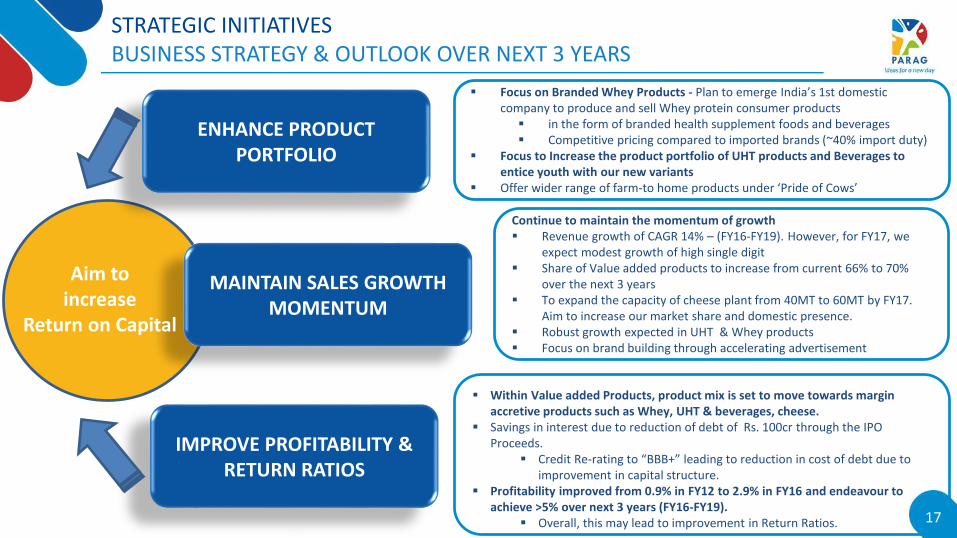
STRATEGIC INITIATIVESBUSINESS STRATEGY & OUTLOOK OVER NEXT 3 YEARS
ENHANCE PRODUCT PORTFOLIO
MAINTAIN SALES GROWTH MOMENTUM
IMPROVE PROFITABILITY & RETURN RATIOS
Aim to increase
Return on Capital
Focus on Branded Whey Products - Plan to emerge India’s 1st domestic company to produce and sell Whey protein consumer products in the form of branded health supplement foods and beverages Competitive pricing compared to imported brands (~40% import duty)
Focus to Increase the product portfolio of UHT products and Beverages to entice youth with our new variants
Offer wider range of farm-to home products under ‘Pride of Cows’
Within Value added Products, product mix is set to move towards margin accretive products such as Whey, UHT & beverages, cheese.
Savings in interest due to reduction of debt of Rs. 100cr through the IPO Proceeds.
Credit Re-rating to “BBB+” leading to reduction in cost of debt due to improvement in capital structure.
Profitability improved from 0.9% in FY12 to 2.9% in FY16 and endeavour to achieve >5% over next 3 years (FY16-FY19).
Overall, this may lead to improvement in Return Ratios.
Continue to maintain the momentum of growth Revenue growth of CAGR 14% – (FY16-FY19). However, for FY17, we
expect modest growth of high single digit Share of Value added products to increase from current 66% to 70%
over the next 3 years To expand the capacity of cheese plant from 40MT to 60MT by FY17.
Aim to increase our market share and domestic presence. Robust growth expected in UHT & Whey products Focus on brand building through accelerating advertisement
17
Company Overview
Competitive Strengths
Strategic Initiatives & Outlook
Q3 & 9M FY17 Result highlights
Financial Outlook
1
2
3
4
5
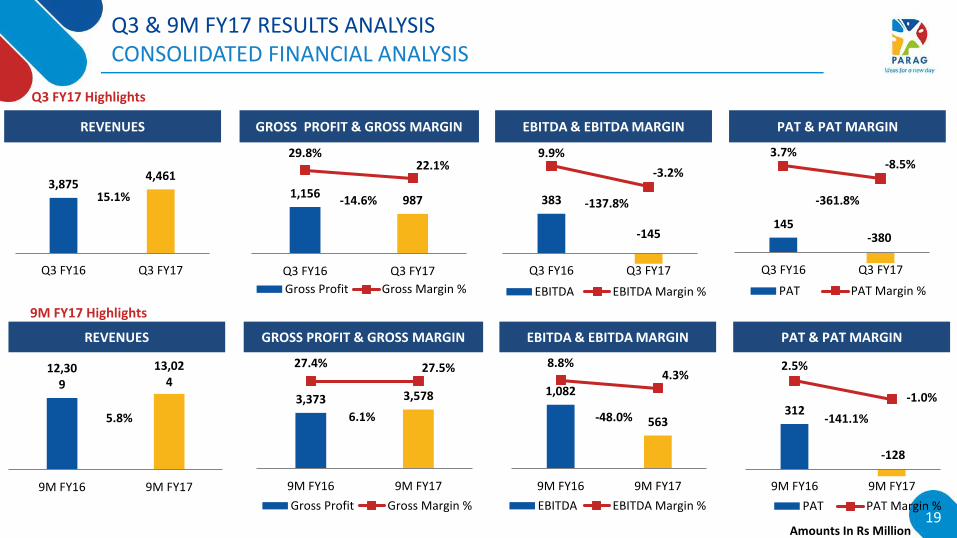
145 -380
3.7%-8.5%
Q3 FY16 Q3 FY17
PAT PAT Margin %
Q3 & 9M FY17 RESULTS ANALYSISCONSOLIDATED FINANCIAL ANALYSIS
EBITDA & EBITDA MARGIN PAT & PAT MARGIN
383
-145
9.9%
-3.2%
Q3 FY16 Q3 FY17
EBITDA EBITDA Margin %
-137.8%
REVENUES
3,875 4,461
Q3 FY16 Q3 FY17
15.1%
GROSS PROFIT & GROSS MARGIN
1,156 987
29.8%22.1%
Q3 FY16 Q3 FY17
Gross Profit Gross Margin %
-14.6%
Amounts In Rs Million19
EBITDA & EBITDA MARGIN PAT & PAT MARGIN
1,082
563
8.8%4.3%
9M FY16 9M FY17
EBITDA EBITDA Margin %
312
-128
2.5%
-1.0%
9M FY16 9M FY17
PAT PAT Margin %
-48.0% -141.1%
REVENUES
12,309
13,024
9M FY16 9M FY17
5.8%
GROSS PROFIT & GROSS MARGIN
3,373 3,578
27.4% 27.5%
9M FY16 9M FY17
Gross Profit Gross Margin %
6.1%
Q3 FY17 Highlights
9M FY17 Highlights
-361.8%
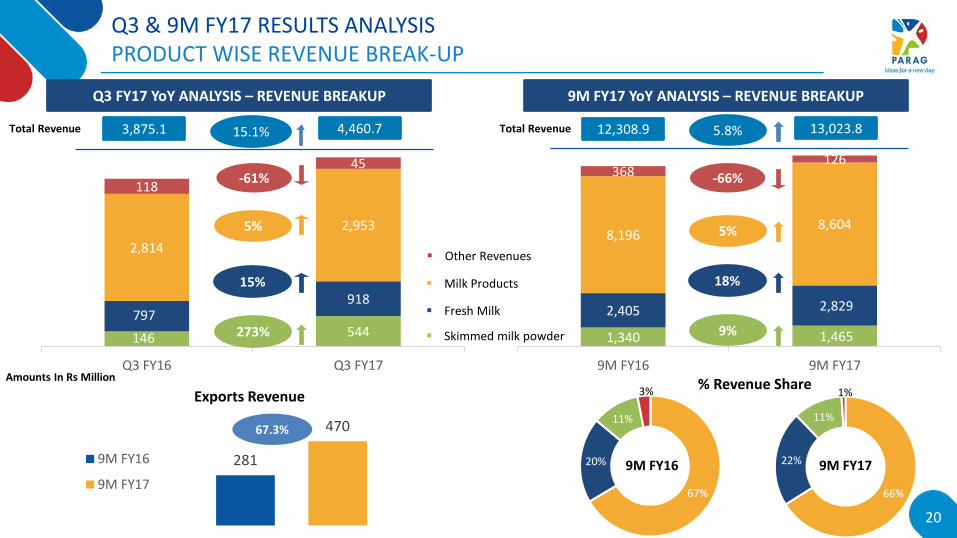
Q3 & 9M FY17 RESULTS ANALYSIS PRODUCT WISE REVENUE BREAK-UP
146 544797
918
2,814
2,953
118
45
Q3 FY16 Q3 FY17
3,875.1 4,460.7
273%
15%
5%
-61%
Q3 FY17 YoY ANALYSIS – REVENUE BREAKUP
15.1%
1,340 1,465
2,405 2,829
8,196 8,604
368126
9M FY16 9M FY17
12,308.9 13,023.8
9%
18%
5%
-66%
9M FY17 YoY ANALYSIS – REVENUE BREAKUP
5.8%
Fresh Milk
Other Revenues
Skimmed milk powder
Milk Products
67%
20%
11%
3%
66%
22%
11%
1%Exports Revenue% Revenue Share
9M FY16 9M FY17
Amounts In Rs Million
20
Total Revenue Total Revenue
281
470
9M FY16
9M FY17
67.3%
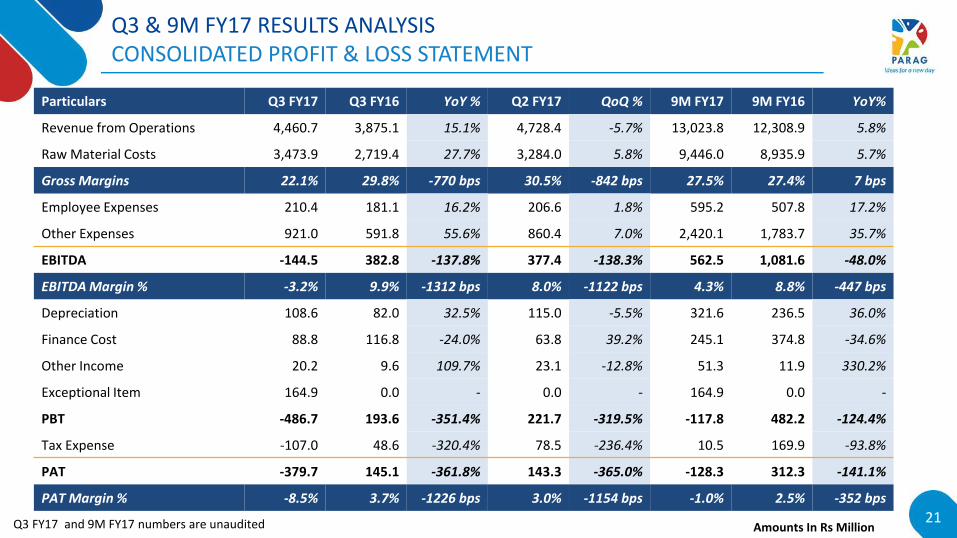
Q3 & 9M FY17 RESULTS ANALYSISCONSOLIDATED PROFIT & LOSS STATEMENT
Particulars Q3 FY17 Q3 FY16 YoY % Q2 FY17 QoQ % 9M FY17 9M FY16 YoY%
Revenue from Operations 4,460.7 3,875.1 15.1% 4,728.4 -5.7% 13,023.8 12,308.9 5.8%
Raw Material Costs 3,473.9 2,719.4 27.7% 3,284.0 5.8% 9,446.0 8,935.9 5.7%
Gross Margins 22.1% 29.8% -770 bps 30.5% -842 bps 27.5% 27.4% 7 bps
Employee Expenses 210.4 181.1 16.2% 206.6 1.8% 595.2 507.8 17.2%
Other Expenses 921.0 591.8 55.6% 860.4 7.0% 2,420.1 1,783.7 35.7%
EBITDA -144.5 382.8 -137.8% 377.4 -138.3% 562.5 1,081.6 -48.0%
EBITDA Margin % -3.2% 9.9% -1312 bps 8.0% -1122 bps 4.3% 8.8% -447 bps
Depreciation 108.6 82.0 32.5% 115.0 -5.5% 321.6 236.5 36.0%
Finance Cost 88.8 116.8 -24.0% 63.8 39.2% 245.1 374.8 -34.6%
Other Income 20.2 9.6 109.7% 23.1 -12.8% 51.3 11.9 330.2%
Exceptional Item 164.9 0.0 - 0.0 - 164.9 0.0 -
PBT -486.7 193.6 -351.4% 221.7 -319.5% -117.8 482.2 -124.4%
Tax Expense -107.0 48.6 -320.4% 78.5 -236.4% 10.5 169.9 -93.8%
PAT -379.7 145.1 -361.8% 143.3 -365.0% -128.3 312.3 -141.1%
PAT Margin % -8.5% 3.7% -1226 bps 3.0% -1154 bps -1.0% 2.5% -352 bps
Q3 FY17 and 9M FY17 numbers are unaudited Amounts In Rs Million21
Q3 & 9M FY17 RESULTS ANALYSISKEY HIGHLIGHTS & ANALYSIS
Revenues
EBITDA
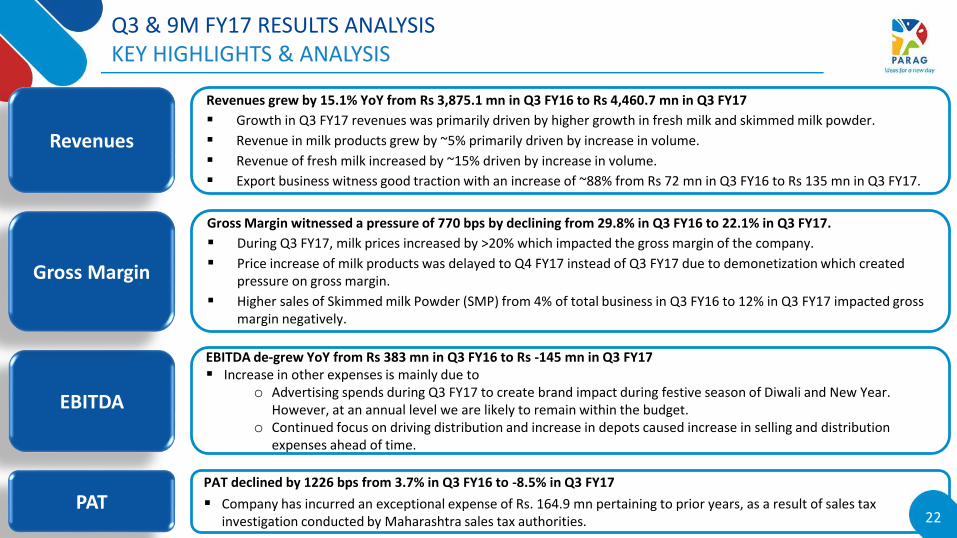
Revenues grew by 15.1% YoY from Rs 3,875.1 mn in Q3 FY16 to Rs 4,460.7 mn in Q3 FY17
Growth in Q3 FY17 revenues was primarily driven by higher growth in fresh milk and skimmed milk powder.
Revenue in milk products grew by ~5% primarily driven by increase in volume.
Revenue of fresh milk increased by ~15% driven by increase in volume.
Export business witness good traction with an increase of ~88% from Rs 72 mn in Q3 FY16 to Rs 135 mn in Q3 FY17.
EBITDA de-grew YoY from Rs 383 mn in Q3 FY16 to Rs -145 mn in Q3 FY17 Increase in other expenses is mainly due to
o Advertising spends during Q3 FY17 to create brand impact during festive season of Diwali and New Year. However, at an annual level we are likely to remain within the budget.
o Continued focus on driving distribution and increase in depots caused increase in selling and distribution expenses ahead of time.
PATPAT declined by 1226 bps from 3.7% in Q3 FY16 to -8.5% in Q3 FY17
Company has incurred an exceptional expense of Rs. 164.9 mn pertaining to prior years, as a result of sales tax investigation conducted by Maharashtra sales tax authorities.
Gross Margin
Gross Margin witnessed a pressure of 770 bps by declining from 29.8% in Q3 FY16 to 22.1% in Q3 FY17.
During Q3 FY17, milk prices increased by >20% which impacted the gross margin of the company.
Price increase of milk products was delayed to Q4 FY17 instead of Q3 FY17 due to demonetization which created pressure on gross margin.
Higher sales of Skimmed milk Powder (SMP) from 4% of total business in Q3 FY16 to 12% in Q3 FY17 impacted gross margin negatively.
22
Company Overview
Competitive Strengths
Strategic Initiatives & Outlook
Q3 & 9M FY17 Result highlights
Financial Outlook
1
2
3
4
5
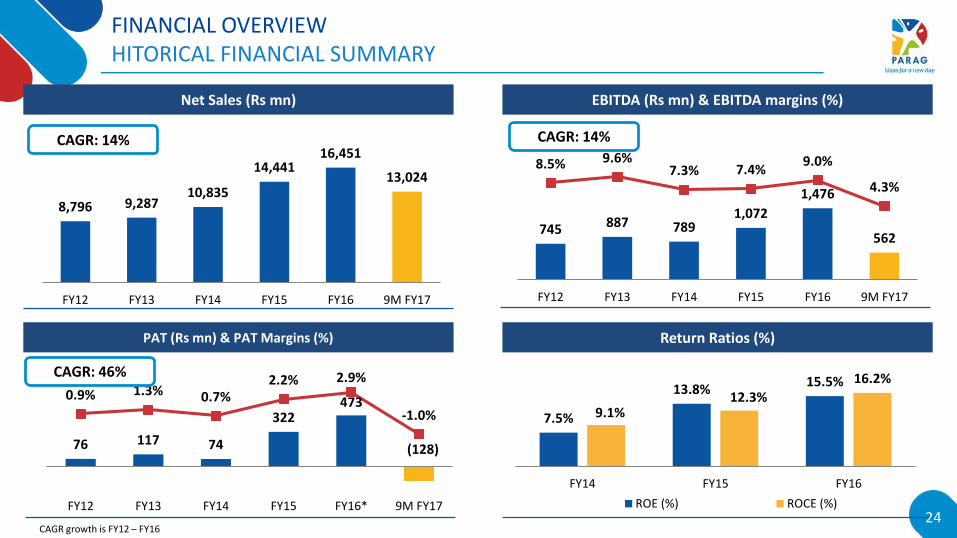
FINANCIAL OVERVIEWHITORICAL FINANCIAL SUMMARY
8,796 9,28710,835
14,44116,451
13,024
FY12 FY13 FY14 FY15 FY16 9M FY17
Net Sales (Rs mn) EBITDA (Rs mn) & EBITDA margins (%)
PAT (Rs mn) & PAT Margins (%)
745 887 7891,072
1,476
562
8.5% 9.6%7.3% 7.4%
9.0%
4.3%
FY12 FY13 FY14 FY15 FY16 9M FY17
76 117 74
322473
(128)
0.9% 1.3% 0.7%2.2% 2.9%
-1.0%
FY12 FY13 FY14 FY15 FY16* 9M FY17
CAGR: 14% CAGR: 14%
CAGR: 46%
Return Ratios (%)
7.5%
13.8%15.5%
9.1%12.3%
16.2%
FY14 FY15 FY16
ROE (%) ROCE (%)24
CAGR growth is FY12 – FY16
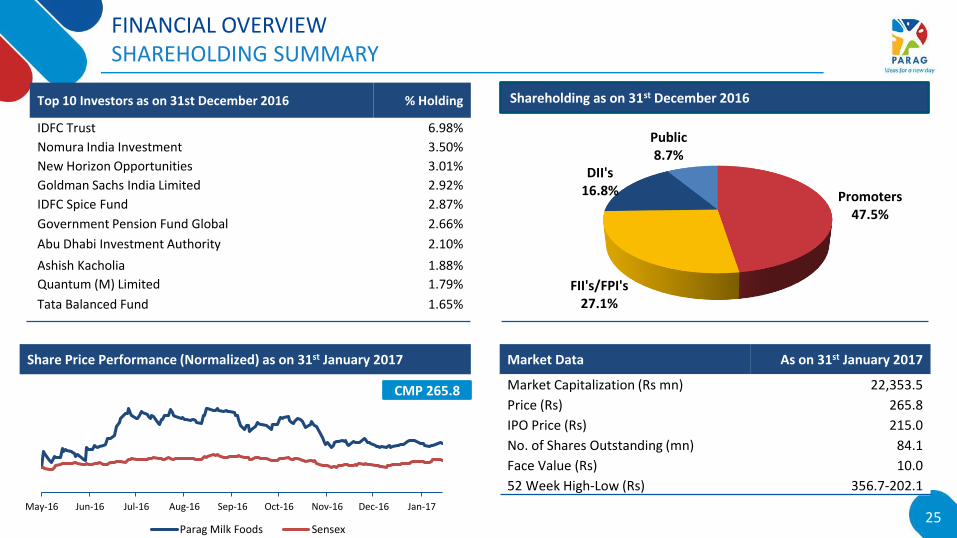
FINANCIAL OVERVIEWSHAREHOLDING SUMMARY
Promoters47.5%
FII's/FPI's27.1%
DII's16.8%
Public8.7%
Shareholding as on 31st December 2016
May-16 Jun-16 Jul-16 Aug-16 Sep-16 Oct-16 Nov-16 Dec-16 Jan-17
Parag Milk Foods Sensex
Market Data As on 31st January 2017
Market Capitalization (Rs mn) 22,353.5
Price (Rs) 265.8
IPO Price (Rs) 215.0
No. of Shares Outstanding (mn) 84.1
Face Value (Rs) 10.0
52 Week High-Low (Rs) 356.7-202.1
Share Price Performance (Normalized) as on 31st January 2017
CMP 265.8
25
Top 10 Investors as on 31st December 2016 % Holding
IDFC Trust 6.98%
Nomura India Investment 3.50%
New Horizon Opportunities 3.01%
Goldman Sachs India Limited 2.92%
IDFC Spice Fund 2.87%
Government Pension Fund Global 2.66%
Abu Dhabi Investment Authority 2.10%
Ashish Kacholia 1.88%
Quantum (M) Limited 1.79%
Tata Balanced Fund 1.65%
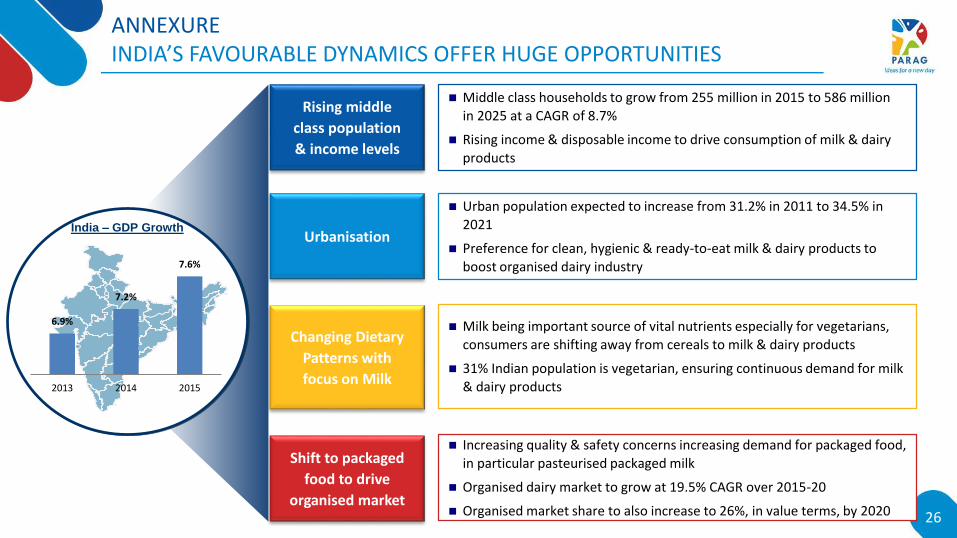
ANNEXUREINDIA’S FAVOURABLE DYNAMICS OFFER HUGE OPPORTUNITIES
Urban population expected to increase from 31.2% in 2011 to 34.5% in
2021
Preference for clean, hygienic & ready-to-eat milk & dairy products to
boost organised dairy industry
Milk being important source of vital nutrients especially for vegetarians,
consumers are shifting away from cereals to milk & dairy products
31% Indian population is vegetarian, ensuring continuous demand for milk
& dairy products
Increasing quality & safety concerns increasing demand for packaged food, in particular pasteurised packaged milk
Organised dairy market to grow at 19.5% CAGR over 2015-20
Organised market share to also increase to 26%, in value terms, by 2020
Rising middle
class population
& income levels
Urbanisation
Changing Dietary
Patterns with
focus on Milk
Shift to packaged
food to drive
organised market
Simon India Limited6.9%
7.2%
7.6%
2013 2014 2015
India – GDP Growth
Middle class households to grow from 255 million in 2015 to 586 million in 2025 at a CAGR of 8.7%
Rising income & disposable income to drive consumption of milk & dairy
products
26
FOR ANY FURTHER QUERIES CONTACT -
THANK YOU
THANK YOU
Mr. Yashesh ParekhInvestor Relations Email: [email protected] No: 022 66276575 / +91 8108321555
Mr. Bharat KediaChief Financial OfficerEmail: [email protected] Number: 022 4300 5555
27