Embed Size (px)
Citation preview
Feasibility of hydrogen fuel cell technology for railway intercityservices: a case study for the Piedmont in North Carolina
Orwell Madovi1 • Andreas Hoffrichter2 • Nick Little2 • Shanelle N. Foster1 •
Raphael Isaac2
Received: 14 February 2021 / Revised: 14 July 2021 / Accepted: 15 July 2021 / Published online: 31 July 2021
� The Author(s) 2021
Abstract Diesel fuel combustion results in exhaust con-
taining air pollutants and greenhouse gas emissions. Many
railway vehicles use diesel fuel as their energy source.
Exhaust emissions, as well as concerns about economical,
alternative power supply, have driven efforts to move to
hydrogen motive power. Hydrogen fuel cell technology
applied to railways offers the opportunity to eliminate
harmful exhaust emissions and the potential for a low- or
zero-emission energy supply chain. Currently, only multi-
ple-unit trains with hydrail technology operate commer-
cially. Development of an Integrated Hybrid Train
Simulator for intercity railway is presented. The proposed
tool incorporates the effect of powertrain components
during the wheel-to-tank process. Compared to its prede-
cessors, the proposed reconfigurable tool provides high
fidelity with medium requirements and minimum compu-
tation time. Single train simulation and the federal gov-
ernment’s Greenhouse gases, Regulated Emissions, and
Energy use in Transportation (GREET�) model are used in
combination to evaluate the feasibility of various train and
powertrain configurations. The Piedmont intercity service
operating in North Carolina is used as a case study. The
study includes six train configurations and powertrain
options as well as nine hydrogen supply options in addition
to the diesel supply. The results show that a hydrail option
is not only feasible, but a low- or zero-carbon hydrogen
supply chain could be possible.
Keywords Hydrail � Life cycle assessment � Criteriapollutants � Well-to-wheel � Single train simulation �Modeling
1 Introduction
In the USA, modal shift from road to rail reduces energy
consumption and emissions from the transportation sector
even if current diesel technology is employed [1]. How-
ever, utilization of hydrocarbons by humans and the sub-
sequent release of greenhouse gases (GHGs) has been
linked to climate change [2]. Efforts to introduce low- or
zero-emission motive power options will increase the rail
advantage and are necessary for the mode to remain
environmentally competitive given the emergence of lower
emission options in the road sector.
In this work, two existing simulation approaches are
combined to develop an integrated simulation tool for
evaluation of zero-emission options. The proposed recon-
figurable tool provides high fidelity with minimum com-
putation time while addressing challenges of current
simulators. The proposed tool is applied to the Piedmont
corridor route in the USA to assess feasibility of hydrail.
Currently, most railway vehicles use electricity for
propulsion either supplied through wayside electrification
infrastructure or through on-board diesel-generator sets [3].
On-board power generation is typically achieved with a
diesel engine connected to an electricity generator. The
resulting electricity is subsequently used to operate traction
motors. This powertrain is diesel-electric, though often
& Orwell Madovi
1 Department of Electrical and Computer Engineering,
Michigan State University, 428 South Shaw Lane, Room
2120, East Lansing, MI 48824, USA
2 Center for Railway Research & Education, Broad College of
Business, Michigan State University, 3535 Forest Road,
Room C-36, Lansing, MI 48910, USA
123
Rail. Eng. Science (2021) 29(3):258–270
https://doi.org/10.1007/s40534-021-00249-8
simply referred to as diesel. A diesel-electric powertrain
with a three-phase generator and three-phase traction
motors represents a typical modern arrangement for pas-
senger and freight motive power vehicles in North Amer-
ica. Rail energy consumption from diesel-electric motive
power dominates in the USA, while the remainder is pro-
vided by electricity from wayside infrastructure [4].
Wayside electrification eliminates emissions at the
point-of-use but requires extensive infrastructure that is
associated with substantial capital expenditure. Addition-
ally, the overall environmental performance is dependent
on the source utilized for electricity generation. Lower
emissions, compared to diesel, can be achieved with
renewable sources. However, an increase is also possible if
coal is the primary electricity generation source.
Efforts to reduce energy consumption and emissions
must also consider braking phases. During braking phases,
energy must be dissipated. All trains have a mechanical
braking system, where brake pads or shoes are applied to
the wheel or a brake disk is controlled through pneumatic
connections along the train with air provided by the loco-
motive. An alternative method is the utilization of the
traction motors as generators, where the resulting elec-
tricity is converted to heat in resistor grids. Known as
dynamic braking, this method is extensively employed in
the USA. With the appropriate technology, most of the
generated electricity from dynamic braking can be stored
on-board the train, an option known as regenerative brak-
ing. On-board energy storage systems (ESS) enable the
capture of energy resulting from dynamic braking, partic-
ularly on downhill segments and in deceleration phases
[5, 6]. For example, when approaching station stops, such
energy can be stored and then deployed in the next accel-
eration phase, decreasing the primary fuel requirement.
The need to satisfy increasingly tighter standards for
criteria air pollutants set by the U.S. Environmental Pro-
tection Agency and efforts by individual states, such as
California, to require full zero-emission applications in the
next two decades, has led to investigation of technologies
beyond the conventional combustion reciprocating engine
[7]. A combination of options, including after-treatment
systems, increased use of biofuel, and plug-in hybrid
powertrains, are likely to result in significant emission
reduction but will not lead to a zero-emission option.
Hydrogen utilization in fuel cells, on the other hand, results
in no harmful emissions and can be completely carbon free
if renewable hydrogen production is used. However, the
feasibility of converting railway motive power to this zero-
emission option must be thoroughly evaluated.
Simulation tools are required to evaluate the feasibility
of hydrogen technology applied to railway vehicles (hyd-
rail) for various railway services, including intercity
service. Currently, the primary tool utilized to evaluate
train performance is single train simulation, such as Rail
Traffic Controller, RailSys, or the Single Train Simulator
(STS), developed by the University of Birmingham [8–10].
However, these tools do not adequately represent the
powertrain, especially if new powertrains such as hybrids
or hydrogen fuel cells have to be modeled. Evaluation of
changes in energy due to system changes is not feasible
with the STS tool.
The WARwick Powertrain Simulation Tool for ARchi-
tectures (WARPSTAR) [11, 12], developed by the
University of Warwick, is a modeling software that focuses
on the evaluation of powertrains, including novel options
such as hybrids and hydrogen fuel cell systems for light
duty vehicles. On the other hand, the WARPSTAR tool
incorporates details of system components to improve
model fidelity; however, it cannot evaluate the power
demand for routes nor the power demand at the wheel level
for railway vehicles.
In this work, an Integrated Hybrid Train Simulator
(IHyTS) is adopted in order to facilitate accurate analysis
of more complex railway vehicle architectures and
assessment of their impacts on emissions and energy con-
sumption. Additionally, the well-established Greenhouse
gases, Regulated Emissions, and Energy use in Trans-
portation (GREET�) model are used for the well-to-pump
part of the analysis while emission data from the GREET
model is incorporated into the outputs of the developed
train simulator for the pump-to-wheel part. (See Sect. 3.2
for further discussion of fuel life cycle terminology) [13].
The feasibility analysis method presented includes route
and train information, as well as efficiency maps for all
major powertrain components.
Although the proposed IHyTS can be used to evaluate
feasibility of many powertrain configurations, here hydro-
gen fuel cell is evaluated. The equipment used to provide
the intercity Piedmont service in North Carolina is owned
by the North Carolina Department of Transportation
(NCDOT) and used as a case study to evaluate the efficacy
of the method. This case study explores six configurations,
including hydrogen fuel cell, diesel hybrids, and their
respective plug-in options in order to evaluate feasibility
given space requirements, capital cost reduction opportu-
nities, and changes, particularly reductions in energy con-
sumption and total emissions outputs.
2 Hydrogen considerations
Considering volumetric and gravimetric energy density of
various fuels and storage devices depicted in Fig. 1, liquid
hydrocarbon fuels have the highest energy density,
Feasibility of hydrogen fuel cell technology for railway intercity services: a case study for… 259
123Rail. Eng. Science (2021) 29(3):258–270
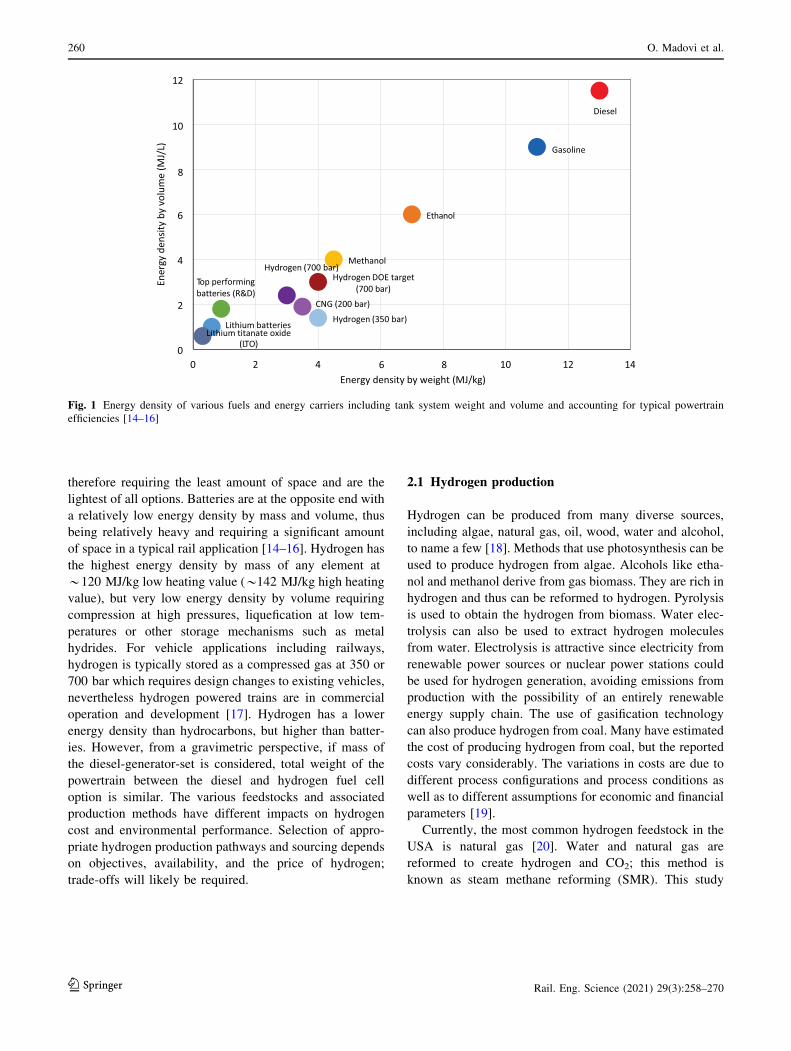
therefore requiring the least amount of space and are the
lightest of all options. Batteries are at the opposite end with
a relatively low energy density by mass and volume, thus
being relatively heavy and requiring a significant amount
of space in a typical rail application [14–16]. Hydrogen has
the highest energy density by mass of any element at
*120 MJ/kg low heating value (*142 MJ/kg high heating
value), but very low energy density by volume requiring
compression at high pressures, liquefication at low tem-
peratures or other storage mechanisms such as metal
hydrides. For vehicle applications including railways,
hydrogen is typically stored as a compressed gas at 350 or
700 bar which requires design changes to existing vehicles,
nevertheless hydrogen powered trains are in commercial
operation and development [17]. Hydrogen has a lower
energy density than hydrocarbons, but higher than batter-
ies. However, from a gravimetric perspective, if mass of
the diesel-generator-set is considered, total weight of the
powertrain between the diesel and hydrogen fuel cell
option is similar. The various feedstocks and associated
production methods have different impacts on hydrogen
cost and environmental performance. Selection of appro-
priate hydrogen production pathways and sourcing depends
on objectives, availability, and the price of hydrogen;
trade-offs will likely be required.
2.1 Hydrogen production
Hydrogen can be produced from many diverse sources,
including algae, natural gas, oil, wood, water and alcohol,
to name a few [18]. Methods that use photosynthesis can be
used to produce hydrogen from algae. Alcohols like etha-
nol and methanol derive from gas biomass. They are rich in
hydrogen and thus can be reformed to hydrogen. Pyrolysis
is used to obtain the hydrogen from biomass. Water elec-
trolysis can also be used to extract hydrogen molecules
from water. Electrolysis is attractive since electricity from
renewable power sources or nuclear power stations could
be used for hydrogen generation, avoiding emissions from
production with the possibility of an entirely renewable
energy supply chain. The use of gasification technology
can also produce hydrogen from coal. Many have estimated
the cost of producing hydrogen from coal, but the reported
costs vary considerably. The variations in costs are due to
different process configurations and process conditions as
well as to different assumptions for economic and financial
parameters [19].
Currently, the most common hydrogen feedstock in the
USA is natural gas [20]. Water and natural gas are
reformed to create hydrogen and CO2; this method is
known as steam methane reforming (SMR). This study
Fig. 1 Energy density of various fuels and energy carriers including tank system weight and volume and accounting for typical powertrain
efficiencies [14–16]
260 O. Madovi et al.
123 Rail. Eng. Science (2021) 29(3):258–270
considers three methods for hydrogen production: (1)
SMR, (2) electrolysis, and (3) biomass. For electrolysis,
this work considers both power provided by the grid with a
mix representative of the Southeastern USA as well as
power provided solely based on renewable sources.
Hydrogen production from biomass may be an attractive
possibility as renewable sources would be utilized, which
may have a positive impact on emissions using methods
explored in [21].
Most hydrogen is transported, either for the entire dis-
tance or in part, through pipelines. For cases with low
quantity requirements, transportation by truck is used [22].
Hydrogen is typically transported in (1) gaseous form or
(2) liquid state. A super-insulated truck can transport up to
4,000 kg of hydrogen as a liquid [23], more than six times
the quantity of a compressed gas trailer, allowing fewer
deliveries and enabling more economical transportation
over longer distances. Presently, France and Germany
transport hydrogen by truck as far as 962 km [24].
Two possible production locations for hydrogen are
considered in this study: (1) an onsite unit constructed at
the refueling site and (2) a central location for delivery to
refueling sites. Delivery in both gaseous and liquid forms is
considered. The delivery distances were 110 miles for
hydrogen produced from renewable sources and 800 miles
for liquid or gaseous delivery from SMR [25]. The onsite
options considered in this study include SMR, which
requires a gas supply and electrolysis, which requires a
high-power electrical supply.
2.2 Hydrogen storage
Onsite hydrogen storage usually employs compressed gas
storage or storage as a liquid, with the method chosen
primarily dependent on the quantities required, space
requirements, cost and delivery frequency [26]. Adequate
ventilation and leak detection are essential in a safe
hydrogen system design. Pressure sensors and leak detec-
tors, along with related warning systems, are necessary
since hydrogen is an odorless and colorless gas. Flame
detectors are also required as hydrogen burns nearly
invisibly. These instruments required to handle hydrogen
safely are well-developed technologies for stationary
applications. Development of potential safety implemen-
tation for mobile hydrogen systems are underway [27].
Appropriate material selection for hydrogen pipes and
storage tanks is also necessary because some material,
including certain metals, can become brittle when exposed
to hydrogen for long periods of time. Commercially
available compressed gas tanks, 350 bar of pressure, have
been used in other railway applications [28]. This study
assumes that approximately 24 kg (*800 kWh) of
hydrogen could be stored in one cubic meter at a weight of
320 kg, based on a commercially available tank [29].
3 Simulator and methodology
The STS and WARPSTAR tools individually present
challenges for quick evaluation of the benefits of various
powertrains [6]. The STS tool facilitates infrastructural
modeling and the physical characteristic modeling; how-
ever, it does not allow architectural and energy studies.
WARPSTAR lacks functionality for estimating the power
demand for a particular route. These issues are resolved
through use of an Integrated Hybrid Train Simulator
(IHyTS). This can be used by train system designers and
rail operators for quick evaluation of powertrain configu-
rations. The IHyTS outputs fuel consumption. The
GREET� model was used to estimate energy consumption
as well as emissions of vehicle and fuel combinations
considering the entire energy supply chain.
3.1 Integrated hybrid train simulator
IHyTS is based on two existing and well-regarded simula-
tion tools developed by the University of Birmingham and
the University of Warwick [6–10]. However, it has charac-
teristics that fulfill gaps presented by the STS while retain-
ing the simplicity of the parameter definition. This makes it
easy to study the impacts, in terms of energy consumption,
of changes to any of the main components of the powertrain.
STS and WARPSTAR were developed using the same
software environment, which simplifies the integration pro-
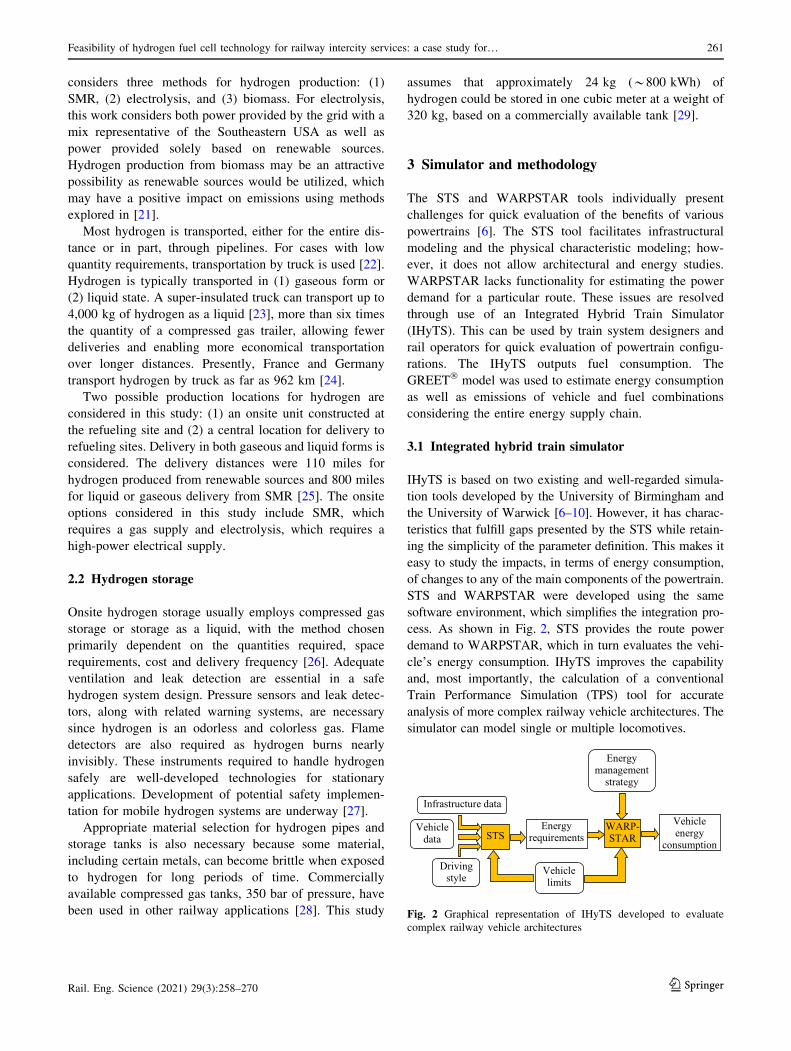
cess. As shown in Fig. 2, STS provides the route power
demand to WARPSTAR, which in turn evaluates the vehi-
cle’s energy consumption. IHyTS improves the capability
and, most importantly, the calculation of a conventional
Train Performance Simulation (TPS) tool for accurate
analysis of more complex railway vehicle architectures. The
simulator can model single or multiple locomotives.
Fig. 2 Graphical representation of IHyTS developed to evaluate
complex railway vehicle architectures
Feasibility of hydrogen fuel cell technology for railway intercity services: a case study for… 261
123Rail. Eng. Science (2021) 29(3):258–270
3.2 GREET� model
Typically, fuel life cycle analysis (LCA) is split into two
parts: (a) pump-to-wheel (PTW) also called tank-to-wheel
and (b) well-to-pump (WTP) or well-to-tank. The combi-
nation of PTW and WTP analyses is referred to as well-to-
wheel (WTW) analysis. PTW analysis considers features of
the powertrain technology and duty cycles and WTP
analysis incorporates information about the fuel production
and delivery. In this study, IHyTS performs the PTW
component of the fuel LCA.
The GREET model [30, 31], developed by Argonne
National Laboratories for automobiles, was adopted in this
work to estimate the supply chain, energy, and emissions
impacts. The model was adapted to account for railway
vehicles in the WTP component of the fuel LCA. These
modifications include considerations for the resource (or
fuel) production and transportation to the point of use in the
WTP energy consumption and emissions estimate.
4 The Piedmont in North Carolina
The Piedmont service corridor is a 173-mile (*278 km)
route, of which approximately half is single track and the
remainder at least double track, with two terminal stations,
Raleigh and Charlotte, and seven intermediate passenger
rail stations. A one-way trip (presented in Table 1), which
includes nine total stops and the dwell time at each, takes
the diesel-electric locomotive 190 min [32].
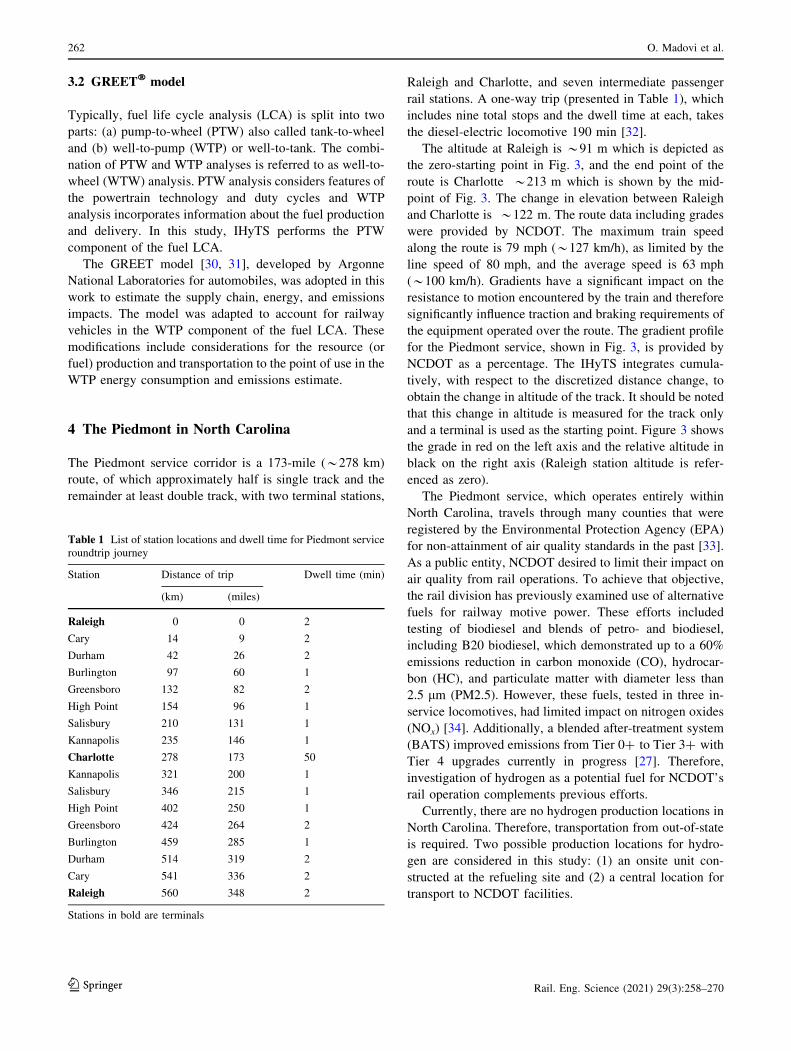
The altitude at Raleigh is *91 m which is depicted as
the zero-starting point in Fig. 3, and the end point of the
route is Charlotte *213 m which is shown by the mid-
point of Fig. 3. The change in elevation between Raleigh
and Charlotte is *122 m. The route data including grades
were provided by NCDOT. The maximum train speed
along the route is 79 mph (*127 km/h), as limited by the
line speed of 80 mph, and the average speed is 63 mph
(*100 km/h). Gradients have a significant impact on the
resistance to motion encountered by the train and therefore
significantly influence traction and braking requirements of
the equipment operated over the route. The gradient profile
for the Piedmont service, shown in Fig. 3, is provided by
NCDOT as a percentage. The IHyTS integrates cumula-
tively, with respect to the discretized distance change, to
obtain the change in altitude of the track. It should be noted
that this change in altitude is measured for the track only
and a terminal is used as the starting point. Figure 3 shows
the grade in red on the left axis and the relative altitude in
black on the right axis (Raleigh station altitude is refer-
enced as zero).
The Piedmont service, which operates entirely within
North Carolina, travels through many counties that were
registered by the Environmental Protection Agency (EPA)
for non-attainment of air quality standards in the past [33].
As a public entity, NCDOT desired to limit their impact on
air quality from rail operations. To achieve that objective,
the rail division has previously examined use of alternative
fuels for railway motive power. These efforts included
testing of biodiesel and blends of petro- and biodiesel,
including B20 biodiesel, which demonstrated up to a 60%
emissions reduction in carbon monoxide (CO), hydrocar-
bon (HC), and particulate matter with diameter less than
2.5 lm (PM2.5). However, these fuels, tested in three in-
service locomotives, had limited impact on nitrogen oxides
(NOx) [34]. Additionally, a blended after-treatment system
(BATS) improved emissions from Tier 0? to Tier 3? with
Tier 4 upgrades currently in progress [27]. Therefore,
investigation of hydrogen as a potential fuel for NCDOT’s
rail operation complements previous efforts.
Currently, there are no hydrogen production locations in
North Carolina. Therefore, transportation from out-of-state
is required. Two possible production locations for hydro-
gen are considered in this study: (1) an onsite unit con-
structed at the refueling site and (2) a central location for
transport to NCDOT facilities.
Table 1 List of station locations and dwell time for Piedmont service
roundtrip journey
Station Distance of trip Dwell time (min)
(km) (miles)
Raleigh 0 0 2
Cary 14 9 2
Durham 42 26 2
Burlington 97 60 1
Greensboro 132 82 2
High Point 154 96 1
Salisbury 210 131 1
Kannapolis 235 146 1
Charlotte 278 173 50
Kannapolis 321 200 1
Salisbury 346 215 1
High Point 402 250 1
Greensboro 424 264 2
Burlington 459 285 1
Durham 514 319 2
Cary 541 336 2
Raleigh 560 348 2
Stations in bold are terminals
262 O. Madovi et al.
123 Rail. Eng. Science (2021) 29(3):258–270
5 IHyTS validation
Journey time, speed profiles, and fuel consumption were
provided by NCDOT. Accuracy of the IHyTS was evalu-
ated using recorded data from a diesel-electric locomotive
on the Piedmont service. The seven stops along the one-
way journey are included in the simulator as well as the
dwell time at each stop. The speed, journey time, and total
diesel fuel consumption for a single trip were used for
validation.
As shown in Table 2, fuel consumption resulting from
the simulation is *640 gal (*2,422.4 L), which is close
to the recorded value provided by the NCDOT, *650 gal
(*2,460.25 L). The fuel consumption mirrors the power
demand for the required journey, and the diesel benchmark
falls within the expected average fuel consumption.
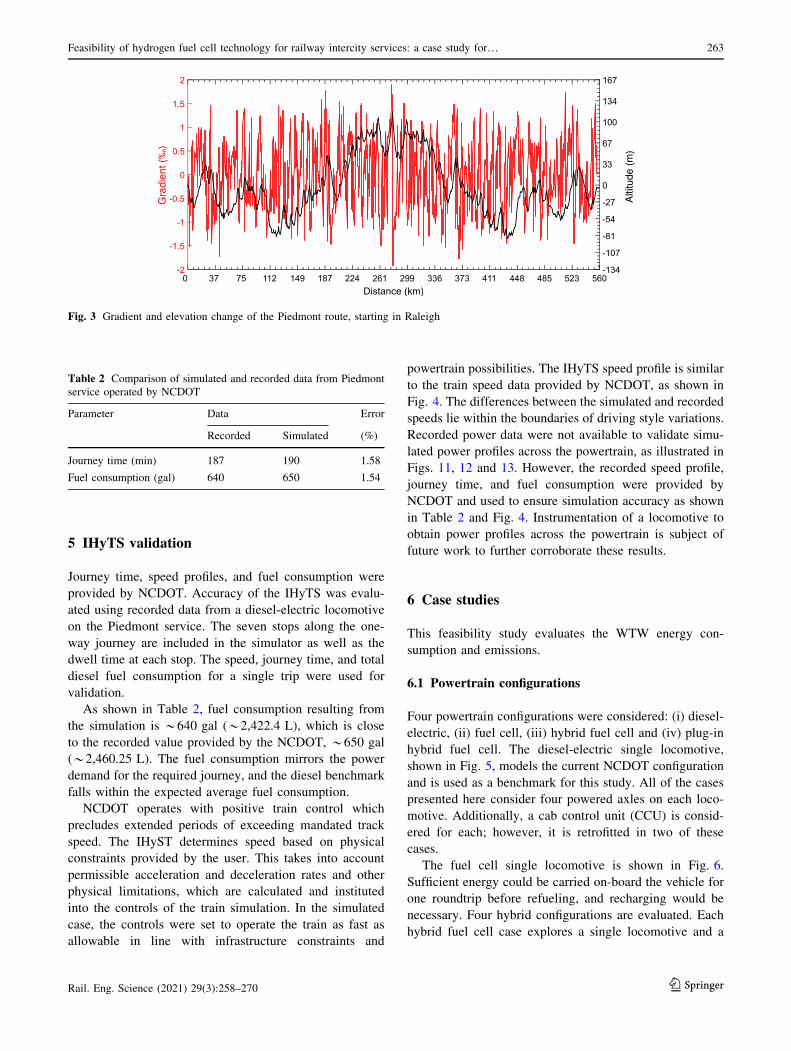
NCDOT operates with positive train control which
precludes extended periods of exceeding mandated track
speed. The IHyST determines speed based on physical
constraints provided by the user. This takes into account
permissible acceleration and deceleration rates and other
physical limitations, which are calculated and instituted
into the controls of the train simulation. In the simulated
case, the controls were set to operate the train as fast as
allowable in line with infrastructure constraints and
powertrain possibilities. The IHyTS speed profile is similar
to the train speed data provided by NCDOT, as shown in
Fig. 4. The differences between the simulated and recorded
speeds lie within the boundaries of driving style variations.
Recorded power data were not available to validate simu-
lated power profiles across the powertrain, as illustrated in
Figs. 11, 12 and 13. However, the recorded speed profile,
journey time, and fuel consumption were provided by
NCDOT and used to ensure simulation accuracy as shown
in Table 2 and Fig. 4. Instrumentation of a locomotive to
obtain power profiles across the powertrain is subject of
future work to further corroborate these results.
6 Case studies
This feasibility study evaluates the WTW energy con-
sumption and emissions.
6.1 Powertrain configurations
Four powertrain configurations were considered: (i) diesel-
electric, (ii) fuel cell, (iii) hybrid fuel cell and (iv) plug-in
hybrid fuel cell. The diesel-electric single locomotive,
shown in Fig. 5, models the current NCDOT configuration
and is used as a benchmark for this study. All of the cases
presented here consider four powered axles on each loco-
motive. Additionally, a cab control unit (CCU) is consid-
ered for each; however, it is retrofitted in two of these
cases.
The fuel cell single locomotive is shown in Fig. 6.
Sufficient energy could be carried on-board the vehicle for
one roundtrip before refueling, and recharging would be
necessary. Four hybrid configurations are evaluated. Each
hybrid fuel cell case explores a single locomotive and a
Gra
dien
t (‰
)
Alti
tude
(m
)
Fig. 3 Gradient and elevation change of the Piedmont route, starting in Raleigh
Table 2 Comparison of simulated and recorded data from Piedmont
service operated by NCDOT
Parameter Data Error
Recorded Simulated (%)
Journey time (min) 187 190 1.58
Fuel consumption (gal) 640 650 1.54
Feasibility of hydrogen fuel cell technology for railway intercity services: a case study for… 263
123Rail. Eng. Science (2021) 29(3):258–270
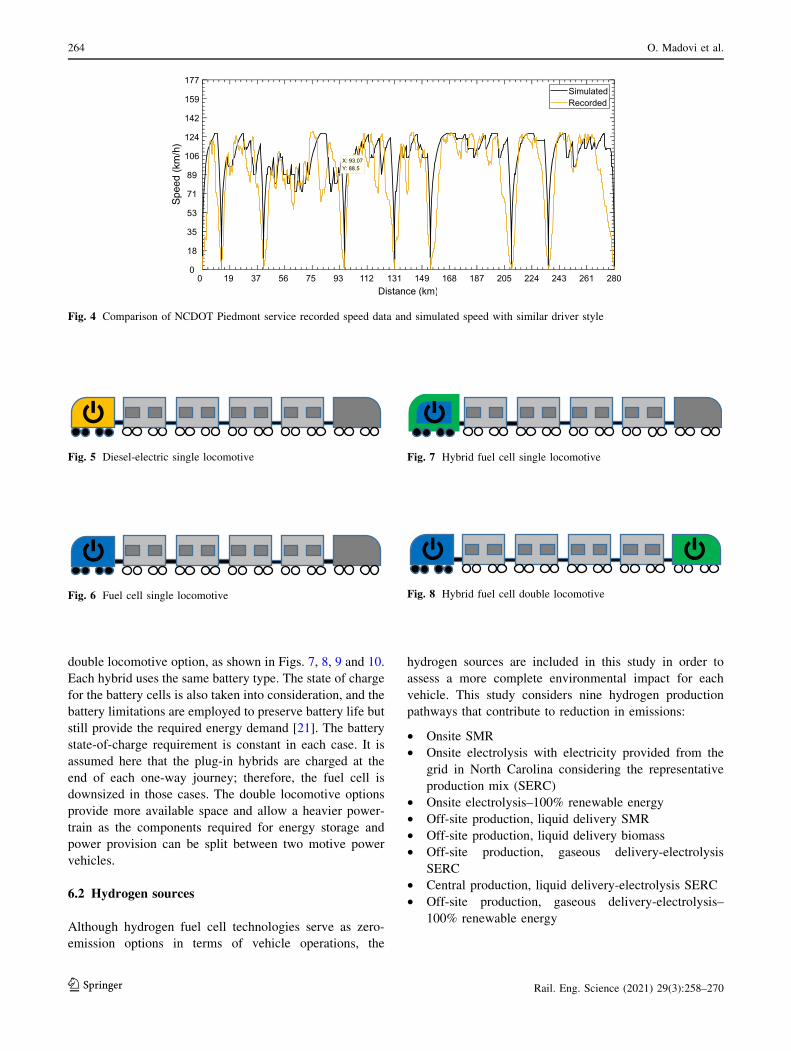
double locomotive option, as shown in Figs. 7, 8, 9 and 10.
Each hybrid uses the same battery type. The state of charge
for the battery cells is also taken into consideration, and the
battery limitations are employed to preserve battery life but
still provide the required energy demand [21]. The battery
state-of-charge requirement is constant in each case. It is
assumed here that the plug-in hybrids are charged at the
end of each one-way journey; therefore, the fuel cell is
downsized in those cases. The double locomotive options
provide more available space and allow a heavier power-
train as the components required for energy storage and
power provision can be split between two motive power
vehicles.
6.2 Hydrogen sources
Although hydrogen fuel cell technologies serve as zero-
emission options in terms of vehicle operations, the
hydrogen sources are included in this study in order to
assess a more complete environmental impact for each
vehicle. This study considers nine hydrogen production
pathways that contribute to reduction in emissions:
• Onsite SMR
• Onsite electrolysis with electricity provided from the
grid in North Carolina considering the representative
production mix (SERC)
• Onsite electrolysis–100% renewable energy
• Off-site production, liquid delivery SMR
• Off-site production, liquid delivery biomass
• Off-site production, gaseous delivery-electrolysis
SERC
• Central production, liquid delivery-electrolysis SERC
• Off-site production, gaseous delivery-electrolysis–
100% renewable energy
Spe
ed (
km/h
)
Fig. 4 Comparison of NCDOT Piedmont service recorded speed data and simulated speed with similar driver style
Fig. 5 Diesel-electric single locomotive
Fig. 6 Fuel cell single locomotive
Fig. 7 Hybrid fuel cell single locomotive
Fig. 8 Hybrid fuel cell double locomotive
264 O. Madovi et al.
123 Rail. Eng. Science (2021) 29(3):258–270
• Off-site production, liquid delivery-electrolysis–100%
renewable energy with delivery distance considerations
7 Results and analysis
Feasibility of each configuration was assessed based on
ability of the powertrain to provide the required power as
well as space and weight constraints of the CCU resulting
from the corridor infrastructure. The IHyTS evaluated a
roundtrip journey between Raleigh to Charlotte for the fuel
cell, hybrid fuel cell, and plug-in hybrid fuel cell config-
urations. The traction profile is identical for all three con-
figurations, as it is based on the power demand.
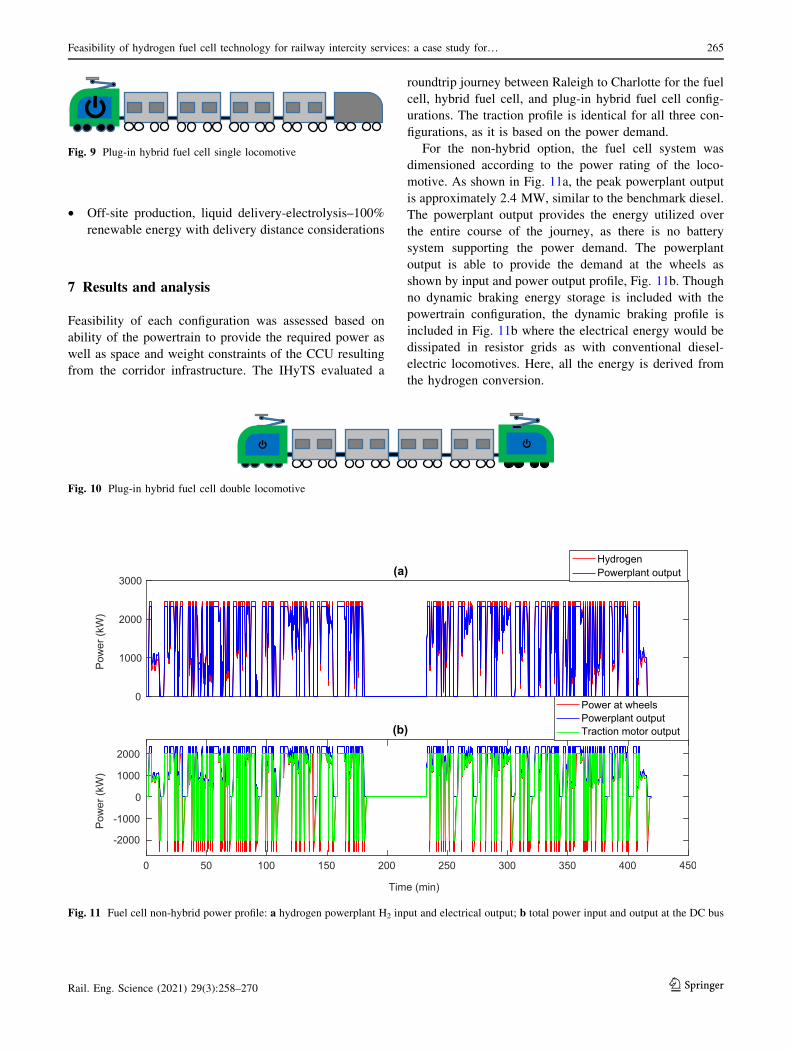
For the non-hybrid option, the fuel cell system was
dimensioned according to the power rating of the loco-
motive. As shown in Fig. 11a, the peak powerplant output
is approximately 2.4 MW, similar to the benchmark diesel.
The powerplant output provides the energy utilized over
the entire course of the journey, as there is no battery
system supporting the power demand. The powerplant
output is able to provide the demand at the wheels as
shown by input and power output profile, Fig. 11b. Though
no dynamic braking energy storage is included with the
powertrain configuration, the dynamic braking profile is
included in Fig. 11b where the electrical energy would be
dissipated in resistor grids as with conventional diesel-
electric locomotives. Here, all the energy is derived from
the hydrogen conversion.
Fig. 9 Plug-in hybrid fuel cell single locomotive
Fig. 10 Plug-in hybrid fuel cell double locomotive
Fig. 11 Fuel cell non-hybrid power profile: a hydrogen powerplant H2 input and electrical output; b total power input and output at the DC bus
Feasibility of hydrogen fuel cell technology for railway intercity services: a case study for… 265
123Rail. Eng. Science (2021) 29(3):258–270
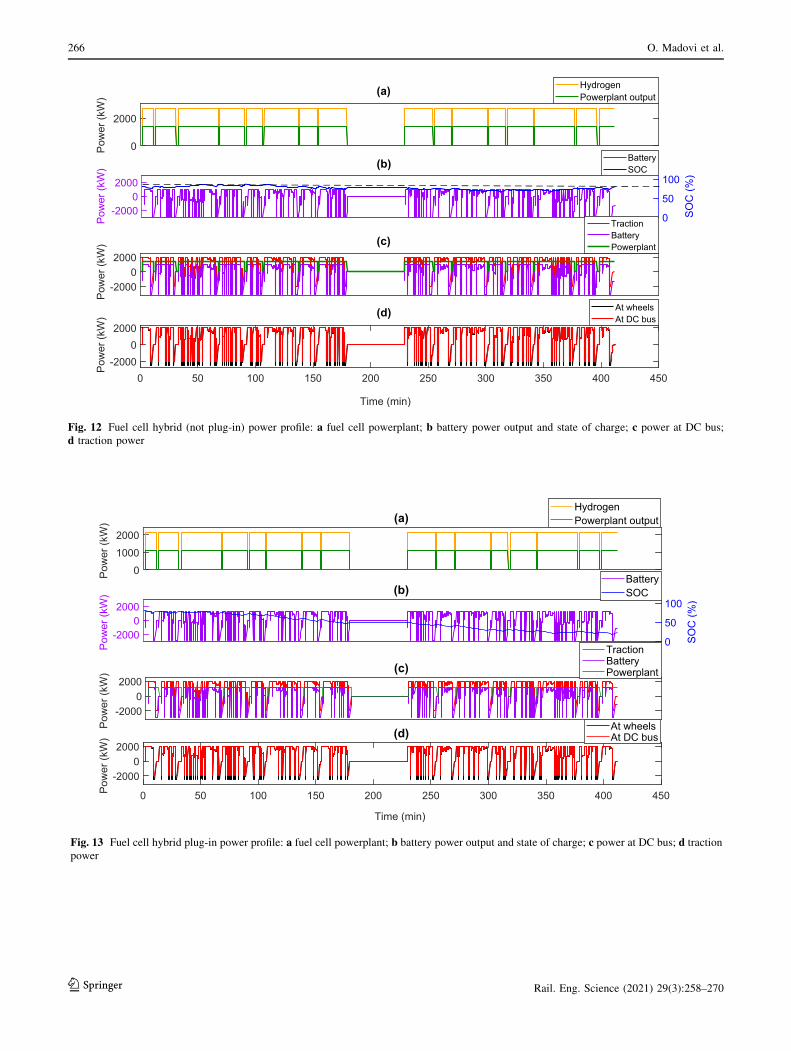
Fig. 12 Fuel cell hybrid (not plug-in) power profile: a fuel cell powerplant; b battery power output and state of charge; c power at DC bus;
d traction power
Fig. 13 Fuel cell hybrid plug-in power profile: a fuel cell powerplant; b battery power output and state of charge; c power at DC bus; d traction
power
266 O. Madovi et al.
123 Rail. Eng. Science (2021) 29(3):258–270
In the hybrid fuel cell locomotive, the fuel cell and on-
board energy storage system supply the required power.
The on-board energy storage system employed in this study
was batteries. To supply the power demand, all the power
sources, shown in Fig. 12c, are connected to a common DC
bus. The nominal bus voltage for the system matches the
traction motor requirements, as shown in Fig. 12d. Here, a
power management system that regulates power flow
shared between the fuel cell and the batteries is employed
to ensure the system operates with high efficiency and good
dynamic response. The power management system regu-
lates the output power of the fuel cell, the charging current
and voltage of the battery, and the output voltage of the
power supply. The fuel cell is sized to ensure that the
battery state of charge at the beginning and end of the
journey are the same, as shown in Fig. 12b. Throughout the
journey, the battery state of charge varies. The battery
power is sized to match the difference in the instantaneous
power demand and the average power demand. Consider-
ing battery life is greatly affected by the range of SOC, the
SOC needs to be maintained between 40% and 80%. Dis-
sipation of the energy, which can be replenished during
regenerative braking phases, reduces the demand on the
fuel cell power plant. As shown in Fig. 12a, the fuel cell
powerplant operates at 65% percent of its capacity thus
reducing the hydrogen demand required. The fuel cells
provide the average power, while the battery covers the
instantaneous power difference.
For the plug-in hybrid fuel cell, the battery SOC is
allowed to fall to 40% of the initial charge, as shown in
Fig. 13b, reducing the required power from the power
plant. As expected, the increased battery energy output
reduced the powerplant output hence a reduction in the
hydrogen required. The powerplant output is lowest for this
configuration at 50% of its capacity, shown in Fig. 13a.
The power at the DC bus, shown in Fig. 13d, is the sum of
the hydrogen fuel cell and the battery output, shown in
Fig. 13c.
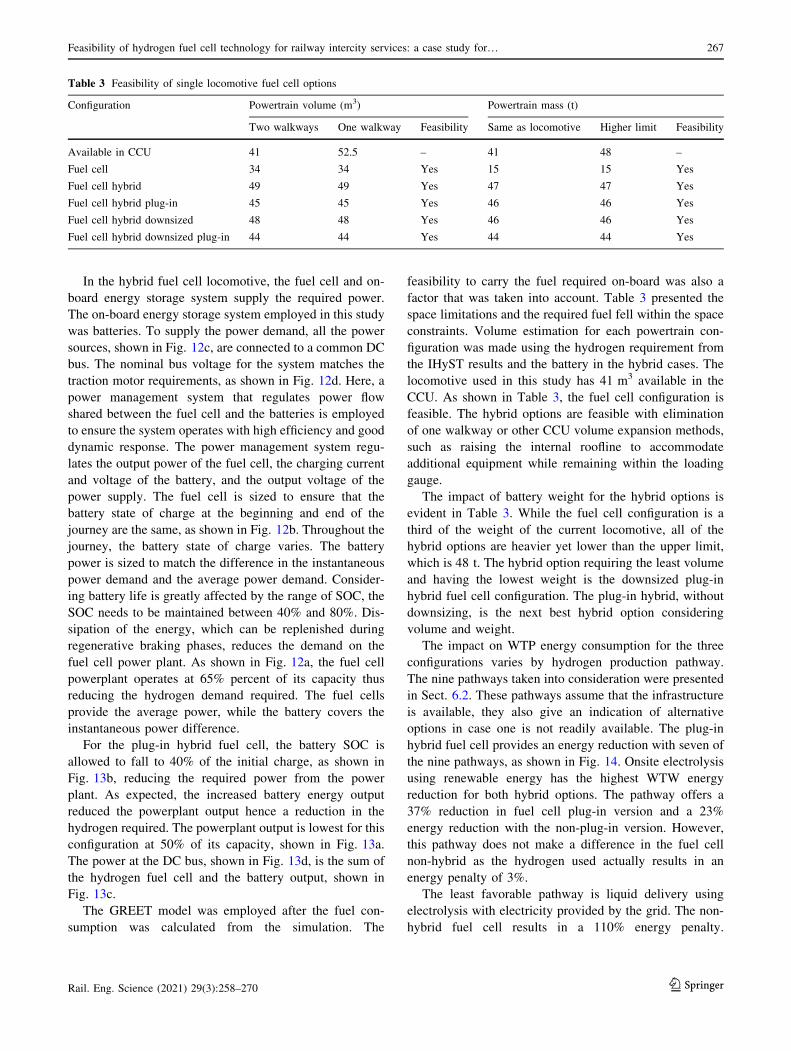
The GREET model was employed after the fuel con-
sumption was calculated from the simulation. The
feasibility to carry the fuel required on-board was also a
factor that was taken into account. Table 3 presented the
space limitations and the required fuel fell within the space
constraints. Volume estimation for each powertrain con-
figuration was made using the hydrogen requirement from
the IHyST results and the battery in the hybrid cases. The
locomotive used in this study has 41 m3 available in the
CCU. As shown in Table 3, the fuel cell configuration is
feasible. The hybrid options are feasible with elimination
of one walkway or other CCU volume expansion methods,
such as raising the internal roofline to accommodate
additional equipment while remaining within the loading
gauge.
The impact of battery weight for the hybrid options is
evident in Table 3. While the fuel cell configuration is a
third of the weight of the current locomotive, all of the
hybrid options are heavier yet lower than the upper limit,
which is 48 t. The hybrid option requiring the least volume
and having the lowest weight is the downsized plug-in
hybrid fuel cell configuration. The plug-in hybrid, without
downsizing, is the next best hybrid option considering
volume and weight.
The impact on WTP energy consumption for the three
configurations varies by hydrogen production pathway.
The nine pathways taken into consideration were presented
in Sect. 6.2. These pathways assume that the infrastructure
is available, they also give an indication of alternative
options in case one is not readily available. The plug-in
hybrid fuel cell provides an energy reduction with seven of
the nine pathways, as shown in Fig. 14. Onsite electrolysis
using renewable energy has the highest WTW energy
reduction for both hybrid options. The pathway offers a
37% reduction in fuel cell plug-in version and a 23%
energy reduction with the non-plug-in version. However,
this pathway does not make a difference in the fuel cell
non-hybrid as the hydrogen used actually results in an
energy penalty of 3%.
The least favorable pathway is liquid delivery using
electrolysis with electricity provided by the grid. The non-
hybrid fuel cell results in a 110% energy penalty.
Table 3 Feasibility of single locomotive fuel cell options
Configuration Powertrain volume (m3) Powertrain mass (t)
Two walkways One walkway Feasibility Same as locomotive Higher limit Feasibility
Available in CCU 41 52.5 – 41 48 –
Fuel cell 34 34 Yes 15 15 Yes
Fuel cell hybrid 49 49 Yes 47 47 Yes
Fuel cell hybrid plug-in 45 45 Yes 46 46 Yes
Fuel cell hybrid downsized 48 48 Yes 46 46 Yes
Fuel cell hybrid downsized plug-in 44 44 Yes 44 44 Yes
Feasibility of hydrogen fuel cell technology for railway intercity services: a case study for… 267
123Rail. Eng. Science (2021) 29(3):258–270
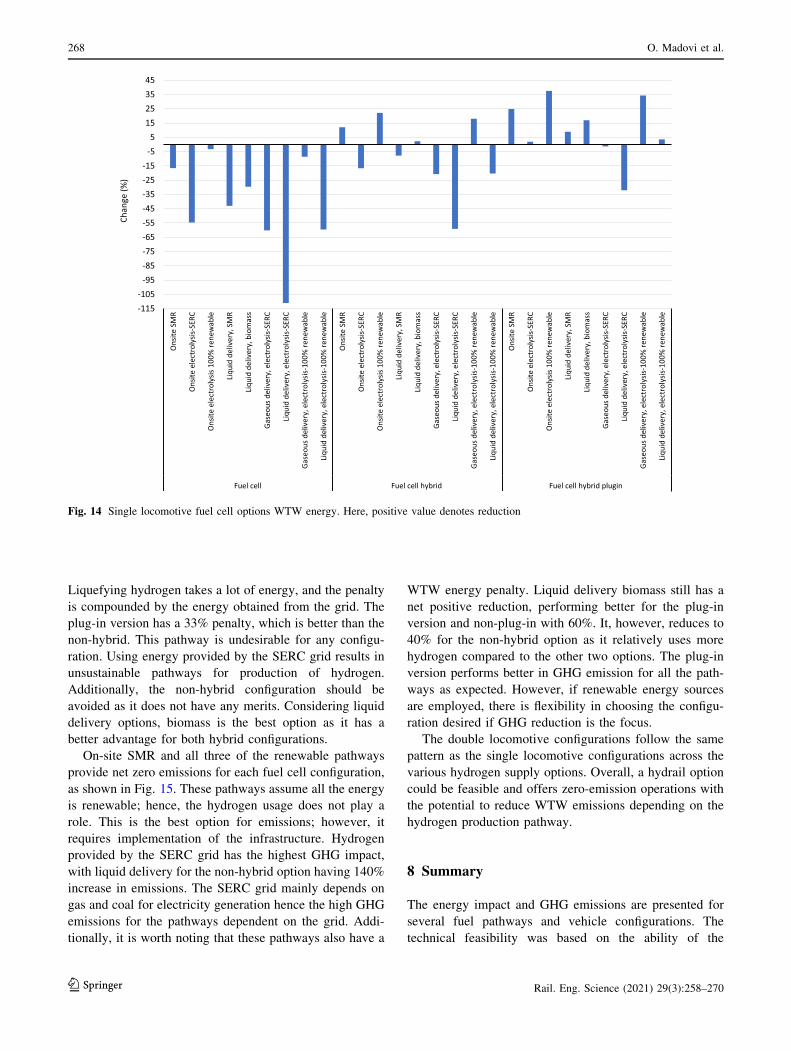
Liquefying hydrogen takes a lot of energy, and the penalty
is compounded by the energy obtained from the grid. The
plug-in version has a 33% penalty, which is better than the
non-hybrid. This pathway is undesirable for any configu-
ration. Using energy provided by the SERC grid results in
unsustainable pathways for production of hydrogen.
Additionally, the non-hybrid configuration should be
avoided as it does not have any merits. Considering liquid
delivery options, biomass is the best option as it has a
better advantage for both hybrid configurations.
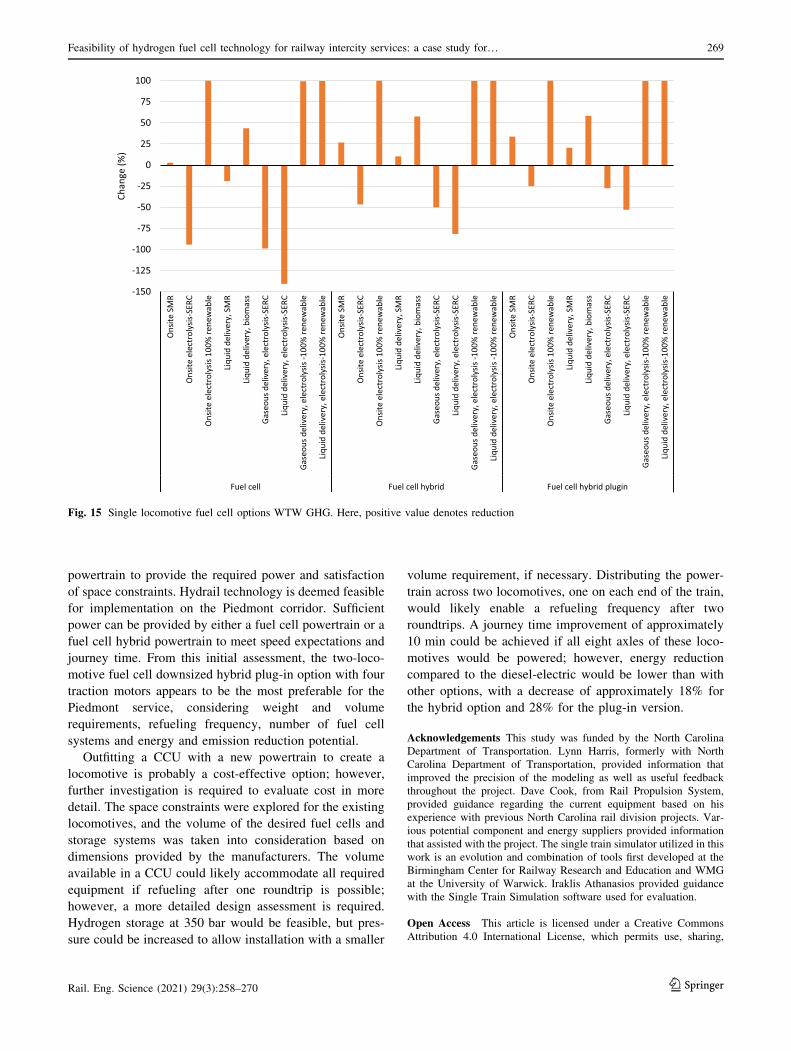
On-site SMR and all three of the renewable pathways
provide net zero emissions for each fuel cell configuration,
as shown in Fig. 15. These pathways assume all the energy
is renewable; hence, the hydrogen usage does not play a
role. This is the best option for emissions; however, it
requires implementation of the infrastructure. Hydrogen
provided by the SERC grid has the highest GHG impact,
with liquid delivery for the non-hybrid option having 140%
increase in emissions. The SERC grid mainly depends on
gas and coal for electricity generation hence the high GHG
emissions for the pathways dependent on the grid. Addi-
tionally, it is worth noting that these pathways also have a
WTW energy penalty. Liquid delivery biomass still has a
net positive reduction, performing better for the plug-in
version and non-plug-in with 60%. It, however, reduces to
40% for the non-hybrid option as it relatively uses more
hydrogen compared to the other two options. The plug-in
version performs better in GHG emission for all the path-
ways as expected. However, if renewable energy sources
are employed, there is flexibility in choosing the configu-
ration desired if GHG reduction is the focus.
The double locomotive configurations follow the same
pattern as the single locomotive configurations across the
various hydrogen supply options. Overall, a hydrail option
could be feasible and offers zero-emission operations with
the potential to reduce WTW emissions depending on the
hydrogen production pathway.
8 Summary
The energy impact and GHG emissions are presented for
several fuel pathways and vehicle configurations. The
technical feasibility was based on the ability of the
Fig. 14 Single locomotive fuel cell options WTW energy. Here, positive value denotes reduction
268 O. Madovi et al.
123 Rail. Eng. Science (2021) 29(3):258–270
powertrain to provide the required power and satisfaction
of space constraints. Hydrail technology is deemed feasible
for implementation on the Piedmont corridor. Sufficient
power can be provided by either a fuel cell powertrain or a
fuel cell hybrid powertrain to meet speed expectations and
journey time. From this initial assessment, the two-loco-
motive fuel cell downsized hybrid plug-in option with four
traction motors appears to be the most preferable for the
Piedmont service, considering weight and volume
requirements, refueling frequency, number of fuel cell
systems and energy and emission reduction potential.
Outfitting a CCU with a new powertrain to create a
locomotive is probably a cost-effective option; however,
further investigation is required to evaluate cost in more
detail. The space constraints were explored for the existing
locomotives, and the volume of the desired fuel cells and
storage systems was taken into consideration based on
dimensions provided by the manufacturers. The volume
available in a CCU could likely accommodate all required
equipment if refueling after one roundtrip is possible;
however, a more detailed design assessment is required.
Hydrogen storage at 350 bar would be feasible, but pres-
sure could be increased to allow installation with a smaller
volume requirement, if necessary. Distributing the power-
train across two locomotives, one on each end of the train,
would likely enable a refueling frequency after two
roundtrips. A journey time improvement of approximately
10 min could be achieved if all eight axles of these loco-
motives would be powered; however, energy reduction
compared to the diesel-electric would be lower than with
other options, with a decrease of approximately 18% for
the hybrid option and 28% for the plug-in version.
Acknowledgements This study was funded by the North Carolina
Department of Transportation. Lynn Harris, formerly with North
Carolina Department of Transportation, provided information that
improved the precision of the modeling as well as useful feedback
throughout the project. Dave Cook, from Rail Propulsion System,
provided guidance regarding the current equipment based on his
experience with previous North Carolina rail division projects. Var-
ious potential component and energy suppliers provided information
that assisted with the project. The single train simulator utilized in this
work is an evolution and combination of tools first developed at the
Birmingham Center for Railway Research and Education and WMG
at the University of Warwick. Iraklis Athanasios provided guidance
with the Single Train Simulation software used for evaluation.
Open Access This article is licensed under a Creative Commons
Attribution 4.0 International License, which permits use, sharing,
Fig. 15 Single locomotive fuel cell options WTW GHG. Here, positive value denotes reduction
Feasibility of hydrogen fuel cell technology for railway intercity services: a case study for… 269
123Rail. Eng. Science (2021) 29(3):258–270
adaptation, distribution and reproduction in any medium or format, as
long as you give appropriate credit to the original author(s) and the
source, provide a link to the Creative Commons licence, and indicate
if changes were made. The images or other third party material in this
article are included in the article’s Creative Commons licence, unless
indicated otherwise in a credit line to the material. If material is not
included in the article’s Creative Commons licence and your intended
use is not permitted by statutory regulation or exceeds the permitted
use, you will need to obtain permission directly from the copyright
holder. To view a copy of this licence, visit http://creativecommons.
org/licenses/by/4.0/.
References
1. Davis S, Boundy RG (2020) Transportation energy data book: 38
edition (No. ORNL/TM-2019/1333). Oak Ridge National Lab,
Oak Ridge, TN
2. Sweeney J, Donnelly A, McElwain L, Jones M (2002) Climate
change: indicators for Ireland (2000-LS-5.2.2-M1). Environ-
mental Protection Agency, Wexford
3. Isaac RS (2020) Fuels and fuel technologies for powering 21st
century passenger and freight rail: simulation-based case studies
in a US context, Dissertation, University of California, Davis.
https://escholarship.org/uc/item/3wt0n8tx
4. Hoffrichter A, Hillmansen S, Roberts C (2016) Conceptual
propulsion system design for a hydrogen-powered regional train.
IET Electr Syst Transp 6(2):56–66
5. Bocharnikov Y, Tobias A, Roberts C et al (2007) Optimal driving
strategy for traction energy saving on DC suburban railways. IET
Electr Power Appl 1:675–682
6. Lu S, Hillmansen S, Ho TK, Roberts C (2013) Single-train tra-
jectory optimization. IEEE Trans Intell Transp Syst 14:743–750
7. Newsom G (2020) Executive Order N-79-20. Sacramento, CA,
State of California. https://sd32.senate.ca.gov/sites/sd32.senate.
ca.gov/files/pdf/executive_order_n-79-20_-_a_technology-
neutral_approach_to_zero_emission_mobility_11_10_20.pdf.
Accessed 15 Jun 2021
8. Berkeley Simulation Software (2021) What is RTC? http://
berkeleysimulation.com/rtc.php. Accessed 14 Feb 2021
9. Rail Management Consultants International GmbH (2021) Rail-
Sys�—My favorite software at work. https://www.rmcon-int.de/
railsys-en/. Accessed 14 Feb 2021
10. AREMA (2018) Manual for railway engineering: Chapter 16
Economics of railway engineering and operations. Lanham, MD
11. Hillmansen S, Roberts C (2007) Energy storage devices in hybrid
railway vehicles: a kinematic analysis. Proc Inst Mech Eng Part F
J Rail Rapid Transit 221(1):135–143
12. Walker A, McGordon A, Hannis G, Picarelli A et al (2006) A
novel structure for comprehensive HEV powertrain modelling.
In: 2006 IEEE vehicle power and propulsion conference, Wind-
sor, UK, 6–8 Sept. 2006. IEEE, pp 1–5
13. Urgun-Demirtas M (2019) GREET model: the greenhouse gases,
regulated emissions, and energy use in transportation model.
Office of Energy Efficiency and Renewable Energy. https://www.
energy.gov/eere/bioenergy/articles/greet-greenhouse-gases-
regulated-emissions-and-energy-use-transportation. Accessed 14
Feb, 2021
14. Hexagon (2019) Composite type 4 high-pressure tanks for CNG
light-duty vehicles. Lincoln, NE. https://cdn.hexagongroup.com/
uploads/2020/04/Brochure_CNG-Light-Duty-Vehicles.pdf.
Accessed 14 Feb, 2021
15. IEA (2009) Transport, energy and CO2: moving toward sus-
tainability. https://iea.blob.core.windows.net/assets/imports/
events/14/Fulton_IEA_Day.pdf . Accessed 20 Feb, 2021
16. Johnson Matthey (2017) Battery systems. Davis, CA. http://www.
jmbatterysystems.com/technology/our-guide-to-batteries. Acces-
sed 16 Feb, 2021
17. Harris WL (2020) Trains: exploring decarbonization options.
Stanford Hydrogen Focus Group Decarbonizing Heavy Duty
Transport. Stanford CA
18. IEA (2006) Hydrogen production and storage: R&D priorities
and gaps. Hydrogen Implementing Agreement. Paris, IEA. http://
www.iea.org/publications/freepublications/
19. Stiegel GJ, Ramezan M (2006) Hydrogen from coal gasification:
an economical pathway to a sustainable energy future. Int J Coal
Geol 65(3–4):173–190
20. IEA (2021) The future of hydrogen—analysis. https://www.iea.
org/reports/the-future-of-hydrogen. Accessed 14 Feb, 2021
21. Meegahawatte D, Hillmansen S, Roberts C, Falco M, McGordon
A, Jennings P (2010) Analysis of a fuel cell hybrid commuter
railway vehicle. J Power Sources 195(23):7829–7837
22. Hoffrichter A, Little N, Foster S et al (2020) The Piedmont ser-
vice: hydrogen fuel cell locomotive feasibility connect NCDOT
business resources. https://connect.ncdot.gov/projects/research/
Pages/ProjDetails.aspx?ProjectID=2019-43. Accessed 30 Dec
2020
23. Harris L (2019) Plans for hydrail implementation on NCDOT’s
Piedmont passenger trains. In: 2019 TRB annual meeting,
Washington, DC
24. Lahnaoui A, Wulf C, Heinrichs H, Dalmazzone D (2019) Opti-
mizing hydrogen transportation system for mobility via com-
pressed hydrogen trucks. Int J Hydrog Energy
44(35):19302–19312
25. Pacific Northwest National Laboratory (2021) Basic hydrogen
properties chart: hydrogen tools. https://h2tools.org/tools.
Accessed 14 Feb, 2021
26. Li Z, Pan X, Sun K, Zhou W, Gao D, Liu S, Ma J (2014)
Development of safety standard for mobile hydrogen refueling
facilities in China. Int J Hydrog Energy 39(25):13935–13939
27. Kent S, Isaac R, Little N, Hoffrichter A (2019) Low- or zero-
emission multiple-unit feasibility study. San Bernardino, CA, 30
Dec 2019
28. Hoffrichter A (2013) Hydrogen as an energy carrier for railway
traction. Dissertation, University of Birmingham
29. Gillette JL, Kolpa RL (2008) Overview of interstate hydrogen
pipeline systems (No. ANL/EVS/TM/08-2). Argonne National
Lab, Argonne, IL, US
30. Air Products and Chemicals Inc (2013) SmartFuel hydrogen
supply options. Allentown, PA
31. Hexagon Lincoln (2017) Hydrogen storage and transportation
systems. Lincoln, NE
32. NC By Train (2021) NCDOT. https://www.ncbytrain.org/
schedules/Pages/piedmont.aspx Accessed 14 Feb 2021
33. EPA (2020) North Carolina nonattainment/maintenance status for
each county by year for all criteria pollutants, Green Book.
https://www3.epa.gov/airquality/greenbook/anayo_nc.html.
Accessed 14 Feb 2021
34. Frey HC, Graver BM, Hu J (2016) Locomotive biofuel study—
rail yard and over the road measurements using portable emis-
sions measurement system (No. DOT/FRA/ORD-16/04). Office
of Research, Development, and Technology, US Department of
Transportation, Federal Railroad Administration, Washington,
DC 20590
270 O. Madovi et al.
123 Rail. Eng. Science (2021) 29(3):258–270