Embed Size (px)
Citation preview

Feasibility of an IntercomparisonExercise of Methods for the Assessment
of the Spatial Representativeness ofMonitoring Sites
Fernando Martín*, José Luís Santiago*, Oliver Kracht**, LauraGarcía*, Michel Gerboles**
*CIEMAT, SPAIN**JRC, ITALY
HARMO 17, Budapest, 9-12 May 2016

Outline
• Introduction (motivation, scope, benefits)
• State of the art
• Questionnaire
• Feasibility analysis
• Proposal of exercise

Motivation• Systematic monitoring and collection of ambient air quality data is a
mandatory.• Directives 2008/50/EC and 2004/107/EC endeavour to ensure that the
information collected on air pollution is sufficiently representative andcomparable.
• Air quality monitoring stations have been deployed trying to cover most ofthe territory. How representative are these?
• The assessment of spatial representativeness is required for different tasks(Station classification, network design, AQ assessment, etc).
• Reporting information on spatial representativeness is not yet mandatoryand not harmonized (no reference method specified).
• FAIRMODE is highly concerned in advancing the assessment procedure ofspatial representativeness (Cross Cutting Activity on SpatialRepresentativeness).

Motivation• The basic concept of spatial representativeness (SR) area: determining the zone
to where the information observed at the a monitoring site can be extended.• What is the spatial representativeness (SR) area of an air quality station?• How can we estimate it?

Scope of the feasibility study• To prepare and evaluate the feasibility of the actual
methodological intercomparison study.
• Identification of :– candidate methodologies,
– requirements on datasets,
• Evaluation of the comparability of the different types ofspatial representativeness results.
• To investigate about the best way to compare the outcomesof the different spatial representativeness (SR) methods
• To identify the limitations to be expected.

Expected benefits
• To gather a comprehensive information aboutthe state of art of spatial representativeness(SR) of AQ stations.
• To identify the requirements for carrying outan intercomparison exercise including as manymethodologies as possible.
• To help to the design of the intercomparisonexercise

State of the art• Tens of papers and reports were collected. The oldest ones are
from the 70s.
• In the framework of FAIRMODE, Castell-Balaguer and Denby(2012) compiled specific comments of experts that revealed themain following points:
– A scientific objective methodology to determine the spatialrepresentativeness of a monitoring station is necessary.
– There are more parameters that should be considered inaddition to pollutant and station classification of the airquality monitoring station.
– The concept of circular area of representativeness is notapplicable.

State of the art• SR definition based on the similarity of concentration of a
specific pollutant.
• Concentration does not differ from the concentration measuredat the station by more than a specified threshold.
• Additional criteria (depending on the context):
– similarity caused by common external factors
– air quality in the station and in the representativeness area should havethe same status regarding the air quality standards
– limit the extension of SR areas
– SR areas has to be stable over time periods, etc.

State of the art• No consensus on a procedure for assessing spatial
representativeness has been reached yet.– There are several methods for estimating SR area.– Classification of methodologies:
1) SR computed by using concentrations maps around monitoring sites. (From modelsor measurements)
2) SR area computed from the distribution of related proxies or surrogate data (landcover/use, emissions, population density, etc.)
3) Methodologies linked with station classification.4) Qualitative information of SR according to a qualitative analysis (e.g. expert
knowledge).
– There are several types of outputs (maps, areas, indexes, etc).– Covering from remote stations to urban-traffic stations– Different pollutants, etc.

Design of the survey and questionnaire• Context (station siting, data assimilation, model evaluation, AQ
reporting, etc) and regulatory purpose. Questions 1 and 2.• Definition of SR. Question 3.• Methodologies:
– Description including time and spatial scale, pollutant, etc. Question 4.– Input data. Question 5.– Output data. Question 6.– Transferability to other regions. Question 7
• Prospective intercomparison exercise:– Participation. Question 8.– Requirements related to the SR methodology. Question 9.– Recommendations about the type of comparison. Question 10.– Requirements on Confidentiality. Question 11.

To whom the questionnaire was sent?• Survey (launched January 2015):
– Final version of the questionnaire was sent to morethan 600 email contacts:• The complete FAIRMODE distribution list (ca 600
contacts).• FAIRMODE national contact points (33 contacts).• AQUILA members. (37 national air quality reference
laboratories )• A selected group of international experts, who have
been identified by the literature study (23 contacts)• The group of reviewers of the questionnaire (7
contacts)

Expert Institution Country
Jutta Geiger LANUV, FB 42 Germany
Wolfgang Spangl Umweltbundesamt Austria Austria
Jan Duyzer TNO Netherland
David Roet Flemish Environment Agency (VMM) Belgium
Antonio Piersanti ENEA Italy
Maria Teresa Pay Barcelona Supercomputing Center Spain
Ana Miranda University of Aveiro Portugal
Florian Pfäfflin IVU Umwelt GmbH Germany
Ronald HoogerbruggeNational Institute for Public Health and the
EnvironmentNetherland
Fernando Martin CIEMAT Spain
Daniel Brookes Ricardo-AEA UK
Laure Malherbe INERIS France
Stephan Henne Empa Switzerland
Stijn Janssen VITO Belgium
Roberto San Jose Technical University of Madrid (UPM) Spain
Jan Horálek Czech Hydrometeorlogical Institute Czech Republic
Kevin Delaney Irish EPA Ireland
Lars GidhagenSwedish Meteorological and Hydrological
InstituteSweden
Hannele Hakola Finnish Meteorological Institute Finland
Tarja KoskentaloHelsinki Region Environmental Services
AuthorityFinland
Erkki PärjäläCity of Kuopio, Regional Environmental
Protection ServicesFinland
Miika Meretoja City of Turku / Environmental division Finland
Table 1: Experts, groups and countries that replied the questionnaire.
Participants in the survey
• A total of 22 groups from15 different countries

Results of the questionnaire• Context.
– Mostly for station siting, networkdesign and air quality reporting(around 70% of the groups).
– The majority of groups (68%) linktheir SR studies to legislative orregulatory purposes .
• Definition.– Similarity of concentration is
the most frequently useddefinition (40%)

Results of the questionnaire• Type of Methodologies.
i. Methods which are based on estimates of the spatial distribution of pollutantsii. Methods which are based on pollutant proxies and / or surrogate dataiii. Methods which are linked to the classification of stations or sitesiv. Other types of methods.
- Most of the groups (16) use methodologies based totally or partially on the spatialdistribution of pollutant concentrations, 8 of them are also based on other types. 13 groupsuse methodologies based totally or partially on proxies or surrogate data.
Type of MethodologyNumber of
MethodologiesConcentration fields 8
Proxies 5Station classification 3
Others 1Concentration+proxies 3
Concentration+proxies+stationclassif. 1
Concentration+proxies+others 1Concentration+proxies+station
classif.+others3
Total 25

Results of the questionnaire• Type of Stations.• Main Pollutants
Type of stationNumber of
Methodologies
Traffic 1Background 3
Industrial 0Urban 2
Suburban 1Rural 4All 18
Remote 1No answer 2
• Spatial and Temporal Scale

Results of the questionnaire• Input Data
• Most methodologies require several types of input data.• Some input data are used in different ways by different methodologies (e.g., emission
inventories used as proxy data in some methodologies or as as input data for modelling).• Most methods need emission inventories and meteorological or/and climatological data
and air quality monitoring data (19 cases). A high percentage of methods use data from airquality modelling data (18) and other surrogate (15).
• All of these types of data are required in order to conduct the intercomparison exercise. Thelack of one of these input data would cause the exclusion of several methodologies.
Input dataNumber of
MethodologiesAir quality monitoring
data 19Data from measuring
campaigns 11Data from air quality
modeling 18
Emission inventories 19
Meteorological or/andclimatological data 19
Other surrogate data 15
Station classification 6
No answer 1

Results of the questionnaire• Output Data
• The outputs of most of the methodologies are reported with maps contouring therepresentativeness area (18 cases).
• From the 18 cases reporting maps, simplified geometric concepts like area or scalecan be derived as many survey participants explained.
• However, simplified metrics of SR area or scale were explicitly mentioned for 11and 9 of declared methodologies.
Output dataNumber of
MethodologiesMaps 18
Metrics 11Scale 9
Similarity of locations 6Spatial variance 1
Other statistics means 3Others 5
No answer 3

Feasibility analysis
Main objective of the intercomparison exercise:
• to evaluate the different contemporary methodologies to
compute SR of air quality monitoring stations by applying
them to a jointly used example case study.
• Open the exercise to as many participants and methodologies
as possible

Feasibility analysis
82%
18%
Participation(groups)
Yes
No 80%
20%
Participation(methodologies)
Yes
No
ParticipationNumber of
groupsNumber of
MethodologiesYes 18 20
No 4 5
Total 22 25

Feasibility analysis
Problems:1. Large variety of methodologies, criteria and
definition of SR Difficult to harmonize thecriteria to define the SR area.
2. Limitations of each methodology spatial andtemporal scale, pollutants, inputs, etc.
3. Type of the outputs (features of SR) is differentdepending on methodology (maps, quantitative andqualitative features) How to compare??

GroupMethodology Scale Output
Models Measure. ProxiesStation
classificationOthers Local/
Urban Regional Maps
LANUV (Germany) x x x x x x xUmweltbundesamt
(Austria) x x x x x x
TNO(Netherlands) x x x
VMM(Belgium) x x x x x
ENEA(Italy)
x x x xx x x x
BSC(Spain)
x x xx x x
UA(Portugal) x x x x x
IVU Umwelt GmbH(Germany) x x x
RIVM(Netherlands) x x x x
CIEMAT(Spain) x x x x x
Ricardo-AEA(UK) x x x
INERIS(France) x x x x x
VITO(Belgium) x x x x
UPM(Spain) x x x x x
FMI(Finland) x x x
Helsinki RESA(Finland) x x x x x
Kuopio, REPS(Finland) x x x x x
Turku /ED(Finland) x x x x x
TOTAL 14 8 10 6 3 15 16 15

Feasibility analysis
Transferability of themethod to other
region
Number ofmethodologies
Number ofmethodologiesinterested toparticipate
Number ofgroups
interested toparticipate
Yes 21 17 15No 2 1 1
No answer 2 2 2Total 25 20 18
Transferability to other region
Transferability of themethod to synthetic
datasets
Number ofmethodologies
Number ofmethodologiesinterested toparticipate
Number ofgroups
interested toparticipate
Yes 16 14 12No 6 3 3
No answer 3 3 3Total 25 20 18
Applicability to synthetic datasets

Feasibility analysis
Limitations :Pollutants requirements.
• Most methods announced
no limitations
• However others are limited
to the main pollutants of the
legislation such as PM10,
PM2.5, SO2, O3 and NOx/NO2.0
20
40
60
80
100
% M
etho
dolo
gies
Pollutants
Pollutant
Pollutantsrequirements
Number ofmethodolo
gies
Number ofmethodologies
interested toparticipate
Number ofgroups
interested toparticipate
No limitation 15 13 12Limited 4 4 3
No answer 6 3 3Total 25 20 18

Feasibility analysisLimitations :Site requirements.• Two main scales: local-urban and regional• Type of stations: Most all types, several groups
note limitations.
Siterequirements
Number ofMethodolog
ies
Number ofmethodologies
interested toparticipate
Number ofgroups
interested toparticipate
Type of station 6 5 5Type of area 4 3 2Extent of the
domain5
5 5
Others 1 0 0No limitation 5 5 5
No answer 9 6 6
8%
36%
20%
4%
20%
4%8%
Spatial Scale
Local-urban
Local-regional
Urban-regional
Only urban
Only regional
Continental
No answer
0
10
20
30
40
50
60
70
80 Type of station
%M
etod
olog
ies
Type of station

Feasibility analysis• How to compare outputs?
• Several participants suggested thecomparison with a unified reference of SR.
• But many highlighted that there is nounified reference.
• To compare the extent of variation of SRestimates without the necessity of areference.
A few participants proposed asensitivity analysis for the thresholdparameter defining the extent of thearea of SR.

Proposal of SR intercomparison exercise• Two spatial scales: the local scale and the urban/regional scale.• SR for NO2 and PM10 at local scale and for NO2, O3 and PM10 at urban/regional scale.• Based on annual metrics of concentrations (averages or percentiles from daily or
hourly values).• Regarding inputs requirements:
– Air quality monitoring data,– Data from sampling campaigns,– Data from air quality modelling,– Emission inventories,– Meteorological and/or climatological data– Other surrogate data (land use/cover, traffic intensities, population density, building geometries , etc) .
• Outputs to compare should be:– SR maps (contour maps),– dimensions of the SR (areas, radii) and– concentration fields (when possible).
• The exercise can be done at least for one traffic and two background stations coveringboth scales (local and urban/regional).
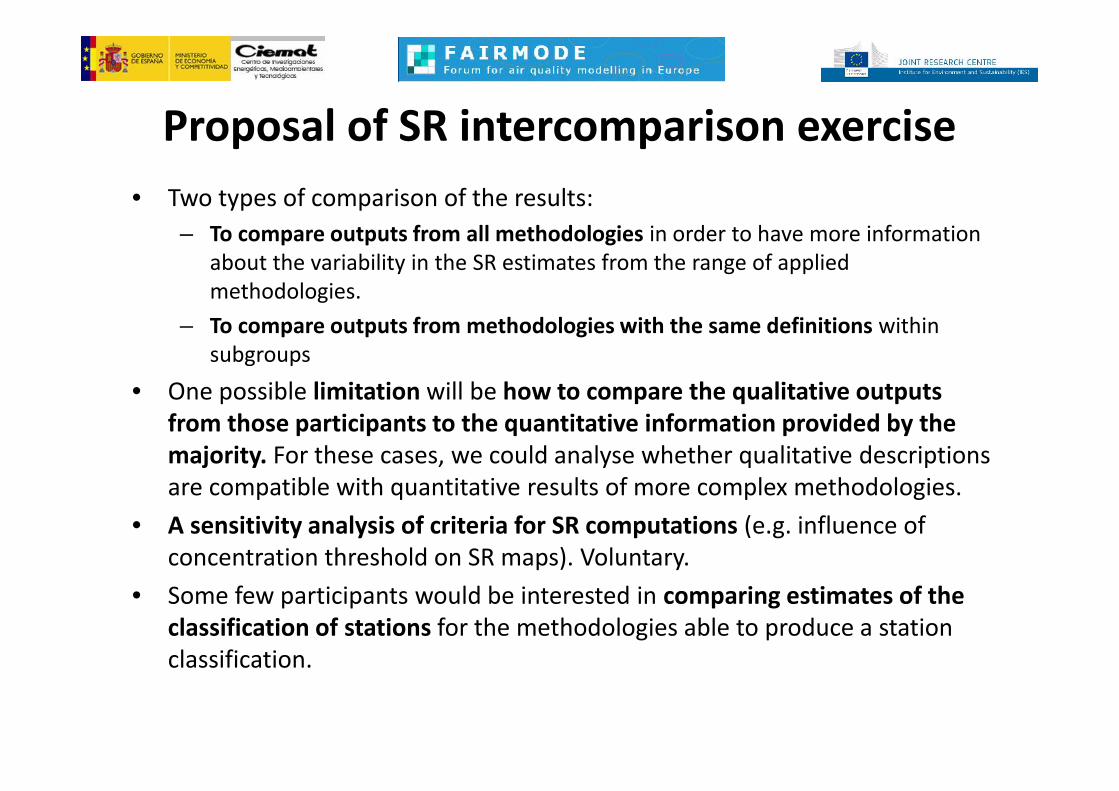
• Two types of comparison of the results:– To compare outputs from all methodologies in order to have more information
about the variability in the SR estimates from the range of appliedmethodologies.
– To compare outputs from methodologies with the same definitions withinsubgroups
• One possible limitation will be how to compare the qualitative outputsfrom those participants to the quantitative information provided by themajority. For these cases, we could analyse whether qualitative descriptionsare compatible with quantitative results of more complex methodologies.
• A sensitivity analysis of criteria for SR computations (e.g. influence ofconcentration threshold on SR maps). Voluntary.
• Some few participants would be interested in comparing estimates of theclassification of stations for the methodologies able to produce a stationclassification.
Proposal of SR intercomparison exercise

Antwerp Datasets• Data from monitoring networks (urban
background, industrial, traffic stations).• 341 virtual stations mimic the
measurements by diffusive samplerswith 14-day time average..
• Modelling data for urban and regionalscales.
• High spatial (street-level) and temporal(hourly) resolution
• Main pollutants (PM10, Ozone and NO2).• Local/urban scale.• Other data can be provided:
– Point, line and surface emission sources fromindustry, traffic and domestic heating,
– building geometry– meteorological data (temperature, wind
speed and direction)– population density
For more information about the FAIRMODE Spatial representativeness feasibilitystudy:
Martin F., J.L. Santiago, O. Kracht, L. García, M. Gerboles (2015): FAIRMODE Spatialrepresentativeness feasibility study. Report number: Report EUR 27385 EN, Affiliation:European Commission Joint Research Centre Institute for Environment andSustainability
For more information about the exercise,visit http://fairmode.jrc.ec.europa.eu/cca.html
or contact Michel Gerboles ([email protected])
Thank you