Embed Size (px)
Citation preview
APPROVED: Jiangping Chen, Major Professor Brian C. O’Connor, Committee Member Lisa Muftic, Committee Member Linda Schamber, Program Coordinator Maurice B. Wheeler, Interim Chair of the
Department of Library and Information Sciences
Herman L. Totten, Dean of the College of Information
Michael Monticino, Dean of the Robert B. Toulouse School of Graduate Studies
THE EFFECT OF MEDIA ON CITIZENS’ FEAR OF CRIME IN TURKEY
Erhan Erdonmez, B.A., M.S.
Dissertation Prepared for the Degree of
DOCTOR OF PHILOSOPHY
UNIVERSITY OF NORTH TEXAS
August 2009
Erdonmez, Erhan. The effect of media on citizens’ fear of crime in Turkey.
Doctor of Philosophy (Information Science), August 2009, 100 pp., 29 tables, 5
figures, references, 59 titles.
This study was conducted on-site in Istanbul, Turkey, to determine the
effects that mass media has on citizens’ perceptions about fear of crime, in
particular, and fear, in general. Specifically, the study was designed to (1)
determine the tendency of citizens’ media consumption, (2) determine the level
of fear of crime among Turkish citizens, (3) establish the effect of media on
citizens’ fear of crime, and (4) determine if gender, age, educational level,
neighborhood, and monthly income have an independent effect on fear of crime.
To achieve this purpose, after administering a survey in Istanbul, the researcher
collected appropriate data and then utilized regression analysis to examine the
relationship between media variables and fear of crime.
A survey consisting of three parts was administered to 545 Turkish
citizens over the age of 18 who currently reside in Istanbul, Turkey. In Part I of
the survey, respondents were asked to identify their trends in relation to media
consumption, and in Part II respondents were asked to report their feelings
about fear of crime. Finally, Part III consisted of socio-demographic
characteristics including gender, age, marital status, level of education, and
income.
The media variables used for this study were, general TV viewing,
watching crime drama, watching TV news, listening to radio news, reading
newspaper news, and reading Internet news.
Regarding the independent effects of socio-demographic variables on fear
of crime, only gender was found to be significantly related thereby supporting
the research hypothesis.
From six media variables, only watching crime drama show and reading
Internet news found to be related with individuals’ fear of crime; however, this
relation disappeared after controlling with socio-demographic variables. In
addition, no cultivation effect could be found among the sub-groups of sample.

ii
Copyright 2009
by
Erhan Erdonmez
iii
TABLE OF CONTENTS
Page
LIST OF TABLES………………………………………………………………………………………..vii
LIST OF FIGURES……………………………………………………………………………………….ix
Chapter
I. INTRODUCTION……………………………………………………………………………………...1
Background of Study
Purpose of the Study
Scope and the significance of the Study
Overview of the Chapters
II. LITERATURE REVIEW…………………………………………………………………………….7
Fear of Crime
Fear of Crime and Age
Fear of Crime and Type of Neighborhood
Fear of Crime and Socioeconomic Status
Media and Fear of Crime
Gerbner’s Cultivation Theory
Core Assumptions and Statements
What counts as cultivation?
Cultural Indicators Project
iv
Perception and Selection of Media Sources by Individuals
Other Literature Related to Media and Fear of Crime
General Television Viewing and Fear of Crime
Television Viewing and Fear of Crime Controlled with Neighborhood
Type
Televised News and Fear of Crime
Newspaper Media and Fear of Crime
Crime Drama and Fear of Crime
Radio News and Fear of Crime
Internet News and Fear of Crime
Summary
Research Question and Hypotheses
Hypotheses Related to Demographic Characteristics
Hypothesis Related to General Television Consumption
Hypothesis Related to Crime Drama Consumption
Hypotheses Related to Crime News Consumption
III. RESEARCH DESIGN AND METHODOLOGY………………………………………………36
Research Method
Operational Definitions of Variables
Dependent Variable
v
Independent Variables
Socio-democratic Measures and Control Variables
Population, Sample and Sampling Technique
Sampling Procedure in Each City
Administration of Survey
Training of the Pollsters
Survey Instrument
Pilot Test
Data Analysis
IV. FINDINGS AND ANALYSIS.....………………………………………………………………..47
Descriptive Statistics
Bivariate Analyses
Gender vs. Fear of Crime
Age vs. Fear of Crime
Place of Residence vs. Fear of Crime
Educational Level vs. Fear of Crime
Monthly Income vs. Fear of Crime
Sources of Crime-related News vs. Fear of Crime
Brief Summary of Bivariate Analysis
Correlation Matrix
vi
Cultivation Effects
Multivariate Analyses
V. DISCUSSION AND CONCLUSION……………………………………………………………76
Socio-demographic Variables and Fear of Crime
Cultivation Effect
Media and Fear of Crime
Limitations
Recommendations for Future Research
APPENDIX A (IRB)……………………………………………………………………………………89
APPENDIX B (PERMISSIONS)…………………………………………………………………….91
REFERENCE LIST……………………………………………………………………………………..94
vii
LIST OF TABLES
Page
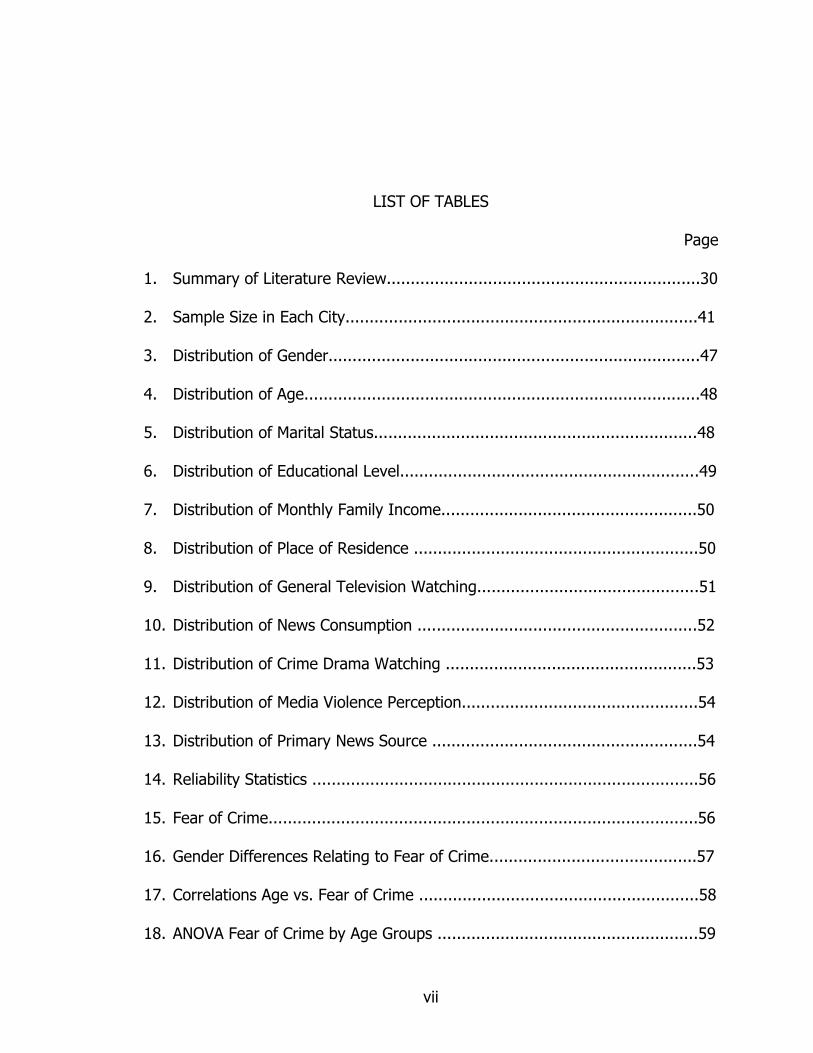
1. Summary of Literature Review.................................................................30
2. Sample Size in Each City.........................................................................41
3. Distribution of Gender.............................................................................47
4. Distribution of Age..................................................................................48
5. Distribution of Marital Status...................................................................48
6. Distribution of Educational Level..............................................................49
7. Distribution of Monthly Family Income.....................................................50
8. Distribution of Place of Residence ...........................................................50
9. Distribution of General Television Watching..............................................51
10. Distribution of News Consumption ..........................................................52
11. Distribution of Crime Drama Watching ....................................................53
12. Distribution of Media Violence Perception.................................................54
13. Distribution of Primary News Source .......................................................54
14. Reliability Statistics ................................................................................56
15. Fear of Crime.........................................................................................56
16. Gender Differences Relating to Fear of Crime...........................................57
17. Correlations Age vs. Fear of Crime ..........................................................58
18. ANOVA Fear of Crime by Age Groups ......................................................59
viii
19. Independent Samples Test Neigh. vs. Fear of Crime.................................59
20. ANOVA Fear of Crime by Educational Level ..............................................60
21. One-way ANOVA Fear of Crime and Monthly Income.................................61
22. Distribution of News Sources ..................................................................61
23. Ind. Samples Test News Source vs. Fear of Crime.....................................62
24. Summary of Bivariate Analysis ................................................................63
25. Correlation Matrix...................................................................................66
26. Cultivation Effects of Sub-categories of Sample.........................................67
27. Regression Coefficients (Model 1) ...........................................................72
28. Regression Coefficients (Model 2) ...........................................................73
29. Hypotheses Testing Table.......................................................................75
ix
LIST OF FIGURES
Page
1. Variation between the cultivation differential (Gerbner & Gross, 1976) ........14
2. Illustration of the sampling method............................................................40
3. Distribution of crime types by fear of crime index........................................55
4. Crime types versus gender .......................................................................58
5. Regression standard residuals vs. regression standardized predicted values .70
1
CHAPTER I
INTRODUCTION
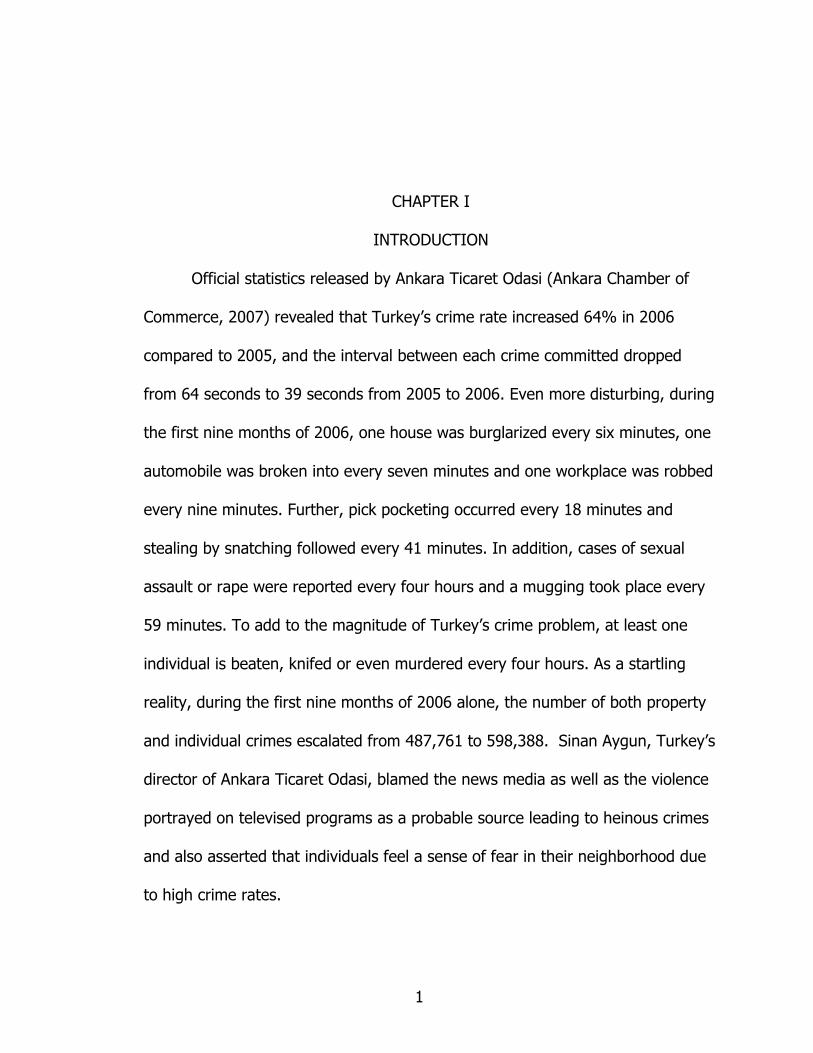
Official statistics released by Ankara Ticaret Odasi (Ankara Chamber of
Commerce, 2007) revealed that Turkey’s crime rate increased 64% in 2006
compared to 2005, and the interval between each crime committed dropped
from 64 seconds to 39 seconds from 2005 to 2006. Even more disturbing, during
the first nine months of 2006, one house was burglarized every six minutes, one
automobile was broken into every seven minutes and one workplace was robbed
every nine minutes. Further, pick pocketing occurred every 18 minutes and
stealing by snatching followed every 41 minutes. In addition, cases of sexual
assault or rape were reported every four hours and a mugging took place every
59 minutes. To add to the magnitude of Turkey’s crime problem, at least one
individual is beaten, knifed or even murdered every four hours. As a startling
reality, during the first nine months of 2006 alone, the number of both property
and individual crimes escalated from 487,761 to 598,388. Sinan Aygun, Turkey’s
director of Ankara Ticaret Odasi, blamed the news media as well as the violence
portrayed on televised programs as a probable source leading to heinous crimes
and also asserted that individuals feel a sense of fear in their neighborhood due
to high crime rates.
2
Clearly, the role that mass media plays in today’s society shapes one’s
perceptions of victims and criminals, and its portrayal of victimization directly
impacts public opinion about the fear of crime. Television, among other means of
communication, creates a unique role that is much more pronounced from other
forms of mass media. For example, Shanahan and Morgan (1999) argued that
the total amount of exposure to watching television far exceeds other types of
mass media and represents a prime source for gathering information and
entertainment that begins early on in a majority of households where television
is considered a part of the household. Children begin to watch television even
before they learn to read and speak, and, moreover, television is most accessible
since it does not require specific computer skills or a knowledge of literacy in
printed materials.
To illustrate the increase of television’s evening news broadcasts relating
to crime and violence, Klite, Robert and Jason (1997) reported that out of 100
television stations, 72 opened with a crime story and one-third addressed crime
or its prevention.
In another study, Shanahan and Morgan (1999) emphasized how
individuals are influenced by violence portrayed through television:
The words ‘television’ and ‘violence’ are inextricably linked in the mind of
the public. And with good reason; with violence occurring in
approximately 70 percent of all broadcast network television programs, at
3
a rate about five violent acts per hour (more than twenty per hour on
children’s programs) and involving close to two-thirds of all major
characters each week, even light viewers can have a difficult time
avoiding substantial doses of symbolic mayhem. As has been so often
noted, our children see about 10,000 acts of violence per year on
television; by the time they graduate from high school, they will have
witnessed about 18,000 violent deaths. (p. 43)
Compared to other countries, Turkey’s television history is relatively new.
Until 1990, for example, the Turkish Radio and Television Organization (TRT)
was the only state-founded national television system that originated as a radio
broadcast in 1937. In the early 1970s, the first black and white screen television
was introduced and remained in effect until 1981 when color television made its
debut. From 1986 to 1992, only four extra channels were added to the TRT, and
by 1993, the organization was broadcasting 24 hours a day. However, the first
national channels did not exist until 1990. With this advent, according to the
Directorate General of Press and Information (2008), the number of national
television channels increased to 27, followed by 16 regional and 215 local
channels. Currently, a variety of televised choices are available for the Turkish
people to watch in the privacy of their own homes. Thus, on the one hand, the
television industry has provided a new network of wholesome entertainment, but
4
on the other hand, consequences that affect one’s personal behavioral activities
have, in some cases, resulted.
Background of Study
The first studies relating to the effects of mass media began in the United
States that has an older television history background and more experience with
topics pertaining to violence portrayed both fictionally and in reality. Beginning in
the 1960s, scholars researched this area in an effort to determine if there were
any significant effects related to fear of crime based on media consumption. In
Turkey, however, although the mass media is invited to come into practically
everyone’s home, due to its short history, the effect that television plays on one’s
daily lives, either directly or indirectly, remains wide open for meaningful
research.
Purpose of the Study
Conducted on-site in Istanbul, Turkey, this study explores the effects that
mass media, namely television, has on citizens’ perceptions about fear of crime,
in particular, and fear, in general. Specifically, the study was to (1) determine
the tendency of citizens’ media consumption, (2) determine the level of fear of
crime among Turkish citizens, (3) establish the effect of media on citizens’ fear of
crime, and (4) determine if gender, age, educational level, and income have an
independent effect on fear of crime.
5
The results may facilitate media agencies in selecting and adjusting their
policies based on possible negative effects as well as provide a unique and
scientific approach. Because this study represents the first to address the media
topic in Turkey, it will serve as a base for future research.
Scope and the Significance of the Study
As is discussed in the following chapter, the literature review pertaining to
the effects of mass media covers a wide and varied topical area. However, this
research focused on the effects that media may play on citizens’ fear of crime
specific to Turkey. Because the study is limited to citizens residing Istanbul, it
therefore does not represent a nationwide study.
In light of previous studies, this research plays a significant role
considering Turkey’s unique environment. With Turkey’s diverse cultural and
historical background, as well as its diverse socioeconomic status groups among
the citizens, this study is the first academic research that attempts to examine
the media’s effects on citizens’ fear of crime in Istanbul, Turkey.
Another contribution of this study will be to the information science area.
Mass media can also be considered as a source of information by providing
individuals with current events through a variety of advanced technologies made
available that include a wide range of channels as well as the Internet or digital
broadcasting. An individual’s choice of media sources can be better understood if
the major factors affecting selection behaviors are identified.
6
Overview of the Chapters
Consisting of five chapters, Chapter I briefly introduces information
pertinent to the study, followed by its purpose, scope and significance. Chapter
II provides a review of the literature as well as a theoretical perspective related
to how the mass media can be instrumental in bringing about fear of crime
among citizens. Because fear of crime represents the dependent variable, the
literature was based on the media’s effect on selected variables. Chapter III
presents and explains the methodology that was gathered through a previous
survey questionnaire, the population and sample, sampling techniques, survey
instrument and administration of the survey. Chapter IV presents the results of
data analysis by providing detailed information regarding all selected variables.
In addition, various regression analyses are employed to assist in determining
the existing relationship between the roles that mass media plays on fear of
crime among Turkish citizens. Chapter V concludes by offering an overall
assessment and providing suggestions and recommendations for future research.
7
CHAPTER II
LITERATURE REVIEW
Fear of Crime
According to Webster’s current online dictionary, fear is defined as “an
emotion experienced in anticipation of some specific pain or danger.” Similarly,
the term has been referred to as “a sort of pain or agitation derived from the
imagination of a future destructive painful evil” (as cited in Kennedy, 1991,
p.141). The state of “fear” is rooted from different sources, with crime being one
of the most common. For example, Lee (2007) reported that fear of crime
developed into an important issue over the past forty years particularly among
criminologists, policymakers, law enforcement agencies, media, and politicians as
illustrated by the emergence of increased research. In an earlier study, Conklin
(1971) defined “fear of crime” as “the sense of personal security in the
community” (as cited in Vanderveen, 2006, p. 4) whereas Covington and Taylor
(1991) suggested that fear of crime is the “emotional response to possible
violent crime and physical harm.” However, not all types of crimes generate fear
as reported by Kershaw et al. (2000), who argued that crimes which directly
affect individuals, namely robbery and burglary, result in higher levels of fear
than larger-scale crimes, for example, dumping chemicals into rivers or selling
experimental drugs to undeveloped countries.
8
In discussing the negative consequences that fear of crime has on an
individual’s daily life, Venderveen (2006), suggested that its anxiety results in
social isolation due to behavioral constraints placed on a person. Similarly, the
Queensland Police Service (2009) categorized the negative effects of fear of
crime under six major headings: restriction of lifestyle, poor quality of life,
decreased confidence, disempowerment, reduced natural surveillance, and
increased financial costs. Although society’s fear of crime has different
implications in relation to gender, age, education, type of residence and income,
scholars have attempted to determine why reported fear of crime varies among
certain social categories (Ferraro, 1995).
Fear of Crime and Gender
While women are less likely to be victimized, they are typically more
fearful than men (Chiricos et al., 2000; Dowler, 2003; Lee, 2007; Warr, 1984)
based on the assumption of their weakness and defenselessness. Consequently,
because the rate of sexual assault toward women is ten times greater than
against men (Crowell & Burgess, 1996), females are more likely to fear being
raped or sexually assaulted (Ferraro, 1995) which also results in their fear of
other type of crimes. Ferraro demonstrated this claim by arguing that women are
more likely to fear being robbed while home alone since the crime may also be
accompanied by a sexual attack.
9
Fear of Crime and Age
Considered as one of the most important demographic variables in social
sciences, the relationship between fear of crime and age represents a substantial
amount of research. Similar to women, the elderly characteristically appear to be
more vulnerable to a wide variety of crimes due to their physical defense
limitations. Although this assumption applies to cases involving muggings or
robberies, it fails to support the elderly fear of sexual offenses (Evans, 1995).
Accordingly, Moore and Spherd (2007) asserted that there is a recent shift in the
correlation of fear and age by suggesting that although elderly individuals have
been found to be the most fearful when compared to other groups, in reality, the
opposite exists. As such, Ferraro (1995) found that despite being limited in the
ability to defend themselves, the level of fear is less than among the younger
population because the elderly reduce their likelihood of being attacked by going
out less (Ferraro, 1995).
Fear of Crime and Type of Neighborhood
Liska, Sanchirico and Reed (1988) suggested that fear of crime is a
problem among individuals in both city and suburban communities that restricts
the freedom to move around from one place to another in the area where they
reside. According to the Chicago school of thought, crime rates are higher in
inner cities. From this perspective, one can assume that inner city residents are
prone to be more fearful of crime. Yarwood and Gardner (2000) stated that
10
crime is more likely to be considered as an urban rather than a rural issue due to
official crime rates that consistently indicate higher crime incidents in urban
areas.
Fear of Crime and Socioeconomic Status
Baumer (1978) suggested that income and education are less consistently
related to fear of crime when compared to gender and age, similar to Clemente
and Kleinman’s (1977) earlier claim that fear of crime is inversely related to
socioeconomic status. After evaluating the results of a 1974 Gallup Poll,
Clemente and Kleinman found that both income and education are negatively
related to fear based on the claim that one’s enhanced financial status is more
likely to protect a person from harm as the result of having sufficient resources
to afford living in safe neighborhoods.
Based on a previous study, Clemente and Kleinman (1976) suggested that
individuals who have less than a high-school diploma are more likely to feel fear
than those who have a high school education or above. Conversely, this
relationship differed in other cultures according to Liu’s (2007) study which
revealed that educated individuals residing in urban China exhibit a higher level
of fear of crime than their less educated counterparts.
Media and Fear of Crime
In determining how the media, both positively and negatively, affects
individuals’ feelings about victimization and fear of crime, among the most well-
11
known studies were conducted by Gerbner and colleagues in 1976, 1977 and
1994. Their theory of cultivation has been evaluated by other researchers and
determined to be rational in explaining the relationship between media and its
effects (Shanahan & Morgan, 1999; Wober & Gunter, 1983). The following
discussion examines Gerbner’s cultivation theory that serves as the building
foundation for the present research.
Gerbner’s Cultivation Theory
Cultivation theory, also referred to as a cultivation hypothesis or
cultivation analysis, was founded by Gerbner, Gross, Morgan, and Signorielli
(1994) who initiated their research in the mid-1960s in an effort to explore
whether television viewing had an effect in shaping an audience’s ideas in
relation to the social world.
Core Assumptions and Statements
Gerbner et al.’s (1994) cultivation theory proposed that the role of
television as a main source of storytelling can be considered as a socializing
mediator worthy of investigating, if indeed, viewing audiences are enticed into
believing that televised fiction is actually a portrayal of reality, given the
increased amount of time watching drama scenarios.
Using Gerbner’s cultivation theory, Shanahan and Morgan (1999)
identified the role of television drama as a key factor that
12
… exploits a particular style of ‘representational realism’, a dominant
convention in Western narrative in general. Representational realism is the
form of story-telling in which the hearer or viewer is convinced that, if
certain assumptions are taken for granted, the events taking place could
happen ‘in reality’. (p. 21)
Gerbner and colleagues (1994) claimed that although television viewing
had a small effect on public behaviors, this effect was found to be important on
their attitudes, beliefs and judgments of how the social world is perceived by
“heavy viewers” (Gerbner & Gross, 1976).
Shanahan and Morgan (1999) further elaborated on how television shapes
an individual’s thoughts based on the cultivation theory:
The presumed realism of the background–a background that is highly
consistent across genres and over time–is critical in the process regardless
of the degree of ‘perceived reality’ we bring to bear on our viewing, no
matter how aware we are of the fact that we are watching a made-up
story, and no matter how much we refuse to suspend our disbelief.
Through narratives and actions that take place against a highly realistic
background, the stories television tells can help shape the deeper,
invisible, rarely questioned assumptions all of us carry around; they do not
determine our thoughts and actions so much as they color and help
inform the meaning of what we think, say and do. (p. 22)
13
According to Gerbner and Gross (1976), individuals who watch four or
more hours of television per day are labeled as ‘heavy viewers’ as opposed to
‘light viewers’ who spend less than four hours in front of the television. In other
words, heavy viewers are more likely to be affected by the ‘Mean World
Syndrome’, an idea that depicts the world as a worse place although in reality, it
actually is not; thus, the overuse of television may encourage a sense of fear.
What Counts as Cultivation?
According to Shanahan and Morgan (1999), cultivation is based on what
television says about reality and what individuals think about reality with the
relationship between the two compromises cultivating in the final step. For
example, cultivation simply begins with cross-tabulations between an individual’s
media or television consumption categorized by heavy and light viewing followed
by the responses to substantive questions. The percentage difference between
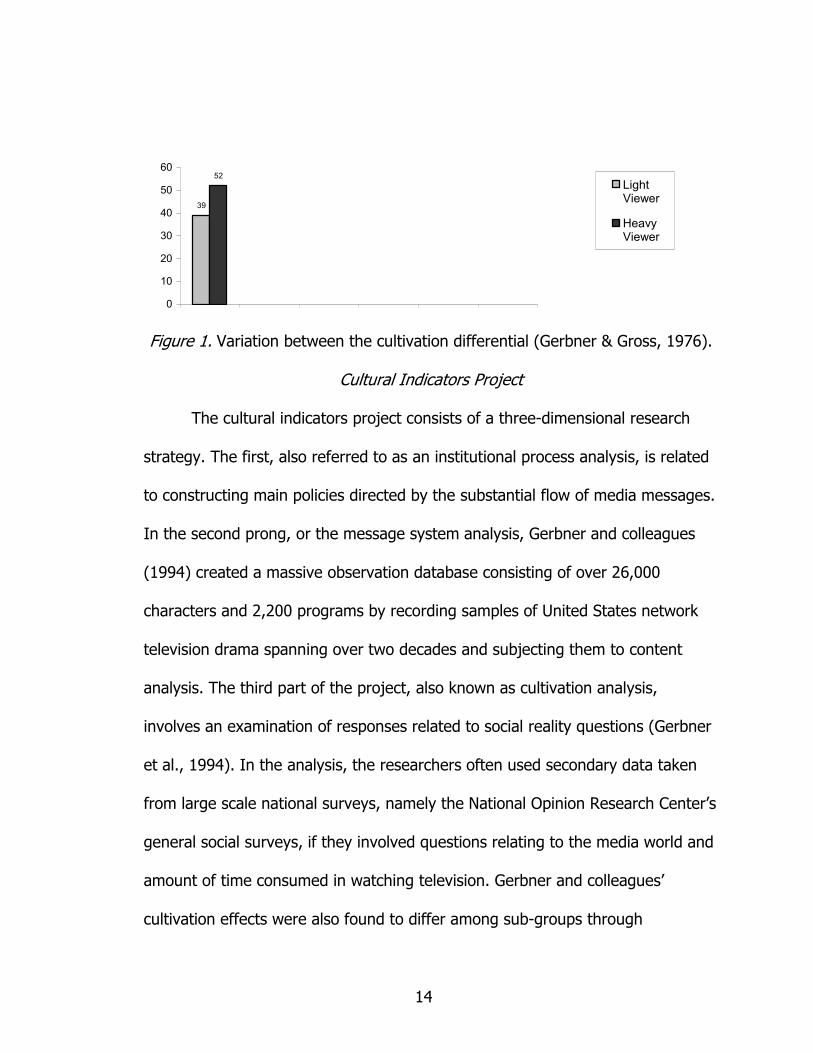
the two viewer groups is referred as “cultivation differential,” or, simply stated,
52% of the heavy viewers worry about being victimized whereas 39% of light
viewers think they might be victimized. As depicted in Figure 1, the difference in
variation between the 52% and 39% “cultivation differential” of heavy versus
light viewers would support Gerbner and Gross’ (1976) cultivation hypothesis.
14
39
52
0
10
20
30
40
50
60
LightViewer
HeavyViewer
Figure 1. Variation between the cultivation differential (Gerbner & Gross, 1976).
Cultural Indicators Project
The cultural indicators project consists of a three-dimensional research
strategy. The first, also referred to as an institutional process analysis, is related
to constructing main policies directed by the substantial flow of media messages.
In the second prong, or the message system analysis, Gerbner and colleagues
(1994) created a massive observation database consisting of over 26,000
characters and 2,200 programs by recording samples of United States network
television drama spanning over two decades and subjecting them to content
analysis. The third part of the project, also known as cultivation analysis,
involves an examination of responses related to social reality questions (Gerbner
et al., 1994). In the analysis, the researchers often used secondary data taken
from large scale national surveys, namely the National Opinion Research Center’s
general social surveys, if they involved questions relating to the media world and
amount of time consumed in watching television. Gerbner and colleagues’
cultivation effects were also found to differ among sub-groups through
15
mainstreaming and resonance effects. Essentially, the mainstreaming effect
caused heavy viewers from different socioeconomic groups to develop a similar
outlook. As such, television content resonates with real life experiences thereby
intensifying the cultivation effect in certain groups (Gerbner et al., 1994). After
decades of research development, the cultivation theory is considered to be a
practical research methodology.
Perception and Selection of Media Sources by Individuals
Mass media can also be considered as a source of information by
providing individuals with current events through a variety of advanced
technologies made available that include a wide range of channels as well as the
Internet or digital broadcasting.
An individual’s choice of media sources can be better understood if the
major factors affecting selection behaviors are identified. For example, Dervin
and Nilan (1986) claimed that users’ behaviors are not always an outcome
involving a simple rational calculation, or individuals do not always choose the
optimal information sources. Rather, information-seeking behavior is defined as
“the purposive seeking from information as a consequence of a need to satisfy
some goal” (Wilson, 2000, p. 49). Wilson also pointed out that users searching
for information have the ability to use either books, newspapers, or computer-
based systems, namely digital libraries or the World Wide Web. Thus, mass
media variables can also be considered under this category in the form of daily
16
or crime news, the Internet, and newspapers. Wilson (1999) earlier suggested
that individuals also face personal barriers while satisfying their informational
needs, for example, role-related and environmental issues. These barriers, in
turn, affect the media selection that individuals use to obtain news reports.
Availability and ease of use are the most important factors during the selection
phase.
Other Literature Related to Media and Fear of Crime
Beginning in the 1960s, scholars determined that the mass media plays a
variety of roles concerning the effects of one’s feelings about fear of crime. In
particular, Gerbner and Gross (1975) and Gerbner et al. (1977) found significant
relationships between media variables and citizens’ fear of crime through
cultivation analysis. Specifically, violence portrayed on television occurs more
than actuality in the real world which, in turn, transforms into fear of crime by
viewers.
General Television Viewing and Fear of Crime
In subsequent research based on Gerbner and Gross (1975) and Gerbner
and colleagues (1977), the relationship between fear of crime and television was
not found to be strong. Hirsch (1980, 1981) and Hughes (1980) further utilized
the same data and other researchers who performed analyses through new data
(Doob & Macdonald, 1979; Heath & Petraitis, 1987; Wober & Gunter, 1983)
found that the relationship between television watching and fear of crime is

17
much more complicated than reported by Gerbner and Gross (1975) and Gerbner
et al. (1977). According to Comstock et al. (1978), who concluded that frequent
television viewing is more common among women, the elderly, the less
educated, and lower income populations, cultivation studies may thus be
problematic to a certain degree because these factors are independent predictors
of fear of crime.
Consequently, Heath and Petraitis (1987) conducted a study to examine
the cultivation hypothesis by applying it to two different settings consisting of
immediate and non-immediate environments. They hypothesized that television
viewing would cultivate impressions in distant urban settings but would have no
effect on citizens’ perceptions of danger in their immediate surroundings. By
performing two studies to test the hypothesis, Heath and Petraitis (1987) first
interviewed by telephone 372 nationwide television viewers in 26 different mid-
size cities across the United States. Respondents were asked how much time was
spent on daily television viewing and whether their viewing was oriented more
toward particular types of programs, for example, comedies, talk shows or crime
drama. Fear of crime was then measured by asking questions related to the
likelihood of risk of victimization in their own city as compared to New York City.
Multivariate analysis of variance was performed to examine the effects of
television viewing on fear of crime by education and gender. Since television
viewing was considered by using total hours and crime drama viewing, two sets
18
of analysis were conducted. The results indicated a significant relationship
between total amount of viewing time and fear of crime in distant urban settings,
namely New York City. However, Heath and Petraitis (1987) did not find any
significant relationship between total television viewing as related to the
respondent’s own city or own neighborhood. In sum, the researchers argued
that there is no relationship between crime drama viewing and fear of crime in
the respondent’s own neighborhood; on the other hand, a statistically significant
relationship was found to exist between exposure to crimes portrayed and
perceptions of crimes in the respondent’s own city. In the second study, using a
sample consisting of 89 male and 103 female undergraduate students from
Chicago, Heath and Petraitis (1987) found a positive relationship between total
television viewing time and general crime drama viewing as well as fear of crime
in non-immediate, urban environments. Heavy viewers were reported to have
higher levels of fear, and consistent with prior findings, women reported more
fear of crime than men.
Although Heath and Petraitis (1987) acknowledged that their over-
sampling of females making up 68% of the sample was not problematic, this was
considered to be a limitation since the sample did not reflect the population.
Accordingly, their studies revealed that females are likely to report more fear of
crime when compared to males, an over-sampling issue that would affect the
significance of findings.
19
When Heath and Gilbert (1996) examined the effects of mass media on
perceptions of crime danger, personal fear of crime and reactions to risk of
crime, they found a complex relationship between fear of crime and television
viewing accredited to multiple factors including type of television programming,
credibility of the individual, and level of apprehension prior to watching the crime
event. The same relationship was found between newspaper crime coverage and
fear of crime that was attributed to the complex factors of level of
sensationalism, randomness and crime location.
Television Viewing and Fear of Crime Controlled with Neighborhood Type
In an earlier but similar study, Doob and Macdonald (1979) hypothesized
that heavy television viewers are more likely to report fear of crime yet the fear
is not related to heavy viewing but rather to residing in more dangerous
neighborhoods. To test this hypothesis, Doob and Macdonald conducted a
survey of 408 Toronto residents by analyzing reported television viewing and
fear in urban and suburban neighborhoods with high and low crime rates.
Although the overall model was consistent with Gerbner et al.’s cultivation theory
based on geographical subgroups, the findings revealed that fear is related to
television viewing by only those residents living in a high-crime urban area. Doob
and Macdonald (1979) explained their results by stating that police dramas
representing a form of violence were related primarily to high-crime
neighborhoods, and, thus, persons residing outside of those neighborhoods in
20
low-crime areas were not affected. Doob and Macdonald (1979) concluded that
the amount of television watched had no effect on citizens’ perception of fear of
crime.
Gross and Aday (2006) conducted a telephone survey of 921 residents
living in Washington, D.C. to compare the effects of local television news,
neighborhood crime rates and personal experiences leading to fear of crime.
After data were gathered and regression analyses were performed to examine
the relationship between dependent and independent variables, heavy viewers
who watched local crime news were found more likely to regard crime as an
important issue. On the other hand, Gross and Aday found no relationship
between watching local television news and fear of crime, but personal
experience and neighborhood crime rates were predictors of fear consistent with
the previous findings of Doob and Macdonald (1979).
In examining the effect of media on fear of crime, Dowler (2003)
conducted a telephone survey derived from the National opinion survey on crime
and justice (Flanagan & Longmire, 1995) comprised of 1,005 adults living in the
United States. Dowler (2003) classified variables under three media topics
representing primary news sources: regular crime drama viewers, hours spent
watching television and print media reporting. Although a significant relationship
was found between watching crime shows and fear of crime, a significant
relationship was not found between hours of television watched and fear of
21
crime. Moreover, the relationship between print media as the primary source of
news and fear of crime was not found to be significant. Consistent with Doob
and Macdonald’s (1979) prior research, respondents who reported a high
number of crime-related neighborhood problems were more likely to fear crime,
most probably resulting from living in an unsafe area. Consistent with prior
research findings, Dowler’s (2003) findings also indicated that female and elderly
respondents were more likely to fear crime.
Televised News and Fear of Crime
Further, Romer, Jamieson and Aday (2003) found a significant relationship
between media viewing of local televised news and fear of victimization by using
three different sources of data. The first was based on the results of a national
risk survey consisting of 1,024 subjects, and their second was based on general
social survey (GSS) results. The third data source was taken from an earlier
survey they conducted in 1998 consisting of 2,369 subjects from Philadelphia.
Romer et al. (2003) reasoned that by using three different data sources they
could compare results gathered from different settings. For example, when
media variables consisting of national and local television, radio programs and
national and local daily newspapers were included, the most common source
among respondents was found to be through national and local television and
local newspaper news. After conducting regression analysis between
respondents’ perceptions of crime risk and the sources of crime news, findings
22
indicated that the primary source was local television news. Although Romer et
al. (2003) found a significant relationship between local television news viewing
and risk perception, results from their first study did not indicate any relationship
between risk perception and national television or local newspaper news.
In their second study, a comparison was made between the results of
1990-1991 to 1993-1994 GSS surveys that included Federal Bureau of
Investigation crime reports taken from metropolitan areas to control for the
relationship between media and fear of crime. The findings indicated that fear of
crime among respondents increased dramatically during all these years, and fear
in the cities was shown to be higher than in the suburbs. Consistent with their
previous findings, reported fear was related to police crime rate reports, and in
addition, age, income and gender were found to be significantly related to the
level of fear reported as well as local television crime coverage.
In their third study, Romer et al. (2003) used regression analysis to
examine the relationship between local television news viewing and fear of crime
in Philadelphia. The results indicated a positive relationship between television
news viewing associated with fear of crime. The researchers further utilized local
police crime reports to determine if the relationship would disappear. Similar to
their previous research, findings indicated that television news viewing remained
a predictor of fear of crime. Because Romer et al. (2003) used three different
sources of data with each consisting of a sample size comprised of more than
23
1,000 subjects, their methodological approach is considered powerful enough to
support significant and solid findings.
In another study, Chiricos, Padgett and Gertz (2000) conducted a survey
of 2,250 Florida residents to determine how the relationship between television
news watching and fear of crime is affected from the reality of crime. Reality of
crime was measured by variables consisting of local crime rates, victim
experiences and perceived realism of crime news. By using multivariate analyses
to examine the relationship between media and fear, Chiricos et al. found that
fear of crime was higher in high crime rate areas, consistent with Doob and
Macdonald (1979) who also did not find a significant relationship between
watching television news and fear of crime, but rather argued that the
relationship is related to the actual crime rates in a specific region. Chiricos et al.
(2000) further found that frequency of watching local and national news as well
as its credibility had a significant positive effect on fear of crime. Finally, the
relationship between watching national news was overshadowed by local news
which also indicates that there is a significant relationship between watching
local news and fear of crime. This finding is consistent with an earlier study
conducted by Heath (1984) related to crimes reported in local newspapers that
tend to have more effect on citizens’ fear of crime. In terms of demographic
variables, Chiricos et al. (2000) found that on a bivariate level, education and
income are both significantly related to fear of crime. However, after controlling
24
with other factors, the effect was found to be indirectly related. In addition, the
researchers argued that fear of crime increased with the respondents’ age and
then dropped as they grew older, or, in other words, the relationship between
age and fear of crime was not linear. Finally, the results indicated that females
consistently reported a higher level of fear of crime.
In a study conducted by Sparks and Ogles (1990) to determine the
distinction between fear of crime and probability of becoming a crime victim, the
authors maintained that the fear of direct victimization is difficult to measure.
When respondents were asked to estimate their feelings of being involved in a
crime or their feelings about safety in their neighborhood, their answers
generally supported the results of a previous survey the researchers conducted
in a Midwestern state. One-half of the respondents were selected from a city
having a high crime rate and the remaining one-half were chosen from a city
having a low crime rate. By utilizing two different scales to measure these
concepts − media and fear of crime− Sparks and Ogles (1990) concluded that a
correlation between media and fear of crime was not found; however, there was
a significant relationship between television viewing and fear of violence.
Although their research revealed significant findings about fear of crime, the
survey sample (n=101) was not large enough to estimate population trends.
25
Newspaper Media and Fear of Crime
Heath (1984) conducted a survey on the role that newspapers play on
citizens’ fear of crime by classifying 36 newspapers according to their proportion
of reporting local, sensational or random crimes. The survey, consisting of 300
newspaper readers, was divided into two parts, a field quasi experiment and a
laboratory experiment. Utilizing a telephone survey in the quasi experiment, the
findings indicated that higher levels of fear of crime were reported if the local
newspaper published a high proportion of crime news. These findings were
replicated in the laboratory experiment by selecting 80 college students to
represent the experimental group who expressed more fear if the crime was
reported in the local newspaper. Heath’s (1984) findings indicated that if the
crime occurs near to the respondent’s surroundings, the level of fear increases.
Using a micro level relationship whereby units of analysis do not include
human subjects, Liska and Baccaglini (1990) researched fear of crime from a
social aspects perspective. In the context of treating fear of crime as a
characteristic of social units, the researchers examined 26 cities, or units, derived
from a national crime survey. The purpose of their study was to analyze the
relationship between fear of crime and structural and cultural characteristics of
cities, namely crime reports and newspaper coverage. Data were collected from
sources including uniform crime reports, national crime surveys, and the U.S.
Census. In an effort to obtain newspaper crime data, Liska and Baccaglini (1990)
26
conducted a content analysis of newspapers in the 26 cities and found that
homicide stories had the most influential impact on fear of crime. Further, local
crime stories had a positive effect on fear of crime as opposed to non-local
stories that had a negative effect, suggesting that in comparison to one’s own
city, crime occurrences in other cities tend to give citizens a feeling of safety, a
finding consistent with Heath’s (1984) research.
In a study pertaining to media crime coverage and public opinion
regarding crime, Sheley and Ashkins (1981) found similarities between televised
and newspaper reporting. They suggested that although televised news had very
little impact on public opinion, the type and method of presentation was
considered to be, more or less, a summary, and the public preferred broader and
more detailed coverage concerning crime news, possibly a main reason for the
lack of impact. On the other hand, newspaper coverage of crime is broader and
tends to report more local crime when compared to television. Conversely,
newspaper crime reporting was found to have a greater impact on public opinion
that is not consistent with other research findings.
Crime Drama and Fear of Crime
To examine the relationship between television crime drama viewing and
authoritarian aggression structure, based on data obtained from the 1976
elections held in the United States, Reith (1999) tested both Gerbner et al.’s
(1994) theory claiming that viewers who watched crime dramas had an
27
increased fear of victimization and Bryant and Zillmanns’ (1994) theory which
posited that fear of victimization motivates watching crime dramas. Reith
justified the selection of these data by asserting that although numerous surveys
had been conducted on time spent watching television, the 1976 election survey
was the only one that included detailed information regarding respondents’ crime
drama viewing patterns. Although Reith’s (1999) findings suggested that there is
a positive relationship between frequency of viewing crime dramas and
authoritarian aggression structure, a significant relationship was not found to
support either Gerbner et al.’s (1994) or Bryant and Zillmann’s (1994) theories
between crime drama viewing and fear of crime.
Ditton, Chadee, Farrall, Gilchrist, and Bannister (2004) conducted a survey
consisting of 167 respondents from Glasgow, Scotland, to determine if a
relationship exists between fear of crime and media viewing. To obtain
qualitative data, of the 167 subjects, 64 were also interviewed. The media
consumption variable consisted of daily newspaper reading, crime television
programs currently watched and earlier programs previously watched.
Quantitative survey results did not indicate a significant relationship between any
type of media consumption and fear of crime that were also supported by the
qualitative data collected from interviews. Overall, a very weak relationship
existed between media consumption and fear of crime.
28
Radio News and Fear of Crime
In an earlier study, Chiricos, Eschholz and Gertz (1997) surveyed 2,096
adults in Florida and found a significant relationship between frequency of
watching televised news and listening to radio broadcasts. However, they were
unable to establish the same relationship between reading newspapers or
magazines and fear of crime. Nevertheless, their survey did reveal a negative
relationship between media and fear of crime among older respondents, a
finding that is not consistent with fear of crime in general. According to Warr
(1984), the fear of crime is commonly higher among females in terms of gender
and higher still among the elderly in terms of age despite that criminal
victimization represent the lowest rates among these two groups.
Internet News and Fear of Crime
Internet news can be classified under the same heading as newspaper
media due to most daily newspapers having online net versions. Typically, the
news is more likely to be read over the Internet as opposed to purchasing an
actual hard copy, and in addition, the Internet is a dynamic source when
compared to traditional newspapers since the news can be updated at any time.
Furthermore, current news video content is available that is associated with
television broadcasts.
However, there are differences in terms of utilizing the news sources.
First, the Internet requires basic computer skills, and second, individuals must
29
have access to the Internet which requires a PC or telephone and an online
connection, or service provider. Thus, by watching television versus using the
Internet, no skills are required which may, in turn, lead Internet readers to draw
a different interpretation of the news. Because Internet users generally enjoy
different socio-demographics and are more likely to be more educated and
financially secure, the relationship between Internet news reading and fear of
crime in the present research are based on these characteristics.
Summary
As presented Table 1, while some scholars claimed that general television
viewing is positively correlated to fear of crime (Gerbner & Gross, 1976; Heath &
Petraitis, 1987), others asserted that there is no significant relationship (Chiricos
et al., 2000; Ditton et al., 2004; Doob & Macdonald, 1979; Dowler, 2003; Sparks
& Ogles, 1990). Of particular note, Hirsch (1980) found a negative relationship
between total daily television viewing and being afraid to walk alone one mile at
night.

30
Table 1
Summary of Literature Review
(table continues)

31
Table 1 (continued).
32
When watching crime drama television was used as a predictor of fear of
crime, Dowler (2003) and Heath and Petraitis (1987) indicated that viewing
these types of productions were positively related to fear of crime whereas Doob
and Macdonald (1979) and Reith (1999) found no significant relationship.
On the other hand, watching crime news that is generally categorized
under national or local media was a factor which affected fear of crime on
different levels. For example, while Chiricos et al. (1997, 2000) and Romer et al.
(2003) found a significant relationship between local televised news and fear of
crime, the same significant relationship could not be established on a national
level. For example, Gross and Aday (2006) determined that fear of crime is not
related to local new coverage as well as national (Romer et al., 2003) televised
news events.
Finally, when newspaper and radio news were used as predictors to
determine the effects on fear of crime, although Liska and Baccaglini (1990) and
Heath (1984) reported a positive relationship, other researchers (Chiricos, et al.,
1997; Ditton et al., 2004) concluded that a relationship could not be established.
In addition to demographic variables, researchers have also employed
type of residence, official crime reports, prior victimization, and police
effectiveness to control for the existing relationship between media variables and
fear of crime. While the literature review is broader, the present researcher
examined the basic relationship between media coverage and citizens’ fear of
33
crime in Turkey. As previously discussed, there are various aspects of media’s
impact on the fear of crime, and although the subject has been approached from
the perspective of television viewing and fear of crime, other operationalized
mass media variables include televised news or crime drama viewing and
newspaper reporting.
In terms of methodological approaches, researchers generally utilize
human subjects as units of analysis in quantitative techniques and perform
regression analysis to establish the relationship between media variables and
fear of crime. As demonstrated in the literature review, the majority of
researchers used demographic variables or actual crime reports to control
regression models.
Research Question and Hypotheses
The main research question to be addressed in this study is “What is the
relationship between media consumption and fear of crime in Istanbul, the
largest city in Turkey?” To answer this primary question, the following
hypotheses were created based on a review of current and previous literature.
Hypotheses Related to Demographic Characteristics
H1: Females are more likely to report more fear of crime than males in the
city of Istanbul.
H2: Elderly citizens are less likely to report fear of crime than younger
citizens in the city of Istanbul.
34
H3: More educated citizens are less likely to report fear of crime than less
educated citizens in the city of Istanbul.
H4: Citizens with higher incomes are less likely to report fear of crime than
citizens with low incomes in the city of Istanbul.
H5: Citizens living in urban areas are more likely to report fear of crime
than citizens living in non-urban environments in the city of Istanbul.
Hypothesis Related to General Television Consumption
H1: Heavy television viewers are more likely to report fear of crime than
light viewers in the city of Istanbul.
Hypothesis Related to Crime Drama Consumption
H1: Regular watching of crime dramas on television positively affects
citizens’ fear of crime in the city of Istanbul.
Hypotheses Related to Crime News Consumption
H1: The duration of time spent watching crime news on television
positively affects citizens’ fear of crime in the city of Istanbul.
H2: The duration of time spent reading crime news in the newspaper
positively affects citizens’ fear of crime in the city of Istanbul.
H3: The duration of time spent listening to crime news on the radio
positively affects citizens’ fear of crime in the city of Istanbul.

35
H4: The duration of time spent with reading crime news over the Internet
negatively affects citizens’ fear of crime in the city of Istanbul.
H5: Citizens using television as the primary source for crime-related news
are more likely to report fear of crime than citizens using other media sources in
the city of Istanbul.
36
CHAPTER III
RESEARCH DESIGN AND METHODOLOGY
The research is designed to determine the role that the mass media plays
in relation to Turkish citizens’ perceptions of fear of crime through both
exploratory and explanatory research methods. Since substantial literature in
Turkey is non-existent pertaining to these topical areas, this study is considered
exploratory, and, by the same token, the study is explanatory in nature through
its examination of the relationship between media and fear of crime.
Research Method
Gerbner et al.’s (1994) cultivation theory is the primary method applied to
this research in determining Turkish citizen’s perceptions of fear of crime as well
as in the selection of variables. In addition, a variety of the most common news
media sources examined by Gerbner and Gross (1976) and Gerbner et al. (1977)
are utilized as independent variables.
A survey method was utilized in accordance with suggestions offered by
the literature. Hagan (2006), for example, stated that survey research is one of
the most common ways to collect data in the field of criminal justice. Utilizing the
survey method also captures respondents’ opinions, attitudes and beliefs as well
their experiences (Alreck & Settle, 2004; Friedrichs, 2004). As such, in addition
37
to a household survey encompassing 32 cities located in Istanbul, Turkey, face-
to-face interviews were conducted using close-ended questions.
Operational Definitions of Variables
Dependent Variable
Fear of crime: Seven survey questions were constructed to examine and
determine the greatest concerns or fears expressed by respondents regarding
personal crimes consisting of (1) respondent/family sexually assaulted, (2)
attacked while driving a car (3) getting mugged (4) getting beaten up with a
knifed, or shot (5) getting murdered, (6) getting burglarized while at home (7)
getting burglarized while no one is at home. Response categories ranging from
one to four for each question relating to fear of crime included: 1=very
frequently, 2=somewhat frequently, 3=seldom, and 4=never. A fear of crime
index was established by scaling the seven items; therefore, the index ranged
from seven to twenty-eight. Higher scores indicated a greater amount of fear
while lower scores indicated a lesser amount of fear or concern.
Independent Variables
Media Variables
Citizens’ perceptions of violence on television programs: To determine
citizens’ perceptions of violence aired on television programs, respondents were
asked to estimate how much attention was devoted to violent crime. The
response category ranged from too much, about right and very little.
38
Primary source of crime news: Respondents were asked to report their
primary source of crime news including television, radio, newspapers, and the
Internet.
General television viewing: Respondents were asked how many hours
they spend viewing general television. Time spent is categorized as 0 to 30
minutes, 30 minutes to one hour, 1-2 hours, 2-4 hours, or more than 4 hours.
News (television, newspapers, radio, the Internet): Respondents were
asked to report the time spent watching televised news, reading crime reports
from a newspaper and listening to radio news. Finally, respondents were asked
to report the amount of time per day spent on the Internet reading about crime-
related issues. Time spent watching, listening and reading crime news from
television, radio, newspapers, and the Internet was categorized as 0 to 30
minutes, 30 minutes to one hour, 1-2 hours, 2-4 hours, or more than four hours.
Crime-drama viewing: The last media variable is crime drama. As such,
from a prepared listing of television programs, respondents were asked how
many of the crime dramas they are watching or used to watch regularly.
Response category ranges from none to five.
Socio-democratic Measures and Control Variables
In an attempt to ensure the actual effect that the media variables play on
fear of crime, controlled socio-demographic variables were employed. Gender
was categorical as male and female, the respondent’s age was a continuous
39
variable and education was categorized under nine categories. Family income
was also categorized under specific income groups based on the Turkish Lira,
and neighborhood type was categorized under urban, suburb or town. Finally,
marital status variable was categorized as married, single, widowed, divorced, or
separated.
Population, Sample and Sampling Technique
The target population was comprised of Turkish citizens over the age of
18 who currently reside in Istanbul. Although referred to as a city in Turkey,
Istanbul is considered a county in American jurisdictions since it encompasses 32
provinces. As such, Istanbul was chosen for this research because the city is
Turkey’s most populated “county” with a population of more than 10,000,000. In
addition, its diversity and socio-cultural background was taken into consideration
because Istanbul is a cosmopolitan county where people of every background
reside. According to the Turkish Statistical Institute (2008), Istanbul’s official
population is 12,573,836, with the number of citizens over 18 years old
representing approximately 9,000,000. A 95% confidence level and 4%
confidence interval was used; based on these levels, an appropriate sample size
should include no less than 600 subjects. In the case of this research, the sample
size consisted of 545 citizens over the age of 18 years, or extremely close to the
confidence level. Stratified multistage cluster sampling was employed because
40
this method improves the accuracy of estimation, and the total sample number
was stratified into subgroups according to each city’s population.
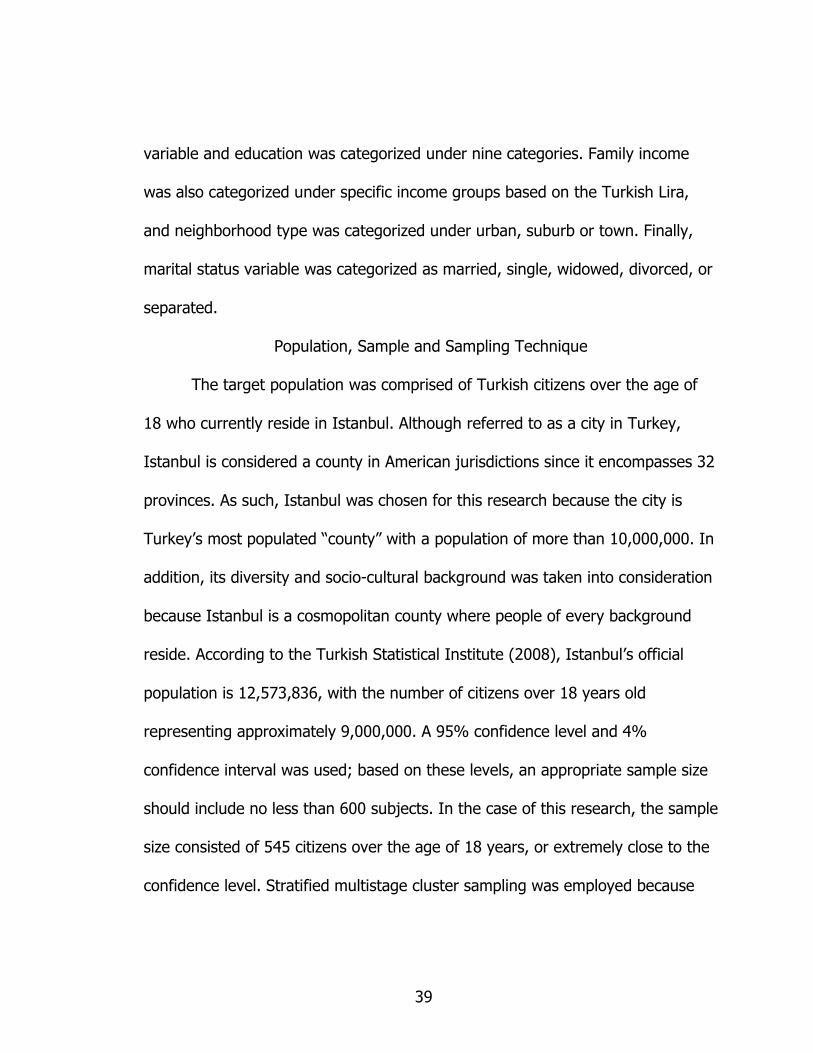
Sampling Procedure in Each City
All neighborhoods in each of the 32 cities located in Istanbul County were
randomly selected followed by a random selection of streets and houses situated
on those designated streets. At least two neighborhoods and no less than two
streets in each neighborhood were selected. On the other hand, the maximum
number of selected houses did not total more than thirty in each neighborhood
or more than ten on each street.
Adapted from Sever (2008)
Figure 2. Illustration of the sampling method.
41
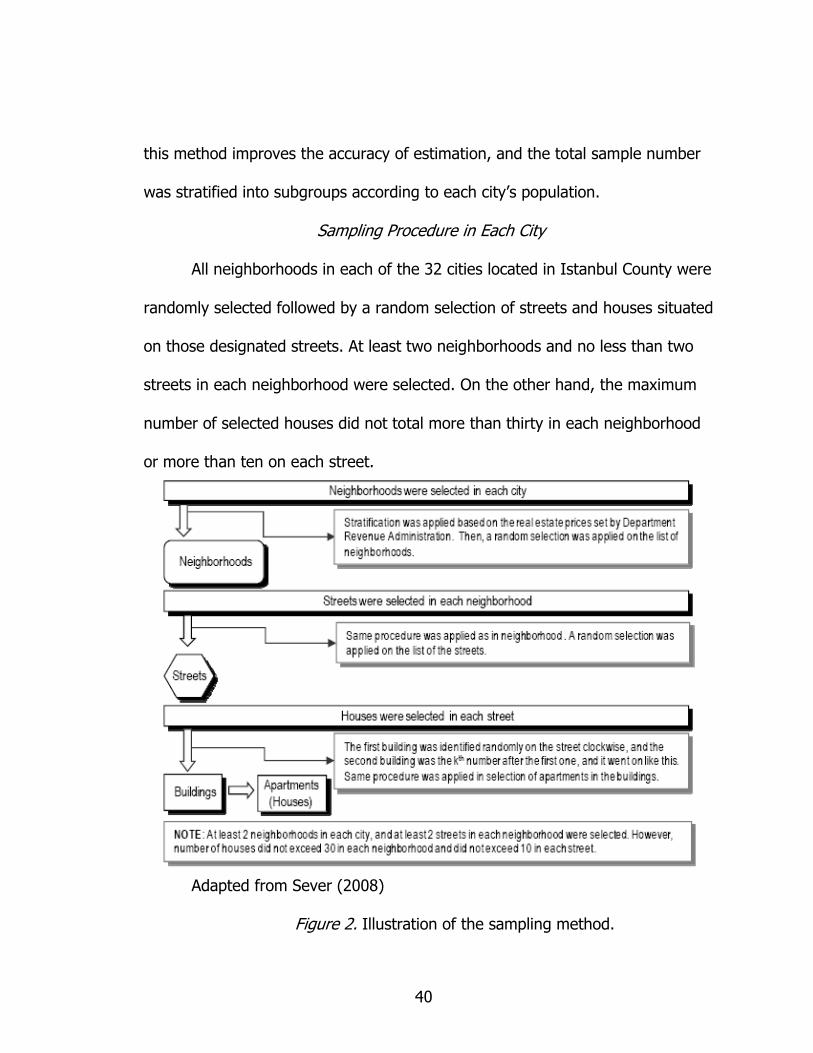
Figure 2 illustrates the stratification process that was employed based on
real estate values determined by the Department of Revenue Administration.
Istanbul’s total population determined the number of households to be included
in each city that was calculated by weighing the city population by the total
county population in proportion to the sample size. Thus, each result provided
the sample size for each city. Table 2 displays the number of households from
each surveyed city.
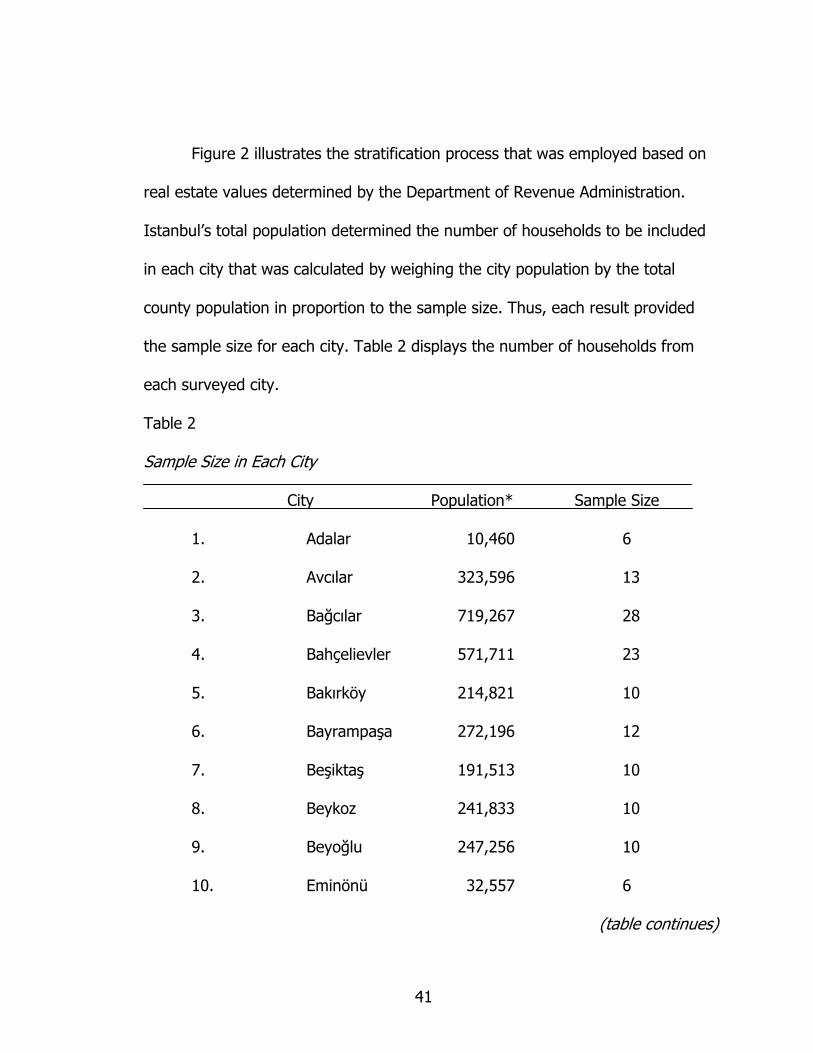
Table 2
Sample Size in Each City
City Population* Sample Size
1. Adalar 10,460 6
2. Avcılar 323,596 13
3. Bağcılar 719,267 28
4. Bahçelievler 571,711 23
5. Bakırköy 214,821 10
6. Bayrampaşa 272,196 12
7. Beşiktaş 191,513 10
8. Beykoz 241,833 10
9. Beyoğlu 247,256 10
10. Eminönü 32,557 6
(table continues)
42
Table 2 (continued).
City Population* Sample Size
11. Esenler 517,235 21
12. Eyüp 325,532 13
13. Fatih 422,941 19
14. Gaziosmanpaşa 1,013,048 41
15. Güngören 318,545 15
16. Kadıköy 744,670 29
17. Kağıthane 418,229 18
18. Kartal 541,209 21
19. Küçükçekmece 785,392 31
20. Maltepe 415,117 18
21. Pendik 520,486 22
22. Sarıyer 276,407 12
23. Şişli 314,684 13
24. Tuzla 165,239 10
25. Ümraniye 897,260 35
26. Üsküdar 582,666 23
27. Zeytinburnu 288,743 14
28. Büyükçekmece 688,774 30
(table continues)
43
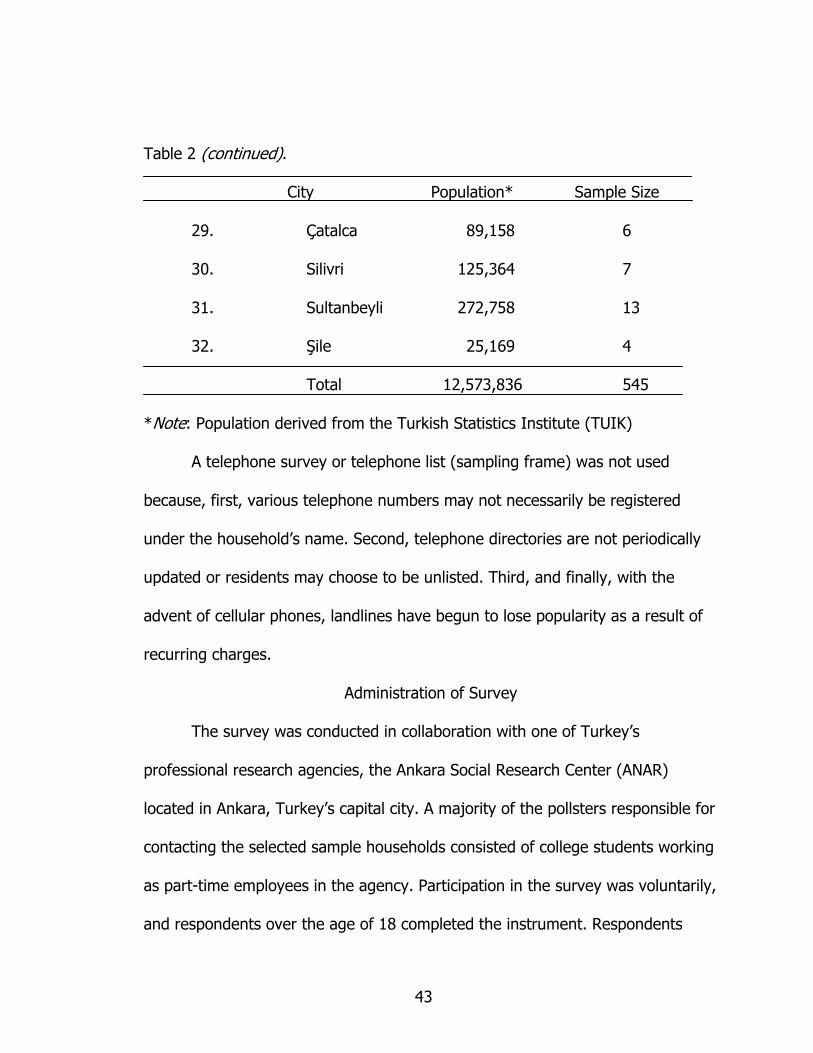
Table 2 (continued).
City Population* Sample Size
29. Çatalca 89,158 6
30. Silivri 125,364 7
31. Sultanbeyli 272,758 13
32. Şile 25,169 4
Total 12,573,836 545
*Note: Population derived from the Turkish Statistics Institute (TUIK)
A telephone survey or telephone list (sampling frame) was not used
because, first, various telephone numbers may not necessarily be registered
under the household’s name. Second, telephone directories are not periodically
updated or residents may choose to be unlisted. Third, and finally, with the
advent of cellular phones, landlines have begun to lose popularity as a result of
recurring charges.
Administration of Survey
The survey was conducted in collaboration with one of Turkey’s
professional research agencies, the Ankara Social Research Center (ANAR)
located in Ankara, Turkey’s capital city. A majority of the pollsters responsible for
contacting the selected sample households consisted of college students working
as part-time employees in the agency. Participation in the survey was voluntarily,
and respondents over the age of 18 completed the instrument. Respondents
44
were not asked for any personal identification and all responses were anonymous
and kept confidential. In an effort to cover all segments of the target population,
the survey was conducted on different days of the week and at different times of
the day.
Training of the Pollsters
All pollsters participating in the survey were briefed about the scope of the
research, sampling technique and sampling procedure. In addition, a manual was
prepared and distributed providing details of the sampling selection
(neighborhoods, streets, buildings, and houses or apartments).
Survey Instrument
The National Opinion Survey of Crime and Justice (Flanagan & Longmire,
1995) regarding citizens’ attitudes toward crime and justice issues was adapted
for this research. Flanagan and Longmire’s (1995) survey consisted of attitudes
toward police, neighborhood problems, courts, the death penalty, gun control,
prisons, and concerns regarding crime as well as basic demographic
characteristics and information related to media variables (for example, hours of
television viewing, source of crime news and crime dramas watched). For the
purpose of this research, their survey was modified by selecting appropriate
questions and adjusting socio-cultural characteristics according to those common
to Turkey.
45
Flanagan and Longmire’s (1995) survey was tested for validity and
reliability before being disseminated to citizens residing in the United States. In
order to utilize and modify this survey instrument, written permission was
obtained from the principal investigators.
In Part I of the survey, respondents were asked to identify their trends in
relation to media consumption, and in Part II respondents were asked to report
their feelings about fear of crime. Finally, Part III consisted of socio-demographic
characteristics including gender, age, marital status, level of education, and
income.
Pilot Test
According to Hagan (2006), to eliminate potential confusion or
misunderstanding, the survey instrument should be pretested before its actual
administration. Therefore, the researcher first conducted a pilot survey in
Istanbul consisting of 30 non-participants for the purpose of offering constructive
feedback. Importantly, because the original survey was developed for English or
Spanish-speaking respondents, often translation into another language does not
make sense. Accordingly, a pretest was necessary to systematically revise the
language.
Data Analysis
In addition to media consumption characteristics, descriptive statistics
were utilized in the first part of data analysis to determine the survey
46
respondents’ demographic characteristics, including gender, age, marital status,
level of education, and income.
Second, the researcher conducted bivariate statistics to examine the
relationship between fear of crime and each individual independent variable.
Independent sample t tests, ANOVA and correlations were performed to test the
research hypotheses.
In the final segment of the analysis, the researcher first examined the
relationship between media variables and citizens’ fear of crime with an OLS
model and then conducted the same OLS model by entering socio-demographic
variables into the model.
47
CHAPTER IV
FINDINGS AND ANALYSIS
Descriptive Statistics
Prior to beginning analysis, the dataset was screened for missing data
which revealed that there were very few omitted, or less than three percent in
each variable. Therefore, these missing data were replaced with the mode value.
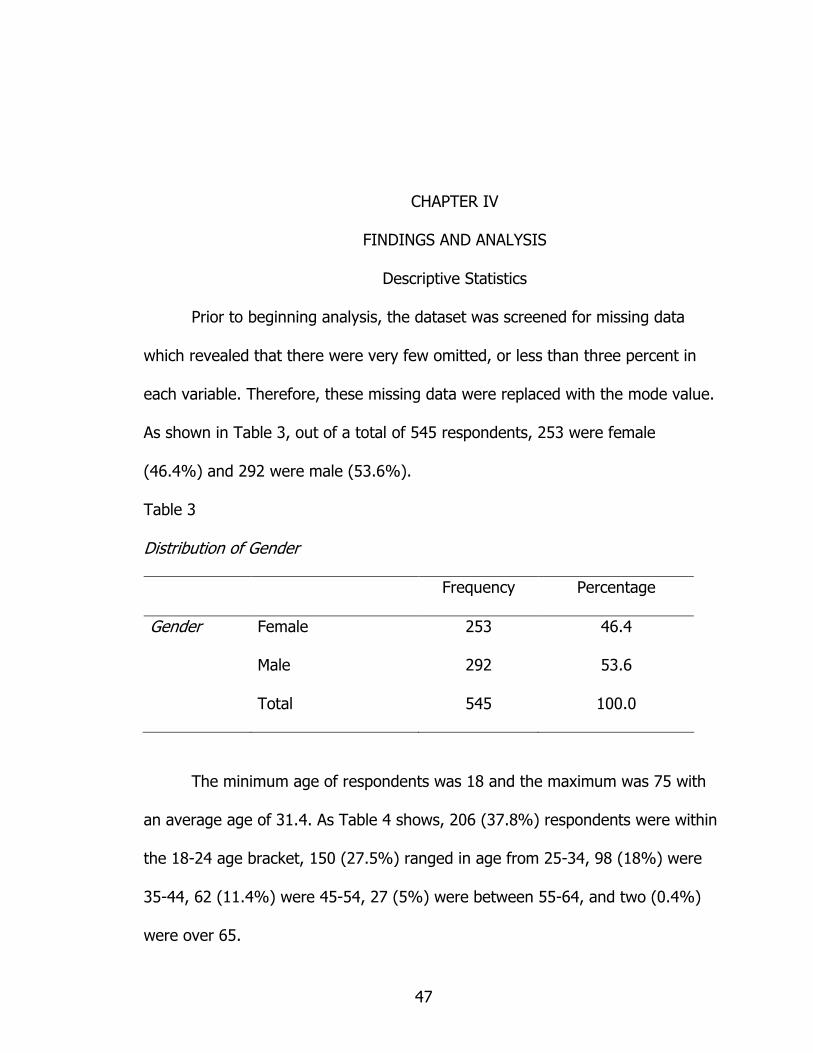
As shown in Table 3, out of a total of 545 respondents, 253 were female
(46.4%) and 292 were male (53.6%).
Table 3
Distribution of Gender
Frequency Percentage
Gender Female 253 46.4
Male 292 53.6
Total 545 100.0
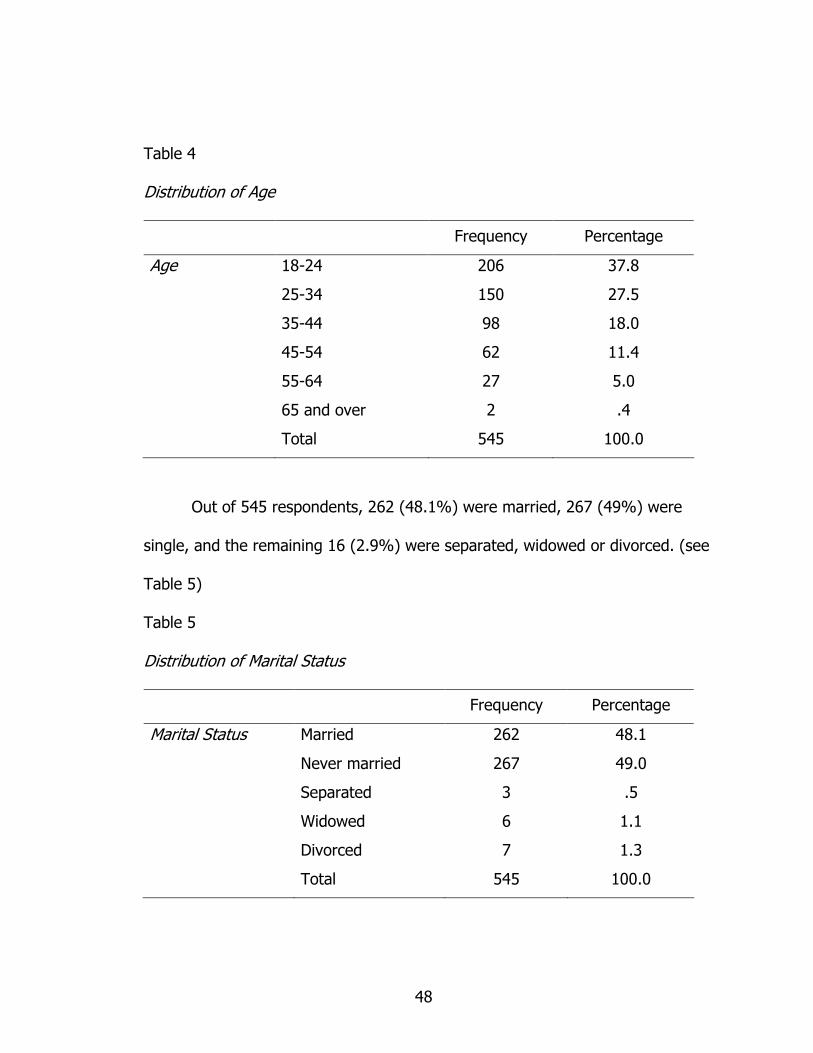
The minimum age of respondents was 18 and the maximum was 75 with
an average age of 31.4. As Table 4 shows, 206 (37.8%) respondents were within
the 18-24 age bracket, 150 (27.5%) ranged in age from 25-34, 98 (18%) were
35-44, 62 (11.4%) were 45-54, 27 (5%) were between 55-64, and two (0.4%)
were over 65.
48
Table 4
Distribution of Age
Frequency Percentage
Age 18-24 206 37.8
25-34 150 27.5
35-44 98 18.0
45-54 62 11.4
55-64 27 5.0
65 and over 2 .4
Total 545 100.0
Out of 545 respondents, 262 (48.1%) were married, 267 (49%) were
single, and the remaining 16 (2.9%) were separated, widowed or divorced. (see
Table 5)
Table 5
Distribution of Marital Status
Frequency Percentage
Marital Status Married 262 48.1
Never married 267 49.0
Separated 3 .5
Widowed 6 1.1
Divorced 7 1.3
Total 545 100.0
49
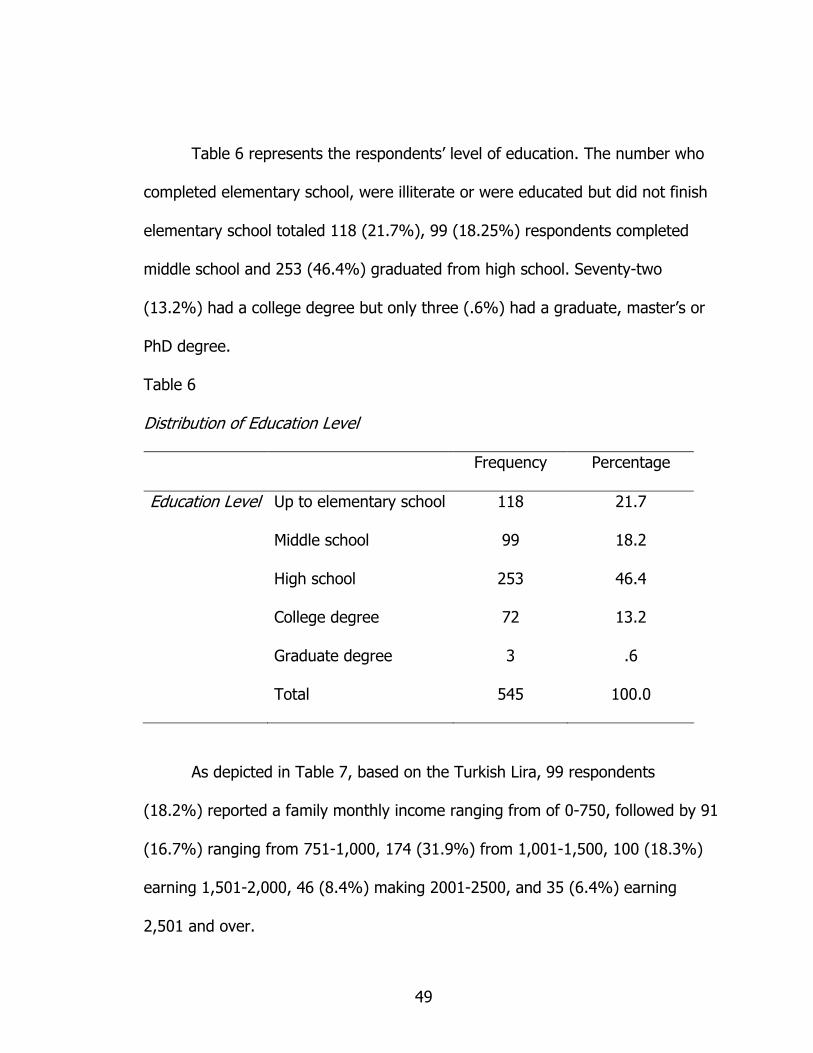
Table 6 represents the respondents’ level of education. The number who
completed elementary school, were illiterate or were educated but did not finish
elementary school totaled 118 (21.7%), 99 (18.25%) respondents completed
middle school and 253 (46.4%) graduated from high school. Seventy-two
(13.2%) had a college degree but only three (.6%) had a graduate, master’s or
PhD degree.
Table 6
Distribution of Education Level
Frequency Percentage
Education Level Up to elementary school 118 21.7
Middle school 99 18.2
High school 253 46.4
College degree 72 13.2
Graduate degree 3 .6
Total 545 100.0
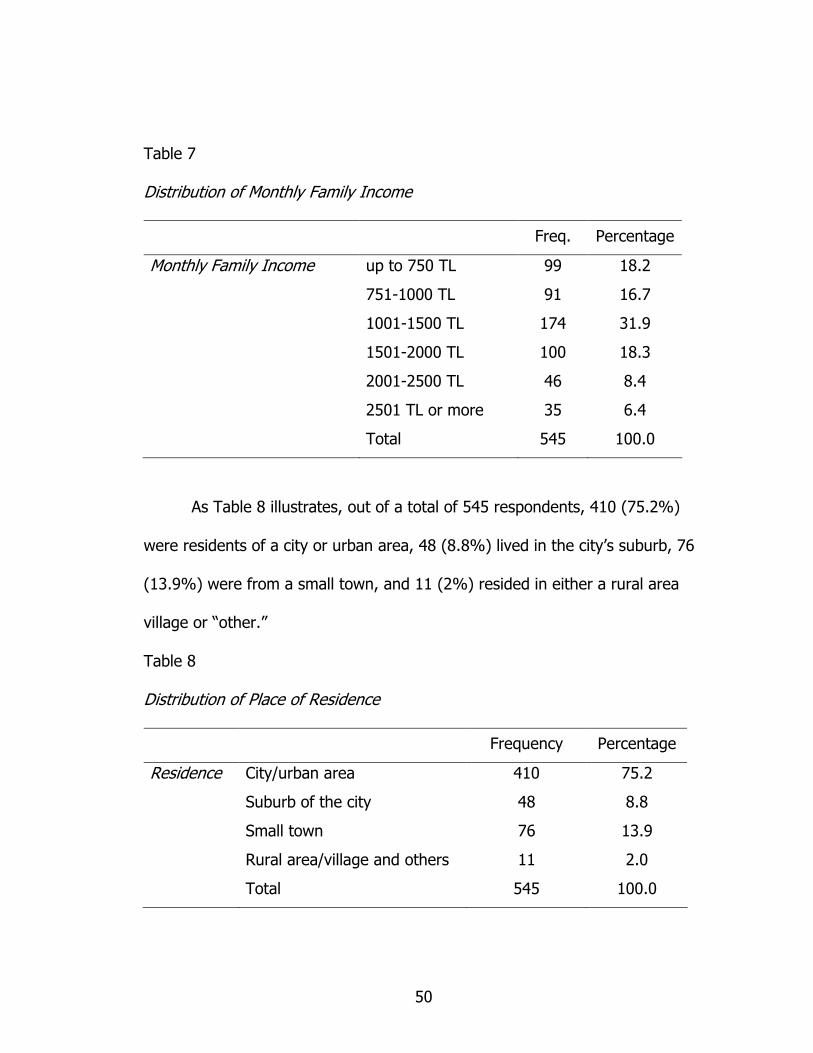
As depicted in Table 7, based on the Turkish Lira, 99 respondents
(18.2%) reported a family monthly income ranging from of 0-750, followed by 91
(16.7%) ranging from 751-1,000, 174 (31.9%) from 1,001-1,500, 100 (18.3%)
earning 1,501-2,000, 46 (8.4%) making 2001-2500, and 35 (6.4%) earning
2,501 and over.
50
Table 7
Distribution of Monthly Family Income
Freq. Percentage
Monthly Family Income up to 750 TL 99 18.2
751-1000 TL 91 16.7
1001-1500 TL 174 31.9
1501-2000 TL 100 18.3
2001-2500 TL 46 8.4
2501 TL or more 35 6.4
Total 545 100.0
As Table 8 illustrates, out of a total of 545 respondents, 410 (75.2%)
were residents of a city or urban area, 48 (8.8%) lived in the city’s suburb, 76
(13.9%) were from a small town, and 11 (2%) resided in either a rural area
village or “other.”
Table 8
Distribution of Place of Residence
Frequency Percentage
Residence City/urban area 410 75.2
Suburb of the city 48 8.8
Small town 76 13.9
Rural area/village and others 11 2.0
Total 545 100.0
51
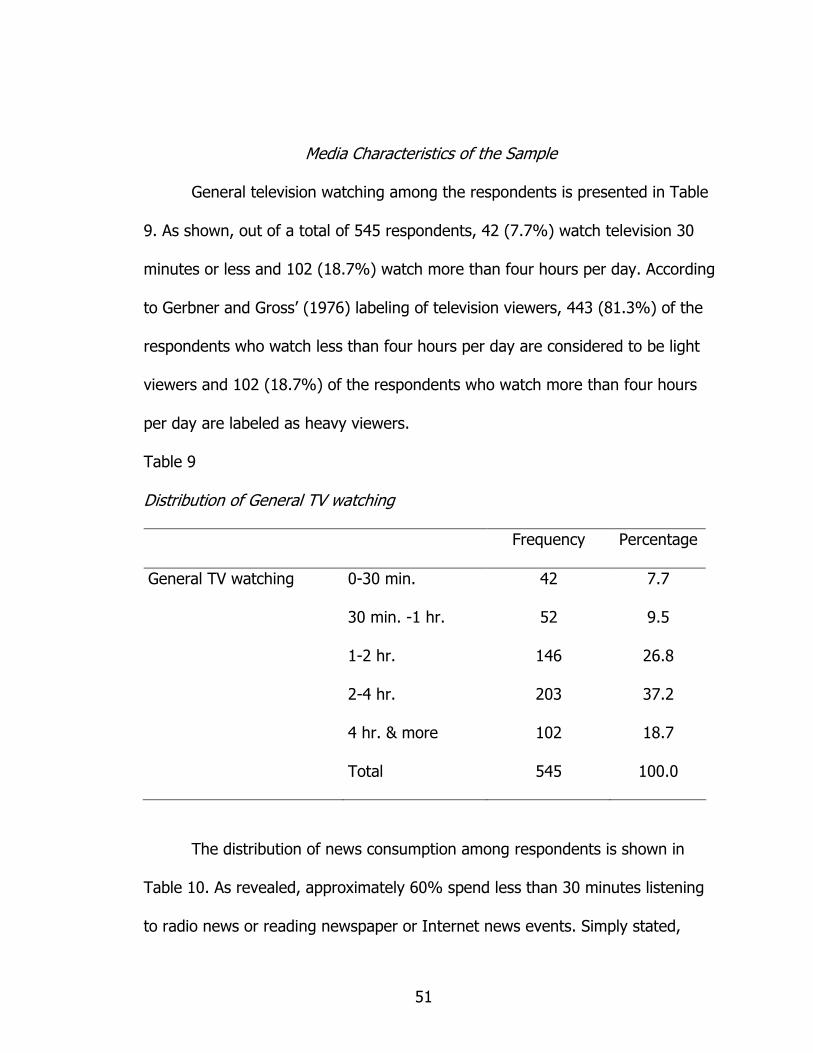
Media Characteristics of the Sample
General television watching among the respondents is presented in Table
9. As shown, out of a total of 545 respondents, 42 (7.7%) watch television 30
minutes or less and 102 (18.7%) watch more than four hours per day. According
to Gerbner and Gross’ (1976) labeling of television viewers, 443 (81.3%) of the
respondents who watch less than four hours per day are considered to be light
viewers and 102 (18.7%) of the respondents who watch more than four hours
per day are labeled as heavy viewers.
Table 9
Distribution of General TV watching
Frequency Percentage
General TV watching 0-30 min. 42 7.7
30 min. -1 hr. 52 9.5
1-2 hr. 146 26.8
2-4 hr. 203 37.2
4 hr. & more 102 18.7
Total 545 100.0
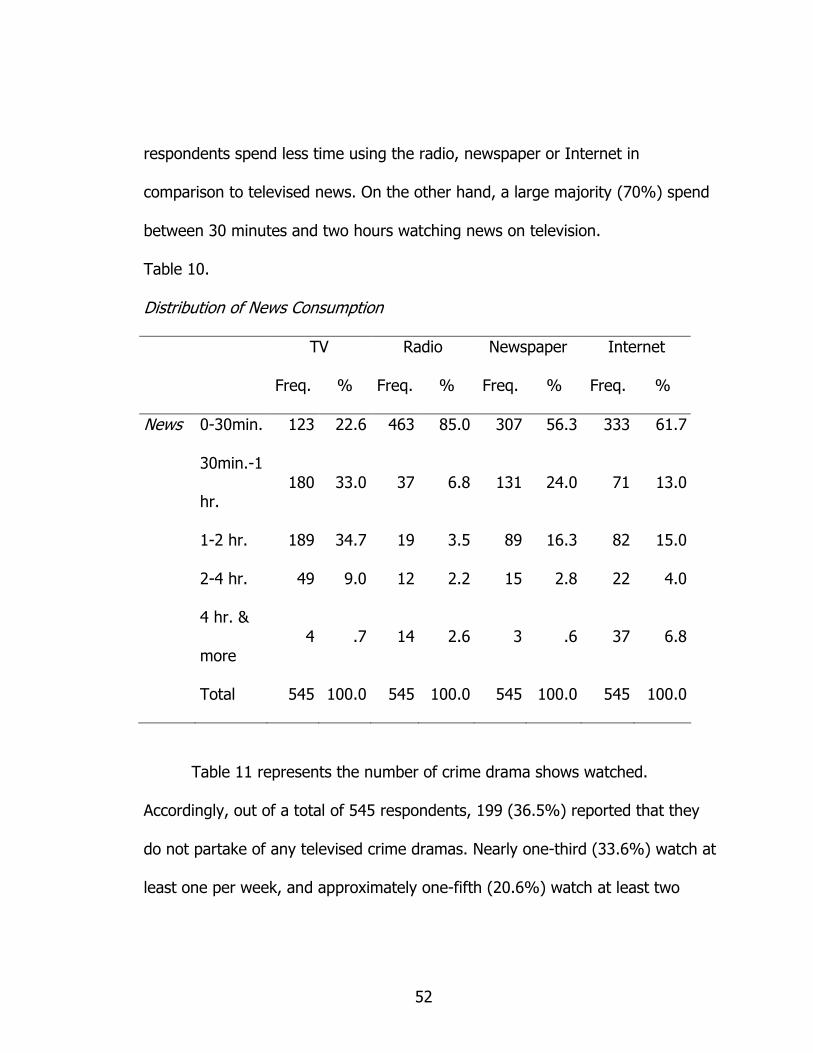
The distribution of news consumption among respondents is shown in
Table 10. As revealed, approximately 60% spend less than 30 minutes listening
to radio news or reading newspaper or Internet news events. Simply stated,
52
respondents spend less time using the radio, newspaper or Internet in
comparison to televised news. On the other hand, a large majority (70%) spend
between 30 minutes and two hours watching news on television.
Table 10.
Distribution of News Consumption
TV Radio Newspaper Internet
Freq. % Freq. % Freq. % Freq. %
News 0-30min. 123 22.6 463 85.0 307 56.3 333 61.7
30min.-1
hr. 180 33.0 37 6.8 131 24.0 71 13.0
1-2 hr. 189 34.7 19 3.5 89 16.3 82 15.0
2-4 hr. 49 9.0 12 2.2 15 2.8 22 4.0
4 hr. &
more 4 .7 14 2.6 3 .6 37 6.8
Total 545 100.0 545 100.0 545 100.0 545 100.0
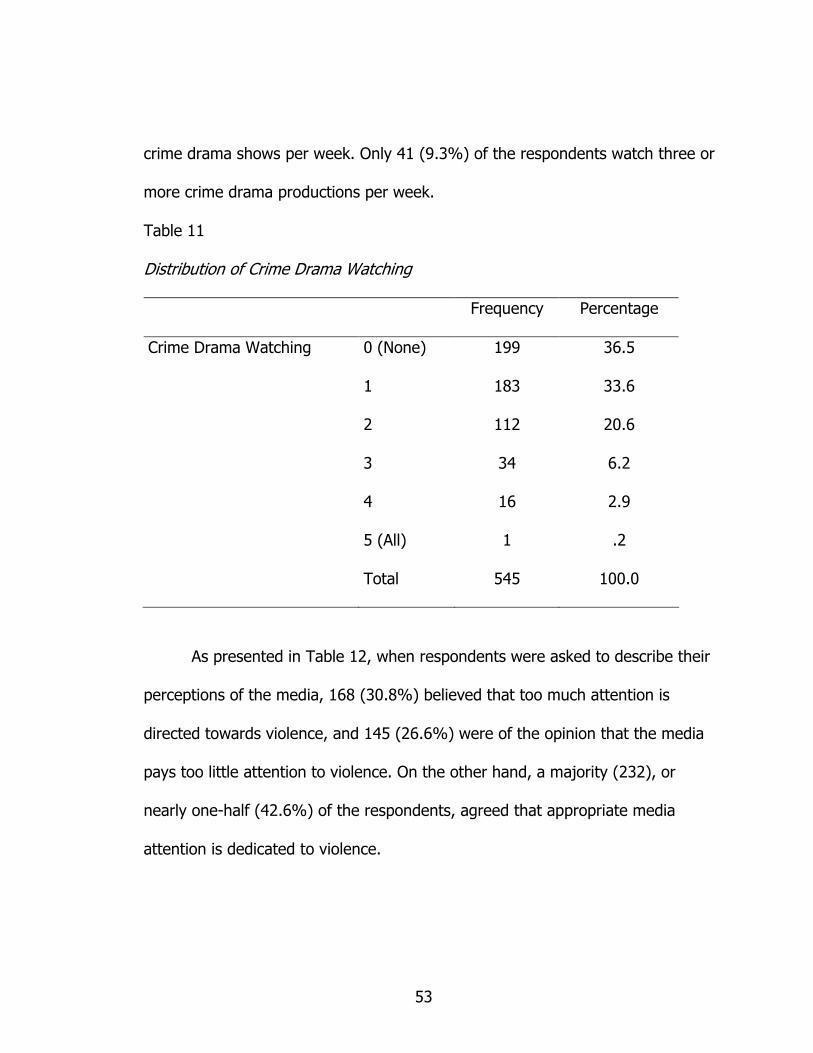
Table 11 represents the number of crime drama shows watched.
Accordingly, out of a total of 545 respondents, 199 (36.5%) reported that they
do not partake of any televised crime dramas. Nearly one-third (33.6%) watch at
least one per week, and approximately one-fifth (20.6%) watch at least two
53
crime drama shows per week. Only 41 (9.3%) of the respondents watch three or
more crime drama productions per week.
Table 11
Distribution of Crime Drama Watching
Frequency Percentage
Crime Drama Watching 0 (None) 199 36.5
1 183 33.6
2 112 20.6
3 34 6.2
4 16 2.9
5 (All) 1 .2
Total 545 100.0
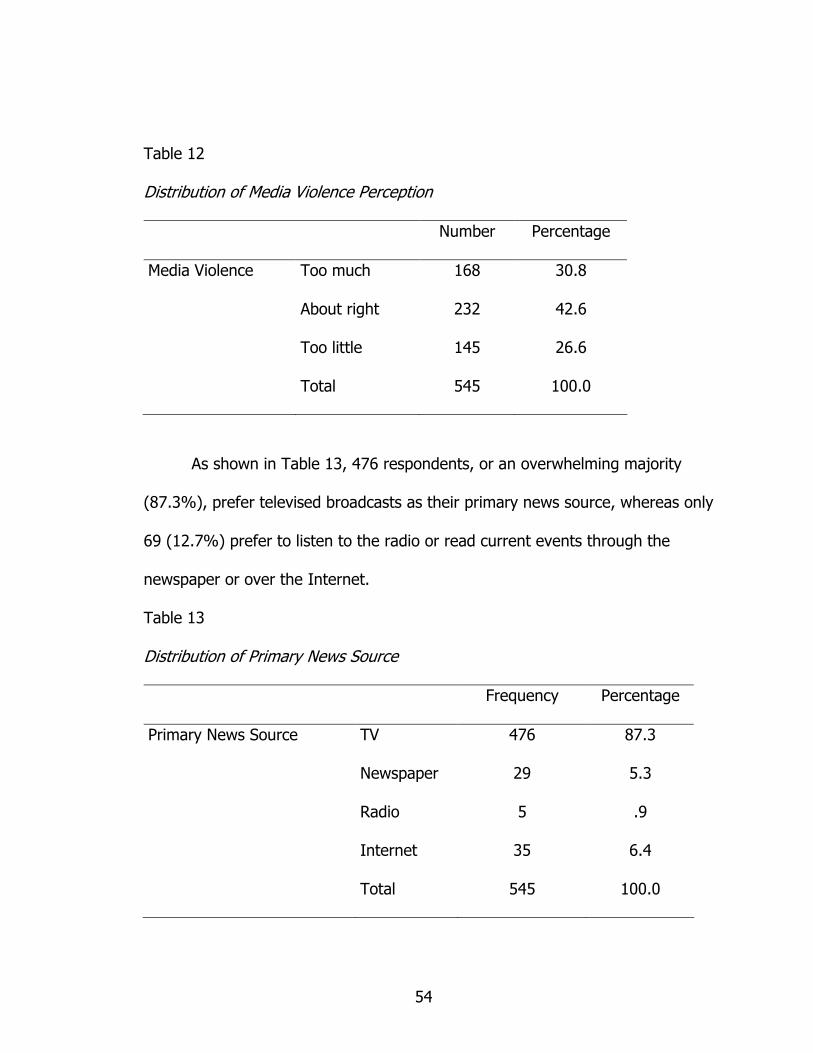
As presented in Table 12, when respondents were asked to describe their
perceptions of the media, 168 (30.8%) believed that too much attention is
directed towards violence, and 145 (26.6%) were of the opinion that the media
pays too little attention to violence. On the other hand, a majority (232), or
nearly one-half (42.6%) of the respondents, agreed that appropriate media
attention is dedicated to violence.
54
Table 12
Distribution of Media Violence Perception
Number Percentage
Media Violence Too much 168 30.8
About right 232 42.6
Too little 145 26.6
Total 545 100.0
As shown in Table 13, 476 respondents, or an overwhelming majority
(87.3%), prefer televised broadcasts as their primary news source, whereas only
69 (12.7%) prefer to listen to the radio or read current events through the
newspaper or over the Internet.
Table 13
Distribution of Primary News Source
Frequency Percentage
Primary News Source TV 476 87.3
Newspaper 29 5.3
Radio 5 .9
Internet 35 6.4
Total 545 100.0
55
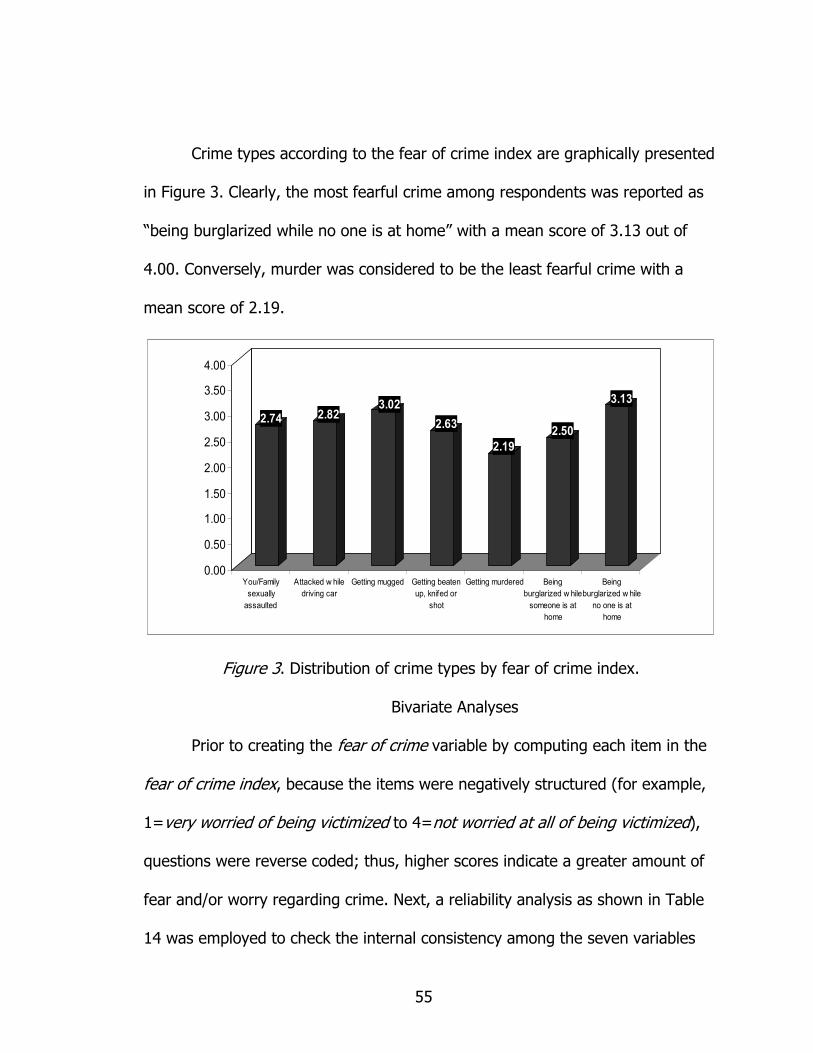
Crime types according to the fear of crime index are graphically presented
in Figure 3. Clearly, the most fearful crime among respondents was reported as
“being burglarized while no one is at home” with a mean score of 3.13 out of
4.00. Conversely, murder was considered to be the least fearful crime with a
mean score of 2.19.
2.74 2.823.02
2.63
2.19
2.50
3.13
0.00
0.50
1.00
1.50
2.00
2.50
3.00
3.50
4.00
You/Family
sexually
assaulted
Attacked w hile
driving car
Getting mugged Getting beaten
up, knifed or
shot
Getting murdered Being
burglarized w hile
someone is at
home
Being
burglarized w hile
no one is at
home
Figure 3. Distribution of crime types by fear of crime index.
Bivariate Analyses
Prior to creating the fear of crime variable by computing each item in the
fear of crime index, because the items were negatively structured (for example,
1=very worried of being victimized to 4=not worried at all of being victimized),
questions were reverse coded; thus, higher scores indicate a greater amount of
fear and/or worry regarding crime. Next, a reliability analysis as shown in Table
14 was employed to check the internal consistency among the seven variables
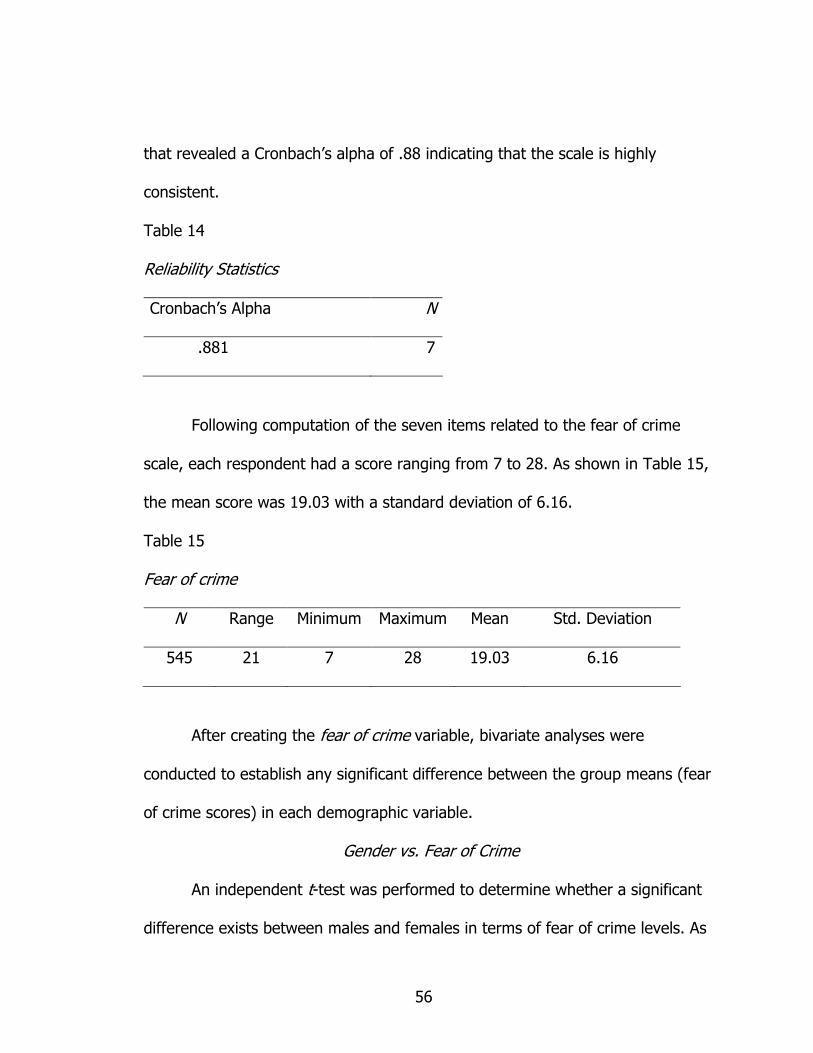
56
that revealed a Cronbach’s alpha of .88 indicating that the scale is highly
consistent.
Table 14
Reliability Statistics
Cronbach’s Alpha N
.881 7
Following computation of the seven items related to the fear of crime
scale, each respondent had a score ranging from 7 to 28. As shown in Table 15,
the mean score was 19.03 with a standard deviation of 6.16.
Table 15
Fear of crime
N Range Minimum Maximum Mean Std. Deviation
545 21 7 28 19.03 6.16
After creating the fear of crime variable, bivariate analyses were
conducted to establish any significant difference between the group means (fear
of crime scores) in each demographic variable.
Gender vs. Fear of Crime
An independent t-test was performed to determine whether a significant
difference exists between males and females in terms of fear of crime levels. As
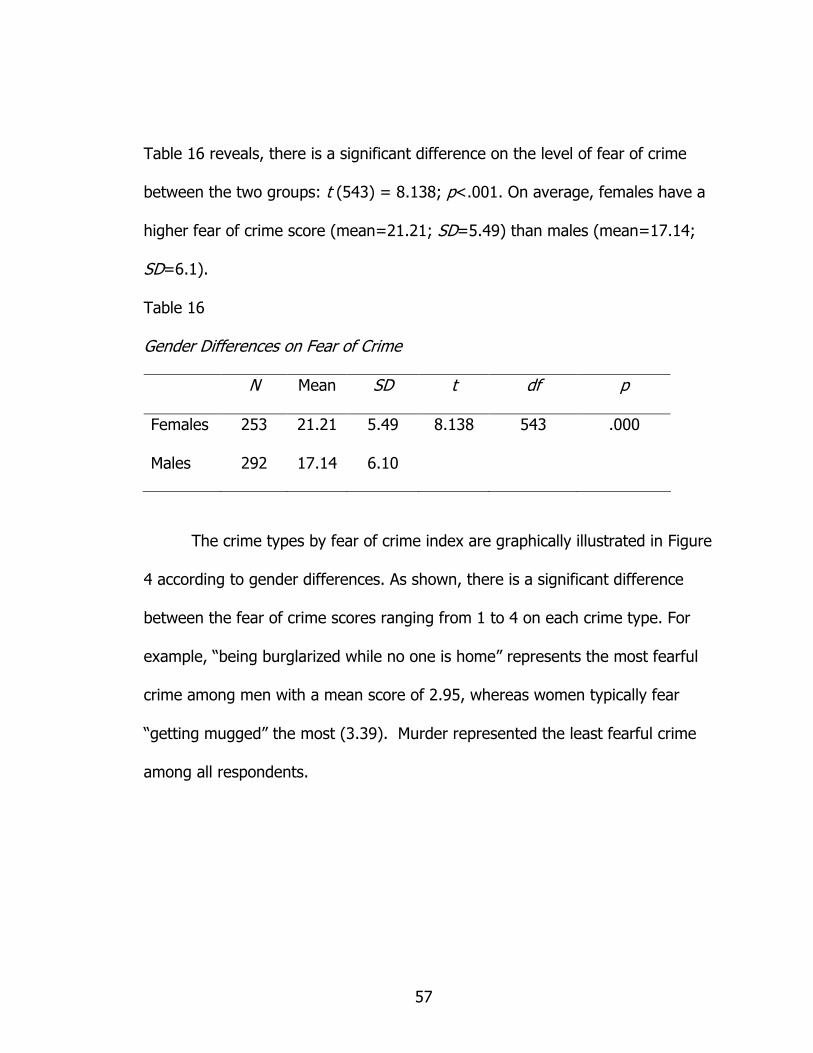
57
Table 16 reveals, there is a significant difference on the level of fear of crime
between the two groups: t (543) = 8.138; p<.001. On average, females have a
higher fear of crime score (mean=21.21; SD=5.49) than males (mean=17.14;
SD=6.1).
Table 16
Gender Differences on Fear of Crime
N Mean SD t df p
Females 253 21.21 5.49 8.138 543 .000
Males 292 17.14 6.10
The crime types by fear of crime index are graphically illustrated in Figure
4 according to gender differences. As shown, there is a significant difference
between the fear of crime scores ranging from 1 to 4 on each crime type. For
example, “being burglarized while no one is home” represents the most fearful
crime among men with a mean score of 2.95, whereas women typically fear
“getting mugged” the most (3.39). Murder represented the least fearful crime
among all respondents.
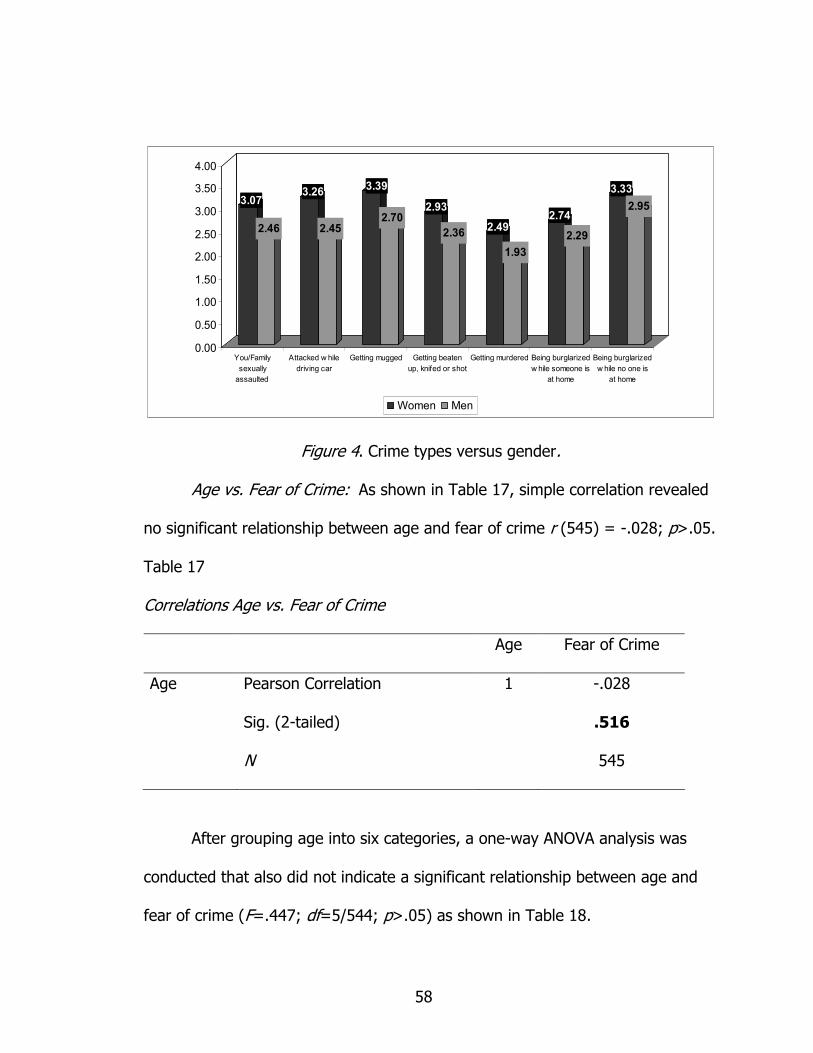
58
3.07
2.46
3.26
2.45
3.39
2.70
2.93
2.362.49
1.93
2.74
2.29
3.33
2.95
0.00
0.50
1.00
1.50
2.00
2.50
3.00
3.50
4.00
You/Family
sexually
assaulted
Attacked w hile
driving car
Getting mugged Getting beaten
up, knifed or shot
Getting murdered Being burglarized
w hile someone is
at home
Being burglarized
w hile no one is
at home
Women Men
Figure 4. Crime types versus gender.
Age vs. Fear of Crime: As shown in Table 17, simple correlation revealed
no significant relationship between age and fear of crime r (545) = -.028; p>.05.
Table 17
Correlations Age vs. Fear of Crime
Age Fear of Crime
Age Pearson Correlation 1 -.028
Sig. (2-tailed) .516
N 545
After grouping age into six categories, a one-way ANOVA analysis was
conducted that also did not indicate a significant relationship between age and
fear of crime (F=.447; df=5/544; p>.05) as shown in Table 18.
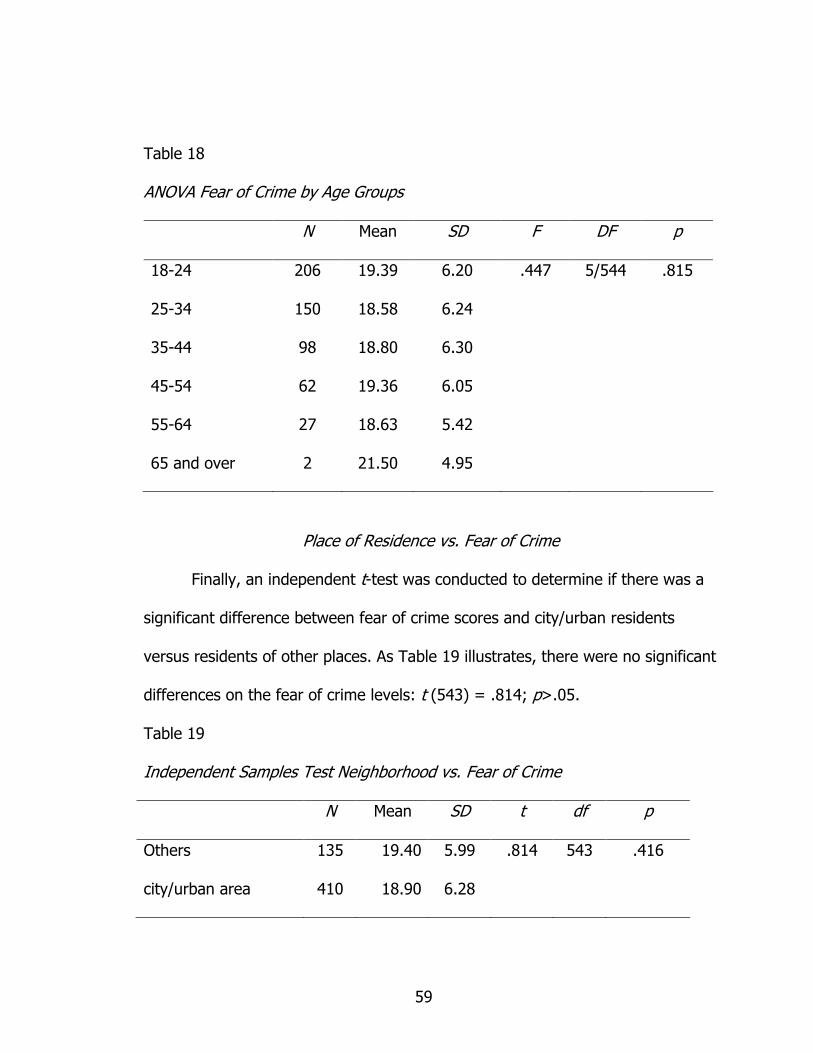
59
Table 18
ANOVA Fear of Crime by Age Groups
N Mean SD F DF p
18-24 206 19.39 6.20 .447 5/544 .815
25-34 150 18.58 6.24
35-44 98 18.80 6.30
45-54 62 19.36 6.05
55-64 27 18.63 5.42
65 and over 2 21.50 4.95
Place of Residence vs. Fear of Crime
Finally, an independent t-test was conducted to determine if there was a
significant difference between fear of crime scores and city/urban residents
versus residents of other places. As Table 19 illustrates, there were no significant
differences on the fear of crime levels: t (543) = .814; p>.05.
Table 19
Independent Samples Test Neighborhood vs. Fear of Crime
N Mean SD t df p
Others 135 19.40 5.99 .814 543 .416
city/urban area 410 18.90 6.28

60
Educational Level vs. Fear of Crime
Similarly, a one-way ANOVA analysis as shown in Table 20 did not indicate
a significant relationship between fear of crime and educational levels (F=.331;
df=4/544; p>.05).
Table 20
ANOVA Fear of Crime and Levels of Education
N Mean SD t df p
up to elm. school 118 19.11 6.55 .331 4/544 .857
middle school 99 19.47 5.75
high school 253 18.76 6.27
college degree 72 19.14 5.74
graduate degree 3 21.00 6.08
Monthly Income vs. Fear of Crime
As Table 21 reveals, there was no significant relationship between
monthly income and fear of crime as indicated by one-way ANOVA (F=2.435;
df=5/544; p>.05).
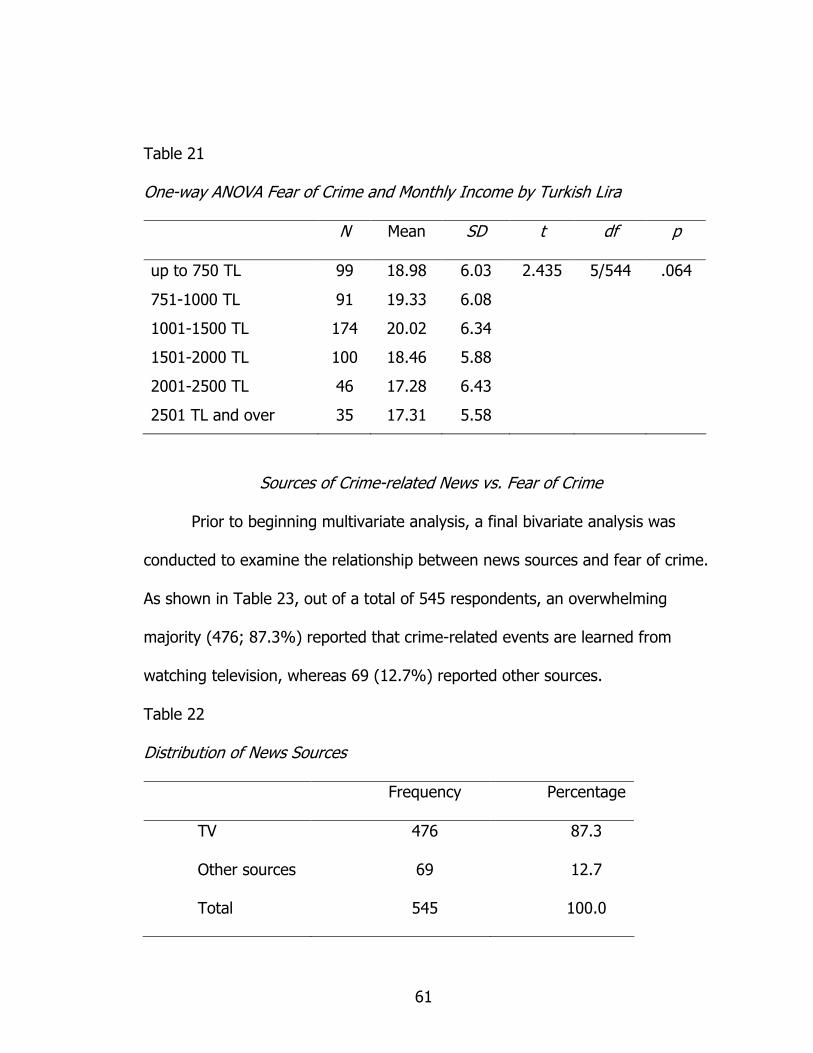
61
Table 21
One-way ANOVA Fear of Crime and Monthly Income by Turkish Lira
N Mean SD t df p
up to 750 TL 99 18.98 6.03 2.435 5/544 .064
751-1000 TL 91 19.33 6.08
1001-1500 TL 174 20.02 6.34
1501-2000 TL 100 18.46 5.88
2001-2500 TL 46 17.28 6.43
2501 TL and over 35 17.31 5.58
Sources of Crime-related News vs. Fear of Crime
Prior to beginning multivariate analysis, a final bivariate analysis was
conducted to examine the relationship between news sources and fear of crime.
As shown in Table 23, out of a total of 545 respondents, an overwhelming
majority (476; 87.3%) reported that crime-related events are learned from
watching television, whereas 69 (12.7%) reported other sources.
Table 22
Distribution of News Sources
Frequency Percentage
TV 476 87.3
Other sources 69 12.7
Total 545 100.0
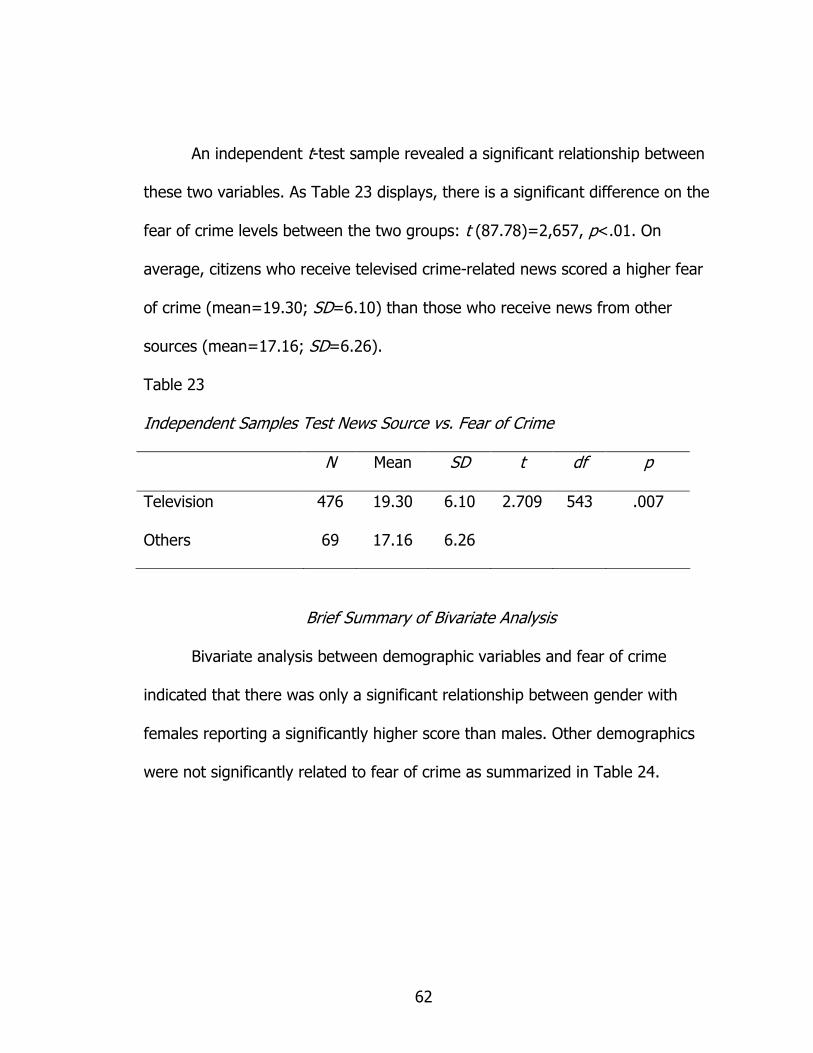
62
An independent t-test sample revealed a significant relationship between
these two variables. As Table 23 displays, there is a significant difference on the
fear of crime levels between the two groups: t (87.78)=2,657, p<.01. On
average, citizens who receive televised crime-related news scored a higher fear
of crime (mean=19.30; SD=6.10) than those who receive news from other
sources (mean=17.16; SD=6.26).
Table 23
Independent Samples Test News Source vs. Fear of Crime
N Mean SD t df p
Television 476 19.30 6.10 2.709 543 .007
Others 69 17.16 6.26
Brief Summary of Bivariate Analysis
Bivariate analysis between demographic variables and fear of crime
indicated that there was only a significant relationship between gender with
females reporting a significantly higher score than males. Other demographics
were not significantly related to fear of crime as summarized in Table 24.
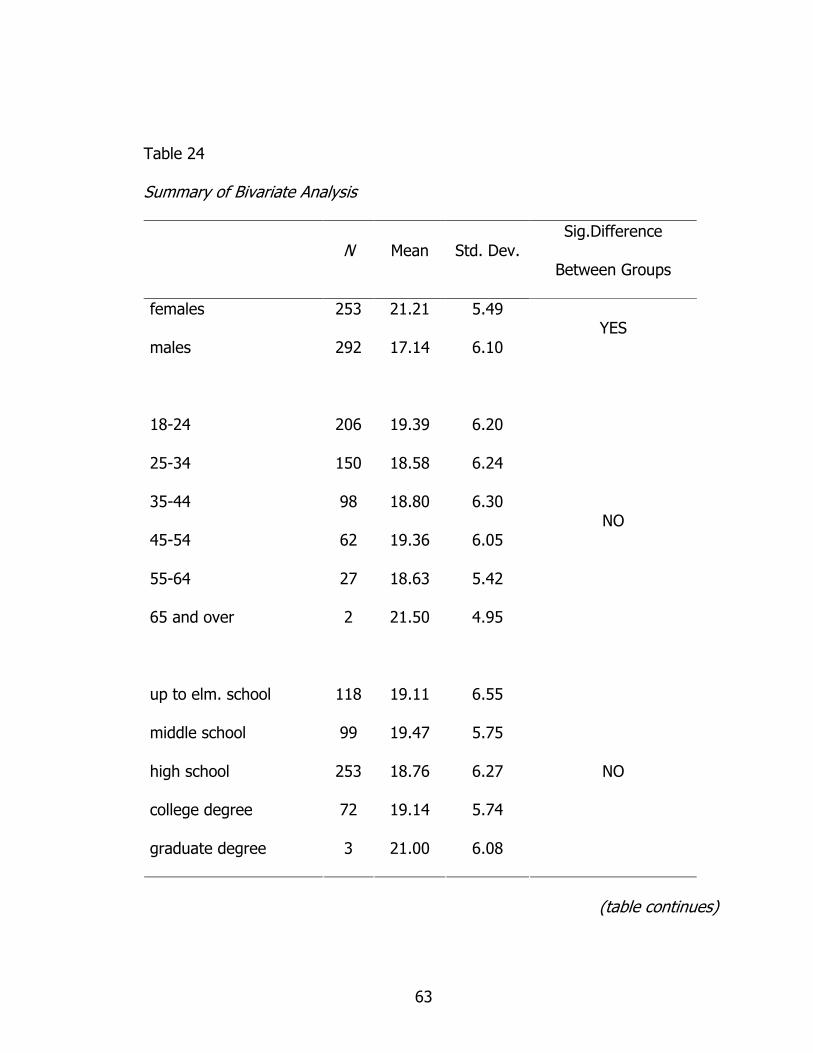
63
Table 24
Summary of Bivariate Analysis
N Mean Std. Dev. Sig.Difference
Between Groups
females 253 21.21 5.49
males 292 17.14 6.10 YES
18-24 206 19.39 6.20
25-34 150 18.58 6.24
35-44 98 18.80 6.30
45-54 62 19.36 6.05
55-64 27 18.63 5.42
65 and over 2 21.50 4.95
NO
up to elm. school 118 19.11 6.55
middle school 99 19.47 5.75
high school 253 18.76 6.27
college degree 72 19.14 5.74
graduate degree 3 21.00 6.08
NO
(table continues)
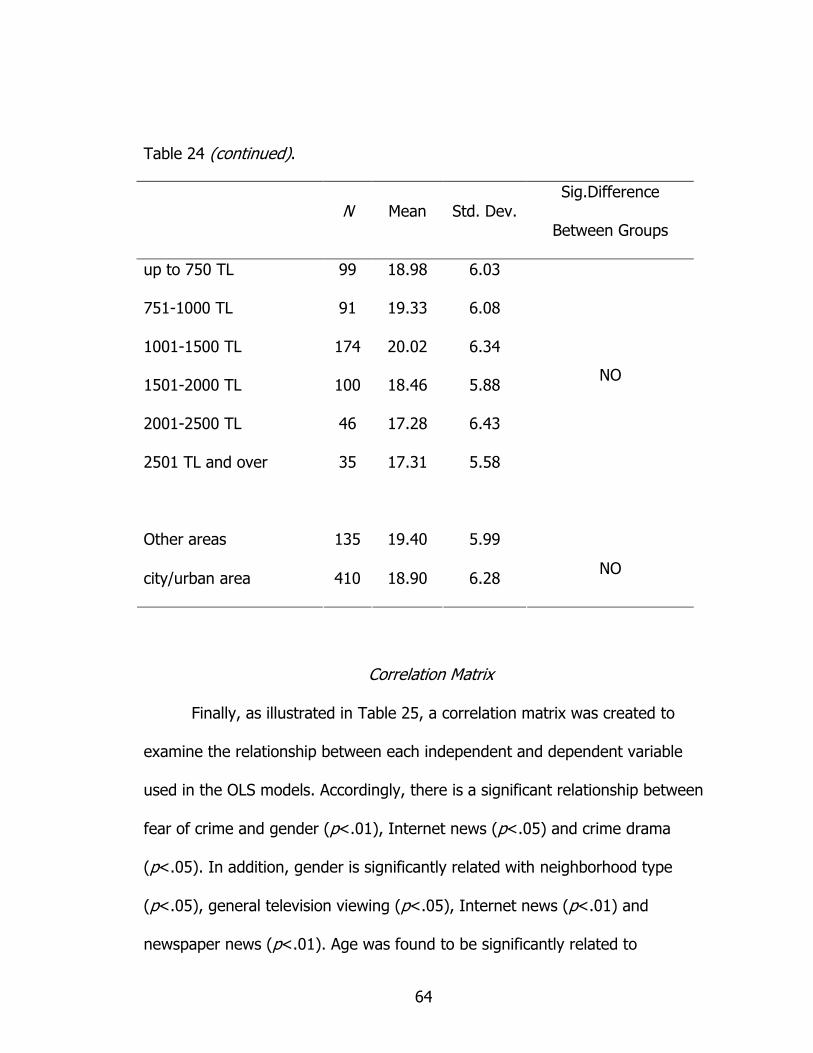
64
Table 24 (continued).
N Mean Std. Dev. Sig.Difference
Between Groups
up to 750 TL 99 18.98 6.03
751-1000 TL 91 19.33 6.08
1001-1500 TL 174 20.02 6.34
1501-2000 TL 100 18.46 5.88
2001-2500 TL 46 17.28 6.43
2501 TL and over 35 17.31 5.58
NO
Other areas 135 19.40 5.99
city/urban area 410 18.90 6.28 NO
Correlation Matrix
Finally, as illustrated in Table 25, a correlation matrix was created to
examine the relationship between each independent and dependent variable
used in the OLS models. Accordingly, there is a significant relationship between
fear of crime and gender (p<.01), Internet news (p<.05) and crime drama
(p<.05). In addition, gender is significantly related with neighborhood type
(p<.05), general television viewing (p<.05), Internet news (p<.01) and
newspaper news (p<.01). Age was found to be significantly related to
65
educational level (p<.01), neighborhood (p<.01) and, with the exception of
newspapers, all media variables (p<.01), whereas educational level is
significantly correlated to monthly income (p<.01), neighborhood (p<.01),
general television viewing (p<.01), Internet news (p<.01), and televised news
events (p<.05). Further, income is significantly correlated with neighborhood
(p<.01), newspaper and Internet news (p<.01), while neighborhood type is
significantly correlated with Internet news (p<.05). General television viewing is
significantly correlated with both televised news (p<.01) and Internet news
(p<.01). Finally, watching televised news is significantly correlated with reading
newspaper news (p<.01) and, similarly, reading newspaper news is significantly
correlated with reading news over the Internet (p<.01).
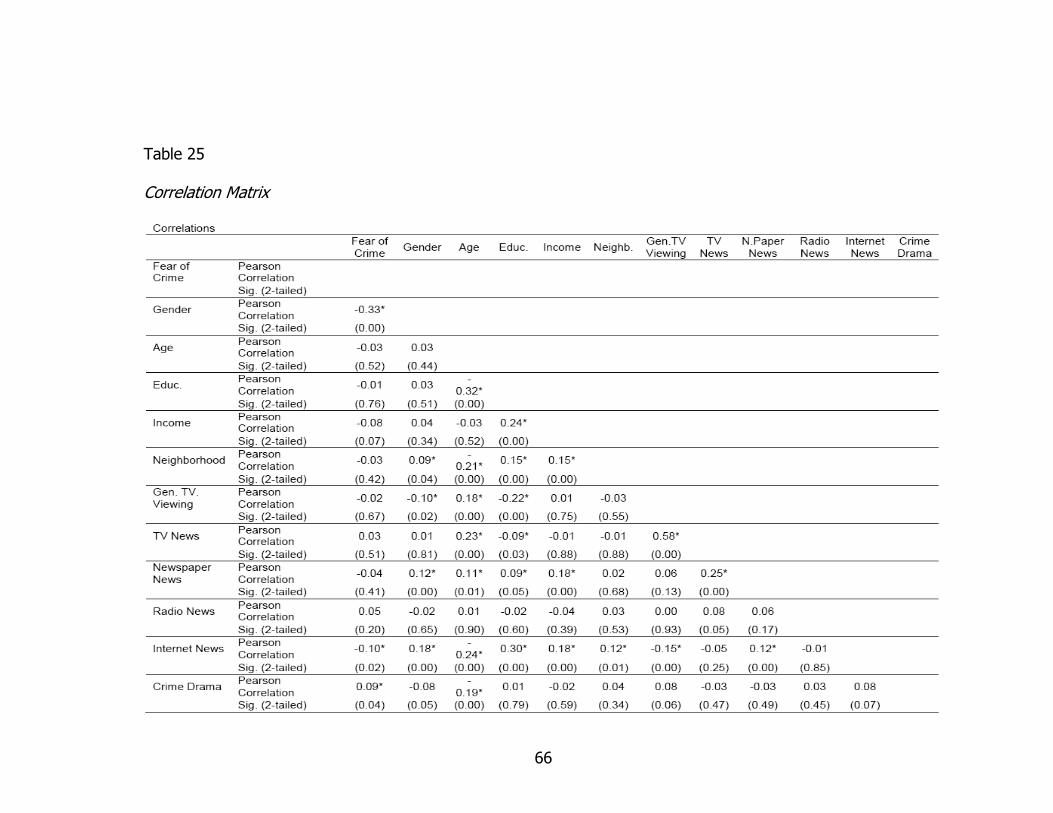
66
Table 25
Correlation Matrix
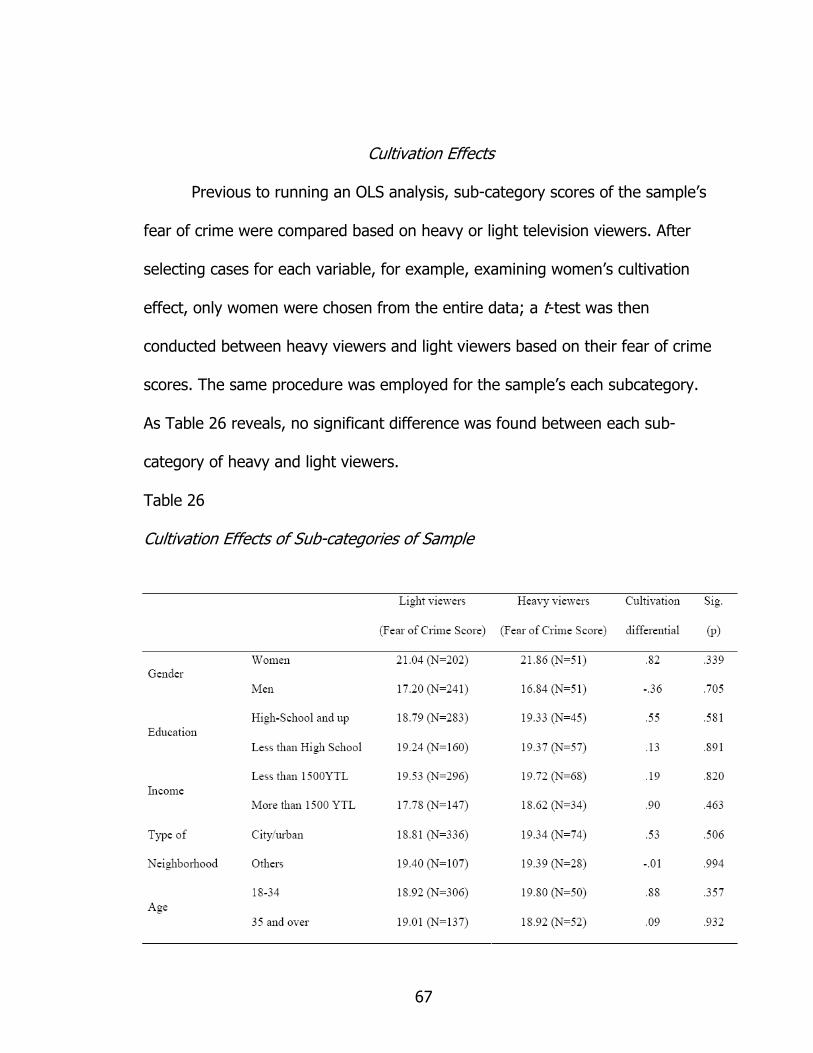
67
Cultivation Effects
Previous to running an OLS analysis, sub-category scores of the sample’s
fear of crime were compared based on heavy or light television viewers. After
selecting cases for each variable, for example, examining women’s cultivation
effect, only women were chosen from the entire data; a t-test was then
conducted between heavy viewers and light viewers based on their fear of crime
scores. The same procedure was employed for the sample’s each subcategory.
As Table 26 reveals, no significant difference was found between each sub-
category of heavy and light viewers.
Table 26
Cultivation Effects of Sub-categories of Sample
68
Multivariate Analyses
Standard multiple regression analysis (OLS) was conducted to determine
the accuracy of eleven independent variables (IV’s) that predict citizens’ fear of
crime levels. The purpose of multiple regression is to mode or group variables
that best predict the dependent variable (DV), fear of crime. The procedure
examined the significance of each IV as well as the entire model that contributed
to predicting the DV. Thus, the research hypotheses were tested.
Dependent Variable
Fear of crime, a continuous-metric variable was created by using the fear
of crime scale.
Independent Variables
1. Gender was included in the analysis as a dichotomous variable with
0=female and 1=male).
2. Age was included in the analysis as a continuous-metric variable.
3. Although level of education represents an ordinal variable, it was
included in the regression due to a sequential increase between intervals.
4. Although an ordinal variable, monthly income was also included in the
regression due to a sequential increase between intervals.
5. Place of residence is a dichotomous variable with 0=others and
1=city/urban residents.
69
6. Time spent for general television viewing was included in the analysis
as a dichotomous variable with 0=light viewers and 1=heavy viewers.
7. Time spent watching televised news was included in the regression due
to a sequential increase between intervals.
8. Time spent reading the newspaper was included in the regression due
to a sequential increase between intervals.
9. Time spent listening to radio news was included in the regression due
to a sequential increase between intervals.
10. Time spent gathering news over the Internet was included in the
regression due to a sequential increase between intervals.
11. Watching crime dramas was included in the regression due to a
sequential increase between intervals.
Prior to conducting multiple regressions, the data were screened for
outliers that were identified by calculating Mahalanobis distance in a preliminary
regression procedure. An exploration was then conducted on the newly
generated Mahalanobis variable to determine which cases exceeded the chi-
square criteria. Using a chi-square table, the critical value was set at p<.001 with
df=11, or 37.697. Five cases exceeded this critical value; they were deleted from
the analysis.
Assumptions of normality, linearity and homoscedasticity should be tested
as assumptions of multiple regressions. The routine approach involves analysis of
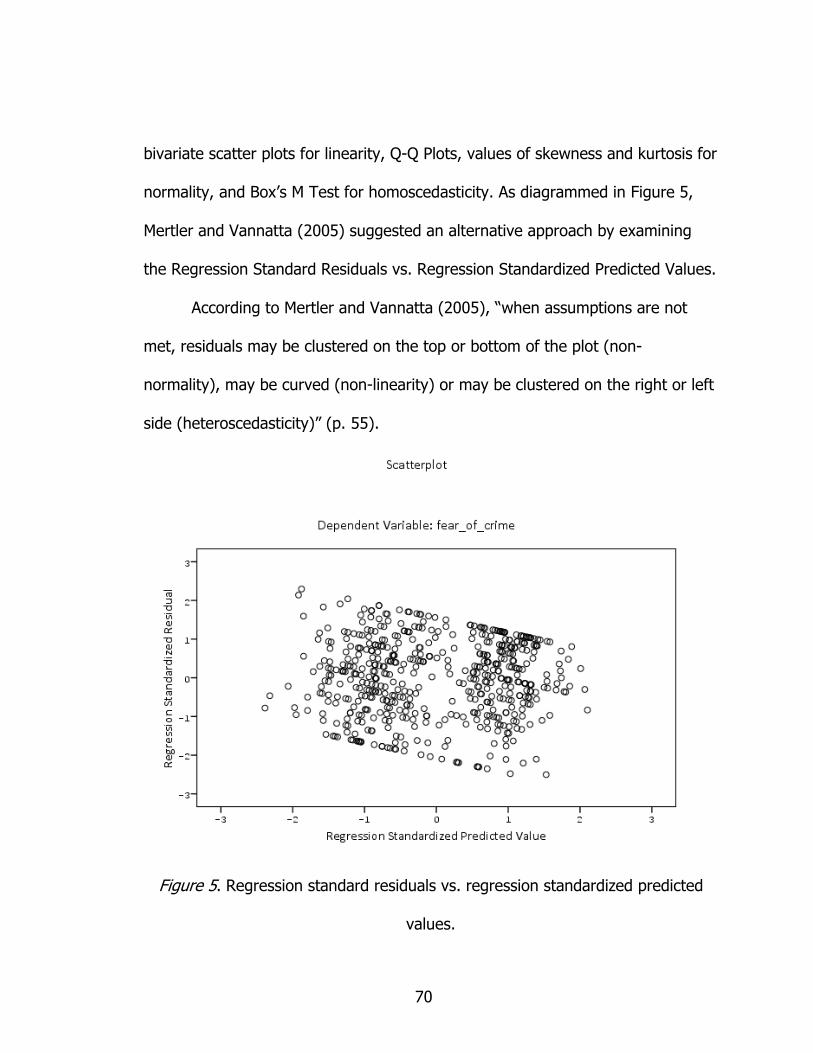
70
bivariate scatter plots for linearity, Q-Q Plots, values of skewness and kurtosis for
normality, and Box’s M Test for homoscedasticity. As diagrammed in Figure 5,
Mertler and Vannatta (2005) suggested an alternative approach by examining
the Regression Standard Residuals vs. Regression Standardized Predicted Values.
According to Mertler and Vannatta (2005), “when assumptions are not
met, residuals may be clustered on the top or bottom of the plot (non-
normality), may be curved (non-linearity) or may be clustered on the right or left
side (heteroscedasticity)” (p. 55).
Figure 5. Regression standard residuals vs. regression standardized predicted
values.
71
Referring to Figure 5, the values are fairly spread by creating a
rectangular shape concentrated in the center that is acceptable. Thus, normality,
linearity and homoscedasticity are assumed to be met for the analyses. Review
of the tolerance statistics and variance inflation factor (VIF) in the coefficients
table indicates that there is no problem of multicolleniarity since all tolerance
statistics are greater than .1 and VIF values equal less than ten.
After handling all assumptions, multiple regressions (OLS) were conducted
by creating two models. The first examines the relationship between the media
variables and fear of crime. In the second model, socio-demographic variables
are introduced to the first model to control for media variables. Both the model
and ANOVA summaries indicated that the model containing six independent
media variables significantly predict citizens’ fear of crime levels, although weak,
R2=.024, R2adj=.013, F (6, 544) = 2.171, p<.05. As indicated by R2, the amount
of variance in the dependent variable accounted for by media variables is 2.4%.
In other words, this model accounted for only 2.4% of variance in citizens’ fear
of crime levels.
Regression coefficients presented in Table 27 reveal that only two
variables significantly contributed to the model− amount of time consumed for
reading news over the Internet and number of crime dramas watched. The
amount of time consumed for reading news over the Internet is negatively
related with fear of crime [B =-.526 (t = -2.425) p< .05], and the number of
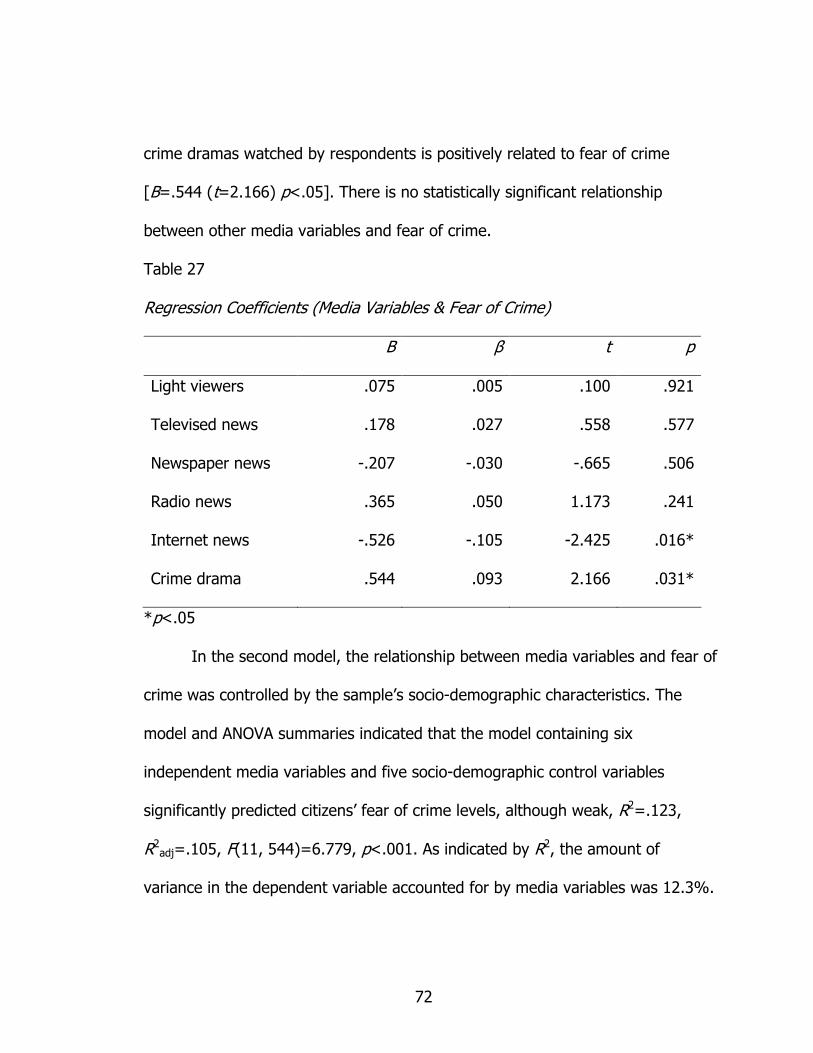
72
crime dramas watched by respondents is positively related to fear of crime
[B=.544 (t=2.166) p<.05]. There is no statistically significant relationship
between other media variables and fear of crime.
Table 27
Regression Coefficients (Media Variables & Fear of Crime)
B β t p
Light viewers .075 .005 .100 .921
Televised news .178 .027 .558 .577
Newspaper news -.207 -.030 -.665 .506
Radio news .365 .050 1.173 .241
Internet news -.526 -.105 -2.425 .016*
Crime drama .544 .093 2.166 .031*
*p<.05
In the second model, the relationship between media variables and fear of
crime was controlled by the sample’s socio-demographic characteristics. The
model and ANOVA summaries indicated that the model containing six
independent media variables and five socio-demographic control variables
significantly predicted citizens’ fear of crime levels, although weak, R2=.123,
R2adj=.105, F(11, 544)=6.779, p<.001. As indicated by R2, the amount of
variance in the dependent variable accounted for by media variables was 12.3%.
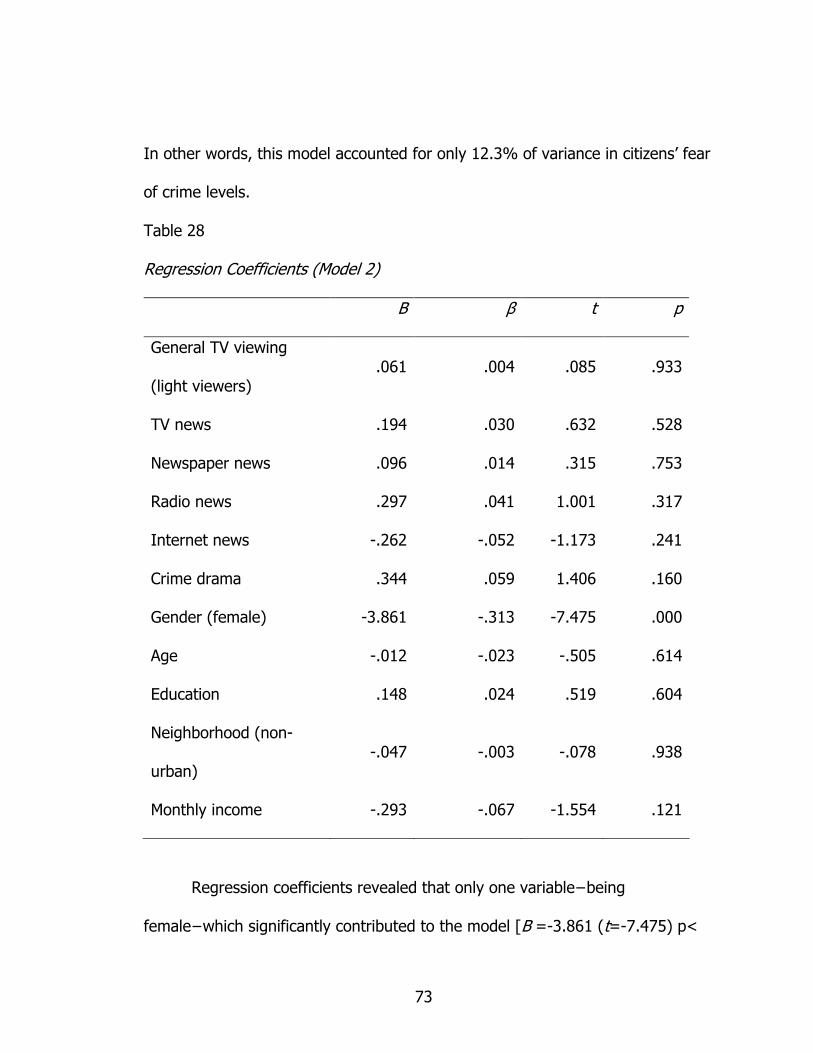
73
In other words, this model accounted for only 12.3% of variance in citizens’ fear
of crime levels.
Table 28
Regression Coefficients (Model 2)
B β t p
General TV viewing
(light viewers) .061 .004 .085 .933
TV news .194 .030 .632 .528
Newspaper news .096 .014 .315 .753
Radio news .297 .041 1.001 .317
Internet news -.262 -.052 -1.173 .241
Crime drama .344 .059 1.406 .160
Gender (female) -3.861 -.313 -7.475 .000
Age -.012 -.023 -.505 .614
Education .148 .024 .519 .604
Neighborhood (non-
urban) -.047 -.003 -.078 .938
Monthly income -.293 -.067 -1.554 .121
Regression coefficients revealed that only one variable−being
female−which significantly contributed to the model [B =-3.861 (t=-7.475) p<
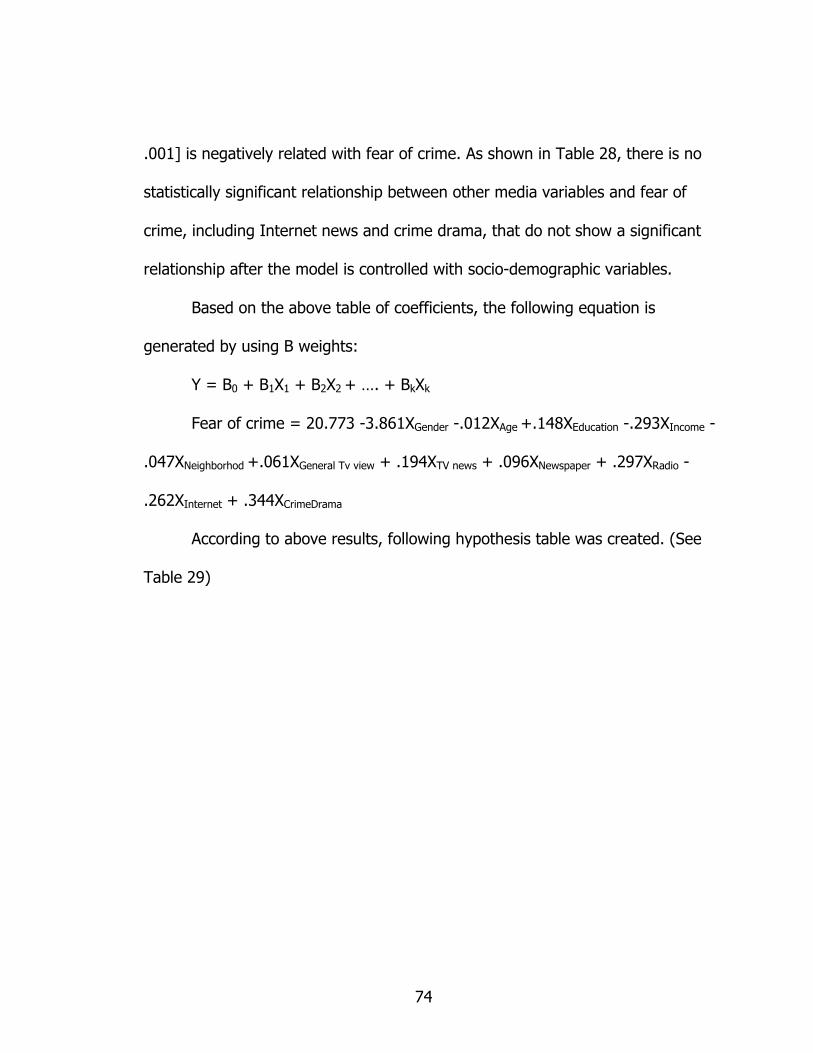
74
.001] is negatively related with fear of crime. As shown in Table 28, there is no
statistically significant relationship between other media variables and fear of
crime, including Internet news and crime drama, that do not show a significant
relationship after the model is controlled with socio-demographic variables.
Based on the above table of coefficients, the following equation is
generated by using B weights:
Y = B0 + B1X1 + B2X2 + …. + BkXk
Fear of crime = 20.773 -3.861XGender -.012XAge +.148XEducation -.293XIncome -
.047XNeighborhod +.061XGeneral Tv view + .194XTV news + .096XNewspaper + .297XRadio -
.262XInternet + .344XCrimeDrama
According to above results, following hypothesis table was created. (See
Table 29)
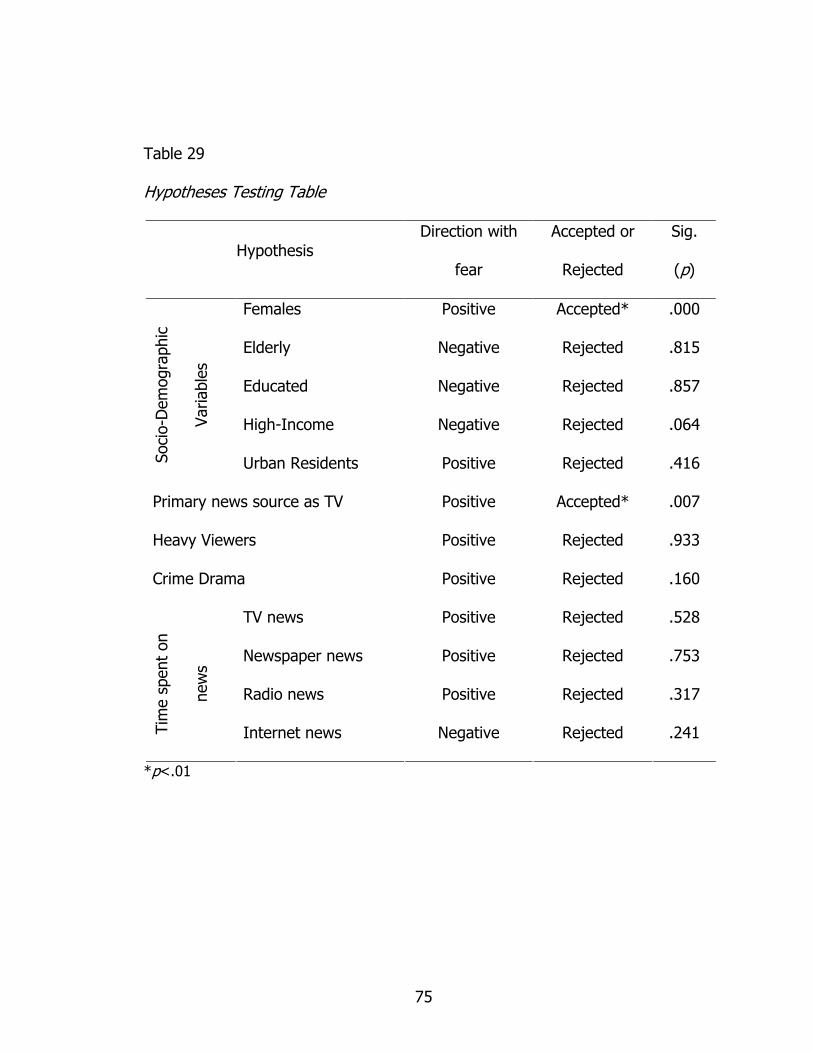
75
Table 29
Hypotheses Testing Table
Hypothesis Direction with
fear
Accepted or
Rejected
Sig.
(p)
Females Positive Accepted* .000
Elderly Negative Rejected .815
Educated Negative Rejected .857
High-Income Negative Rejected .064
Soci
o-D
emog
raph
ic
Var
iabl
es
Urban Residents Positive Rejected .416
Primary news source as TV Positive Accepted* .007
Heavy Viewers Positive Rejected .933
Crime Drama Positive Rejected .160
TV news Positive Rejected .528
Newspaper news Positive Rejected .753
Radio news Positive Rejected .317
Tim
e sp
ent
on
new
s
Internet news Negative Rejected .241
*p<.01
76
CHAPTER V
DISCUSSION AND CONCLUSION
This study examined the media effects on fear of crime experienced by
respondents in Istanbul, Turkey. Analyses were conducted to determine the
demographic characteristics that influence the likelihood of reporting fear of
crime. A countywide household sample was extracted from the total population
of Istanbul by employing a stratified multi-stage cluster sampling technique.
To answer the primary research question, “What is the relationship
between media consumption and fear of crime in Istanbul, the largest city in
Turkey?” eleven hypotheses were created based on current and previous
literature, and each was tested step-by step.
A fear of crime index was created by using the most common crimes
against individuals and property that were taken from a previous survey and
partially replicated. Among the crime types, respondents indicated that they are
most fearful of a burglary occurring while no one is home. The reason for this
fear factor might possibly be explained by Turkey’s increasing number of crimes
committed towards individuals and properties each year as exemplified by one
house per every six minutes was burglarized during 2006 alone. On the other
hand, murder was found to be the least fearful crime among respondents that
may be partially due to Turkey’s gun control policy that strictly prohibits the
77
carrying or possession of firearms except under certain circumstances.
Surprisingly, muggings rather than sexual assaults were the most fearful crime
among women. Although women were expected to be the most fearful of sexual
assaults, these crimes ranked number four among the seven crime types. On the
other hand, because women generally carry handbags, added to the practical
impossibility for a woman to apprehend a thief, muggings are easier to
accomplish when compared with men.
In terms of Turkey’s media consumption trends, a majority of the citizens
reported that they watch one to four hours of television on an average day.
Although most respondents use television as a media news source, other
resources, though available, are less common. Individuals getting news from TV
significantly report higher fear of crime scores than those getting news from
other sources. This can be explained by analyzing Information seeking behavior
of individuals under Information Sciences. Dervin and Nilan (1986) claimed that
users’ behaviors are not always an outcome involving a simple rational
calculation, or individuals do not always choose the optimal information sources.
Since TV is much more available as a news source to the individuals and it does
not require any kind of skills to retrieve the information, it is more common
among respondents. Thus, individuals watching TV news report more fear than
those getting news from other sources.

78
Socio-demographic Variables and Fear of Crime
Regarding the independent effects of socio-demographic variables on fear
of crime, the findings were consistent with previous literature to a certain
degree. Only gender was found to be significantly related with fear thereby
supporting the research hypothesis. In addition, consistent with previous
research findings (Chiricos et al., 2000; Dowler, 2003; Ferraro, 1995; Lee, 2007;
Warr, 1984), women are more likely to report fear of crime than men which is
thought to be explained based on their assumed physical weakness and
defenselessness.
Although the direction of the hypotheses related to other demographic
variables was supported, the findings were not statistically significant. For
example, according to previous researchers (Evans, 1995; Ferraro, 1995; Moore
& Spherd, 2007), elderly citizens were hypothesized to be less likely to report
fear. Although findings indicated a negative correlation between age and fear,
the relationship was not statistically supported. Despite that respondents’ ages
were grouped under six categories, a t-test did not reveal any significant
difference between age groups.
Type of neighborhood was another fear of crime indicator used as a
demographic variable. While citizens residing in urban areas and cities were
expected to be more likely to report fear of crime, this hypothesis was also
rejected. Moreover, citizens living in urban areas reported less fear than others
79
that can perhaps be explained due to factors including low crime rates in non-
urban environments or type of buildings in which citizens reside. For example, in
urban Turkish areas, citizens generally choose to live in an apartment whereas
non-urban residents typically live in houses. Thus, for a criminal to escape from a
non-urban environment is more difficult compared to crowded places which
might be another factor accounting for less fear of crime.
Additionally, the findings did not support the hypothesis related to
socioeconomic variables and fear of crime. Based on the literature, a reverse
correlation was expected; however, there was not a significant positive
relationship between either education or monthly income and fear of crime.
Although education was grouped under five categories, a t-test did not reveal a
significant difference between groups, and when the same t-test was conducted
to determine the difference between groups in relation to six monthly income
levels, the findings also did not reveal a significant difference for socio-economic
subgroups. Therefore, findings regarding socioeconomic variables and fear of
crime were consistent with previous research (Baumer, 1978; Clemente &
Kleinman, 1977). Given that higher incomes can be advantageous in improved
protection that may lead to less fear of crime, individuals earning higher incomes
may also be more prone to experience property crimes. On the other hand,
because criminals are typically aware of an individual’s income status when they
plan a home burglary, if a person has no valuable possessions, the threat of
80
being burglarized is not a concern which might, perhaps, explain the differences
between low fear of crime among the lesser economically privileged.
Cultivation Effects
As discussed in Chapter II, cultivation analysis begins with simple cross-
tabulations between an individual’s televised media consumption characterized
by heavy and light viewers with the percentage difference between two groups
labeled as “cultivation differential.” In this research, after the subgroups
consisting of females, males, lower - high income individuals, urban citizens, and
non-urban citizens were categorized by heavy and light viewers; independent
sample t-tests were conducted to determine the mean difference between fear of
crime scores. Because the findings did not reveal any significant differences, one
can conclude that television per se does not cultivate fear in the city of Istanbul,
and the findings do not support Gerbner and Gross’ (1976) cultivation differential
on the population’s subgroups. However, because Gerbner et al.’s (1974, 1976,
1997) studies were conducted in the United States, the content of televised
programs would be different, and perhaps less violent, than in Turkey. As
another explanation, citizens residing in Istanbul would be less affected by the
“mean world syndrome,” an idea that depicts the world as a worse place than it
actually is in reality.
81
Media and Fear of Crime
The second part of the present research examined the media effects in
relation to fear of crime. After conducting OLS statistics pertaining to media
variables, the findings indicated that although some, namely Internet news
reading and televised crime drama viewing, were significantly related to fear of
crime, the model was not controlled by demographic variables. Nevertheless,
watching crime dramas and fear of crime were moderately consistent with the
literature (Dowler, 2003; Heath & Petraitis, 1987); however, this relationship
could be spurious without controlling for other variables.
Although time consumed in reading news events over the Internet was
found to be significantly related to fear of crime, as expected, the relation was
negative due to the basic abilities and skills required in accessing the Internet.
Because the technology is related to Turkey’s educational and income levels, the
expected negative hypothesized relationship might possibly be spurious since
only media variables were included in the first model.
Due to concerns regarding erroneous and interaction effects of other
variables, the model controlled for the sample’s socio-demographic
characteristics. According to Hirsch (1980) and Wober and Gunter (1982), the
cultivation effect disappears after demographic controls are simultaneously
introduced into the analyses. Further, the majority of research conducted on the
effects of media on fear of crime employed demographics to control the OLS
82
models (Chiricos et al., 1997; Ditton et al., 2004; Dowler, 2003; Gerbner &
Gross, 1976; Heath, 1984; Heath & Petraitis, 1987; Hirchs, 1980; Liska &
Baccaglini, 1990; Reith, 1999; Sparks & Ogles, 1990).
After controlling the OLS model with the sample’s socio-demographics, the
two significant relationships, crime drama viewing and Internet news,
disappeared. Out of six media variables and five control variables, only gender
was found to be significantly related to fear of crime.
Although not statistically significant, heavy television viewers were found
to be less likely to report fear in the city of Istanbul; thus, the hypothesis was
rejected. Although this is contradictory to Gerbner et al.’s (1994) cultivation
theory, Hirchs (1980) found the same negative relation. Therefore, individuals in
Turkey might be either less affected by television violence or positively affected.
In other words, television could possibly play a different role in Turkey in terms
of giving messages, or, accordingly, the public may learn ways to protect
themselves against watching televised crime dramas which, in turn, would lead
to less fear.
The findings also revealed no support for the hypotheses that the amount
of time consumed in watching crime news is positively related to fear. Although
findings indicated a positive relationship, they were not statistically significant.
Accordingly, while some scholars found televised news to be related to fear of
crime only at the local level (Chiricos et al., 1997, 2000; Romer et al., 2003),
83
others (Gross & Aday, 2006) did not find any relationship which could have
possibly been attributed to how the variable was operationalized. Because the
present research did not address local televised crime events due to the scarcity
of local television networks in Turkey, as a result, national crime news may not
affect the levels of fear of crime due to the isolated occurrence from the
respondents’ own neighborhoods. According to Heath and Petraitis (1987), the
immediate and non-immediate environments of crime have different effects on
citizens. If, for example, a crime is exposed through televised news that occurred
in a remote environment, citizens do not generally feel fear. Another factor might
be the portrayal of televised news reporting pertaining to citizens’ fear of crime.
For example, Chiricos et al. (2000) maintained that numerous people find media
news as irrelevant since the reports are typically far from their everyday
experiences. Similarly, Schudson (1989) pointed out that “the media report
spectacular crimes which people rarely encounter and the crimes reported rarely
take place in the neighborhoods where most of the media audience live” (pp.
168-169).
In addition, the findings regarding newspaper crime events and fear of
crime did not support the hypothesis stating that the duration of time spent
reading about accounts of crime positively affects citizens’ fear of crime in the
city of Istanbul. Although not statistically significant, the direction of this
relationship was positive and to some extent consistent with previous findings of
84
Chiricos et al. (1997) and Ditton et al. (2004) who were also unable to establish
a relationship between newspaper reporting of offenses and fear of crime. Like
television networks, local newspapers are also uncommon in Turkey and,
therefore, reading national crime news might have very little effect on citizens’
fear of crime. Heath’s (1984) findings supported this explanation by suggesting
that if the crime occurs near to an individual’s surroundings, the level of fear
increases.
In regard to crime events heard over the radio, the findings did not
support the hypothesis. Although not statistically significant, a positive relation
between radio news and fear of crime was found that can be explained by the
public’s perception of radio. In Turkey, people generally listen to music on their
automobile radios where a majority of the news broadcasts are not detailed but
very general in nature giving a limited portrayal of crime. Secondly, despite the
number of local radio broadcasts, people tend to prefer listening to national radio
stations, and even if they listen to crime news, the effect is limited due to the
non-immediate environment.
Although news accessed over the Internet was expected to be negatively
related to fear of crime, it was not statistically significant at any level; hence, the
hypothesis was rejected. Retrieving news from the Internet can be considered no
different as receiving current events from a newspaper or from television
because both are readily available through the Internet, and thus, a person is
85
less likely to purchase a newspaper. In the present research, consistent with the
Internet, televised as well as printed news was not found to be related with fear.
Finally, the findings did not reveal a significant relationship between
viewing crime dramas and fear of crime after controlling for socio-demographic
variables. Although the first model showed a significant relationship, it may be a
spurious one consistent with Doob and Macdonald (1979) and Reith (1999) due
to the content and portrayal of crime drama in Turkey. For example, with the
exception of murder, crime dramas do not depict the offenses that were used in
the fear of crime index in this research. Further, murder was found to be the
least fearful crime among both men and women in Istanbul.
Consistent with the literature, overall findings did not reveal a significant
relationship between media consumption and fear of crime in the city of
Istanbul, Turkey. Similarly, Gerbner et al.’s (1994) theory of cultivation was not
supported by a majority studies in the field. For example, after controlling the
media variables with independent factors consisting of namely the sample’s
demographic characteristics, prior victimization or official crime reports,
researchers failed to establish a relationship with fear of crime.
Limitations
The limitations pertaining to this research can be considered as typical of
public perception and victimization surveys depending on a respondent’s
personal experiences that might skew responses to survey inquiries. As Hagan
86
(2006) asserted, the possible weaknesses of victimization surveys including false
reporting, mistaken reporting, poor memory, telescoping, and over or under
reporting might be considered as another limitation.
Although every effort was taken in ensure increased generalizabilty of the
findings, sampling bias may have posed an issue. For instance, due to financial
constraints, the survey was carried out in Istanbul rather than the whole country
of Turkey; therefore, the outcomes were applicable only to a sample of Istanbul’s
population.
Another limitation pertained to the operationalization of media variables,
namely crime news watching. Determining the precise amount of time spent
watching crime news versus general news is not practical or possible since the
proportion differs according to the particular television station. Likewise, Internet
news reading is also problematic given that the technology allows users to read,
listen and watch any content at their own pace. Thus, respondents may have
been confused or mistaken when they were asked to report the time consumed
in reading crime events over the Internet.
Not controlling the sample for prior victimization is another possible
limitation. For example, if respondents had experienced previous encounters
involving crime, the fear factor would most likely be affected. On the other hand,
because the findings did not reveal any significant effect of media on fear of
crime, this limitation can be accepted.
87
Recommendations for Future Research
Studying the effects of media on fear of crime is a very new topical area
in Turkey, with this research representing the first. However, because the
population did not encompass a nationwide sample, to obtain more generalized
results, a countrywide household survey is recommended. In addition, the
Internet as a media variable should be analyzed by addressing every aspect of its
wide ranging possibilities. Although previous research has not focused
appropriate attention to the Internet as a media source, innovative developments
on rapid changing technology will, most probably, shift priorities in terms of
accessing information.
Finally, to improve the findings, future researchers are encouraged to
focus on only one primary media source and use open ended questions that
would be more effective in conducting an in-depth content analysis before
collecting data that will, in turn, increase the strength and validity of the survey
questions.
Closing Remarks
In the United States, the mass media, namely television, and its effects on
fear of crime has developed as an important area of research. Compared to other
countries, however, Turkey’s television history is relatively new. For example, its
first national channels did not exist until 1990. Consequently, nearly 20 years
later, a variety of televised choices are available for the Turkish people to watch
88
in the privacy of their own homes. Thus, as a vehicle for delivering information
and to entertain, implications have lead researchers to question whether the
media creates more harm than good concerning effects on the public’s fear of
crime. For example, one might turn on any evening news broadcast and be
overwhelmed with violence and stories of unsuspecting citizens victimized in their
own communities notwithstanding television shows with plots dedicated to the
depiction of criminal activities. Therefore, should Turkish citizens be fearful of
what the mass media conveys and be cautious of how events are presented?
With this question in mind, one may be lead to speculate if the portrayal of crime
in the mass media affects the public’s perception of safety and danger in Turkey.
Citizens’ fear of crime not only has an impact on the public at large but
may influence policy makers into initiating laws that affect crime control and
prevention. Thus, as one effort to create public awareness among Turkish
citizens, this research explored the effects of mass media on citizens’ fear of
crime in Istanbul and is unique in that there has been no previous effort to
research this specific area of concern in Turkey. Ultimately, the study will bring
more awareness to the effects that the media plays on fear of crime in Turkey as
well as create prevention measures to be seriously addressed in public schools,
civic organizations, and communities.

89
APPENDIX A
IRB APPROVAL FOR THE SURVEY
90

91
APPENDIX B
PERMISSIONS FOR THE SURVEY

92
93

94
REFERENCE LIST
Alreck, P. L., & Settle R. B. (2004). The survey research handbook. Boston:
McGraw-Hill/Irwin.
Ankara Ticaret Odasi (2007). Our crime record minute by minute. Retrieved
March 3, 2009, from http://www.atonet.org.tr/yeni/index.php?p=816&l=1
Baumer, T. L. (1978) Research on fear of crime in the United States. Victimology,
3, 254-264.
Bryant, J., & Zillmann, D. (Eds.) (1994). Media effects. Hillsdale, NJ: Erlbaum.
Cavender, G., & Fishman, M. (1998).Television reality crime programs: Context
and history. In M. Fishman and G. Cavendar (Eds.). Entertaining crime
(pp. 1-18). New York: Aldine De Gruyter.
Chiricos, T., Eschholz, S., & Gertz, M. (1997). Crime, news and fear of crime:
Toward an identification of audience effects. Social Problems, 44 (3), 342-
57.
Chiricos, T., Padgett, K., & Gertz, M. (2000). Fear, TV news, and the reality of
crime. Criminology, 38 (3), 755-785.
Clemente, F., & Kleinman, M. (1976). Fear of crime among the aged.
Gerontologist, 76, 207-210.
Clemente, F., & Kleinman, M. (1977). Fear of crime in the United States: A
multivariate analysis. Social Forces, 56, 519-531.
95
Comstock, G., Chaffee, S., Katzman, N., McCombs, M., & Roberts, D. (1978).
Television and human behavior. New York: Columbia University Press.
Covington, J. & Taylor, R.B. (1991). Fear of crime in urban residential
neighborhoods: Implications of between- and within-neighborhood
sources for current models, Sociological Quarterly, 32, 231–249.
Crowell, N. A., & Burgess, A. W. (Eds.) (1996). Understanding violence against
women. Washington DC: National Academy Press.
Dervin, B. and Nilan, M. (1986) Information needs and uses. Annual Review of
Information Science and Technology, 21, 3–33.
Directorate General of Press and Information (2008). Televizyonlar. Retrieved
November 3, 2008, from http://www.byegm.gov.tr/
Ditton, J., Chadee, D., Farrall, S., Gilchrist, E., & Bannister, J. (2004). From
imitation to intimidation: A note on the curious and changing relationship
between the media, crime and fear of crime. British Journal of
Criminology, 44 (4), 595-610.
Doob, A., & Macdonald, G. (1979, February). Television viewing and fear of
victimization: Is the relationship causal? Journal of Personality and Social
Psychology, 37 (2), 170-179.
Dowler, K. (2003), Media consumption and public attitudes toward crime and
justice: The relationship between fear of crime, punitive attitudes, and
96
perceived police effectiveness. Journal of Criminal Justice and Popular
Culture, 10 (2),109-126.
Evans, D. J. (1995). Crime and policing: Spatial approaches. England: Avebury.
Ferraro, K.F. (1995). Fear of crime: Interpreting victimization risk. Albany: State
University of New York Press
Flanagan, T., & Longmire, D. (1995). National opinion survey of crime and
justice. Huntsville, TX: Sam Houston State University Press.
Friedrichs, D. O. (2004). Trusted criminals: White collar crime in contemporary
society. Belmont, CA: Wadsworth Thomson Learning.
Gerbner, G., & Gross, L. (1976). Living with television: The violence profile.
Journal of Communication, 26, 76.
Gerbner, G., Gross, L., Eleey, M. F., Jackson-Beeck, M., Jefferies-Fox, S., &
Signorielli, N. (1977). TV violence profile no. 8: The highlights. Journal of
Communication, 27, 171-180.
Gerbner, G., Gross, L., Morgan, M., & Signorielli, N. (1994). Growing up with
television: The cultivation perspective. In J. Bryant and D. Zillmann (Eds.),
Media effects (pp. 17-41). Hillsdale, NJ: Erlbaum.
Hagan, F. E. (2006) Research methods in criminal justice and criminology.
Boston: Allyn and Bacon.
97
Heath, L. (1984, August). Impact of newspaper crime reports on fear of crime:
Multimethodological investigation. Journal of Personality and Social
Psychology, 47 (2), 263-276.
Heath, L., & Gilbert, K. (1996). Mass media and fear of crime. American
Behavioral Scientist, 39 (4), 379.
Heath, L., & Petraitis, J. (1987, March). Television viewing and fear of crime:
Where is the mean world? Basic & Applied Social Psychology, 8 (1/2), 97-
123.
Hirsch, P. (1980). The “scary world” of the nonviewer and other anomalies: A
reanalysis of Gerbner et al.’s findings on the cultivation analysis, Part I.
Communication Research, 7, 403-456.
Hirsch, P. (1981). On not learning from one’s mistakes: A reanalysis of Gerbner
et al.’s findings on the cultivation analysis, Part II. Communication
Research, 8, 3-37.
Hughes, M. (1980). The fruits of the cultivation analysis: A reexamination of
some effects of television viewing. Public Opinion Quarterly, 44, 2887-
3002.
Kennedy, G. A. (1991). On rhetoric: A theory of civic discourse. New York:
Oxford University Press.
Kershaw, C., Budd, T., Kinshott, G., Mattinson, J., Mayhew, P., & Myhill, A.
(2000). The 2000 British crime survey. London: HMSO.
98
Klite P., Robert A. B., & Jason, S. (1997). Bad news: Local TV news in America.
Denver: CO: Rocky Mountain Media Watch.
Kooistra, P., Mahoney, J., & Westervelt, S. (1998). The world of crime according
to ‘cops’. In M. Fishman and G. Cavender (Eds.). Entertaining crime (pp.
141-158). New York: Aldine De Gruyter.
Lee, M. (2007). Inventing fear of crime, criminology and the politics of anxiety.
United Kingdom: Willan.
Liska, A., & Baccaglini, W. (1990). Feeling safe by comparison: Crime in the
newspapers. Social Problems, 37, 360-74.
Liska, A. E., Sanchirico, A., & Reed, M. D. (1988). Fear of crime and constrained
behavior: Estimating a reciprocal effects model. Social Forces, 66, 827-
837.
Liu, J. (2007). Interpreting age and education effects on fear of crime in China:
Further analyses of the Tianjin data. Paper presented at the annual
meeting of the American Society of Criminology, Atlanta Marriott Marquis,
Atlanta, Georgia on November, 14.
McCombs, M. (1994) News influence on our pictures of the world. In J. Bryant
and D. Zillmann (Eds.). Media effects (pp. 1-16). Hillsdale, NJ: Erlbaum.
Mertler, C. A. & Vannatta, R. A. (2005). Advanced and multivariate statistical
methods: Practical application and interpretation (3rd ed.). Los Angeles:
Pyrczak.

99
Moore, S. & Shepherd, J. (2007). The elements and prevalence of fear. British
Journal of Criminology. 47, 154-162
Oliver, M. (1994, Spring). Portrayals of crime, race, and aggression in ‘reality-
based’ police shows: A content analysis. Journal of Broadcasting &
Electronic Media, 38 (2), 179.
Queensland Police Service (2009). Fear of crime. Retrieved March 30, 2009, from
http://www.police.qld.gov.au/programs/personalSafety/violence/fear.htm
Reith, M. (1999). Viewing of crime drama and authoritarian aggression: An
investigation of the relationship between crime viewing, fear and
aggression. Journal of Broadcasting and Electronic Media, 43 (2), 211-
221.
Romer, D., Jamieson, K. H., & Aday, S. (2003). Television news and the
cultivation of fear of crime. Journal of Communication, 53 (1), 88-104.
Schudson, M. (1989). How culture works. Theory and Society, 18, 153-180.
Sever, M. (2008). Prevalence of white collar crimes in Turkey: Public perceptions
of crime seriousness, victimization rate, citizens’ reporting behaviors and
victim characteristics. Unpublished dissertation, Sam Houston State
University, Huntsville, Texas.
Shanahan, J. & Morgan, M.(1999) Television and its viewers: Cultivation theory
and research. Cambridge: Cambridge University Press
100
Sheley, J., & Ashkins, C. (1981). Crime, crime news and crime views. Public
Opinion Quarterly, 45, 492-506.
Sparks, G., & Ogles, R. (1990, Summer). The difference between fear of
victimization and the probability of being victimized. Journal of
Broadcasting & Electronic Media, 34 (3), 351-358.
Turkish Statistical Institute. (2008). Databases. Retrieved November 3, 2008,
from http://www.tuik.gov.tr/jsp/duyuru/upload/vt/vt.htm
Vanderveen, G. (2006) Interpreting fear, crime, risk & unsafety. The Hague: BJU
Legal Publishers.
Yarwood, R. and Gardner, G. (2000). Fear of crime, culture and the countryside.
Area, 32 (4), 403-411
Warr, M. (1984). Fear of victimization: Why are women and elderly more afraid?
Social Science Quarterly, 65, 681-702.
Webster online dictionary (2009). Fear. Retrieved March 3, 2009, from
http://www.websters-online-dictionary.org/definition/fear
Wilson, T. D. (1999). Models in information behavior research. Journal of
Documentation, 55 (3), 249-268.
Wilson, T. D. (2000). Human information behavior. Informing Science, 3 (2), 49-
55.
Wober, M., & Gunter, B. (1982). Television and personal threat: Fact or artifact:
A British survey. British Journal of Social Psychology, 21, 239-247