Embed Size (px)
Citation preview
www.advenergymat.de
Full paper
1703513 (1 of 9) © 2018 WILEY-VCH Verlag GmbH & Co. KGaA, Weinheim
Fe2O3 Nanoparticle Seed Catalysts Enhance Cyclability on Deep (Dis)charge in Aprotic LiO2 Batteries
Zhaolong Li, Swapna Ganapathy, Yaolin Xu, Quanyao Zhu, Wen Chen, Ivan Kochetkov, Chandramohan George, Linda F. Nazar, and Marnix Wagemaker*
DOI: 10.1002/aenm.201703513
decomposition (oxygen evolution reaction, OER) of Li2O2 according to the reaction 2Li O Li O2
discharge
charge 2 2+ →← .[1] Therefore, the performance of this battery is determined by the reversibility of Li2O2 redox and the electrolyte stability.[1] The morphology and mechanism of Li2O2 deposition depends on the relative stability of the interme-diate LiO2 product in the electrolyte and the time scale of the Li2O2 formation on the cathode surface. While LiO2 sta-bility is determined by the stabilization of the Li+ both through the solvation strength of the electrolyte (quantified by the donor number (DN)) and the associa-tion strength of the counter anion,[5–7] the time scale determines to what extent the intermediate LiO2 species are solvated.[8] In an intermediate DN electrolyte, such as tetraethylene glycol dimethyl ether (TEGDME), the nucleation and growth of toroidal Li2O2 particles were proposed to occur via the solution dismutase mecha-nism at low current rates, whereas at fast
rates quasi-amorphous thin films were observed on electrode surface.[8] Porous carbon based materials have been extensively explored as O2 gas diffusion electrodes because of their high surface area, low weight, and low cost. Unfortunately, the dis-charge product Li2O2 reacts with carbon and the electrolyte at high potentials that characterize the OER process, and forms byproducts that clog the electrode pores, resulting in capacity fading and poor cycling stability.[9,10] Significant efforts have been expended in mitigating these side reactions by employing several combinations of noble metals (Au, Ru/RuO2, and Pt),[11–21] transition metal oxides (MnO2, Co/CoO/Co3O4, NiO, and TiO2),[22–33] and metal-related compounds,[34–40] both as cat-alysts and conductive matrices to improve the energy efficiency and cycle life of the LiO2 batteries.
Most often the reported cycling performance of LiO2 sys-tems is based on capacity-limited cycling, rather than the pre-ferred potential-limited cycling where the full electrode capacity is utilized. Capacity-limited cycling performance of batteries makes it difficult to quantify if improved cycling stability can be attributed to the specific role of electrode or to the contin-uous consumption of new active sites on the electrode surface is delivered. To date, the only electrode systems that have dis-played improved reversible Li2O2 formation and decomposi-tion during potential limited cycling in aprotic LiO2 batteries are porous gold,[14] metallic RuO2,[41,42] the metallic porous
Although the high energy density of LiO2 chemistry is promising for vehicle electrification, the poor stability and parasitic reactions associated with carbon-based cathodes and the insulating nature of discharge products limit their rechargeability and energy density. In this study, a cathode material consisting of α-Fe2O3 nanoseeds and carbon nanotubes (CNT) is presented, which achieves excellent cycling stability on deep (dis)charge with high capacity. The initial capacity of Fe2O3/CNT electrode reaches 805 mA h g−1 (0.7 mA h cm−2) at 0.2 mA cm−2, while maintaining a capacity of 1098 mA h g−1 (0.95 mA h cm−2) after 50 cycles. The operando structural, spectroscopic, and morphological anal-ysis on the evolution of Li2O2 indicates preferential Li2O2 growth on the Fe2O3. The similar d-spacing of the (100) Li2O2 and (104) Fe2O3 planes suggest that the latter epitaxially induces Li2O2 nucleation. This results in larger Li2O2 primary crystallites and smaller secondary particles compared to that deposited on CNT, which enhances the reversibility of the Li2O2 formation and leads to more stable interfaces within the electrode. The mechanistic insights into dual-functional materials that act both as stable host substrates and promote redox reactions in LiO2 batteries represent new opportunities for optimizing the discharge product morphology, leading to high cycling stability and coulombic efficiency.
Z. Li, Dr. S. Ganapathy, Y. Xu, Dr. C. George, Prof. M. WagemakerDepartment of Radiation Science and TechnologyDelft University of TechnologyMekelweg 15, 2629JB Delft, The NetherlandsE-mail: [email protected]. Q. Zhu, Prof. W. ChenState Key Laboratory of Advanced Technology for Materials Synthesis and ProcessingSchool of Materials Science and EngineeringWuhan University of TechnologyWuhan 430070, P. R. ChinaI. Kochetkov, Prof. L. F. NazarDepartment of Chemistry and the Waterloo Institute for NanotechnologyUniversity of WaterlooWaterloo, Ontario N2L 3G1, Canada
The ORCID identification number(s) for the author(s) of this article can be found under https://doi.org/10.1002/aenm.201703513.
Li–O2 Batteries
1. Introduction
Rechargeable aprotic Li–air or LiO2 batteries have great potential to enable energy-hungry applications, owing to their extremely high theoretical specific energy density.[1–4] In typical aprotic LiO2 batteries, the (dis)charge process pro-ceeds via the formation (oxygen reduction reaction, ORR) and
Adv. Energy Mater. 2018, 8, 1703513

www.advenergymat.dewww.advancedsciencenews.com
© 2018 WILEY-VCH Verlag GmbH & Co. KGaA, Weinheim1703513 (2 of 9)
Magnéli phase Ti4O7,[43] and TiC.[37] However, Ru and Au are heavy elements that limit their gravimetric energy density, and their high cost makes them unlikely candidates for practical LiO2 batteries. TiC-based cathodes also exhibit good capacity retention but have a relatively low gravimetric capacity (about 350 mA h g−1 in dimethyl sulfoxide (DMSO) electrolyte and 520 mA h g−1 in TEGDME electrolyte),[37] and the same holds true for Ti4O7 electrodes.[43] Alternatively, iron and iron oxide are both low-cost and abundant, and carbon-supported iron-based catalysts[44–47] have been studied as O2 diffusion elec-trodes for LiO2 batteries. Although iron oxide electrodes have been shown to exhibit lower overpotential, a higher capacity and better cycling performance compared to carbon electrodes upon capacity-limited cycling, full (dis)charge (with potential limited cycling) has not been reported to date, which is in fact a key figure-of-merit for these batteries.
Hematite Fe2O3 is known as a O2 reduction catalyst in aqueous media[48,49] and as an O2 adsorption material.[50] While it is ostensibly a wide band gap semiconductor, the presence of structrual defects leads to significant electronic conductivity.[50] Shimizu et al.[48] and Sun et al.[49] found that via its catalytic activity, Fe2O3 could alter the ORR reaction pathway from a 2e− to a 4e− process in aqueous media. Gurlo et al.[50] have reported that oxygen could preferentially absorbs on the α-Fe2O3 surface, and Zhang et al.[33] found that Co3O4 acted as crystal seed by pref-erential oxygen adsorption, facilitating the formation of Li2O2 film and particles. Motivated by these observations, our work reported here demonstrates that oxygen cathodes prepared by a combination of nanosized Fe2O3 seed crystallites with carbon nanotubes (CNT) exhibit an impressive cycle stability and large capacity when cycled in a large potential cutoff window of 2.0–4.5 V. The initial specific capacity of the Fe2O3/CNT electrode reaches about 805 mA h g−1 (0.70 mA h cm−2), and it maintains a reversible capacity of ≈1098 mA h g−1 (0.95 mA h cm−2) after 50 cycles at a current density of 0.2 mA cm−2. We propose that the similar (104) Fe2O3 and (100) Li2O2 lattice plane d-spacing induces epitaxial growth of Li2O2 on the Fe2O3 surface. The epi-taxial growth enhances the nucleation of Li2O2 which enhances its crystallinity, and suppresses amorphous Li2O2 formation which leads to passivation. This epitaxial growth of Li2O2 on Fe2O3 nanoparticles results in oriented and smaller secondary Li2O2 particles, which are responsible for more facile decompo-sition upon oxidation. The preferential formation of Li2O2 on Fe2O3 and the facile decomposition are proposed to be respon-sible for the significantly improved reversible Li2O2 formation and decomposition leading to the observed high capacity reten-tion on deep (dis)charge.
2. Results and discussion
2.1. Electrochemical Performance
The use of Fe2O3 nanoseed crystals in the gas diffusion cathode was also motivated by our previous study, where hexagonal NiO nanocrystals (a = b = 2.972 ± 0.001 Å, c = 7.158 ± 0.001 Å) were found to induce equiaxal growth of Li2O2 (a = b = 3.142 ± 0.005 Å, c = 7.650 ± 0.005 Å) due to an approximate match of their a- and b-lattice parameters.[30] The lattice parameters of the α-Fe2O3
(a = b = 5.5035 Å and c = 13.74 Å) are distinct from Li2O2; however, the interplanar spacing of its (104) (2.70 Å) and (110) (2.52 Å) planes are approximately equal to the (100) (2.72 Å) and (101) (2.56 Å) planes of Li2O2 (Figure S1, Supporting Information). The CNTs plays an important role in forming an interpen-etrating porous network structure that facilitates access of O2, and they also provide electronic conductivity across electrodes and support the Fe2O3 catalyst.
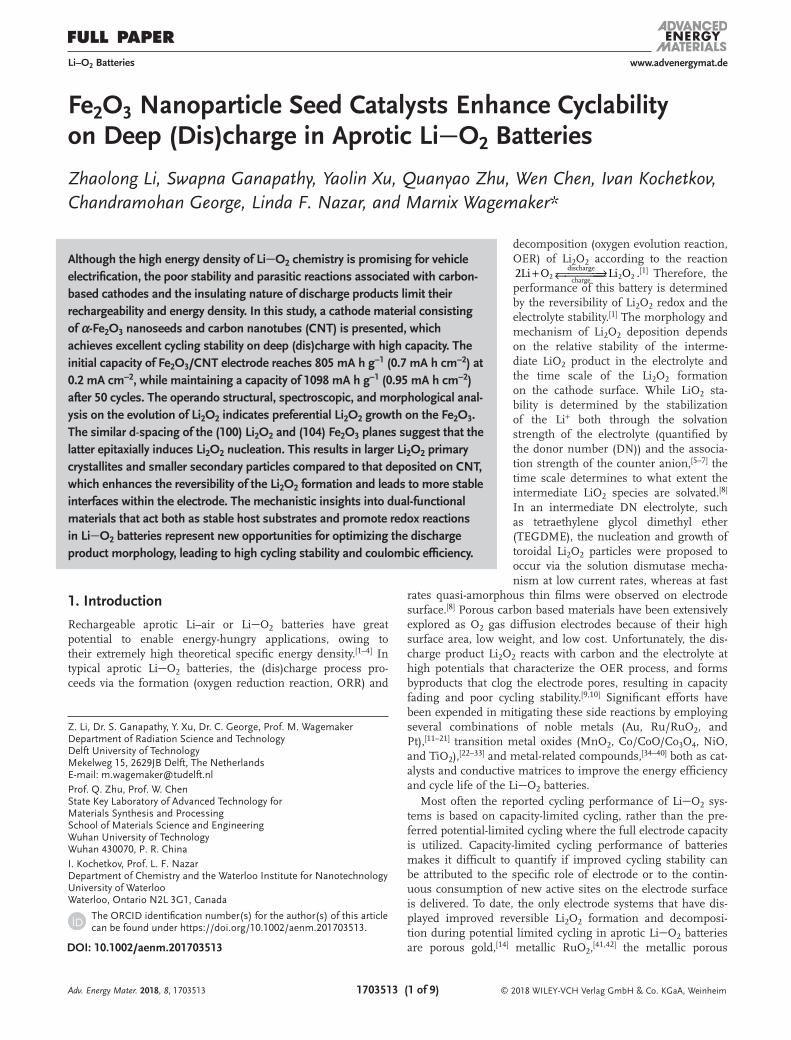
Figure 1 displays the galvanostatic (dis)charge cycle perfor-mance of LiO2 batteries with CNT and Fe2O3/CNT cathodes by employing a potential cutoff at different (dis)charge current densities. The Brunauer-Emmett-Teller (BET) surface of the cast Fe2O3/CNT cathodes (75/25 wt%) is smaller, 8.47 m2 g−1, compared to that of the CNT powder (150–200 m2 g−1). There-fore, the effective electrochemical surface area of Fe2O3/CNT electrodes must be significantly smaller compared to the CNT cathodes. This implies that when applying the same current density, based on the geometrical surface of the cathodes, the local current density should be expected to be larger for the Fe2O3/CNT cathodes. The cycling stability of the CNT cathode is relatively poor (Figure 1a–c), and after 30 cycles the specific discharge capacity decreases drastically at current densities of 0.1 and 0.2 mA h cm−2. Under the same cycling conditions, despite the fact that the local current density should be larger, the Fe2O3/CNT cathode shows significantly better cycling sta-bility and coulombic efficiency, as shown in Figure 1d–f. The reversible specific capacity on deep (dis)charge of the Fe2O3/CNT electrode reaches 1295 mA h g−1 after 50 cycles at a current density of 0.1 mA cm−2 (based on the total mass of the Fe2O3 and CNT), which is larger than the first discharge capacity (951 mA h g−1). Also at a current density of 0.2 mA cm−2, the initial specific discharge capacity of the Fe2O3/CNT cathode is 805 mA h g−1, and it maintains a capacity of 1098 mA h g−1 after 50 cycles. The incremental capacity over cycling is most likely the result of continuous activation of the Fe2O3 surface due to the gradual impregnation of the electrolyte into the porous structure of CNT and Fe2O3 nanoparticles, which acti-vates more reaction surface over time.[41]
Interestingly, after the first cycle the specific capacity of the Fe2O3/CNT cathode (normalized using geometric surface of the electrode) is larger than that of the CNT cathode (Figure S2, Supporting Information). Again we note that the electrochem-ical surface area of the Fe2O3 electrodes is expected to be smaller based on the smaller Fe2O3 surface area compared to that of CNT. The initial discharge capacity of the Fe2O3/CNT cathode is 0.6 and 0.7 mA h cm−2, and 0.95 and 1.05 mA h cm−2 for the CNT cathode at current densities of 0.1 and 0.2 mA cm−2, respectively (Figure S2, Supporting Information). However, after 30 deep (dis)charge cycles, the capacities of the CNT electrode dramatically drop to almost zero. On the contrary, the capacity of the Fe2O3/CNT electrode increases to 0.85 and 0.95 mA h cm−2 after 50 deep (dis)charge cycles at current den-sities of 0.1 and 0.2 mA cm−2, respectively. The results indicate that the Fe2O3/CNT cathode surface is more active toward ORR compared to the CNT cathode, hence triggering the formation of more Li2O2. The charge overpotential of the Fe2O3/CNT elec-trode is 200 mV lower than that of the CNT cathode (Figure S3, Supporting Information), which was also observed in other studies.[44,45]
Adv. Energy Mater. 2018, 8, 1703513
www.advenergymat.dewww.advancedsciencenews.com
© 2018 WILEY-VCH Verlag GmbH & Co. KGaA, Weinheim1703513 (3 of 9)
As an anode in lithium-ion batteries, Fe2O3 nanostructured materials follow a series of Li-insertion processes resulting in two voltage plateaus at ≈1.2 and 0.75 V, respectively.[51,52] A Fe2O3/CNT electrode cycled in Ar within a 2.0–4.5 V window (Figure S4, Supporting Information) shows a reversible capacity of only 24 mA h g−1 (0.027 mA h cm−2) at a current density of 0.1 mA cm−2. On the other hand, in the presence of O2, the Fe2O3/CNT cathode displays a stable discharge plateau at around 2.6 V, as shown in Figure 1e,f. Thus, within the poten-tial window of 2.0–4.0 V, the Li-intercalation reaction does not contribute to the discharge capacity of the Fe2O3/CNT cathode in a LiO2 battery.
Figure S5 (Supporting Information) shows the cyclic voltammetry curves of CNT and Fe2O3/CNT cathodes, respec-tively. The observed bell shaped oxygen reduction curves of both the CNT and Fe2O3/CNT cathodes represent the expected formation of Li2O2.[53] Due to the low electronic conductivity of lithium oxide, the oxidation overpotential is expected to be high. The oxygen evolution anodic peaks can be attributed to the oxidation of Li2O2.[53,54]
2.2. Analysis of the Evolution of Products During (Dis)charge
In principle, the potential of a LiO2 battery system should sharply increase when the discharge product is completely decomposed during charge. This is typically observed in Li-ion battery electrodes, where after all of the removable lithium ions are extracted, the potential steeply increases toward the cutoff voltage. However, this phenomenon is seldom reported for LiO2 batteries, where capacity restriction is typically used to demonstrate the electrochemical performance of oxygen cath-odes. Thereby, side reactions with the electrolyte that occur at large and small potentials are avoided, at the same time the
reversibility is artificially improved as the battery is only par-tially discharged. Potential limited cycling utilizes the full capacity, and is more challenging, because side reactions are unavoidable in an aprotic LiO2 battery at high charge poten-tials. These parasitic reactions lead to the formation of Li2CO3, the decomposition of the electrolyte, and the decomposition of the binder in the cathode.[55]
To investigate the reversibility of the products on the Fe2O3/CNT oxygen cathodes at high charge potentials, the discharge capacity was restricted to 0.5 and 0.25 mA h and the LiO2 bat-teries were subsequently charged to 4.5 V at current densities of 0.1 and 0.2 mA cm−2, respectively, as shown in Figure S6 (Supporting Information). Under these conditions the LiO2 battery also exhibits stable cycling, where the potential lim-ited charge capacity is very close to the discharge capacity over 50 cycles (Figure S6a,d)). The discharge plateau is close to 2.6 V (Figure S6b–f). Notably, the charge voltage increases to 4.5 V at the end of the charge process following the stable charge plateaus, which is rarely reported for LiO2 battery (dis)charge profiles. From the ex situ X-ray powder diffraction (XRD) pat-terns shown in Figure S7a (Supporting Information), it is diffi-cult to observe differences between the diffraction peaks of the pristine and discharged Fe2O3/CNT cathode at the current den-sities of 0.1 and 0.2 mA cm−2, as expected owing to the similar lattice spacing of (104) Fe2O3 and (100) Li2O2 planes (Figure S1, Supporting Information). The scanning electron microscopy (SEM) images also show no significant difference between the pristine sample (Figure S7b, Supporting Information) and the discharged cathode (Figure S7c, Supporting Information), with the exception of a film-like structure that forms at a current density of 0.2 mA cm−2. This most likely represents the deposi-tion of a quasi-amorphous thin Li2O2 film, which is known to occur at high (dis)charge currents.[8] Using the titration experi-ment developed by McCloskey and co-workers[56] (Figure S8,
Adv. Energy Mater. 2018, 8, 1703513
Figure 1. Cycling performance of a) CNT and d) Fe2O3/CNT oxygen cathodes during deep (dis)charge by employing a potential window of 2.0−4.5 V, measured in 0.5 m LiTFSI/TEGDME electrolyte at current densities of 0.1 and 0.2 mA cm−2, respectively in LiO2 batteries at 1.0 bar O2 pressure. b,c,e,f) selected, potential cutoff, galvanostatic (dis)charge profiles for CNT and Fe2O3/CNT oxygen cathodes, respectively.
www.advenergymat.dewww.advancedsciencenews.com
© 2018 WILEY-VCH Verlag GmbH & Co. KGaA, Weinheim1703513 (4 of 9)
Supporting Information), the yield of Li2O2 after first discharge to 2.0 V on the surface of Fe2O3/CNT cathodes was found to be 95.7% and 96.5% compared to the theoretical capacity at the current density of 0.2 and 0.1 mA cm−2, respectively, confirming that the discharge capacity from the Fe2O3/CNT cathode is mainly due to the formation of Li2O2. Online electrochemical mass spectrometry (OEMS) measurements were performed to quantify the O2 evolution during charge (Figure S9, Supporting Information). Even though O2 evolution does not match the number of electrons involved in the first charge in the OEMS experiment, only O2 is detected over the charge plateau (Figure S9a, Supporting Information). At the end of charge, CO2 is generated from the decomposition of some carbonates that are unavoidably generated via reaction of superoxide and/or per-oxide with the electrolyte. This is the reason for the lower e−/O2 ratio in Figure S9b (Supporting Information) (compared to the theoretical value of 2e−/O2 corresponding to pure O2 evolution); namely, some byproducts form that are not related to the evolu-tion of O2. Unfortunately, despite the increased columbic effi-ciency, the stability of all the cell components (electrolyte, CNT conductive support, etc.) in the electrolyte with an intermediate donor number still needs to be addressed in order to obtain a ratio of 2.0 e−/O2. However, the aim of this study is to show the beneficial impact of the Fe2O3 on the reversible growth of Li2O2, resulting in the improved cycling under potential limited cycling.
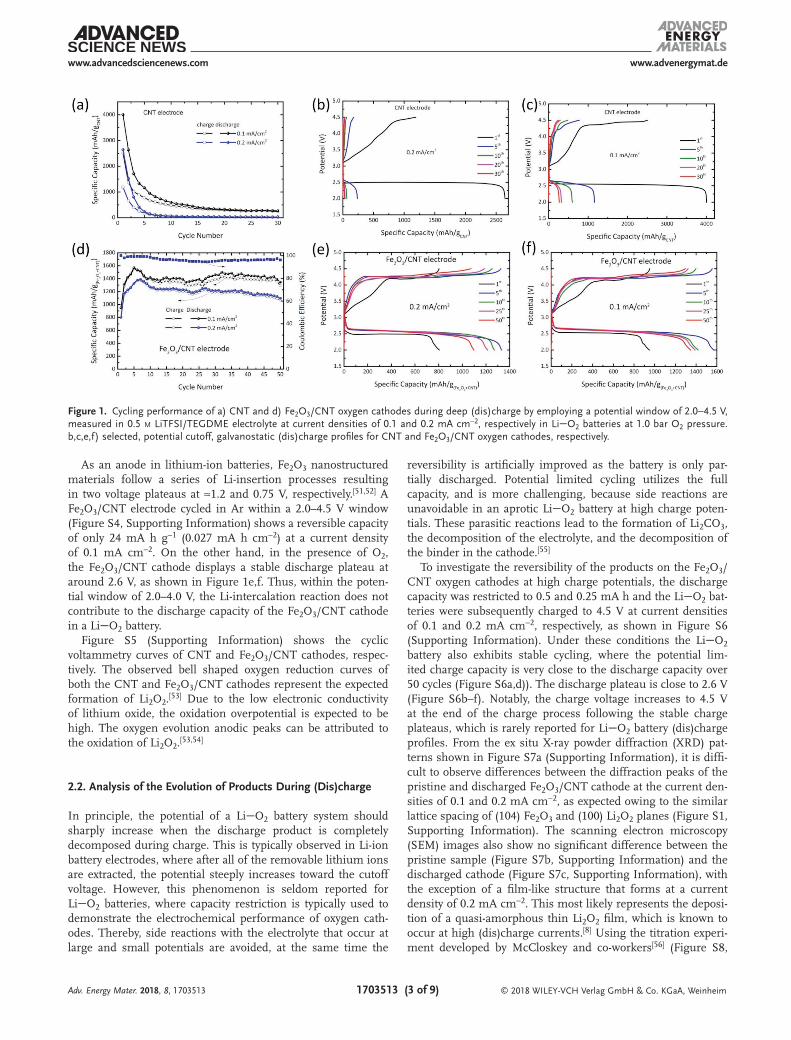
To verify the formation and decomposition of Li2O2 on the Fe2O3/CNT cathode, operando XRD was carried out on a LiO2 battery cycled within a potential window of 2.0–4.5 V at a current density of 0.2 mA cm−2 in a 0.5 m LiTFSI/TEGDME electrolyte (Figure 2). Since the (104) and (110) lattice plane distances of Fe2O3 are very similar to the (100)
and (101) planes of Li2O2, respectively (Figure S1, Sup-porting Information), the reflections are indistinguish-able in ex situ XRD measurements of discharged cathodes, especially due to the broadening of nanosized Fe2O3 peaks. However, the 2D contour operando XRD patterns in the 2θ region of 31.5–37° (Figure 2) show a symmetric broadening of the (100)/(104) and the (101)/(110) Li2O2/Fe2O3 lattice planes, confirming the gradual formation and decomposi-tion of Li2O2.
To further investigate the discharge product formed on the cathode surface at a current density of 0.2 mA cm−2, ex situ X-ray photoelectron spectroscopy (XPS) analysis (Figure 3) was carried out on the pristine Fe2O3/CNT cathode and cath-odes from discharged and recharged batteries (discharge to 2.0 V and recharge to 4.5 V; the electrochemical perfor-mance of these batteries is shown in Figure S10 in the Sup-porting Information). All spectra were calibrated using the C1s peak of CNT at 284.48 eV. The survey scan from 0 to 800 eV is given in Figure 3a and shows the relative change in the quantities of oxygen, lithium, and iron on the sur-face of the Fe2O3/CNT cathodes. The relative intensity of the Fe2p peaks for the Fe2O3/CNT cathodes diminishes after the first and fifth discharge (black and blue lines in Figure 3a), but recovers after recharge (red line in Figure 3a), indicating that the surface of the cathode is covered with a discharge product which is removed after charge. Figure 3b–d displays the XPS spectra in the Fe2p, O1s, and Li1s/Fe3p regions, respectively. The Fe2p region from 705 to 730 eV shows the characteristic 2p1/2 and 2p3/2 doublet which is attributed to Fe2O3 (pink line in Figure 3b).[57] After the first discharge, the peak becomes less prominent (black line in Figure 3b), and after the fifth discharge the peak becomes indistinguish-
able (blue line in Figure 3b). However, when the cathode is recharged to 4.5 V, the Fe2p signal completely reappears, and is similar to the pristine sample (red and pink lines in Figure 3b). This is an indication of the for-mation and decomposition of products on the cathode surface during (dis)charge. In addition, after first discharge, the main peak of Fe2p slightly shifts to low binding energy compared to the pristine and recharged cath-odes, which may be attributed to the sur-face redox activities (involving Fe2+/3+ redox couple). Further, this could probably overlap with the surface bonds between Li2O2 and Fe2O3. In the pristine electrode, O1s spectral peaks (pink line in Figure 3c) appear from 528 to 533 eV and can be assigned to FeO and FeOH from Fe2O3.[57] The features (pink line in Figure 3d) in the region from 55.5 to 57.3 eV can be attributed to the Fe3p contribution from Fe2O3. It is interesting to note that after the first and fifth discharge to 2.0 V, the spectral peaks in the O1s and Fe3p/Li1s regions (black and blue lines in Figure 3c,d) shift to binding energies of 54.6 and 531.2 eV, mainly corresponding to the lithium and oxygen contributions from
Adv. Energy Mater. 2018, 8, 1703513
Figure 2. Top: (Dis)charge profile of the Fe2O3/CNT oxygen cathode in an operando LiO2 battery. Bottom: 2D contour plots of the operando XRD patterns showing the 2θ region between 31.5–37° during a complete (dis)charge cycle, demonstrating the formation of Li2O2 and its decomposition. The battery was (dis)charged using a 0.5 m LiTFSI/TEGDME electrolyte within a potential window of 2.0–4.5 V at a current density of 0.2 mA cm−2.

www.advenergymat.dewww.advancedsciencenews.com
© 2018 WILEY-VCH Verlag GmbH & Co. KGaA, Weinheim1703513 (5 of 9)
Li2O2, respectively.[58] Furthermore, after recharge (red line in Figure 3c,d), the shift of peaks in this region returns to their original positions, indicating reappearance of the Fe2p and Fe3p contributions and hence the removal of Li2O2 from the cathode surface. In summary, from the XPS analysis of the pristine, discharged and recharged samples, we conclude that Li2O2 is the main product formed reversibly on the Fe2O3/CNT cathode surface during (dis)charge in the LiO2 battery.
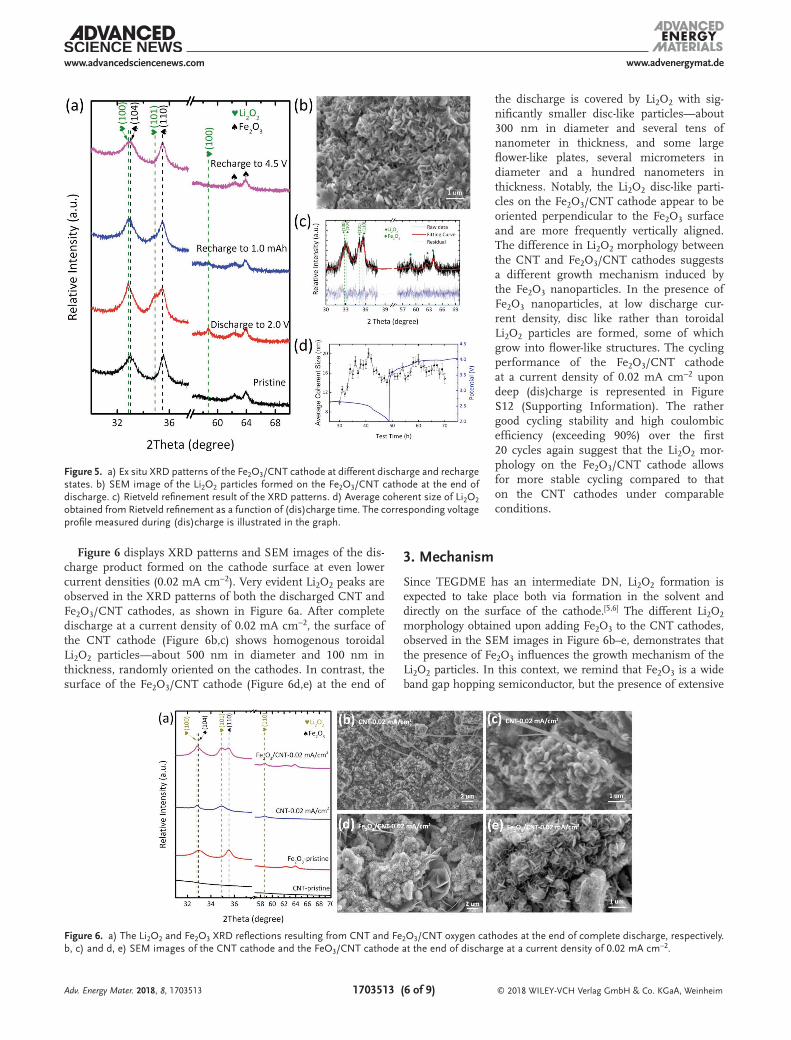
Figure 4 shows the 2D contour plot of the operando XRD pat-terns of the Fe2O3/CNT cathode at a lower current density of 0.05 mA cm−2 compared to that shown in Figure 2. Discernable Li2O2 XRD peaks are observed on the Fe2O3/CNT cathode when the discharge current density is lowered to 0.05 mA cm−2 (Figure 5a). The gradual increase and decrease in the intensi-ties of the Li2O2 reflections, corresponding to the (100) and (101) planes of Li2O2 (Figure 4), indicate the gradual formation and
decomposition of Li2O2 on the Fe2O3/CNT cathode as a function of (dis)charge time. The ex situ SEM image of the Fe2O3/CNT cathode after discharge to 2.0 V shows a homogenous platelet morphology of the Li2O2 particles (Figure 5b). Based on the Rietveld refinement of the sequential operando XRD patterns (Figure 5c), we obtained the average coherent size of Li2O2 as a function of (dis)charge time (Figure 5d). During the refinement, the Fe2O3 parameters were fixed based on the refine-ment result as shown in Figure S11 (Sup-porting Information). The average coherent length of the Li2O2 crystallite platelets first increases during initial discharge, after which it decreases as discharge progresses. This indicates the formation of larger and more anisotropic shaped Li2O2 crystallites at the initial stages of discharge. The deposition of smaller and more isotropic Li2O2 occurs as discharge progresses, similar to what we reported previously.[59] During charge, smaller Li2O2 crystallites preferentially decompose followed by the decomposition of the larger Li2O2 crystallites, as can be concluded from the initial increase in the average coherence length of Li2O2 (after which it remains con-stant to the end of charge).[60]
Adv. Energy Mater. 2018, 8, 1703513
Figure 3. a) XPS survey scans of Fe2O3/CNT oxygen cathodes at different (dis)charge states. b,c,d) High resolution XPS in the Fe2p, O1s, and Li1s or Fe3p regions, respectively for the Fe2O3/CNT oxygen cathode at different states of (dis)charge. The black, red, blue, and pink lines represent the cathode at the state of first discharge to 2.0 V, first recharge to 4.5 V, fifth discharge to 2.0 V, and pristine states, respectively.
Figure 4. Top: (Dis)charge profile of the electrochemical performance of the Fe2O3/CNT oxygen cathode in an operando LiO2 battery. Bottom: 2D contour plots of the operando XRD patterns showing the 2θ region between 31.5–37°, during a complete (dis)charge cycle demonstrating the formation and decomposition of Li2O2. The operando LiO2 battery was (dis)charged using a 0.5 m LiTFSI/TEGDME electrolyte within a potential window of 2.0–4.5 V at a current density of 0.05 mA cm−2.
www.advenergymat.dewww.advancedsciencenews.com
© 2018 WILEY-VCH Verlag GmbH & Co. KGaA, Weinheim1703513 (6 of 9)
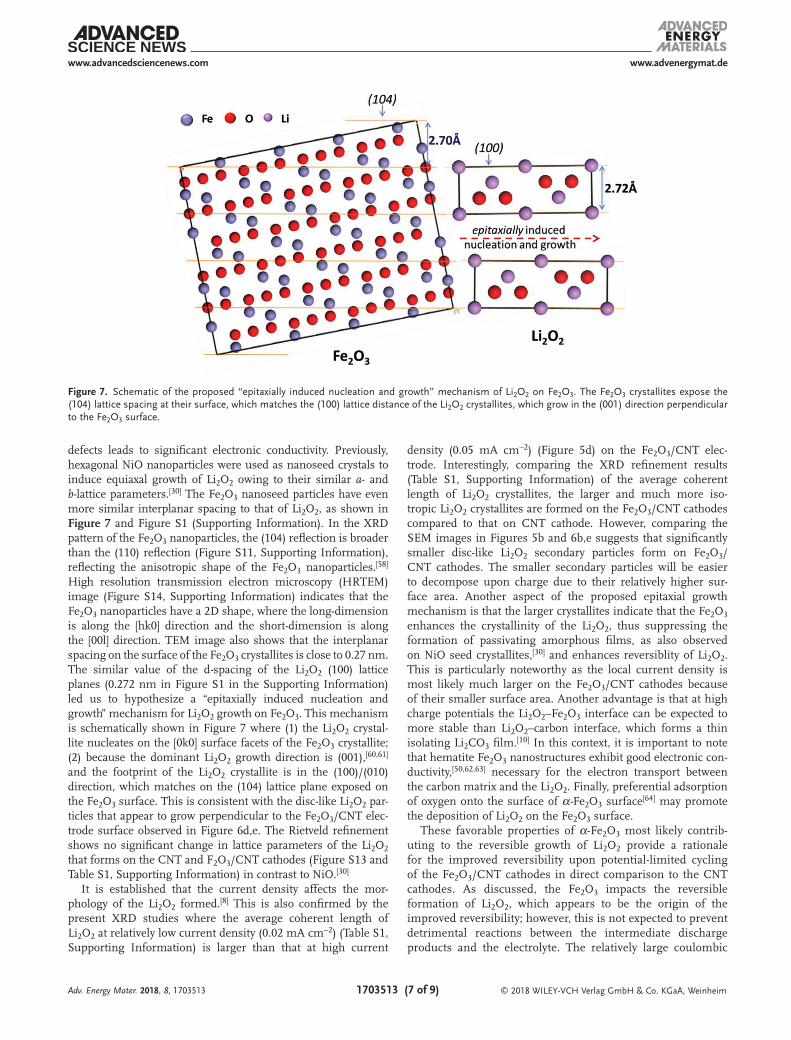
Figure 6 displays XRD patterns and SEM images of the dis-charge product formed on the cathode surface at even lower current densities (0.02 mA cm−2). Very evident Li2O2 peaks are observed in the XRD patterns of both the discharged CNT and Fe2O3/CNT cathodes, as shown in Figure 6a. After complete discharge at a current density of 0.02 mA cm−2, the surface of the CNT cathode (Figure 6b,c) shows homogenous toroidal Li2O2 particles—about 500 nm in diameter and 100 nm in thickness, randomly oriented on the cathodes. In contrast, the surface of the Fe2O3/CNT cathode (Figure 6d,e) at the end of
the discharge is covered by Li2O2 with sig-nificantly smaller disc-like particles—about 300 nm in diameter and several tens of nanometer in thickness, and some large flower-like plates, several micrometers in diameter and a hundred nanometers in thickness. Notably, the Li2O2 disc-like parti-cles on the Fe2O3/CNT cathode appear to be oriented perpendicular to the Fe2O3 surface and are more frequently vertically aligned. The difference in Li2O2 morphology between the CNT and Fe2O3/CNT cathodes suggests a different growth mechanism induced by the Fe2O3 nanoparticles. In the presence of Fe2O3 nanoparticles, at low discharge cur-rent density, disc like rather than toroidal Li2O2 particles are formed, some of which grow into flower-like structures. The cycling performance of the Fe2O3/CNT cathode at a current density of 0.02 mA cm−2 upon deep (dis)charge is represented in Figure S12 (Supporting Information). The rather good cycling stability and high coulombic efficiency (exceeding 90%) over the first 20 cycles again suggest that the Li2O2 mor-phology on the Fe2O3/CNT cathode allows for more stable cycling compared to that on the CNT cathodes under comparable conditions.
3. Mechanism
Since TEGDME has an intermediate DN, Li2O2 formation is expected to take place both via formation in the solvent and directly on the surface of the cathode.[5,6] The different Li2O2 morphology obtained upon adding Fe2O3 to the CNT cathodes, observed in the SEM images in Figure 6b–e, demonstrates that the presence of Fe2O3 influences the growth mechanism of the Li2O2 particles. In this context, we remind that Fe2O3 is a wide band gap hopping semiconductor, but the presence of extensive
Adv. Energy Mater. 2018, 8, 1703513
Figure 5. a) Ex situ XRD patterns of the Fe2O3/CNT cathode at different discharge and recharge states. b) SEM image of the Li2O2 particles formed on the Fe2O3/CNT cathode at the end of discharge. c) Rietveld refinement result of the XRD patterns. d) Average coherent size of Li2O2 obtained from Rietveld refinement as a function of (dis)charge time. The corresponding voltage profile measured during (dis)charge is illustrated in the graph.
Figure 6. a) The Li2O2 and Fe2O3 XRD reflections resulting from CNT and Fe2O3/CNT oxygen cathodes at the end of complete discharge, respectively. b, c) and d, e) SEM images of the CNT cathode and the FeO3/CNT cathode at the end of discharge at a current density of 0.02 mA cm−2.
www.advenergymat.dewww.advancedsciencenews.com
© 2018 WILEY-VCH Verlag GmbH & Co. KGaA, Weinheim1703513 (7 of 9)
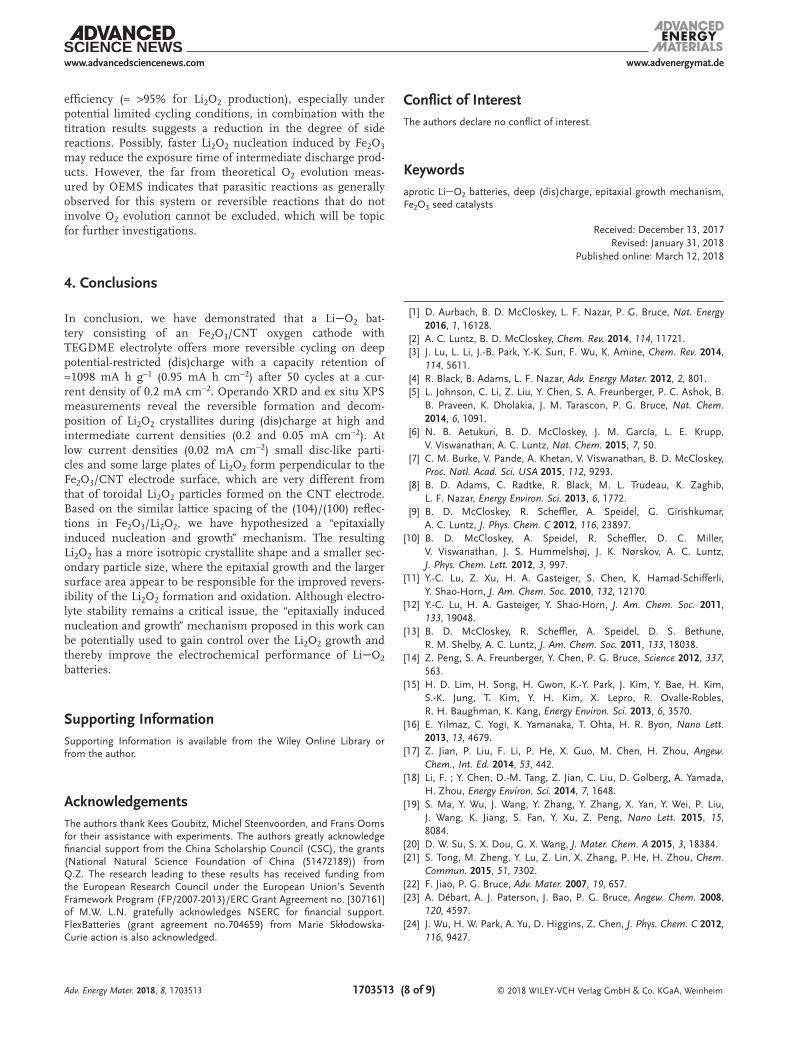
defects leads to significant electronic conductivity. Previously, hexagonal NiO nanoparticles were used as nanoseed crystals to induce equiaxal growth of Li2O2 owing to their similar a- and b-lattice parameters.[30] The Fe2O3 nanoseed particles have even more similar interplanar spacing to that of Li2O2, as shown in Figure 7 and Figure S1 (Supporting Information). In the XRD pattern of the Fe2O3 nanoparticles, the (104) reflection is broader than the (110) reflection (Figure S11, Supporting Information), reflecting the anisotropic shape of the Fe2O3 nanoparticles.[58] High resolution transmission electron microscopy (HRTEM) image (Figure S14, Supporting Information) indicates that the Fe2O3 nanoparticles have a 2D shape, where the long-dimension is along the [hk0] direction and the short-dimension is along the [00l] direction. TEM image also shows that the interplanar spacing on the surface of the Fe2O3 crystallites is close to 0.27 nm. The similar value of the d-spacing of the Li2O2 (100) lattice planes (0.272 nm in Figure S1 in the Supporting Information) led us to hypothesize a “epitaxially induced nucleation and growth” mechanism for Li2O2 growth on Fe2O3. This mechanism is schematically shown in Figure 7 where (1) the Li2O2 crystal-lite nucleates on the [0k0] surface facets of the Fe2O3 crystallite; (2) because the dominant Li2O2 growth direction is (001),[60,61] and the footprint of the Li2O2 crystallite is in the (100)/(010) direction, which matches on the (104) lattice plane exposed on the Fe2O3 surface. This is consistent with the disc-like Li2O2 par-ticles that appear to grow perpendicular to the Fe2O3/CNT elec-trode surface observed in Figure 6d,e. The Rietveld refinement shows no significant change in lattice parameters of the Li2O2 that forms on the CNT and F2O3/CNT cathodes (Figure S13 and Table S1, Supporting Information) in contrast to NiO.[30]
It is established that the current density affects the mor-phology of the Li2O2 formed.[8] This is also confirmed by the present XRD studies where the average coherent length of Li2O2 at relatively low current density (0.02 mA cm−2) (Table S1, Supporting Information) is larger than that at high current
density (0.05 mA cm−2) (Figure 5d) on the Fe2O3/CNT elec-trode. Interestingly, comparing the XRD refinement results (Table S1, Supporting Information) of the average coherent length of Li2O2 crystallites, the larger and much more iso-tropic Li2O2 crystallites are formed on the Fe2O3/CNT cathodes compared to that on CNT cathode. However, comparing the SEM images in Figures 5b and 6b,e suggests that significantly smaller disc-like Li2O2 secondary particles form on Fe2O3/CNT cathodes. The smaller secondary particles will be easier to decompose upon charge due to their relatively higher sur-face area. Another aspect of the proposed epitaxial growth mechanism is that the larger crystallites indicate that the Fe2O3 enhances the crystallinity of the Li2O2, thus suppressing the formation of passivating amorphous films, as also observed on NiO seed crystallites,[30] and enhances reversiblity of Li2O2. This is particularly noteworthy as the local current density is most likely much larger on the Fe2O3/CNT cathodes because of their smaller surface area. Another advantage is that at high charge potentials the Li2O2–Fe2O3 interface can be expected to more stable than Li2O2–carbon interface, which forms a thin isolating Li2CO3 film.[10] In this context, it is important to note that hematite Fe2O3 nanostructures exhibit good electronic con-ductivity,[50,62,63] necessary for the electron transport between the carbon matrix and the Li2O2. Finally, preferential adsorption of oxygen onto the surface of α-Fe2O3 surface[64] may promote the deposition of Li2O2 on the Fe2O3 surface.
These favorable properties of α-Fe2O3 most likely contrib-uting to the reversible growth of Li2O2 provide a rationale for the improved reversibility upon potential-limited cycling of the Fe2O3/CNT cathodes in direct comparison to the CNT cathodes. As discussed, the Fe2O3 impacts the reversible formation of Li2O2, which appears to be the origin of the improved reversibility; however, this is not expected to prevent detrimental reactions between the intermediate discharge products and the electrolyte. The relatively large coulombic
Adv. Energy Mater. 2018, 8, 1703513
Figure 7. Schematic of the proposed “epitaxially induced nucleation and growth” mechanism of Li2O2 on Fe2O3. The Fe2O3 crystallites expose the (104) lattice spacing at their surface, which matches the (100) lattice distance of the Li2O2 crystallites, which grow in the (001) direction perpendicular to the Fe2O3 surface.
www.advenergymat.dewww.advancedsciencenews.com
© 2018 WILEY-VCH Verlag GmbH & Co. KGaA, Weinheim1703513 (8 of 9)
efficiency (≈ >95% for Li2O2 production), especially under potential limited cycling conditions, in combination with the titration results suggests a reduction in the degree of side reactions. Possibly, faster Li2O2 nucleation induced by Fe2O3 may reduce the exposure time of intermediate discharge prod-ucts. However, the far from theoretical O2 evolution meas-ured by OEMS indicates that parasitic reactions as generally observed for this system or reversible reactions that do not involve O2 evolution cannot be excluded, which will be topic for further investigations.
4. Conclusions
In conclusion, we have demonstrated that a LiO2 bat-tery consisting of an Fe2O3/CNT oxygen cathode with TEGDME electrolyte offers more reversible cycling on deep potential-restricted (dis)charge with a capacity retention of ≈1098 mA h g−1 (0.95 mA h cm−2) after 50 cycles at a cur-rent density of 0.2 mA cm−2. Operando XRD and ex situ XPS measurements reveal the reversible formation and decom-position of Li2O2 crystallites during (dis)charge at high and intermediate current densities (0.2 and 0.05 mA cm−2). At low current densities (0.02 mA cm−2) small disc-like parti-cles and some large plates of Li2O2 form perpendicular to the Fe2O3/CNT electrode surface, which are very different from that of toroidal Li2O2 particles formed on the CNT electrode. Based on the similar lattice spacing of the (104)/(100) reflec-tions in Fe2O3/Li2O2, we have hypothesized a “epitaxially induced nucleation and growth” mechanism. The resulting Li2O2 has a more isotropic crystallite shape and a smaller sec-ondary particle size, where the epitaxial growth and the larger surface area appear to be responsible for the improved revers-ibility of the Li2O2 formation and oxidation. Although electro-lyte stability remains a critical issue, the “epitaxially induced nucleation and growth” mechanism proposed in this work can be potentially used to gain control over the Li2O2 growth and thereby improve the electrochemical performance of LiO2 batteries.
Supporting InformationSupporting Information is available from the Wiley Online Library or from the author.
AcknowledgementsThe authors thank Kees Goubitz, Michel Steenvoorden, and Frans Ooms for their assistance with experiments. The authors greatly acknowledge financial support from the China Scholarship Council (CSC), the grants (National Natural Science Foundation of China (51472189)) from Q.Z. The research leading to these results has received funding from the European Research Council under the European Union’s Seventh Framework Program (FP/2007-2013)/ERC Grant Agreement no. [307161] of M.W. L.N. gratefully acknowledges NSERC for financial support. FlexBatteries (grant agreement no.704659) from Marie Skłodowska-Curie action is also acknowledged.
Conflict of InterestThe authors declare no conflict of interest.
Keywordsaprotic LiO2 batteries, deep (dis)charge, epitaxial growth mechanism, Fe2O3 seed catalysts
Received: December 13, 2017Revised: January 31, 2018
Published online: March 12, 2018
[1] D. Aurbach, B. D. McCloskey, L. F. Nazar, P. G. Bruce, Nat. Energy 2016, 1, 16128.
[2] A. C. Luntz, B. D. McCloskey, Chem. Rev. 2014, 114, 11721.[3] J. Lu, L. Li, J.-B. Park, Y.-K. Sun, F. Wu, K. Amine, Chem. Rev. 2014,
114, 5611.[4] R. Black, B. Adams, L. F. Nazar, Adv. Energy Mater. 2012, 2, 801.[5] L. Johnson, C. Li, Z. Liu, Y. Chen, S. A. Freunberger, P. C. Ashok, B.
B. Praveen, K. Dholakia, J. M. Tarascon, P. G. Bruce, Nat. Chem. 2014, 6, 1091.
[6] N. B. Aetukuri, B. D. McCloskey, J. M. García, L. E. Krupp, V. Viswanathan, A. C. Luntz, Nat. Chem. 2015, 7, 50.
[7] C. M. Burke, V. Pande, A. Khetan, V. Viswanathan, B. D. McCloskey, Proc. Natl. Acad. Sci. USA 2015, 112, 9293.
[8] B. D. Adams, C. Radtke, R. Black, M. L. Trudeau, K. Zaghib, L. F. Nazar, Energy Environ. Sci. 2013, 6, 1772.
[9] B. D. McCloskey, R. Scheffler, A. Speidel, G. Girishkumar, A. C. Luntz, J. Phys. Chem. C 2012, 116, 23897.
[10] B. D. McCloskey, A. Speidel, R. Scheffler, D. C. Miller, V. Viswanathan, J. S. Hummelshøj, J. K. Nørskov, A. C. Luntz, J. Phys. Chem. Lett. 2012, 3, 997.
[11] Y.-C. Lu, Z. Xu, H. A. Gasteiger, S. Chen, K. Hamad-Schifferli, Y. Shao-Horn, J. Am. Chem. Soc. 2010, 132, 12170.
[12] Y.-C. Lu, H. A. Gasteiger, Y. Shao-Horn, J. Am. Chem. Soc. 2011, 133, 19048.
[13] B. D. McCloskey, R. Scheffler, A. Speidel, D. S. Bethune, R. M. Shelby, A. C. Luntz, J. Am. Chem. Soc. 2011, 133, 18038.
[14] Z. Peng, S. A. Freunberger, Y. Chen, P. G. Bruce, Science 2012, 337, 563.
[15] H. D. Lim, H. Song, H. Gwon, K.-Y. Park, J. Kim, Y. Bae, H. Kim, S.-K. Jung, T. Kim, Y. H. Kim, X. Lepro, R. Ovalle-Robles, R. H. Baughman, K. Kang, Energy Environ. Sci. 2013, 6, 3570.
[16] E. Yilmaz, C. Yogi, K. Yamanaka, T. Ohta, H. R. Byon, Nano Lett. 2013, 13, 4679.
[17] Z. Jian, P. Liu, F. Li, P. He, X. Guo, M. Chen, H. Zhou, Angew. Chem., Int. Ed. 2014, 53, 442.
[18] Li, F. ; Y. Chen, D.-M. Tang, Z. Jian, C. Liu, D. Golberg, A. Yamada, H. Zhou, Energy Environ. Sci. 2014, 7, 1648.
[19] S. Ma, Y. Wu, J. Wang, Y. Zhang, Y. Zhang, X. Yan, Y. Wei, P. Liu, J. Wang, K. Jiang, S. Fan, Y. Xu, Z. Peng, Nano Lett. 2015, 15, 8084.
[20] D. W. Su, S. X. Dou, G. X. Wang, J. Mater. Chem. A 2015, 3, 18384.[21] S. Tong, M. Zheng, Y. Lu, Z. Lin, X. Zhang, P. He, H. Zhou, Chem.
Commun. 2015, 51, 7302.[22] F. Jiao, P. G. Bruce, Adv. Mater. 2007, 19, 657.[23] A. Débart, A. J. Paterson, J. Bao, P. G. Bruce, Angew. Chem. 2008,
120, 4597.[24] J. Wu, H. W. Park, A. Yu, D. Higgins, Z. Chen, J. Phys. Chem. C 2012,
116, 9427.
Adv. Energy Mater. 2018, 8, 1703513
www.advenergymat.dewww.advancedsciencenews.com
© 2018 WILEY-VCH Verlag GmbH & Co. KGaA, Weinheim1703513 (9 of 9)Adv. Energy Mater. 2018, 8, 1703513
[25] R. Black, J.-H. Lee, B. Adams, C. A. Mims, L. F. Nazar, Angew. Chem., Int. Ed. 2013, 52, 392.
[26] W.-H. Ryu, T.-H. Yoon, S. H. Song, S. Jeon, Y.-J. Park, I.-D. Kim, Nano Lett. 2013, 13, 4190.
[27] G. Zhao, R. Mo, B. Wang, L. Zhang, K. Sun, Chem. Mater. 2014, 26, 2551.
[28] R. Gao, J. Zhu, X. Xiao, Z. Hu, J. Liu, X. J. Liu, Phys. Chem. C 2015, 119, 4516.
[29] M. A. Schroeder, A. J. Pearse, A. C. Kozen, X. Chen, K. Gregorczyk, X. Han, A. Cao, L. Hu, S. B. Lee, G. W. Rubloff, M. Noked, Chem. Mater. 2015, 27, 5305.
[30] S. Ganapathy, Z. Li, M. S. Anastasaki, S. Basak, X.-F. Miao, K. Goubitz, H. W. Zandbergen, F. M. Mulder, M. Wagemaker, J. Phys. Chem. C 2016, 120, 18421.
[31] K. R. Yoon, G. Y. Lee, G. J.-W. Jung, N.-H. Kim, S. O. Kim, I.-D. Kim, Nano Lett. 2016, 16, 2076.
[32] P. Zhang, R. Wang, M. He, J. Lang, S. Xu, X. Yan, Adv. Funct. Mater. 2016, 26, 1354.
[33] P. Zhang, S. Zhang, M. He, J. Lang, A. Ren, S. Xu, X. Yan, Adv. Sci. 2017, 4, 1700172.
[34] S. H. Oh, L. F. Nazar, Adv. Energy Mater. 2012, 2, 903.[35] H. Wang, Y. Yang, Y. Liang, G. Zheng, Y. Li, Y. Cui, H. Dai, Energy
Environ. Sci. 2012, 5, 7931.[36] F. Li, R. Ohnishi, Y. Yamada, J. Kubota, K. Domen, A. Yamada,
H. Zhou, Chem. Commun. 2013, 49, 1175.[37] M. M. Ottakam Thotiyl, S. A. Freunberger, Z. Peng, Y. Chen, Z. Liu,
P. G. Bruce, Nat. Mater. 2013, 12, 1050.[38] J. Xie, X. Yao, I. P. Madden, D.-E. Jiang, L.-Y. Chou, C.-K. Tsung,
D. Wang, J. Am. Chem. Soc. 2014, 136, 8903.[39] D. Kundu, R. Black; B. Adams; K. Harrison, K. Zavadil, L. F. Nazar,
J. Phys. Chem. Lett. 2015, 6, 2252.[40] P. Sennu, M. Christy, V. Aravindan, Y.- G. Lee, K. S. Nahm, Y.-S. Lee,
Chem. Mater. 2015, 27, 5726.[41] F. Li, D.-M. Tang, T. Zhang, K. Liao, P. He, D. Golberg, A. Yamada,
H. Zhou, Adv. Energy Mater. 2015, 5, 1500294.[42] K. Liao, X. Wang, Y. Sun, D. Tang, M. Han, P. He, X. Jiang, T. Zhang,
H. Zhou, Energy Environ. Sci. 2015, 8, 1992.[43] D. Kundu, R. Black, E. J. Berg, L. F. Nazar, Energy Environ. Sci. 2015,
8, 1292.[44] W. Zhang, Y. Zeng, C. Xu, H. Tan, W. Liu, J. Zhu, N. Xiao,
H. H. Hng, J. Ma, H. E. Hoster, R. Yazami, Q. Yan, RSC Adv. 2012, 2, 8508.
[45] Z. Zhang, G. Zhou, W. Chen, Y. Lai, J. Li, ECS Electrochem. Lett. 2013, 3, A8.
[46] J. Lu, Y. Qin, P. Du, X. Luo, T. Wu, Y. Ren, J. Wen, D. J. Miller, J. T. Miller, K. Amine, RSC Adv. 2013, 3, 8276.
[47] F. Wang, X. Wu, C. Shen, Z. Wen, J. Solid State Electrochem. 2016, 20, 1831.
[48] K. Shimizu, L. Sepunaru, R. G. Compton, Chem. Sci. 2016, 7, 3364.[49] M. Sun, Y. Dong, G. Zhang, J. Qu, J. Li, J. Mater. Chem. A 2014, 2,
13635.[50] A. Gurlo, N. Bârsan, A. Oprea, M. Sahm, T. Sahm, U. Weimar, Appl.
Phys. Lett. 2004, 85, 2280.[51] M. V. Reddy, T. Yu, C. H. Sow, Z. X. Shen, C. T. Lim,
G. V. Subba Rao, B. V. R. Chowdari, Adv. Funct. Mater. 2007, 17, 2792.[52] S. Hao, B. Zhang, S. Ball, J. Wu, M. Srinivasan, Y. Huang, J. Mater.
Chem. A 2016, 4, 16569.[53] I. Gunasekara, S. Mukerjee, E. J. Plichta, M. A. Hendrickson,
K. M. Abraham, J. Electrochem. Soc. 2015, 162, A1055.[54] J. Han, X. Guo, Y. Ito, P. Liu, D. Hojo, T. Aida, A. Hirata, T. Fujita,
T. Adschiri, H. Zhou, M. Chen, Adv. Energy Mater. 2016, 6, 1601933.[55] D. Geng, N. Ding, T. S. A. Hor, S. W. Chien, Z. Liu, D. Wuu, X. Sun,
Y. Zong, Adv. Energy Mater. 2016, 6, 1502164.[56] B. D. McCloskey, A. Valery, A. C. Luntz, S. R. Gowda,
G. M. Wallraff, J. M. Garcia, T. Mori, L. E. Krupp, J. Phys. Chem. Lett. 2013, 4, 2989.
[57] J. Baltrusaitis, D. M. Cwiertny, V. H. Grassian, Phys. Chem. Chem. Phys. 2007, 9, 5542.
[58] K. P. C. Yao, D. G. Kwabi, R. A. Quinlan, A. N. Mansour, A. Grimaud, Y.-L. Lee, Y.-C. Lu, Y. Shao-Horn, J. Electrochem. Soc. 2013, 160, A824.
[59] Z. Li, S. Ganapathy, Y. Xu, J. R. Heringa, Q. Zhu, W. Chen, M. Wagemaker, Chem. Mater. 2017, 29, 1577.
[60] S. Ganapathy, B. D. Adams, G. Stenou, M. S. Anastasaki, K. Goubitz, X.-F. Miao, L. F. Nazar, M. Wagemaker, J. Am. Chem. Soc. 2014, 136, 16335.
[61] M. D. Radin, J. F. Rodriguez, F. Tian, D. J. Siegel, J. Am. Chem. Soc. 2012, 134, 1093.
[62] A. G. Tamirat, J. Rick, A. A. Dubale, W.-N. Su, B.-J. Hwang, Nanoscale Horiz. 2016, 1, 243.
[63] A. G. B. Williams, M. M. Scherer, Environ. Sci. Technol. 2004, 38, 4782.
[64] M. Dai, L. Zhao, H. Gao, P. Sun, F. Liu, S. Zhang, K. Shimanoe, N. Yamazoe, G. Lu, ACS Appl. Mater. Interfaces 2017, 9, 8919.


![Sn- AND 57Fe- MÖSSBAUER INVESTIGATION OF xSnO O ... · 2 119Sn- and 57Fe- Mössbauer investigation of xSnO 2-[(1-x)[α-Fe2O3] nanoparticle system 693 the important role of Sn4+ ions](https://img.pdfslide.us/doc/110x75/5c085d3a09d3f23a458c0090/sn-and-57fe-moessbauer-investigation-of-xsno-o-2-119sn-and-57fe-moessbauer.jpg)