Embed Size (px)
Citation preview

FE STEM DATA PROJECT:NOVEMBER 2012 REPORT

FE STEM data project: November 2012 reportAuthor: Matthew Harrison, Director, Engineering and Education, Royal Academy of Engineering
ISBN: 1-903496-94-2
Copyright, Royal Academy of Engineering, 2012
Available to download from: www.thedataservice.org.uk/statistics/ other_statistics_and_research
Acknowledgements
The contributions made by those who have participated in the FE STEM data project since 2011 are acknowledged with particular thanks to
Jane Imrie (NCETM), Daniel Sandford Smith (Gatsby Charitable Foundation), Ruth Wright (Engineering Council) who have helped with the classifications used in this report and Rhys Morgan (Royal Academy of Engineering) who provided the geographical mapping software used.

Royal Academy of Engineering
Introduction 1
Notes 3
Section 1 Overview of STEM in the FE and skills sector in England 4
Section 2 Year on year trend analysis 6
Section 3 Young people aged 16–18 years 9
Section 4 Analysis of apprenticeships 11
Section 5 Diversity 13
Section 6 Access to higher education courses 15
Section 7 Adults over the age of 25 16
Section 8 Regional variations 17
Table of contents

FE STEM data project: November 2012 report
1
The term ‘STEM’ groups together the subjects of Science, Technology, Engineering and Mathematics. These subjects account for a significant proportion of the qualifications achieved in the FE and skills sector and have been prioritised by successive UK governments on account of the important role they play in the economy1.
The Royal Academy has led the FE STEM Data Project since its inception in 2010 and has quantified the contribution to STEM education and skills made by the FE and skills system in England through its 20102 and 20113 reports. This latest report augments previous analysis with a further year of data (2010/2011) and looks at key features in the data in greater depth.
The general process undertaken for the FE STEM Data project is:
1. To classify the qualifications included in the Learning Aims Database as variously S, S-related, T, T-related, E, E-related, M, M-related, Numeracy and non-STEM. This was undertaken from scratch for the 2010 report and the same classification reused for the 2011 report. A full updating of the classification was undertaken for this report, comprising more than 15,000 qualifications. In addition, the Apprenticeship frameworks provided through the National Apprenticeship Service have also been classified for the first time in this report.
2. To use the classifications above and the data from both the Individualised Learner Record and the Schools QSR datasets to produce a single Microsoft SSAS OLAP Data Cube that can be accessed using conventional spreadsheet software. The granularity of the Data Cube is at Aim level, with the data comprising Learning Aims for the academic years 2007/2008 through to 2010/2011.
3. To analyse the Data Cube to produce charts and figures that exemplify the extent and nature of STEM provision in the FE and skills sector in England using data for 16– to 18-year-olds in schools for comparison as appropriate.
Introduction
1 Matthew Harrison (2012), Jobs and growth: the importance of engineering skills in the UK economy, Royal Academy of Engineering www.raeng.org.uk/jobsandgrowth
2 Andy Frost, Clive Greatorex, Matthew Harrison, David Mason (2010), FE and Skills STEM Data Summary report, October 2010, Blue Alumni / Royal Academy of Engineering www.thedataservice.org.uk/statistics/other_statistics_and_research
3 Matthew Harrison (project leader) 2011, FE STEM Data Project July 2011 report, Royal Academy of Engineering www.thedataservice.org.uk/statistics/other_statistics_and_research

2 Royal Academy of Engineering
The Data Cube holds the following dimensions:
n STEM categories (Science, Technology, Engineering, Maths, Numeracy)
n STEM-related qualifications
n Funding stream
n Qualification framework
n Age bands
n Learner attributes including gender, ethnicity, learning difficulty and/or disability, prior attainment level. It should be noted that prior attainment level are not high quality data, but are better for those on Level 2 and Level 3 qualifications than other Learning Aims.
n Institution attributes including type, government office region, subregion
n Academic year
n Qualification level
n Qualification name
n Local education authority
n Provider name

FE STEM data project: November 2012 report
3
n S, T, E and M qualifications are taken to be those that contain learning outcomes that are deeply rooted in science, mathematics or engineering and/or are of a ‘technical’ or ‘technology-application/use’ nature.
n S, T, E and M qualifications are deemed distinct from other qualifications because they can, for those who wish it, provide the required foundation for progression into further study or employment in an S, T, E or M related field.
n To take account of the modular nature of some qualifications, they are deemed to lie within S,T,E or M when the majority of the assessment objectives are science-, technology-, engineering- or mathematics-focused (and /or the qualification is recognised as a pre-requisite for progression in S,T,E or M).
n They are deemed to be S-, T-, E- or M-related when science, technology, engineering or mathematics feature in many learning objectives (and/or the qualification provides a degree of learning that will aid progression in S, T, E or M).
n They are deemed to be outside of S, T, E or M if S, T, E or M does not feature in at least some learning objectives for all learners (not just those who take S, T, E or M related options within the qualification).
n By convention adopted by the FE STEM Data project, qualifications allied to medicine (such as nursing) and qualifications allied to agriculture and animal keeping are deemed outside of STEM.
n Mathematics has been further subdivided into mathematics and numeracy in order to distinguish the ‘life skills’ associated with numeracy qualifications from mathematics as a pure/applied discipline.
n There is a significant quantity of both mathematics and numeracy embedded in qualifications of all types and in a wide range of subjects. This is not accounted for in the analysis presented here.
n Unless explicitly stated otherwise, charts show data for qualifications achieved by learners at all levels in the FE and skills sector in England for the academic year 2010/11.
n ‘Achievements’ are defined as the number of achievements for a particular qualification in a given year and is the preferred measure because it describes what the FE and skills sector has produced in that year. However, care should be taken when considering achievement data aggregated across more than one qualification as this will not necessarily equate to the number of learners because learners can achieve more than one qualification in a given year. For robust comparison with schools data it was necessary to use ‘Completions’ and where this has been done it is stated in the charts. A full definition of the terms ‘Enrolments’, ‘Completions’ and ‘Achievements’ can be found in Section 3 of the October 2010 report.
n Unless explicitly stated otherwise, charts which represent data for all of STEM show combined data for S, T, E and M and ‘S-, T-, E- and M-related’ qualifications.
n “Hybrid” qualifications are those that are classified as combinations of S, T, E, M and numeracy.
n When interpreting the data it should be noted that learners cross borders and that some local authorities (LAs) collaborate on provision.
n Regional and LA data are associated with the place where learning took place.
n For reference, the following are examples of the various ‘Levels’ of qualifications quoted in this report: ‘Level 1’ – GCSE grades D–G; ‘Level 2’ – GCSE grades A*–C, Intermediate Apprenticeships; ‘Level 3’ – A Levels, Advanced Apprenticeships; ‘Level 4’ and above – Higher Apprenticeship, HNC/HND and Foundation Degree.
Notes
4 Royal Academy of Engineering
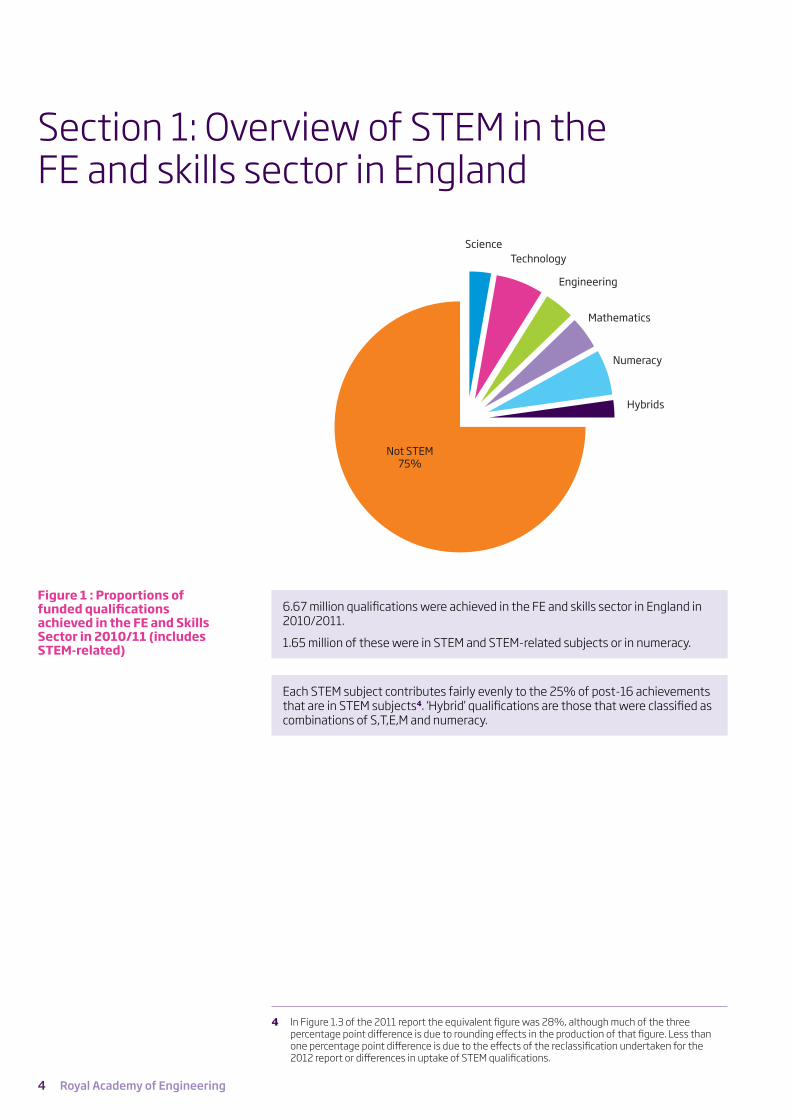
Section 1: Overview of STEM in the FE and skills sector in England
6.67 million qualifications were achieved in the FE and skills sector in England in 2010/2011.
1.65 million of these were in STEM and STEM-related subjects or in numeracy.
Each STEM subject contributes fairly evenly to the 25% of post-16 achievements that are in STEM subjects4. ‘Hybrid’ qualifications are those that were classified as combinations of S,T,E,M and numeracy.
4 In Figure 1.3 of the 2011 report the equivalent figure was 28%, although much of the three percentage point difference is due to rounding effects in the production of that figure. Less than one percentage point difference is due to the effects of the reclassification undertaken for the 2012 report or differences in uptake of STEM qualifications.
ScienceTechnology
Engineering
Mathematics
Numeracy
Hybrids
Not STEM 75%
Figure 1 : Proportions of funded qualifications achieved in the FE and Skills Sector in 2010/11 (includes STEM-related)

FE STEM data project: November 2012 report
5
The number of qualifications achieved at each qualification level varies between STEM subjects. Numeracy qualifications are predominantly achieved at lower levels; technology, engineering and mathematics at lower and intermediate levels (Level 2); and science and hybrid qualifications at advanced level (Level 3).
Relatively few STEM qualifications at Level 4 and above are funded by the Skills Funding Agency in the FE and skills sector in England and therefore few achievements at Level 4 and above are shown in this report. Many more, funded in the Higher Education sector through the Higher Education Funding Council and through the Student Loan Company are achieved in England but are not shown here5.
5 These are routinely reported by the Higher Education Statistical Agency
n Entry level
n Level 1
n Level 2
n Level 3
n Level 4 and above
n Mixed, unclassified
300,000
250,000
200,000
150,000
100,000
50,000
0
Science
Technology
Engineering
Mathematic
s
Numeracy
Hybrids
Figure 2 : Numbers of funded STEM
(including STEM-related) qualifications in the FE and
skills sector 2010/11

6 Royal Academy of Engineering
Section 2: Year on year trend analysis
This report provides the first opportunity to inspect trends as data have now been collected over four years. Care should be taken with trend analysis but it does appear that over the period 2007–2011:
n The number of achievements in science, engineering and hybrids has held.
n The number of achievements in technology qualifications has dropped significantly.
n The number of achievements in mathematics and numeracy varies between years but with no obvious overall trend.
n 2007/08
n 2008/09
n 2009/10
n 2010/11
600,000
500,000
400,000
300,000
200,000
100,000
0Science Technology Engineering Mathematics Numeracy Hybrids
Figure 3: Numbers of funded STEM (including STEM-related) qualifications achieved in the FE and skills sector over four academic years

FE STEM data project: November 2012 report
7
Comparing the number of STEM achievements with those in non-STEM subjects shows that trends for STEM subjects broadly follow those for non-STEM subjects. However, growth in non-STEM subjects seen at Level 2 is not replicated for STEM subjects.
Section 2: Year on year trend analysis
n 2007/08
n 2008/09
n 2009/10
n 2010/11
2,000,0001,800,0001,600,0001,400,0001,200,0001,000,000
800,000600,000400,000200,000
-
Entr
y Le
vel:
STEM
Entr
y Le
vel:
Not
STE
M
Leve
l 1: S
TEM
Leve
l 1: N
ot S
TEM
Leve
l 2: S
TEM
Leve
l 2: N
ot S
TEM
Leve
l 3: S
TEM
Leve
l3: N
ot S
TEM
Leve
l 4+
: STE
M
Leve
l 4+
: Not
STE
M
Mix
ed, u
ncla
ssifi
ed: S
TEM
Mix
ed, u
ncla
ssifi
ed: N
ot S
TEM
Figure 4: Numbers of funded STEM (including STEM-related)
qualifications achieved in the FE and skills sector over four
academic years
8 Royal Academy of Engineering
6 Office of National Statistics
7 Association of Colleges (AoC), 2012 College Enrolment Survey, September 2012
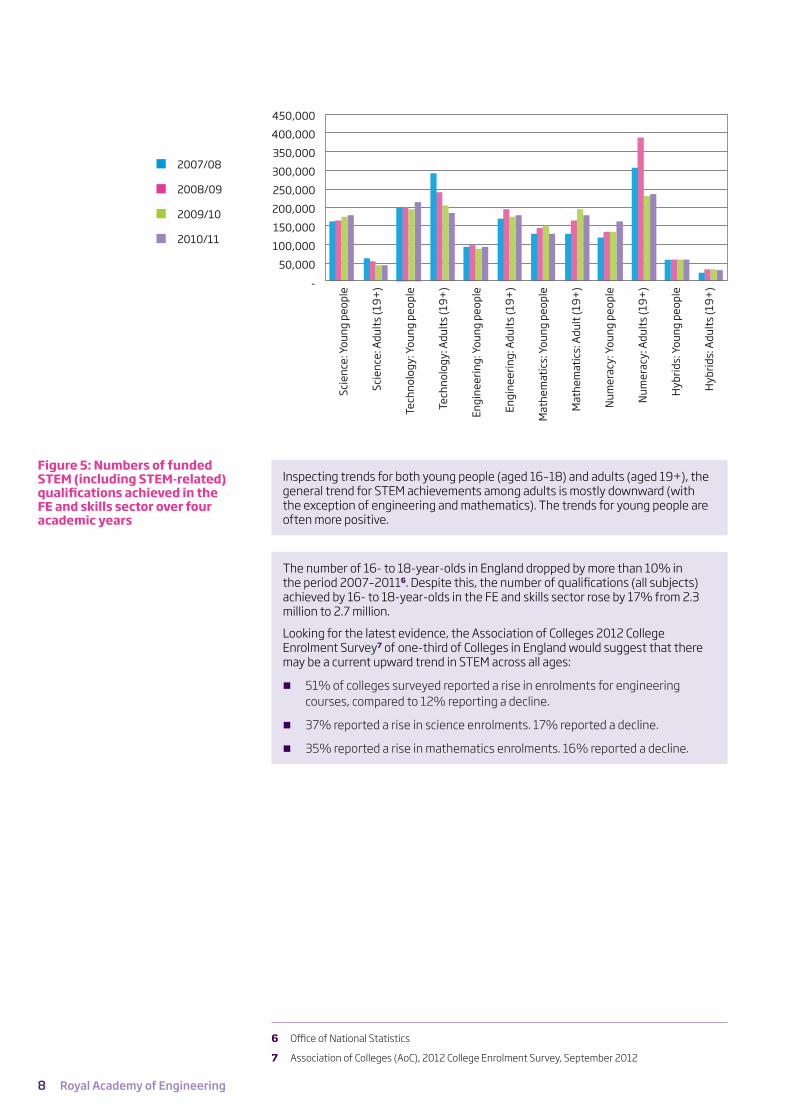
Inspecting trends for both young people (aged 16–18) and adults (aged 19+), the general trend for STEM achievements among adults is mostly downward (with the exception of engineering and mathematics). The trends for young people are often more positive.
The number of 16- to 18-year-olds in England dropped by more than 10% in the period 2007–20116. Despite this, the number of qualifications (all subjects) achieved by 16- to 18-year-olds in the FE and skills sector rose by 17% from 2.3 million to 2.7 million.
Looking for the latest evidence, the Association of Colleges 2012 College Enrolment Survey7 of one-third of Colleges in England would suggest that there may be a current upward trend in STEM across all ages:
n 51% of colleges surveyed reported a rise in enrolments for engineering courses, compared to 12% reporting a decline.
n 37% reported a rise in science enrolments. 17% reported a decline.
n 35% reported a rise in mathematics enrolments. 16% reported a decline.
n 2007/08
n 2008/09
n 2009/10
n 2010/11
450,000
400,000
350,000
300,000
250,000
200,000
150,000
100,000
50,000
-
Scie
nce:
You
ng p
eopl
e
Scie
nce:
Adu
lts
(19+
)
Tech
nolo
gy: Y
oung
peo
ple
Tech
nolo
gy: A
dult
s (1
9+)
Engi
neer
ing:
You
ng p
eopl
e
Engi
neer
ing:
Adu
lts
(19+
)
Mat
hem
atic
s: Y
oung
peo
ple
Mat
hem
atic
s: A
dult
(19+
)
Num
erac
y: Y
oung
peo
ple
Num
erac
y: A
dult
s (1
9+)
Hyb
rids:
You
ng p
eopl
e
Hyb
rids:
Adu
lts
(19+
)
Figure 5: Numbers of funded STEM (including STEM-related) qualifications achieved in the FE and skills sector over four academic years

FE STEM data project: November 2012 report
9
Science 25%
Technology
Engineering
Mathematics
Numeracy
Hybrids
Not STEM 51%
1.37 million qualifications were achieved by 16- to 18-year-olds in schools in England in 2010/2011. In the FE and skills sector it was 3.07 million.
In schools, 667,000 of these were in STEM and STEM-related subjects or in Numeracy. In the FE and skills sector it was 956,000.
In marked contrast to STEM completions in the FE and skills sector, in schools individual STEM subjects contribute in different degrees to the 49% of 16–18 completions that are in STEM subjects. Much higher proportions of completions in science and mathematics and much lower proportions of completions in engineering and numeracy are evident.
FE and skills 59%
Schools 41%
Section 3: Young people aged 16–18 years
Figure 6: Proportions of funded qualifications
completed in schools in England in 2010/11 (includes
STEM-related)
Figure 7: Proportions of funded STEM qualifications
completed by 16- to 18-year-olds in England 2010/11
(1,623,000 total)

10 Royal Academy of Engineering
STEM completions in schools are dominated by Level 3 completions, particularly in science.
n Entry level
n Level 1
n Level 2
n Level 3
n Level 4 and above
n Mixed, unclassified
400,000
350,000
300,000
250,000
200,000
150,000
100,000
50,000
0
Science
Technology
Engineering
Mathematic
s
Numeracy
Hybrids
Figure 9: Numbers of funded STEM (including STEM-related) qualifications completed by 16- to 18-year-olds in the FE and skills sector 2010/11
n Entry level
n Level 1
n Level 2
n Level 3
n Level 4 and above
n Mixed, unclassified
180,000
160,000
140,000
120,000
100,000
80,000
60,000
40,000
20,000
0
Science
Technology
Engineering
Mathematic
s
Numeracy
Hybrids
Figure 8: Numbers of funded STEM (including STEM-related) qualifications completed by students aged 16+ in schools in England 2010/11
In the FE and skills sector there is a broader mix of levels, although Level 3 still dominates in science and also in technology.
FE STEM data project: November 2012 report
11
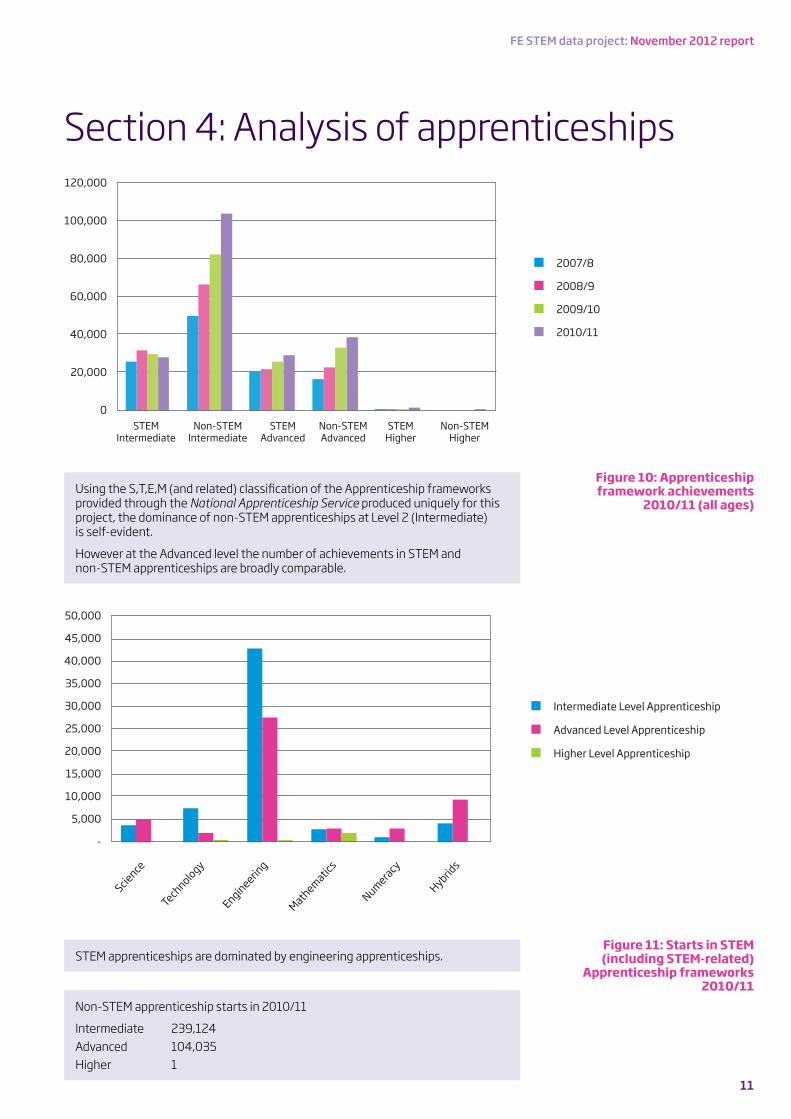
Using the S,T,E,M (and related) classification of the Apprenticeship frameworks provided through the National Apprenticeship Service produced uniquely for this project, the dominance of non-STEM apprenticeships at Level 2 (Intermediate) is self-evident.
However at the Advanced level the number of achievements in STEM and non-STEM apprenticeships are broadly comparable.
Section 4: Analysis of apprenticeships
n 2007/8
n 2008/9
n 2009/10
n 2010/11
120,000
100,000
80,000
60,000
40,000
20,000
0STEM
IntermediateNon-STEM
IntermediateSTEM
AdvancedNon-STEMAdvanced
STEMHigher
Non-STEMHigher
Figure 10: Apprenticeship framework achievements
2010/11 (all ages)
Figure 11: Starts in STEM (including STEM-related)
Apprenticeship frameworks 2010/11
n Intermediate Level Apprenticeship
n Advanced Level Apprenticeship
n Higher Level Apprenticeship
50,000
45,000
40,000
35,000
30,000
25,000
20,000
15,000
10,000
5,000
-
Science
Technology
Engineering
Mathematic
s
Numeracy
Hybrids
STEM apprenticeships are dominated by engineering apprenticeships.
Non-STEM apprenticeship starts in 2010/11
Intermediate 239,124Advanced 104,035Higher 1

12 Royal Academy of Engineering
The FE STEM Data project approach to the classification of apprenticeships both by framework and by the qualifications approved for frameworks allows unique insight into the provision of technical qualifications. More engineering qualifications ‘approved’ for Apprenticeship frameworks are achieved outside of Apprenticeship frameworks than within, with the strongest effect being due to the achievements of adults at Level 2.
42% of the ‘approved’ engineering qualifications achieved outside of frameworks were NVQ-type qualifications. The remainder were VRQ-type qualifications as this particular analysis does not include Key Skills or Functional Skills qualifications.
STEM apprenticeships are recognised for their high wage returns8 and for their role in transition to Registered Technician status9. STEM qualifications offer significant wage value, particularly when used in SET occupations10. Therefore the labour market reacts positively to the type of qualifications being analysed here. Reasons for the relatively high number of ‘approved’ engineering qualifications being taken outside of frameworks are unclear and need further examination. It may be that leaners or their employers are selecting only some of the qualifications in a particular framework or that they are adding to approved qualifications gained earlier or elsewhere. However, it is clear, when policy makers take stock of the engineering skills pipeline, both framework and non-framework achievements have to be assessed.
8 A recent example – NAO (2012), National Audit office report on adult Apprenticeship, February 2012
9 Technician Council (2012), Professional Technician: the future, Technician Council, 2012 (available to download from www.professional-technician.org.uk)
10 Charley Greenwood, Matthew Harrison, Anna Vignoles (2011), Institute of Education / Royal Academy of Engineering http://tinyurl.com/ambfecp
Figure 12: Funded and unfunded achievements in engineering and engineering-related qualifications approved for Apprenticeship frameworks, 2010/11
n Not achieved in framework
n Achieved in framework
60,000
50,000
40,000
30,000
20,000
10,000
-
Under19
Level 1
Under19
Level 2
Under19
Level 3
Under19
Level 4+
19+Level 1
19+Level
2
19+Level
3
19+Level
4+

FE STEM data project: November 2012 report
13
The under-representation of women in engineering is well known as clearly evident in the FE STEM data. However, their historical dominance of technology qualifications is a new finding – as is the downward trend in recent years.
The finding that the hybrid qualifications are taken mostly by men is explained by the prevalence of engineering in these qualifications.
The gender balance in other subjects is more even, with trends for men being broadly similar to the trends for women.
In 2010/11 the percentage of achievements in non-STEM subjects by women of all ages was 57% (2.82 million Female, 2.16 million Male).
Section 5: Diversity
Figure 13: Funded achievements in STEM qualifications, FE and
skills sector
n Science
n Technology
n Engineering
n Mathematics
n Numeracy
n Hybrids
10
9
8
7
6
5
4
3
2
1
0
% o
f all
achi
evem
ents
2007/08 Female
2007/08 Male
2008/09 Female
2008/09 Male
2009/10 Female
2009/10 Male
2010/11 Female
2010/11 Male
Figure 14: Funded STEM achievements in FE and skills sector
n 2007/08
n 2008/09
n 2009/10
n 2010/11
9
8
7
6
5
4
3
2
1
0
% o
f all
achi
evem
ents
Asi
an/ A
sian
Brit
ish
Blac
k/Af
rican
/Ca
ribbe
an/
Blac
k Br
itis
h
Mix
ed/ m
ulti
ple
ethn
ic g
roup
Not
kno
wn/
no
t pro
vide
d
Oth
er e
thni
c gro
up
(incl
. Chi
nese
)
14 Royal Academy of Engineering
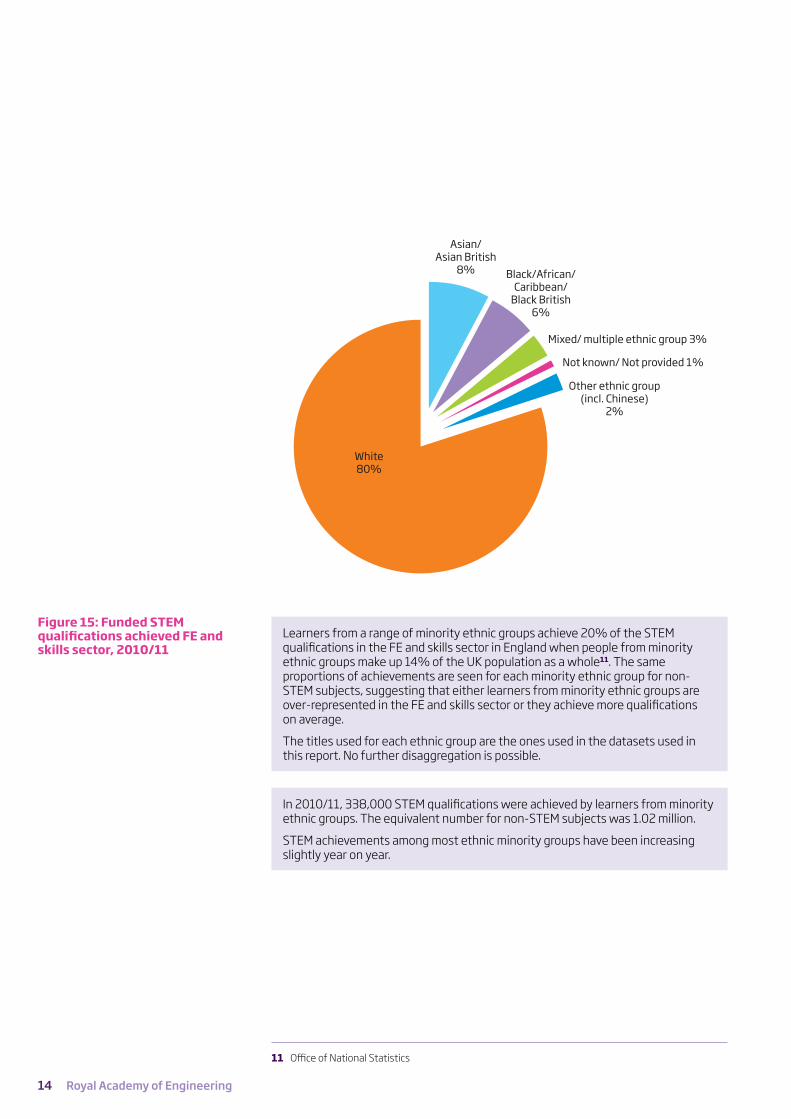
Learners from a range of minority ethnic groups achieve 20% of the STEM qualifications in the FE and skills sector in England when people from minority ethnic groups make up 14% of the UK population as a whole11. The same proportions of achievements are seen for each minority ethnic group for non-STEM subjects, suggesting that either learners from minority ethnic groups are over-represented in the FE and skills sector or they achieve more qualifications on average.
The titles used for each ethnic group are the ones used in the datasets used in this report. No further disaggregation is possible.
In 2010/11, 338,000 STEM qualifications were achieved by learners from minority ethnic groups. The equivalent number for non-STEM subjects was 1.02 million.
STEM achievements among most ethnic minority groups have been increasing slightly year on year.
Figure 15: Funded STEM qualifications achieved FE and skills sector, 2010/11
Asian/ Asian British
8% Black/African/ Caribbean/
Black British 6%
Mixed/ multiple ethnic group 3%
Not known/ Not provided 1%
Other ethnic group (incl. Chinese)
2%
White 80%
11 Office of National Statistics

FE STEM data project: November 2012 report
15
The achievement of Level 3 STEM qualifications in the FE and skills sector enabling progression to STEM higher education has been analysed in previous reports.
This is augmented here with an analysis of STEM Access to HE courses.
By way of comparison, access to HE courses in nursing
2007/08 1,082 achievements2008/09 2,0562009/10 2,8762010/11 3,105
Section 6: Access to higher education courses
Figure 16: Funded achievements in Access to HE
courses, FE and skills sector, STEM and STEM-related
subjects
n 2007/08
n 2008/09
n 2009/10
n 2010/11
3,500
3,000
2,500
2,000
1,500
1,000
500
0Science Technology Engineering Mathematics Hybrids
16 Royal Academy of Engineering
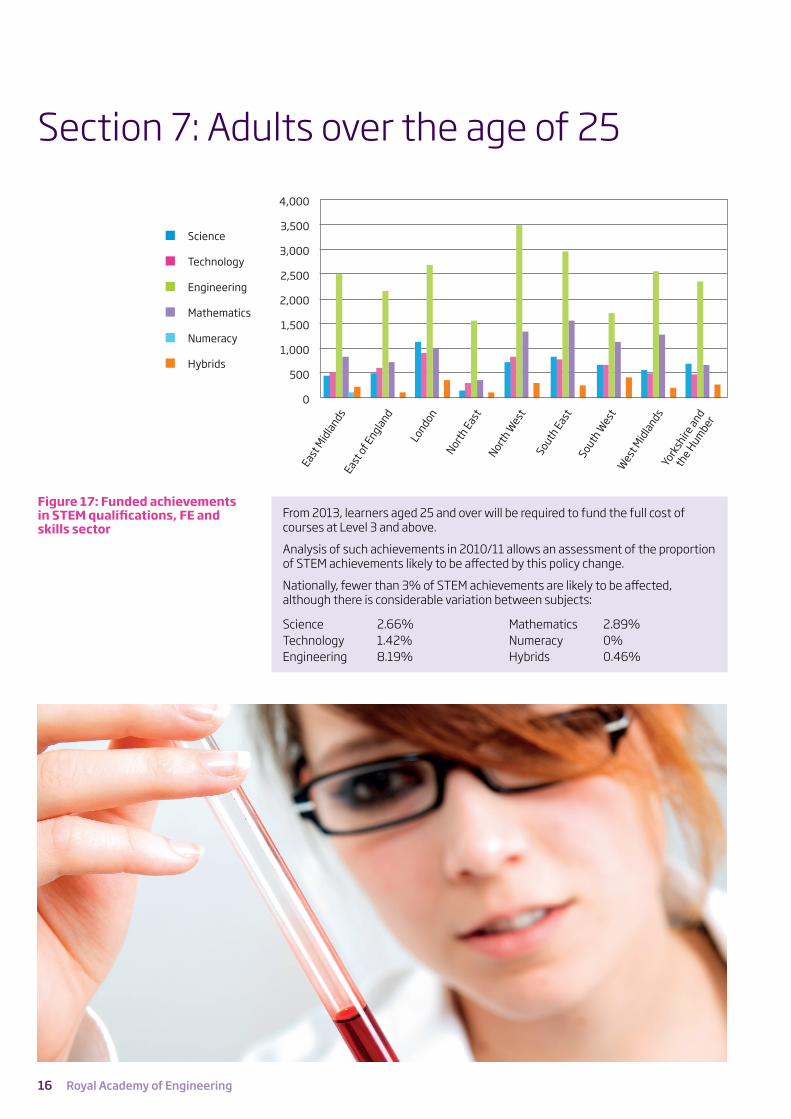
From 2013, learners aged 25 and over will be required to fund the full cost of courses at Level 3 and above.
Analysis of such achievements in 2010/11 allows an assessment of the proportion of STEM achievements likely to be affected by this policy change.
Nationally, fewer than 3% of STEM achievements are likely to be affected, although there is considerable variation between subjects:
Science 2.66%Technology 1.42%Engineering 8.19%
Mathematics 2.89%Numeracy 0%Hybrids 0.46%
Figure 17: Funded achievements in STEM qualifications, FE and skills sector
n Science
n Technology
n Engineering
n Mathematics
n Numeracy
n Hybrids
4,000
3,500
3,000
2,500
2,000
1,500
1,000
500
0
East M
idla
ndsEast
of Engla
nd
London
North East
North W
est
South East
South W
estW
est M
idla
nds
Section 7: Adults over the age of 25
Yorksh
ire and
the H
umber
FE STEM data project: November 2012 report
17
Section 8: Regional variations
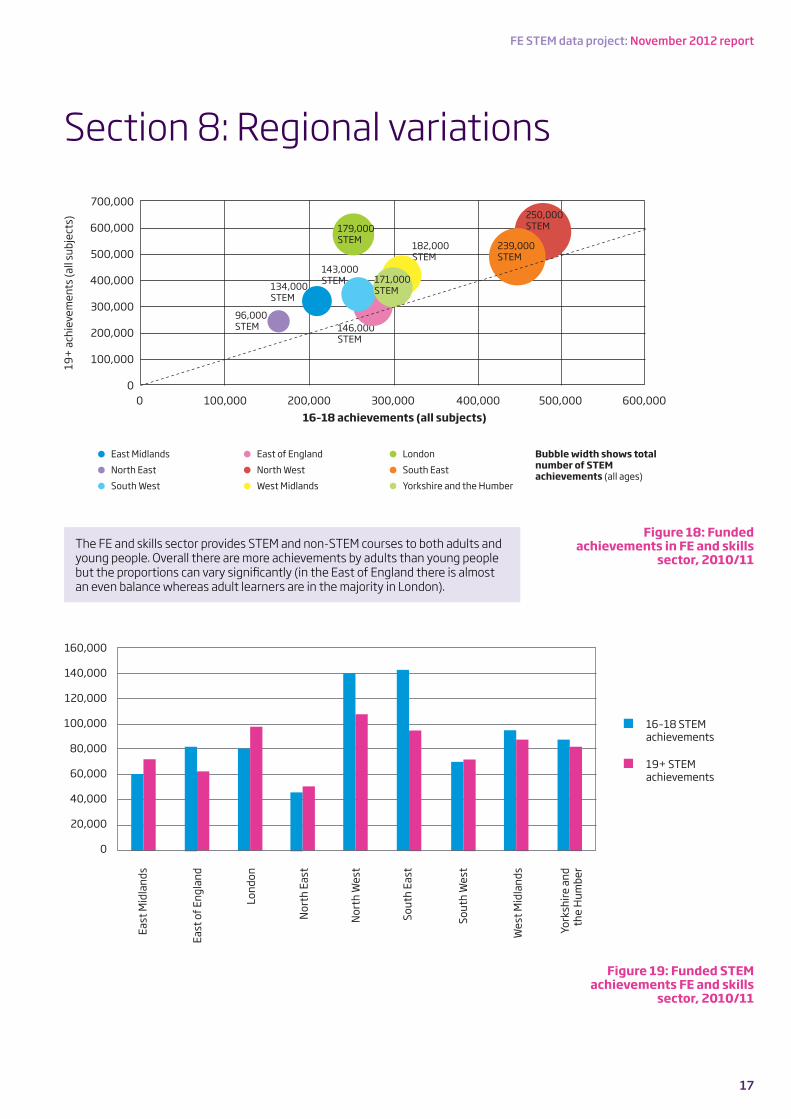
Figure 18: Funded achievements in FE and skills
sector, 2010/11The FE and skills sector provides STEM and non-STEM courses to both adults and young people. Overall there are more achievements by adults than young people but the proportions can vary significantly (in the East of England there is almost an even balance whereas adult learners are in the majority in London).
Figure 19: Funded STEM achievements FE and skills
sector, 2010/11
n 16–18 STEM achievements
n 19+ STEM achievements
160,000
140,000
120,000
100,000
80,000
60,000
40,000
20,000
0
East
Mid
land
s
East
of E
ngla
nd
Lond
on
Nor
th E
ast
Nor
th W
est
Sout
h Ea
st
Sout
h W
est
Wes
t Mid
land
s
York
shire
and
th
e H
umbe
r
● East Midlands
● North East
● South West
● East of England
● North West
● West Midlands
● London
● South East
● Yorkshire and the Humber
Bubble width shows total number of STEM achievements (all ages)
700,000
600,000
500,000
400,000
300,000
200,000
100,000
00 100,000 200,000 300,000 400,000 500,000 600,000
16–18 achievements (all subjects)
96,000 STEM
134,000 STEM
143,000 STEM
179,000 STEM
146,000 STEM
182,000 STEM
239,000 STEM
250,000 STEM
171,000 STEM
19+
ach
ieve
men
ts (a
ll su
bjec
ts)
18 Royal Academy of Engineering
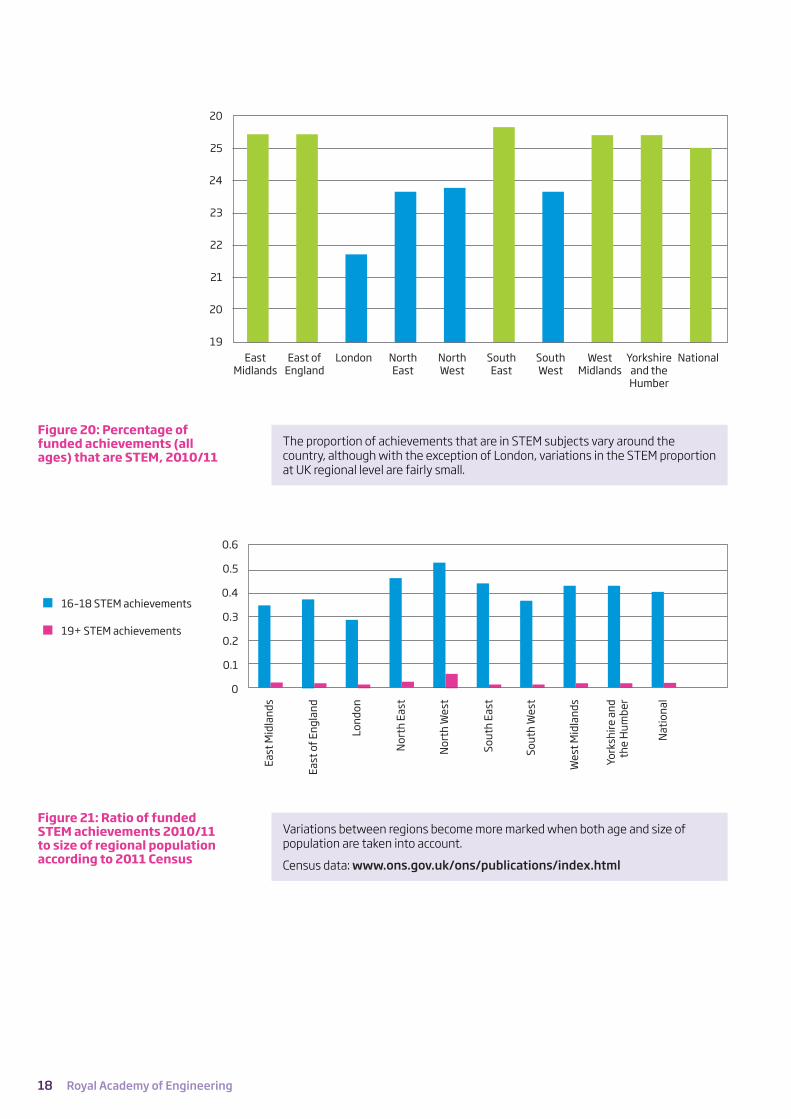
The proportion of achievements that are in STEM subjects vary around the country, although with the exception of London, variations in the STEM proportion at UK regional level are fairly small.
Figure 20: Percentage of funded achievements (all ages) that are STEM, 2010/11
20
25
24
23
22
21
20
19East
MidlandsEast of
EnglandLondon North
EastNorth West
South East
South West
West Midlands
Yorkshire and the Humber
National
Figure 21: Ratio of funded STEM achievements 2010/11 to size of regional population according to 2011 Census
n 16–18 STEM achievements
n 19+ STEM achievements
0.6
0.5
0.4
0.3
0.2
0.1
0
East
Mid
land
s
East
of E
ngla
nd
Lond
on
Nor
th E
ast
Nor
th W
est
Sout
h Ea
st
Sout
h W
est
Wes
t Mid
land
s
York
shire
and
th
e H
umbe
r
Nat
iona
l
Variations between regions become more marked when both age and size of population are taken into account.
Census data: www.ons.gov.uk/ons/publications/index.html
FE STEM data project: November 2012 report
19
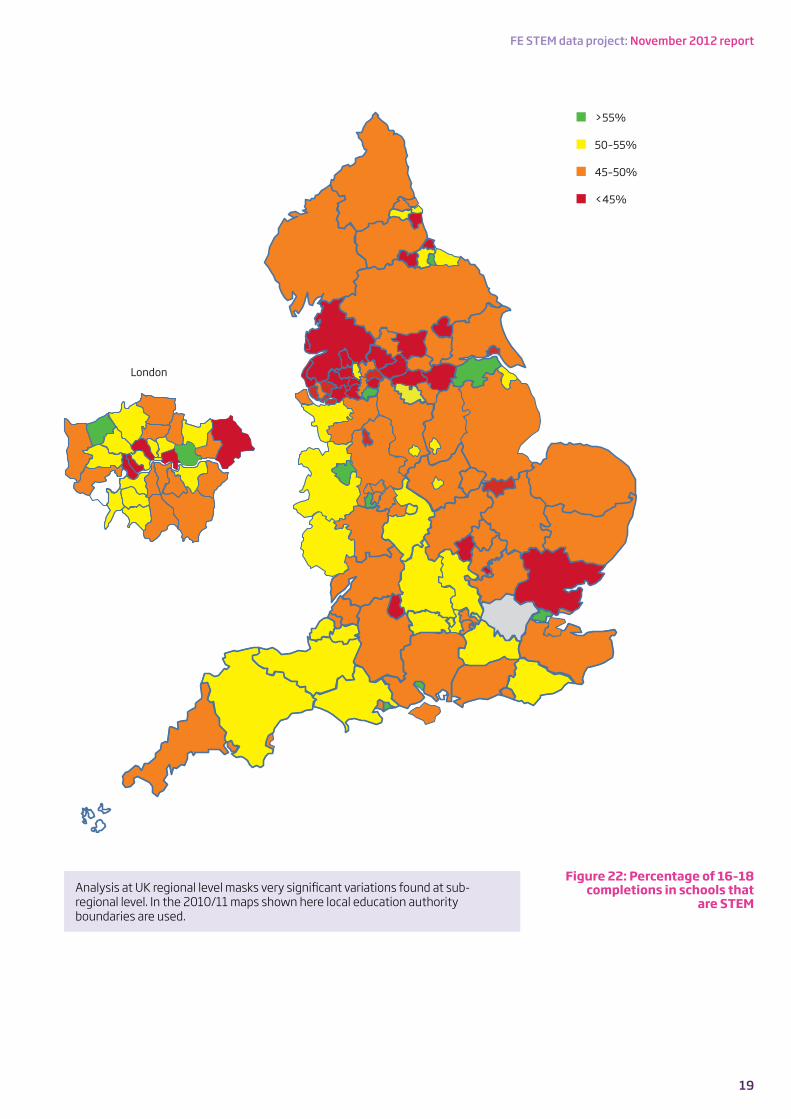
Analysis at UK regional level masks very significant variations found at sub-regional level. In the 2010/11 maps shown here local education authority boundaries are used.
Figure 22: Percentage of 16–18 completions in schools that
are STEM
n >55%
n 50–55%
n 45–50%
n <45%
London

20 Royal Academy of Engineering
Low proportions of STEM in schools are not always compensated for by the STEM achievements of young people in the FE and skills system.
Figure 23: Percentage of 16–18 achievements in FE and skills sector that are STEM
n >35%
n 30–35%
n 25–30%
n <25%
London
FE STEM data project: November 2012 report
21
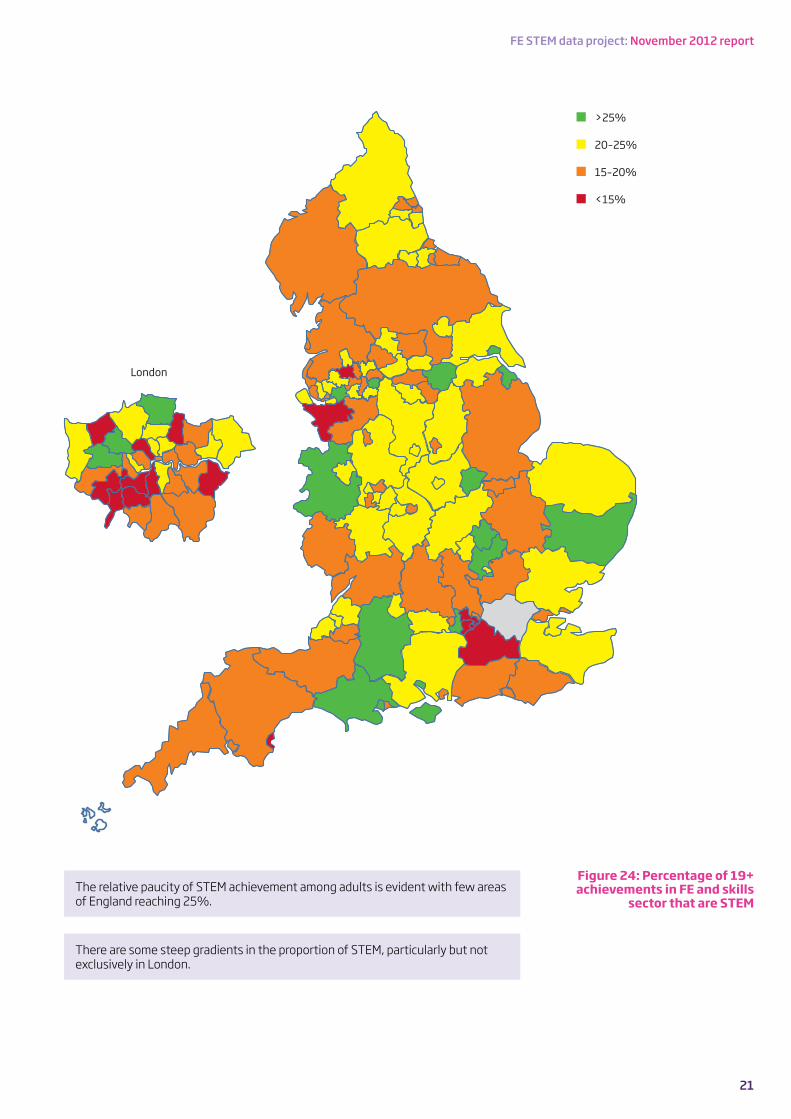
The relative paucity of STEM achievement among adults is evident with few areas of England reaching 25%.
There are some steep gradients in the proportion of STEM, particularly but not exclusively in London.
Figure 24: Percentage of 19+ achievements in FE and skills
sector that are STEM
n >25%
n 20–25%
n 15–20%
n <15%
London

22 Royal Academy of Engineering

FE STEM data project: November 2012 report
23

As the UK’s national academy for engineering, we bring together the most successful and talented engineers from across the engineering sectors for a shared purpose: to advance and promote excellence in engineering. We provide analysis and policy support to promote the UK’s role as a great place from which to do business. We take a lead on engineering education and we invest in the UK’s world class research base to underpin innovation. We work to improve public awareness and understanding of engineering. We are a national academy with a global outlook and use our international partnerships to ensure that the UK benefits from international networks, expertise and investment.
The Academy’s work programmes are driven by four strategic challenges, each of which provides a key contribution to a strong and vibrant engineering sector and to the health and wealth of society:
Drive faster and more balanced economic growth
Foster better education and skills
Lead the profession
Promote engineering at the heart of society
Royal Academy of Engineering3 Carlton House Terrace, London SW1Y 5DG
Tel: +44 (0)20 7766 0600www.raeng.org.ukRegistered charity number 293074 Please recycle this brochure (the cover is treated with a recyclable laminate)