Embed Size (px)
Citation preview

FDI in the Retail Sector:
Some Implications for Host Countries
Beata Javorcik
Professor of Economics
University of Oxford

Outline
Introductory remarks
Implications for the retail sector
Implications for the supplying industries
Two case studies
Wal-Mart in Mexico
Romania
Opening of retail sector to FDI has led to emergence of global retail chains
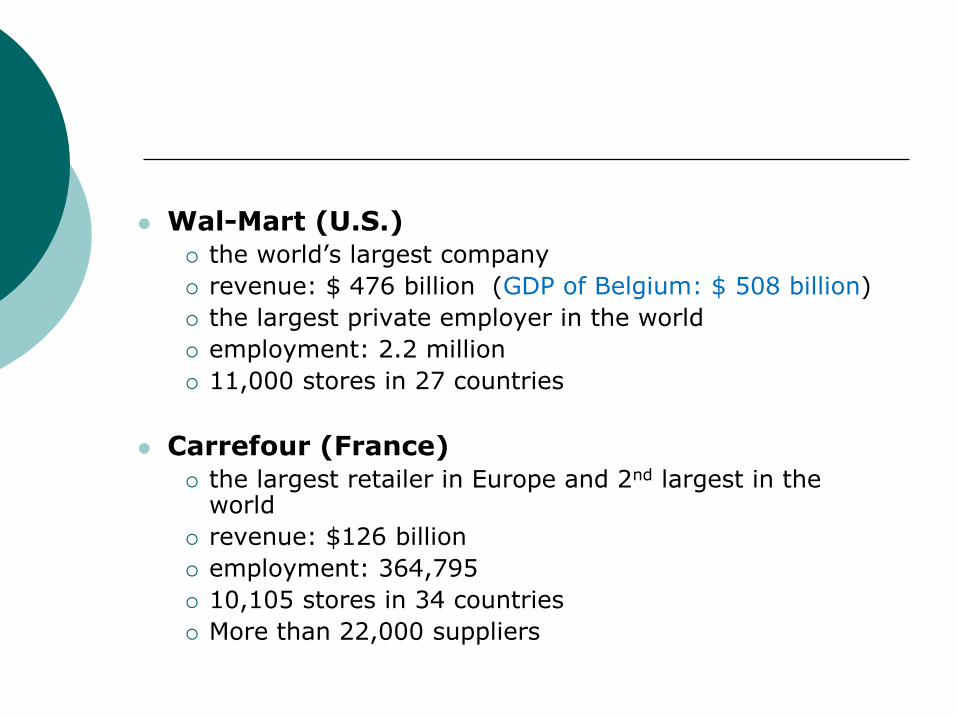
Wal-Mart (U.S.) the world’s largest company
revenue: $ 476 billion (GDP of Belgium: $ 508 billion)
the largest private employer in the world
employment: 2.2 million
11,000 stores in 27 countries
Carrefour (France) the largest retailer in Europe and 2nd largest in the
world
revenue: $126 billion
employment: 364,795
10,105 stores in 34 countries
More than 22,000 suppliers
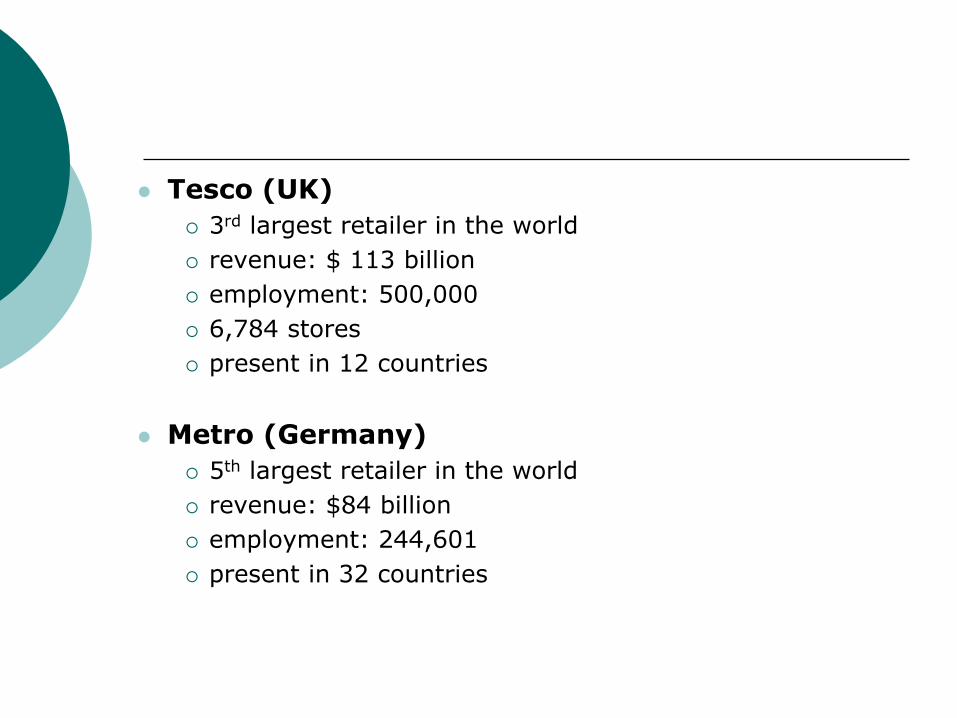
Tesco (UK)
3rd largest retailer in the world
revenue: $ 113 billion
employment: 500,000
6,784 stores
present in 12 countries
Metro (Germany)
5th largest retailer in the world
revenue: $84 billion
employment: 244,601
present in 32 countries
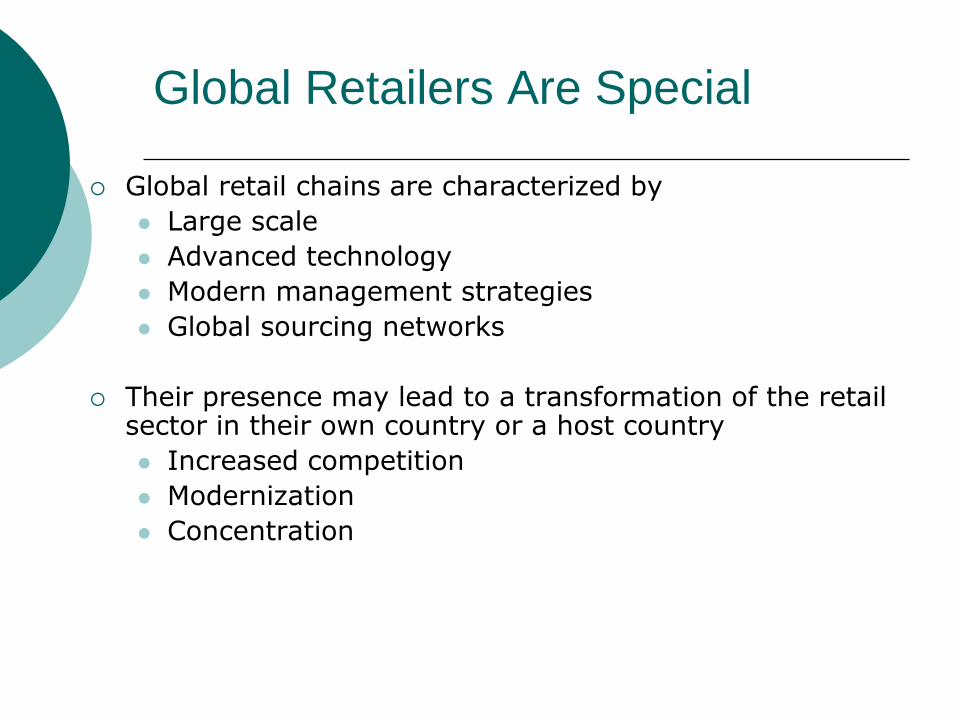
Global Retailers Are Special
Global retail chains are characterized by
Large scale
Advanced technology
Modern management strategies
Global sourcing networks
Their presence may lead to a transformation of the retail sector in their own country or a host country
Increased competition
Modernization
Concentration
Expansion may happen very fast:
Wal-Mart in Mexico
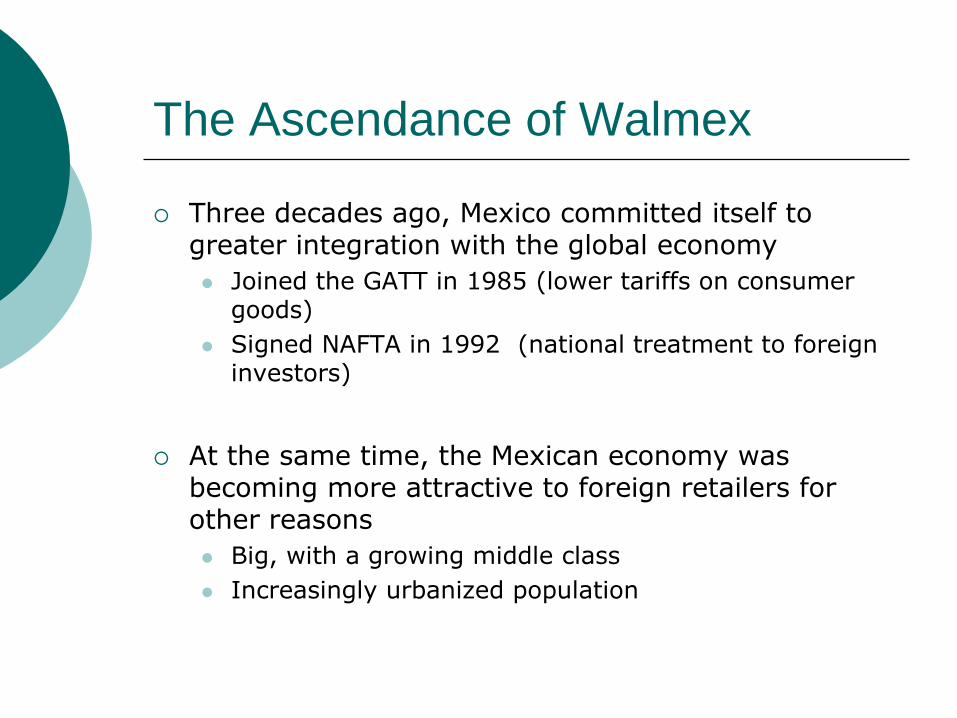
The Ascendance of Walmex
Three decades ago, Mexico committed itself to greater integration with the global economy
Joined the GATT in 1985 (lower tariffs on consumer goods)
Signed NAFTA in 1992 (national treatment to foreign investors)
At the same time, the Mexican economy was becoming more attractive to foreign retailers for other reasons
Big, with a growing middle class
Increasingly urbanized population
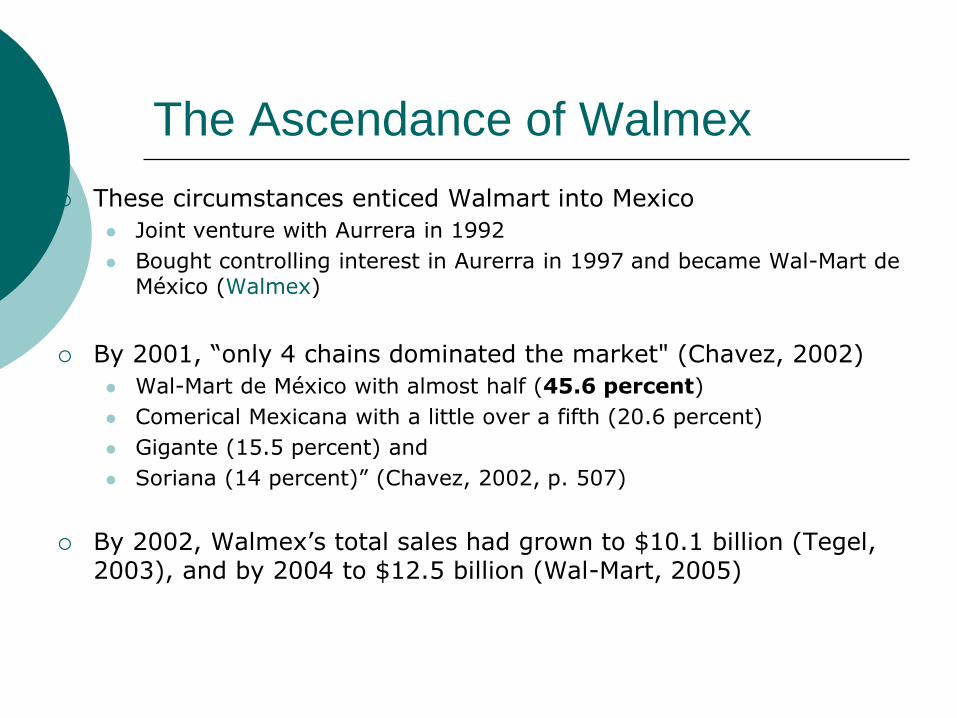
The Ascendance of Walmex
These circumstances enticed Walmart into Mexico
Joint venture with Aurrera in 1992
Bought controlling interest in Aurerra in 1997 and became Wal-Mart de México (Walmex)
By 2001, “only 4 chains dominated the market" (Chavez, 2002)
Wal-Mart de México with almost half (45.6 percent)
Comerical Mexicana with a little over a fifth (20.6 percent)
Gigante (15.5 percent) and
Soriana (14 percent)” (Chavez, 2002, p. 507)
By 2002, Walmex’s total sales had grown to $10.1 billion (Tegel, 2003), and by 2004 to $12.5 billion (Wal-Mart, 2005)

The Ascendance of Walmex
A variety of retailers now operate under the Walmex umbrella
Bodega Aurrera (lower end grocery chain)
Superama (basic big box store, without food)
Walmex Supercenters (big box store, plus grocery store)
Sam’s Club (bulk version of Supercenter)
VIPs (restaurants)
Suburbia (clothing)


Entry of global retail chains
can shake up the retail sector
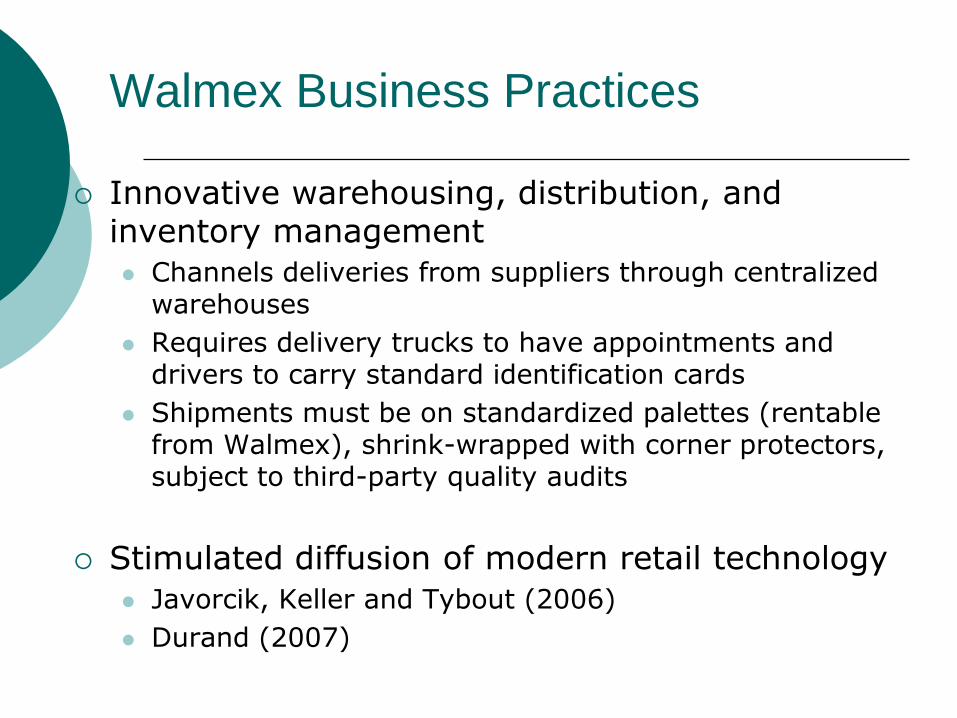
Walmex Business Practices
Innovative warehousing, distribution, and inventory management
Channels deliveries from suppliers through centralized warehouses
Requires delivery trucks to have appointments and drivers to carry standard identification cards
Shipments must be on standardized palettes (rentable from Walmex), shrink-wrapped with corner protectors, subject to third-party quality audits
Stimulated diffusion of modern retail technology
Javorcik, Keller and Tybout (2006)
Durand (2007)
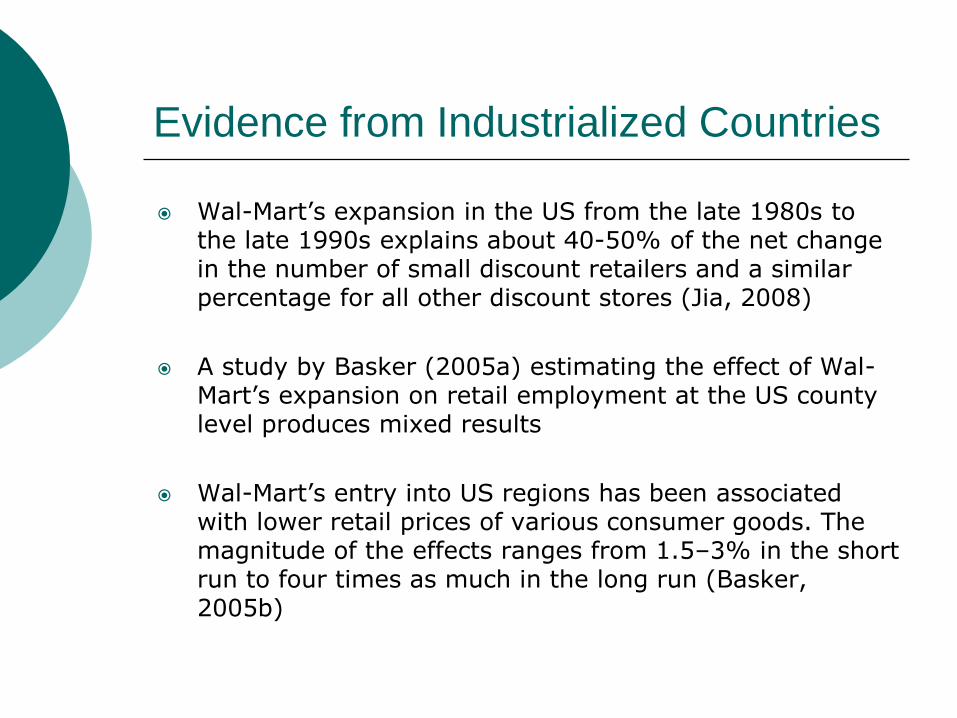
Evidence from Industrialized Countries
Wal-Mart’s expansion in the US from the late 1980s to the late 1990s explains about 40-50% of the net change in the number of small discount retailers and a similar percentage for all other discount stores (Jia, 2008)
A study by Basker (2005a) estimating the effect of Wal-Mart’s expansion on retail employment at the US county level produces mixed results
Wal-Mart’s entry into US regions has been associated with lower retail prices of various consumer goods. The magnitude of the effects ranges from 1.5–3% in the short run to four times as much in the long run (Basker, 2005b)
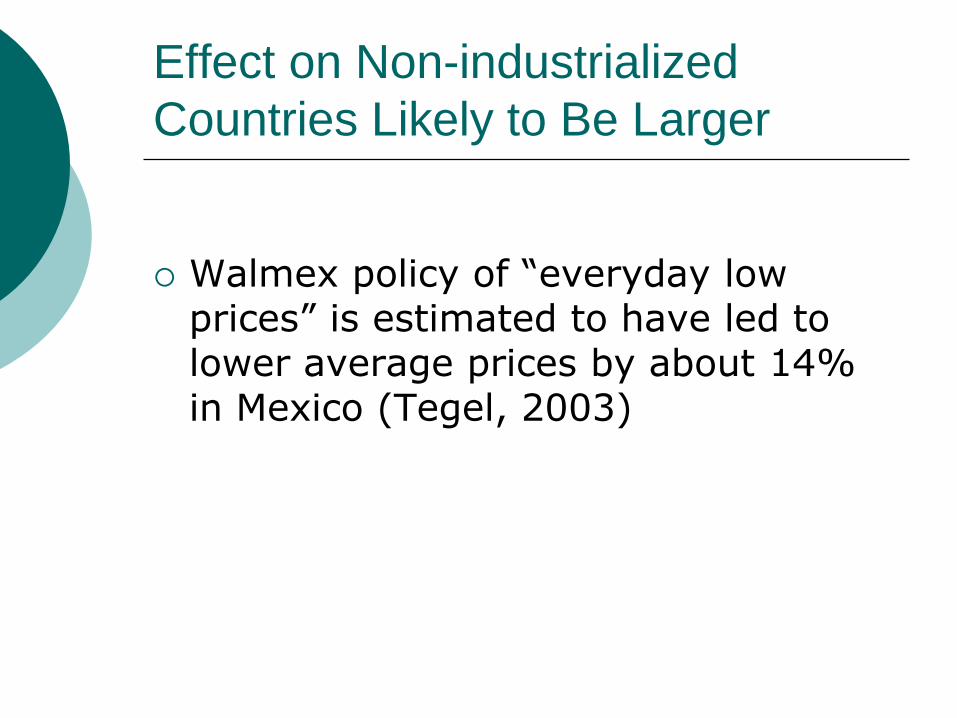
Effect on Non-industrialized
Countries Likely to Be Larger
Walmex policy of “everyday low prices” is estimated to have led to lower average prices by about 14% in Mexico (Tegel, 2003)
Global retail chains and their effect on the supplying sectors

Potential Implications of the Expansion of
Global Retail Chains for the Supplying Sectors
Increased competitive pressure thanks to the threat of
imports and greater bargaining power due to the high volume of orders may force suppliers to increase their productivity improve their products to meet certain quality requirements
Lower distribution costs thanks to dealing with larger buyers may increase the observed productivity of suppliers
Dealing with retail chains may stimulate economies of scale
Detailed information on changes in demand may help suppliers utilize their capacity better (and thus lead to higher observed productivity)
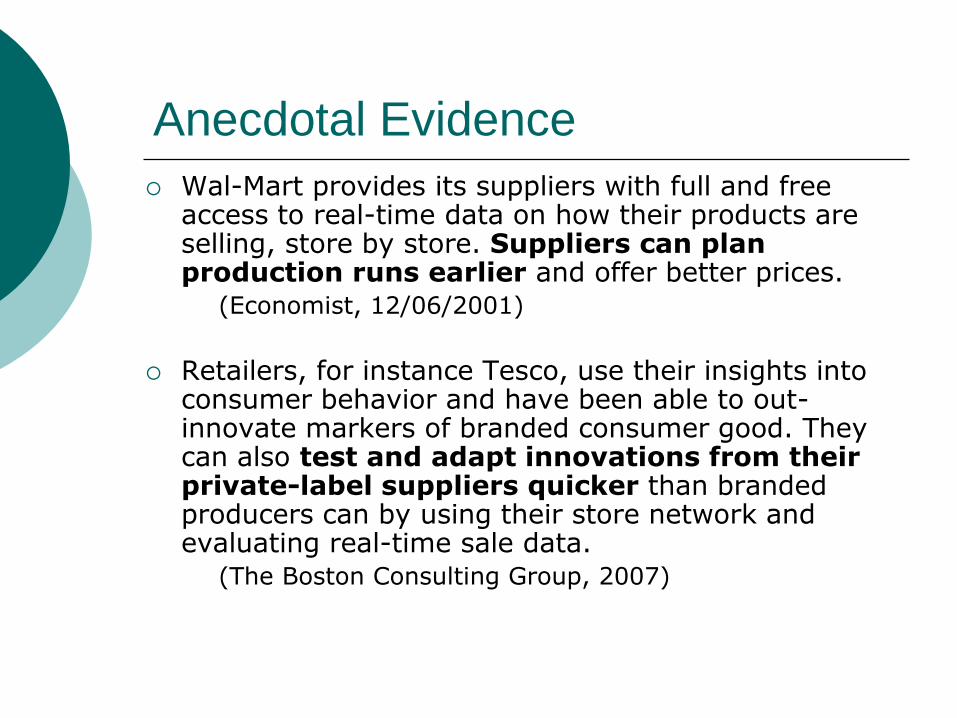
Anecdotal Evidence
Wal-Mart provides its suppliers with full and free access to real-time data on how their products are selling, store by store. Suppliers can plan production runs earlier and offer better prices. (Economist, 12/06/2001)
Retailers, for instance Tesco, use their insights into consumer behavior and have been able to out-innovate markers of branded consumer good. They can also test and adapt innovations from their private-label suppliers quicker than branded producers can by using their store network and evaluating real-time sale data. (The Boston Consulting Group, 2007)

Walmex Business Practices
Hard-nosed style of negotiation with its suppliers
Wal-Mart keeps negotiations with its suppliers as stark as possibleboth the bargaining environment and the number of negotiable contract features (price, quality, quantity)
Often makes a take-or-leave-it offer
Expects product innovation or annual price concessions
Uses store brands to create competition
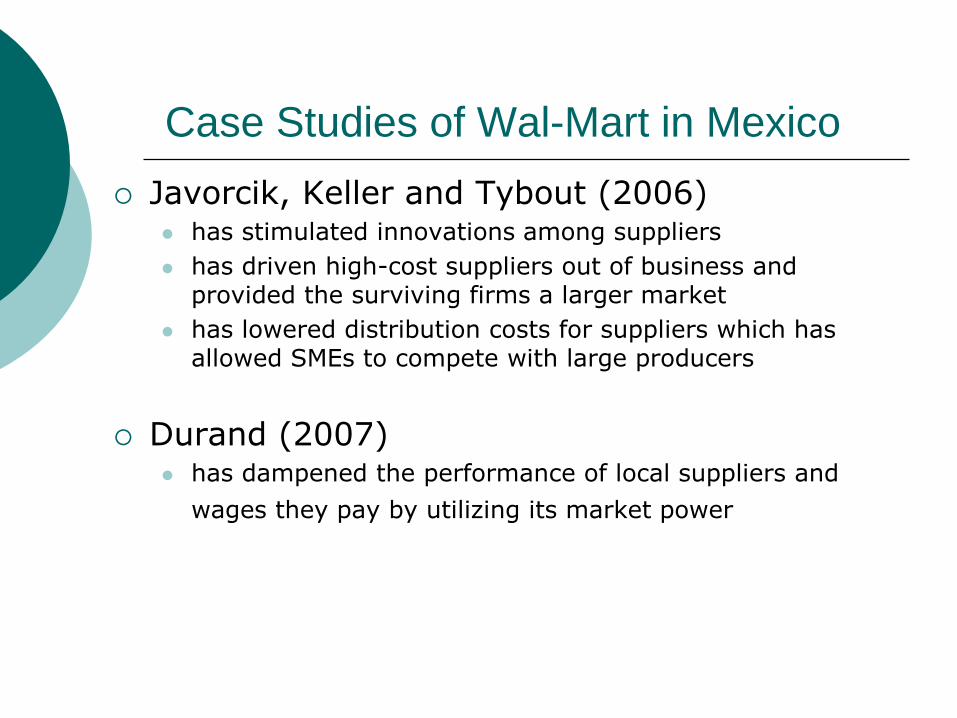
Case Studies of Wal-Mart in Mexico
Javorcik, Keller and Tybout (2006) has stimulated innovations among suppliers
has driven high-cost suppliers out of business and provided the surviving firms a larger market
has lowered distribution costs for suppliers which has allowed SMEs to compete with large producers
Durand (2007) has dampened the performance of local suppliers and
wages they pay by utilizing its market power
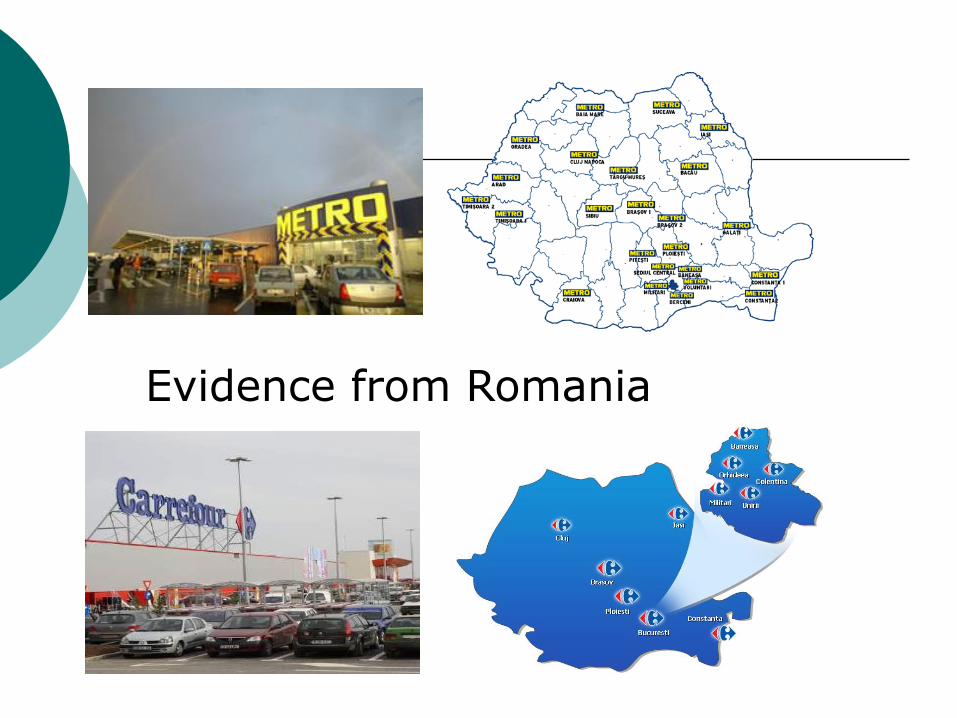
Evidence from Romania

Retail Sector in Romania
Large portion of economic activity
In both, 1997-2000 and 2001-2004 periods
10% of total employment of the economy
Largest service sector
10% of total value added of the economy
Second largest sector
Fernandes (2007)
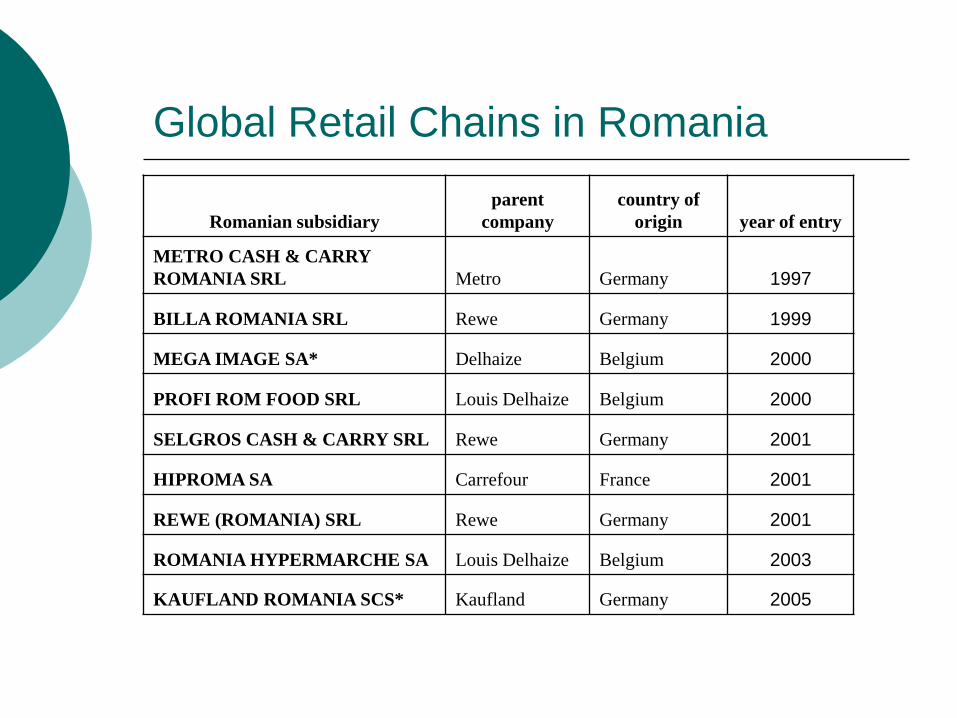
Global Retail Chains in Romania
Romanian subsidiary parent
company country of
origin year of entry
METRO CASH & CARRY
ROMANIA SRL Metro Germany 1997
BILLA ROMANIA SRL Rewe Germany 1999
MEGA IMAGE SA* Delhaize Belgium 2000
PROFI ROM FOOD SRL Louis Delhaize Belgium 2000
SELGROS CASH & CARRY SRL Rewe Germany 2001
HIPROMA SA Carrefour France 2001
REWE (ROMANIA) SRL Rewe Germany 2001
ROMANIA HYPERMARCHE SA Louis Delhaize Belgium 2003
KAUFLAND ROMANIA SCS* Kaufland Germany 2005
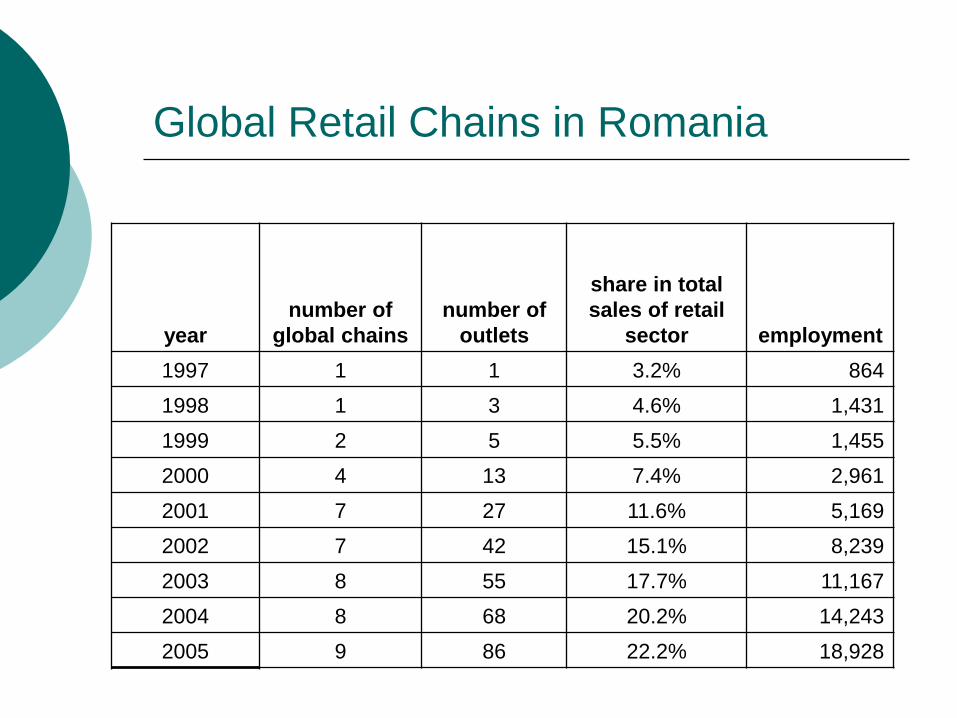
Global Retail Chains in Romania
year
number of
global chains number of
outlets
share in total
sales of retail
sector employment
1997 1 1 3.2% 864
1998 1 3 4.6% 1,431
1999 2 5 5.5% 1,455
2000 4 13 7.4% 2,961
2001 7 27 11.6% 5,169
2002 7 42 15.1% 8,239
2003 8 55 17.7% 11,167
2004 8 68 20.2% 14,243
2005 9 86 22.2% 18,928
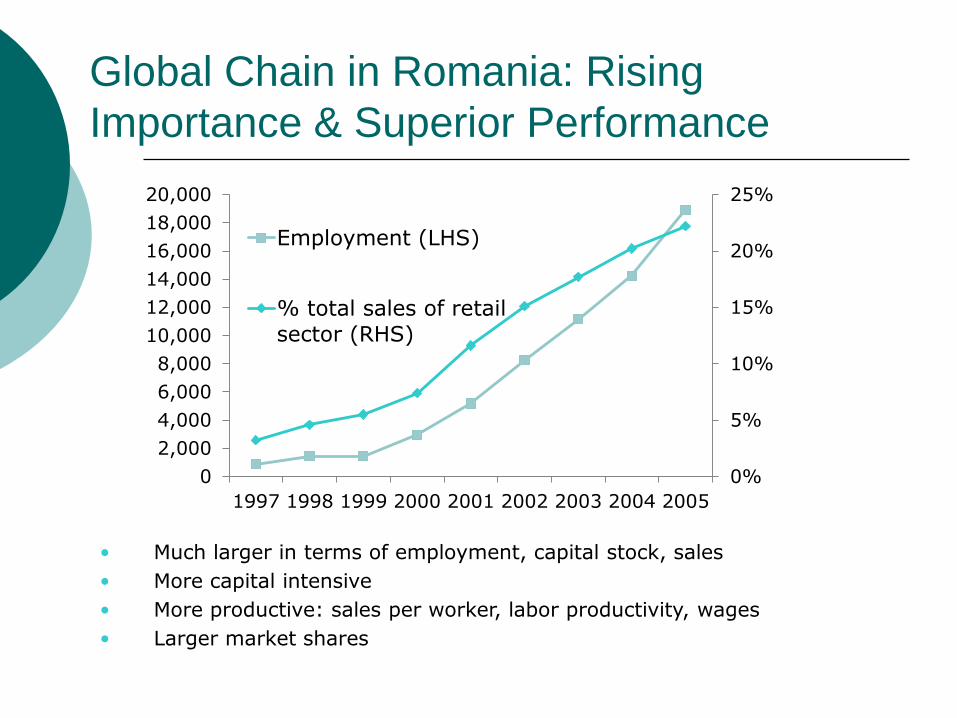
Global Chain in Romania: Rising
Importance & Superior Performance
0%
5%
10%
15%
20%
25%
0
2,000
4,000
6,000
8,000
10,000
12,000
14,000
16,000
18,000
20,000
1997 1998 1999 2000 2001 2002 2003 2004 2005
Employment (LHS)
% total sales of retail
sector (RHS)
Much larger in terms of employment, capital stock, sales
More capital intensive
More productive: sales per worker, labor productivity, wages
Larger market shares

1
Distribution of Global Chain in Romania, 1997
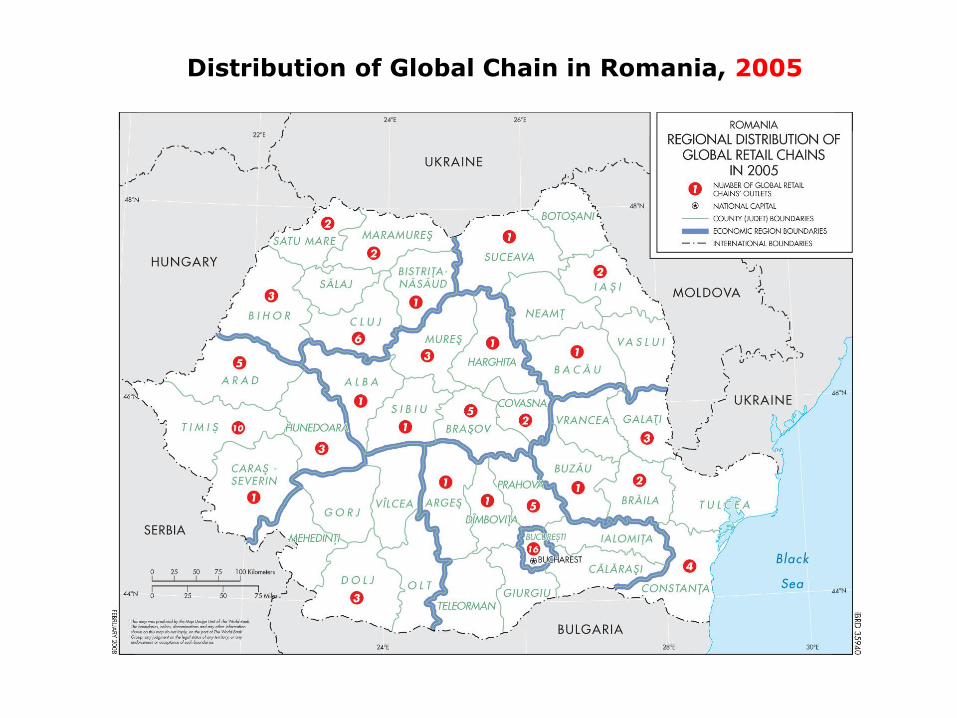
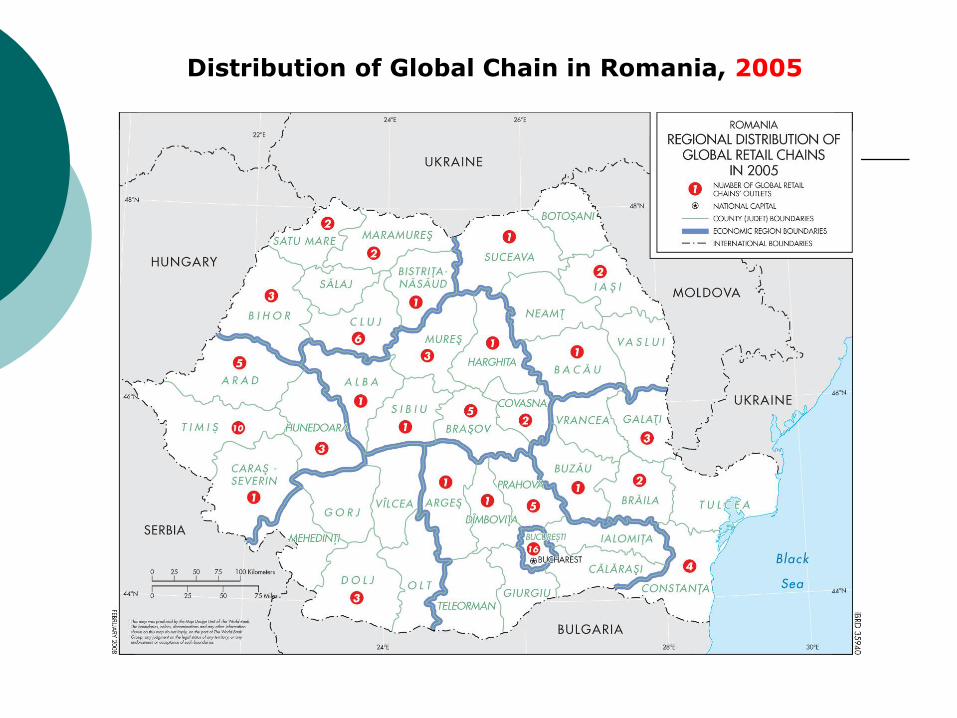
Distribution of Global Chain in Romania, 2005
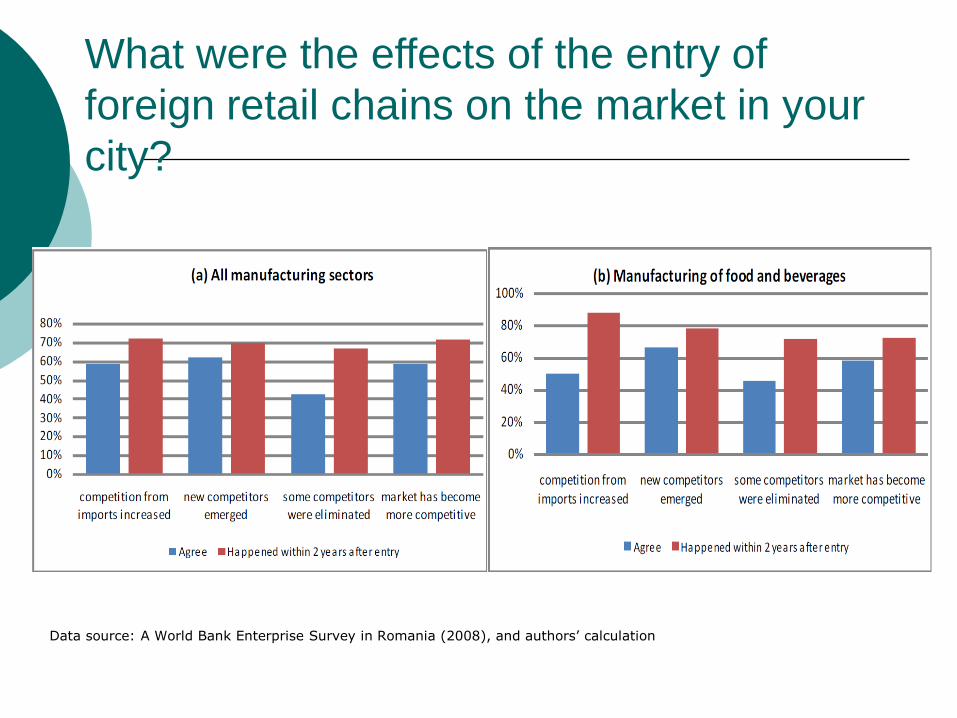
Data source: A World Bank Enterprise Survey in Romania (2008), and authors’ calculation
What were the effects of the entry of
foreign retail chains on the market in your
city?
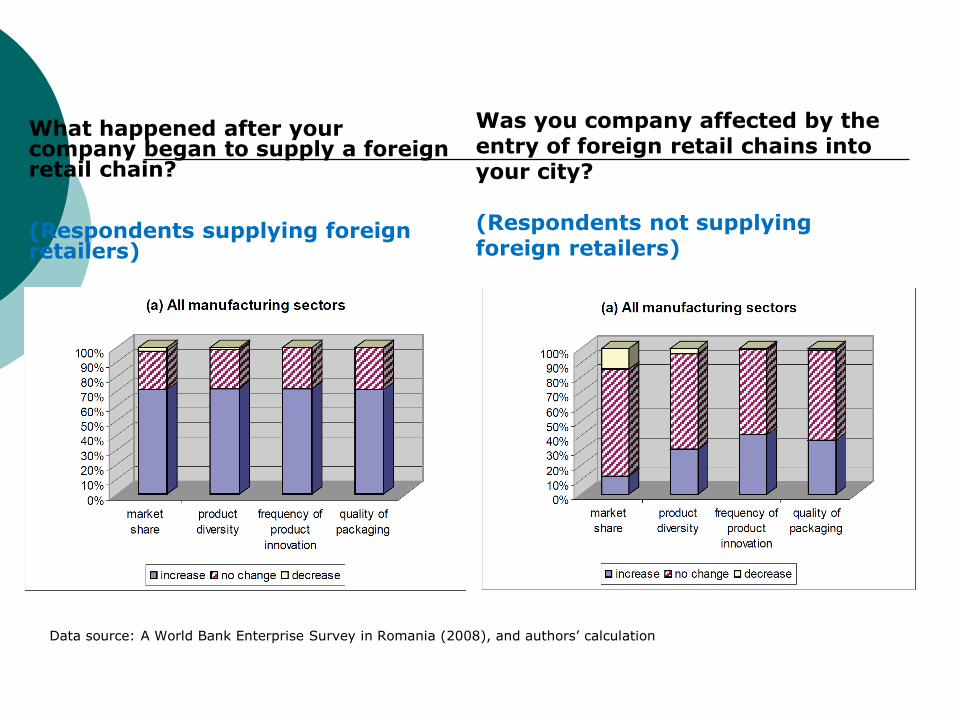
What happened after your company began to supply a foreign retail chain? (Respondents supplying foreign retailers)
Data source: A World Bank Enterprise Survey in Romania (2008), and authors’ calculation
Was you company affected by the entry of foreign retail chains into your city? (Respondents not supplying foreign retailers)
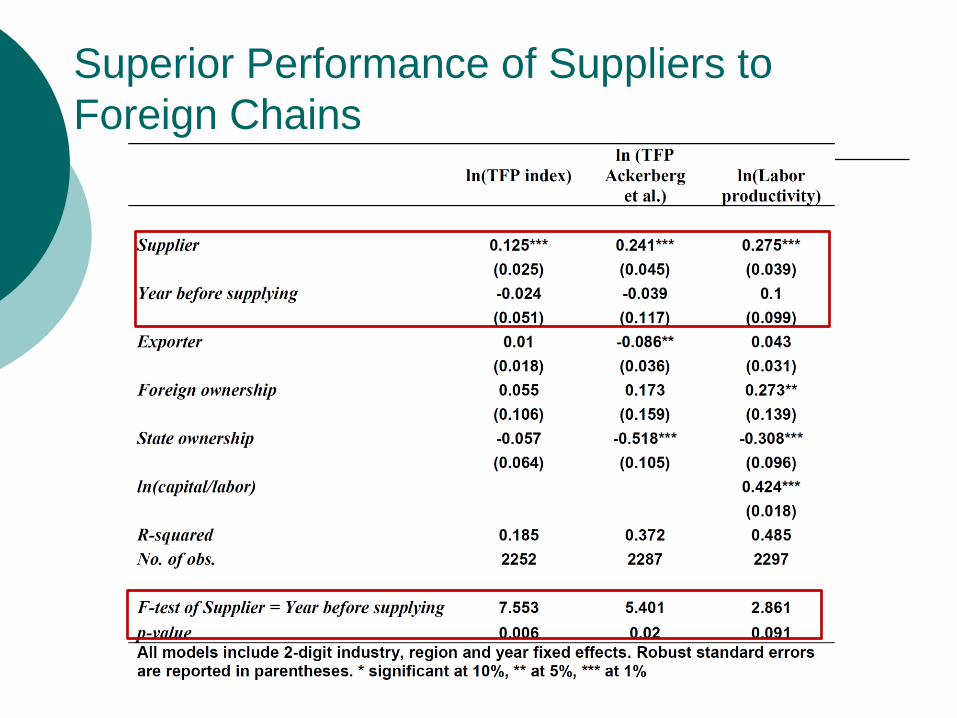
Superior Performance of Suppliers to
Foreign Chains
Some Econometric Evidence
Javorcik and Li (2013, 2014)
How does the presence of global retail chains affect the performance of firms in the supplying industries in Romania?
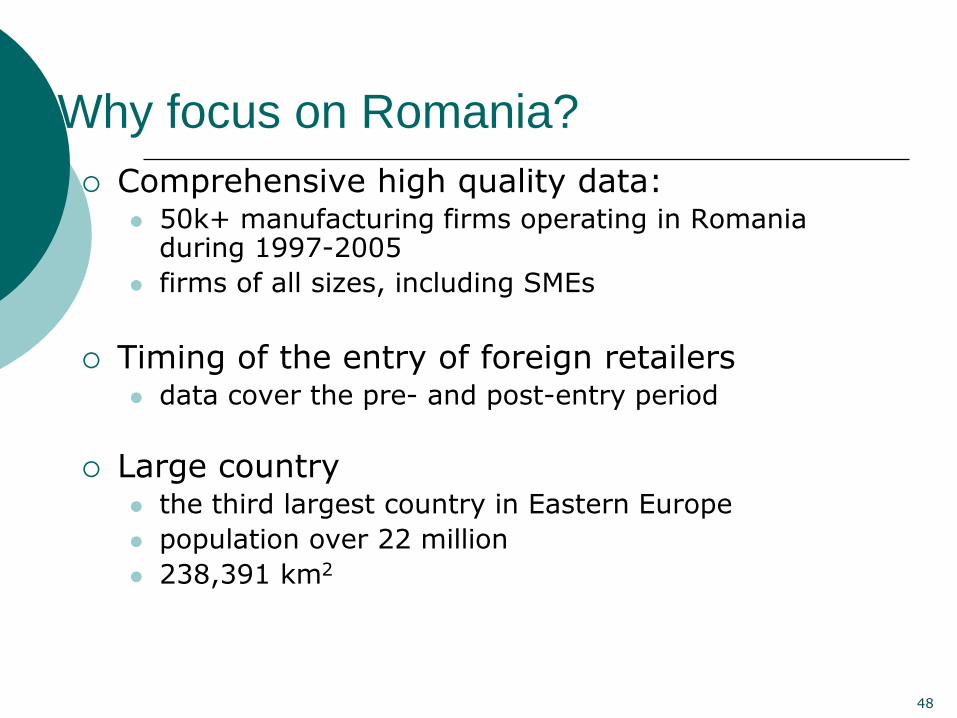
Why focus on Romania?
Comprehensive high quality data: 50k+ manufacturing firms operating in Romania
during 1997-2005
firms of all sizes, including SMEs
Timing of the entry of foreign retailers data cover the pre- and post-entry period
Large country the third largest country in Eastern Europe
population over 22 million
238,391 km2
48
Empirical Strategy
Difference-in-differences approach
Compare the performance of
food sectors before and after entry of global chains into their region
to the performance of non-food sectors
during the same period

Distribution of Global Chain in Romania, 2005
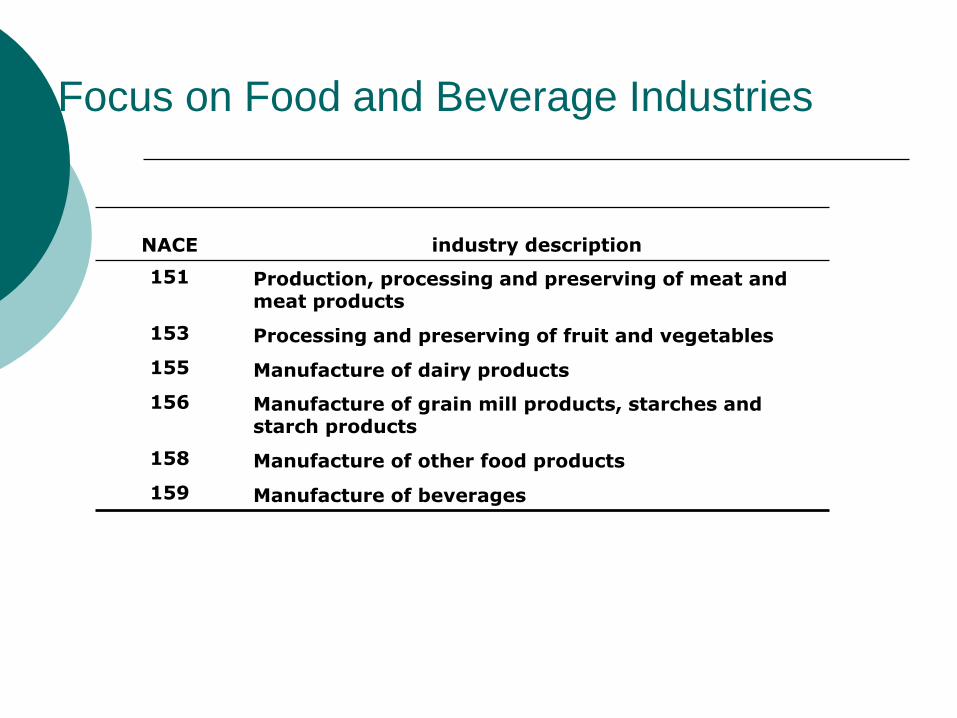
Focus on Food and Beverage Industries
NACE industry description
151 Production, processing and preserving of meat and meat products
153 Processing and preserving of fruit and vegetables
155 Manufacture of dairy products
156 Manufacture of grain mill products, starches and starch products
158 Manufacture of other food products
159 Manufacture of beverages
Food Sectors Non-food Sectors
24
68
10
12
de
nsity
0 .05 .1 .15 .2 .25lnTFP
global chains present global chains not present
02
46
8
de
nsity
0 .1 .2 .3 .4lnTFP
global chains present global chains not present
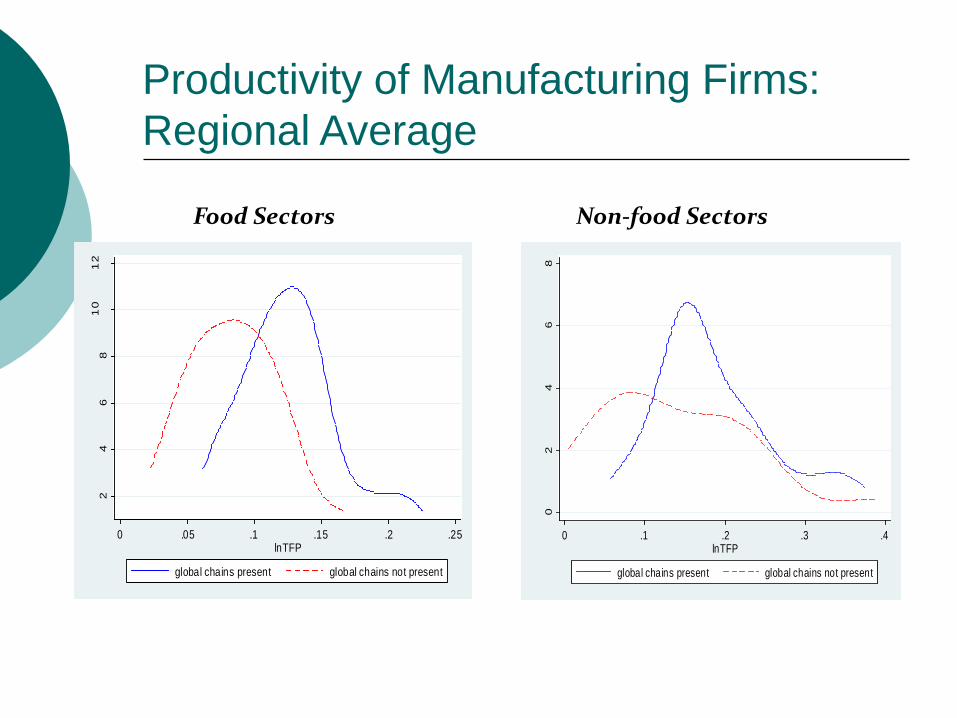
Productivity of Manufacturing Firms:
Regional Average

Measuring Chains’ Presence
Regional presence of global chains measured at 2 digit NUTS level
Indicator variable capturing whether global chains are present in region r at time t
Number of chain stores operating in region r at time t
Selling space of global chains operating in region r at time t
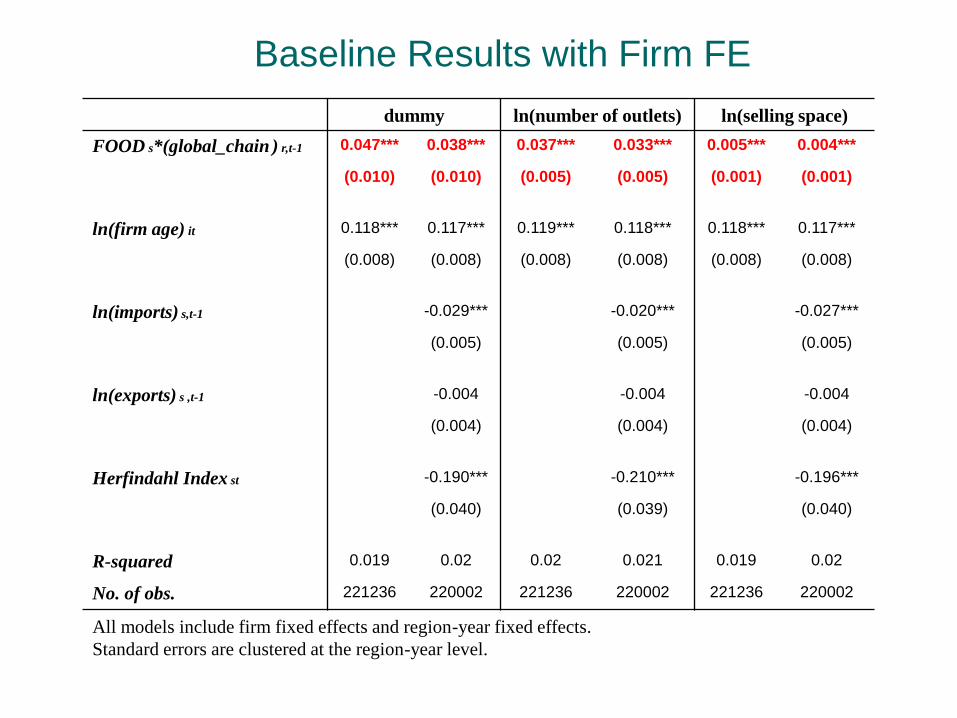
Baseline Results with Firm FE
dummy ln(number of outlets) ln(selling space)
FOOD s*(global_chain ) r,t-1 0.047*** 0.038*** 0.037*** 0.033*** 0.005*** 0.004***
(0.010) (0.010) (0.005) (0.005) (0.001) (0.001)
ln(firm age) it 0.118*** 0.117*** 0.119*** 0.118*** 0.118*** 0.117***
(0.008) (0.008) (0.008) (0.008) (0.008) (0.008)
ln(imports) s,t-1 -0.029*** -0.020*** -0.027***
(0.005) (0.005) (0.005)
ln(exports) s ,t-1 -0.004 -0.004 -0.004
(0.004) (0.004) (0.004)
Herfindahl Index st -0.190*** -0.210*** -0.196***
(0.040) (0.039) (0.040)
R-squared 0.019 0.02 0.02 0.021 0.019 0.02
No. of obs. 221236 220002 221236 220002 221236 220002
All models include firm fixed effects and region-year fixed effects.
Standard errors are clustered at the region-year level.
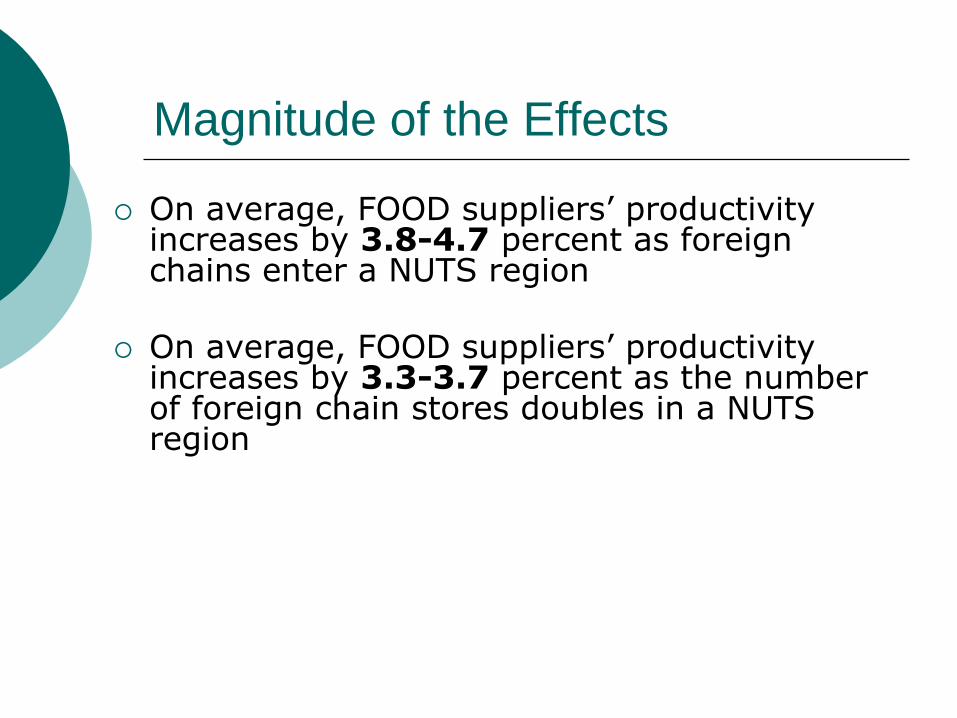
Magnitude of the Effects
On average, FOOD suppliers’ productivity increases by 3.8-4.7 percent as foreign chains enter a NUTS region
On average, FOOD suppliers’ productivity increases by 3.3-3.7 percent as the number of foreign chain stores doubles in a NUTS region
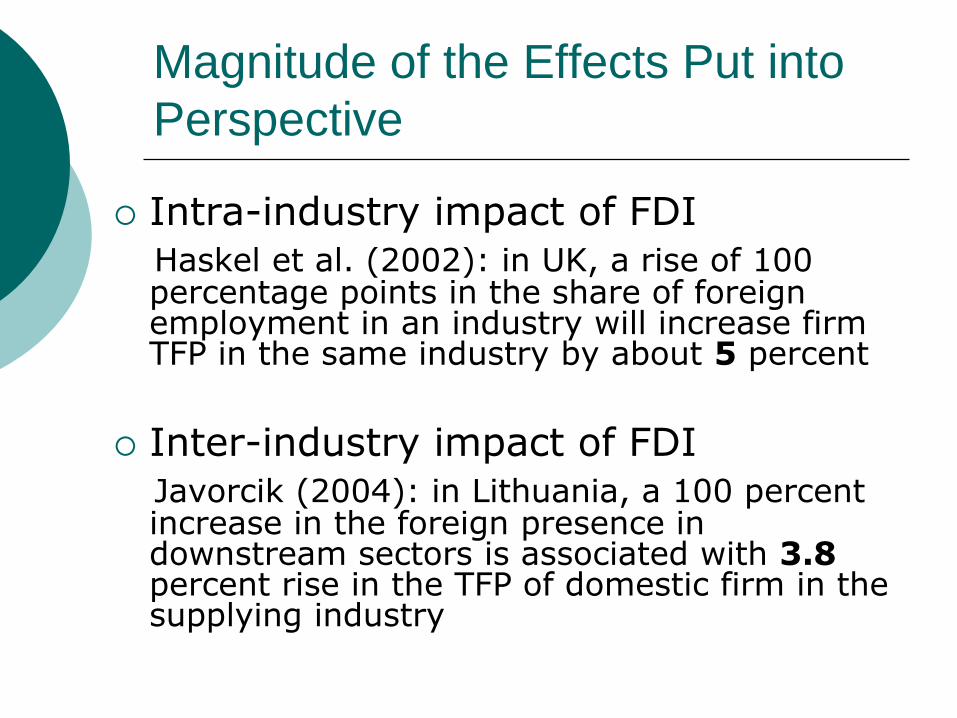
Magnitude of the Effects Put into
Perspective
Intra-industry impact of FDI Haskel et al. (2002): in UK, a rise of 100
percentage points in the share of foreign employment in an industry will increase firm TFP in the same industry by about 5 percent
Inter-industry impact of FDI Javorcik (2004): in Lithuania, a 100 percent
increase in the foreign presence in downstream sectors is associated with 3.8 percent rise in the TFP of domestic firm in the supplying industry
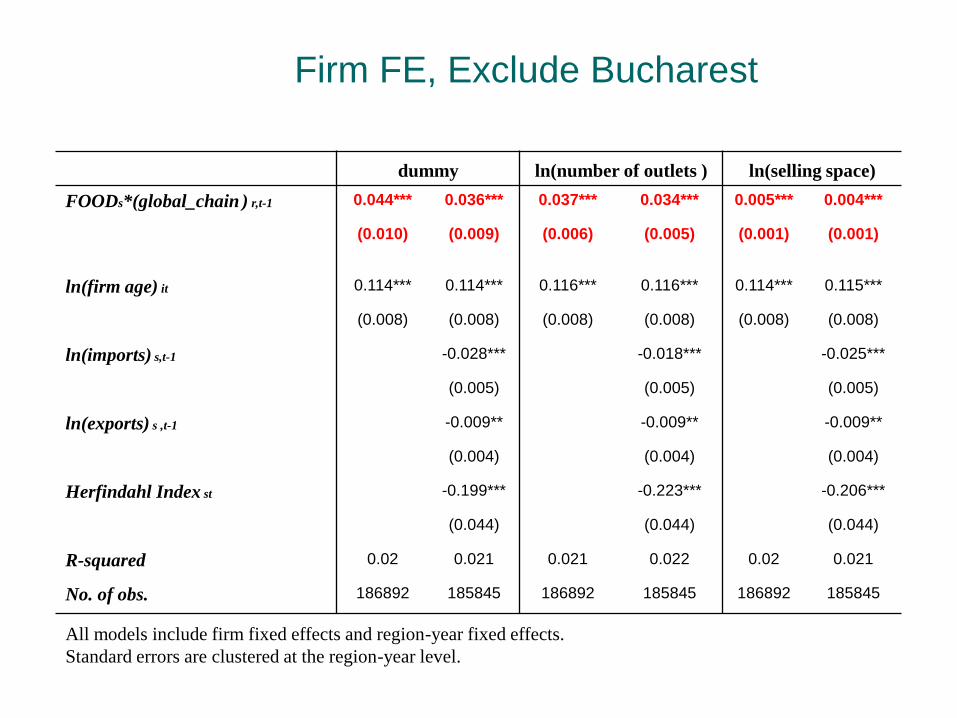
Firm FE, Exclude Bucharest
dummy ln(number of outlets ) ln(selling space)
FOODs*(global_chain ) r,t-1 0.044*** 0.036*** 0.037*** 0.034*** 0.005*** 0.004***
(0.010) (0.009) (0.006) (0.005) (0.001) (0.001)
ln(firm age) it 0.114*** 0.114*** 0.116*** 0.116*** 0.114*** 0.115***
(0.008) (0.008) (0.008) (0.008) (0.008) (0.008)
ln(imports) s,t-1 -0.028*** -0.018*** -0.025***
(0.005) (0.005) (0.005)
ln(exports) s ,t-1 -0.009** -0.009** -0.009**
(0.004) (0.004) (0.004)
Herfindahl Index st -0.199*** -0.223*** -0.206***
(0.044) (0.044) (0.044)
R-squared 0.02 0.021 0.021 0.022 0.02 0.021
No. of obs. 186892 185845 186892 185845 186892 185845
All models include firm fixed effects and region-year fixed effects.
Standard errors are clustered at the region-year level.
Are There Differences Present before
Entry?
If there is a reverse causality problem, firms in regions that attract global chains should exhibit higher TFP before the entry of global chains
Method:
1_year_before:
dummy, equals unit if one year before foreign chain entered a NUTS region, and zero otherwise
Pre-entry Impact, Firm FE
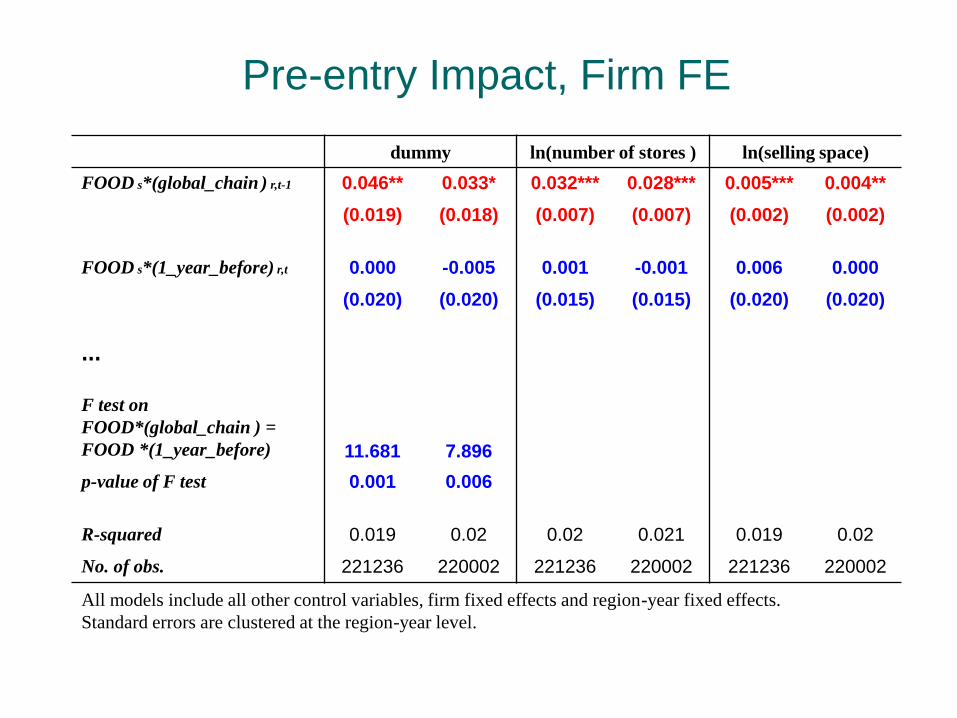
dummy ln(number of stores ) ln(selling space)
FOOD s*(global_chain ) r,t-1 0.046** 0.033* 0.032*** 0.028*** 0.005*** 0.004**
(0.019) (0.018) (0.007) (0.007) (0.002) (0.002)
FOOD s*(1_year_before) r,t 0.000 -0.005 0.001 -0.001 0.006 0.000
(0.020) (0.020) (0.015) (0.015) (0.020) (0.020)
…
F test on
FOOD*(global_chain ) =
FOOD *(1_year_before) 11.681 7.896
p-value of F test 0.001 0.006
R-squared 0.019 0.02 0.02 0.021 0.019 0.02
No. of obs. 221236 220002 221236 220002 221236 220002
All models include all other control variables, firm fixed effects and region-year fixed effects.
Standard errors are clustered at the region-year level.
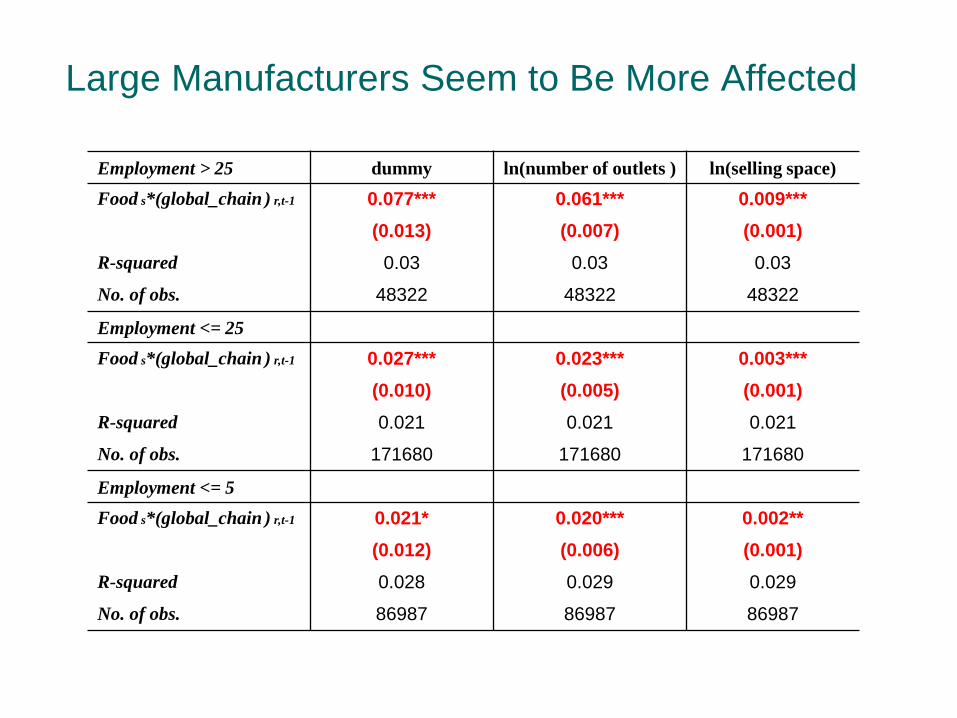
Large Manufacturers Seem to Be More Affected
Employment > 25 dummy ln(number of outlets ) ln(selling space)
Food s*(global_chain ) r,t-1 0.077*** 0.061*** 0.009***
(0.013) (0.007) (0.001)
R-squared 0.03 0.03 0.03
No. of obs. 48322 48322 48322
Employment <= 25
Food s*(global_chain ) r,t-1 0.027*** 0.023*** 0.003***
(0.010) (0.005) (0.001)
R-squared 0.021 0.021 0.021
No. of obs. 171680 171680 171680
Employment <= 5
Food s*(global_chain ) r,t-1 0.021* 0.020*** 0.002**
(0.012) (0.006) (0.001)
R-squared 0.028 0.029 0.029
No. of obs. 86987 86987 86987
A More Ambitious Approach to
Geography
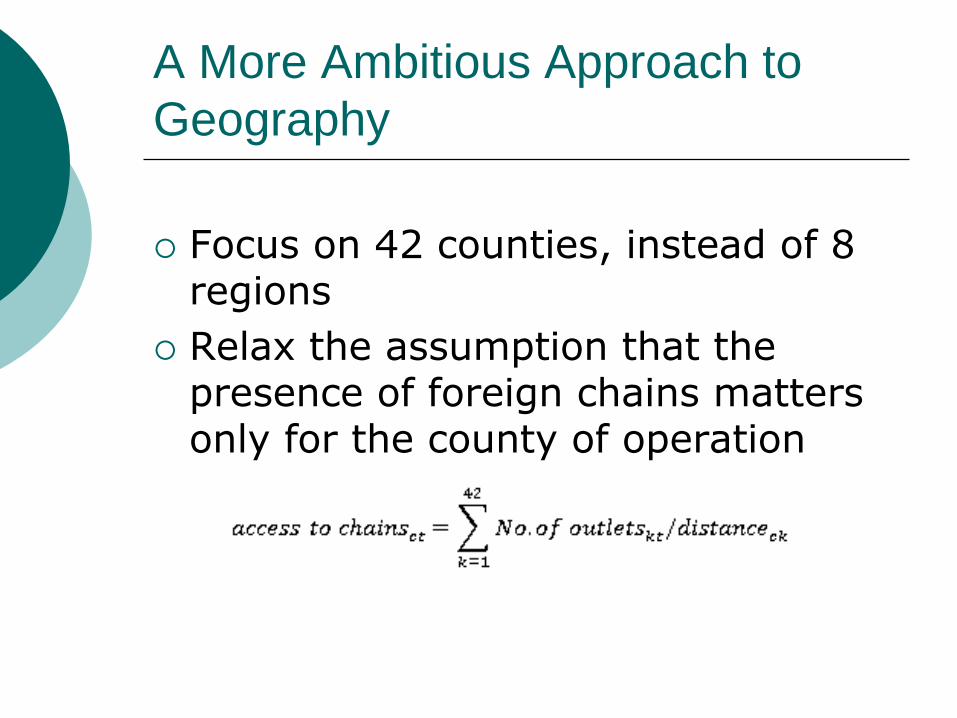
Focus on 42 counties, instead of 8 regions
Relax the assumption that the presence of foreign chains matters only for the county of operation
Distribution of Global Chain in Romania, 2005

A More Ambitious Approach to
Geography
Focus on 42 counties, instead of 8 regions
Relax the assumption that the presence of foreign chains matters only for the county of operation
Our conclusions are robust to this change
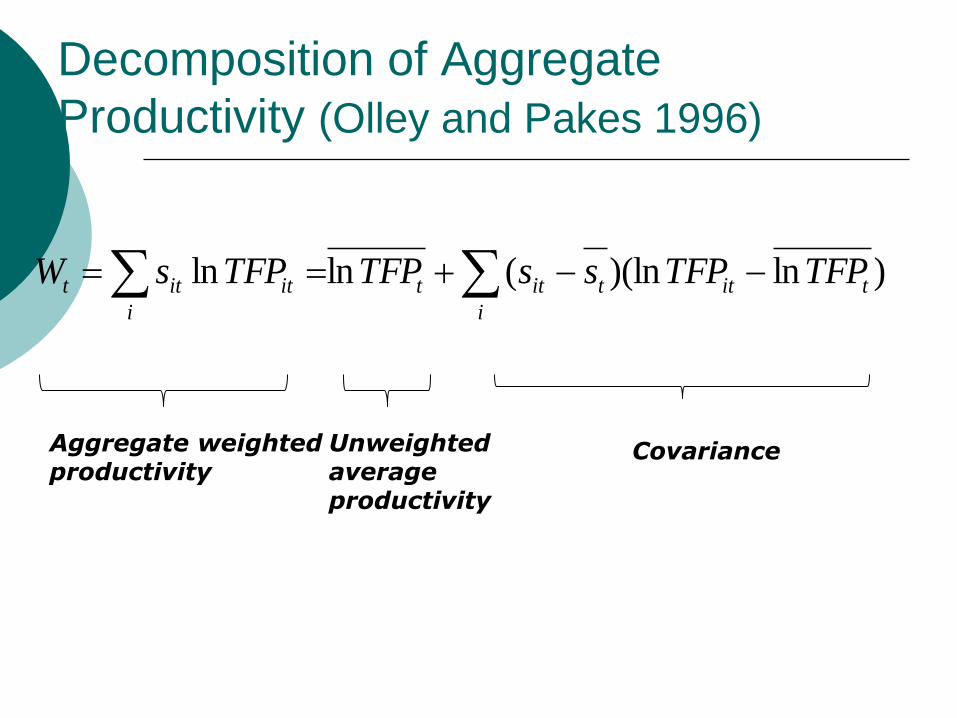
Decomposition of Aggregate
Productivity (Olley and Pakes 1996)
i
tittitt
i
ititt TFPTFPssTFPTFPsW )ln)(ln(lnln
Aggregate weighted productivity
Unweighted average productivity
Covariance
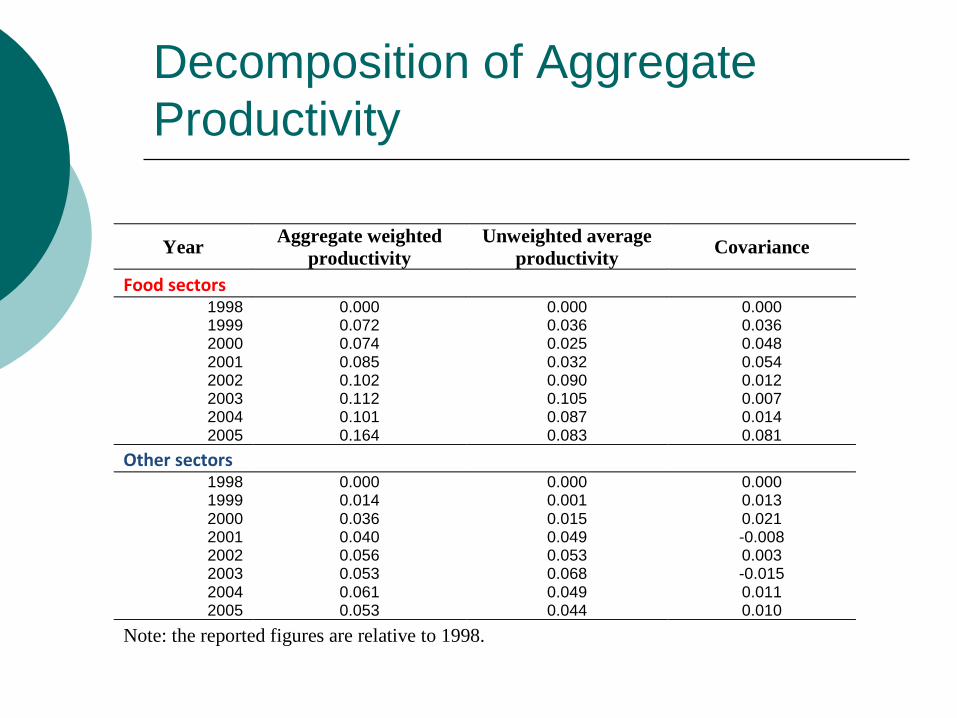
Decomposition of Aggregate
Productivity
Year
Aggregate weighted
productivity Unweighted average
productivity Covariance
Food sectors 1998 0.000 0.000 0.000 1999 0.072 0.036 0.036 2000 0.074 0.025 0.048 2001 0.085 0.032 0.054 2002 0.102 0.090 0.012 2003 0.112 0.105 0.007 2004 0.101 0.087 0.014 2005 0.164 0.083 0.081
Other sectors 1998 0.000 0.000 0.000
1999 0.014 0.001 0.013 2000 0.036 0.015 0.021 2001 0.040 0.049 -0.008 2002 0.056 0.053 0.003 2003 0.053 0.068 -0.015 2004 0.061 0.049 0.011 2005 0.053 0.044 0.010
Note: the reported figures are relative to 1998.

Decomposition of Aggregate
Productivity
Year
Aggregate weighted
productivity Unweighted average
productivity Covariance
Food sectors 1998 0.000 0.000 0.000
1999 0.072 0.036 0.036 2000 0.074 0.025 0.048 2001 0.085 0.032 0.054 2002 0.102 0.090 0.012 2003 0.112 0.105 0.007 2004 0.101 0.087 0.014 2005 0.164 0.083 0.081
Other sectors 1998 0.000 0.000 0.000
1999 0.014 0.001 0.013 2000 0.036 0.015 0.021 2001 0.040 0.049 -0.008 2002 0.056 0.053 0.003 2003 0.053 0.068 -0.015 2004 0.061 0.049 0.011 2005 0.053 0.044 0.010
Note: the reported figures are relative to 1998.
Changes expressed relative to 1998
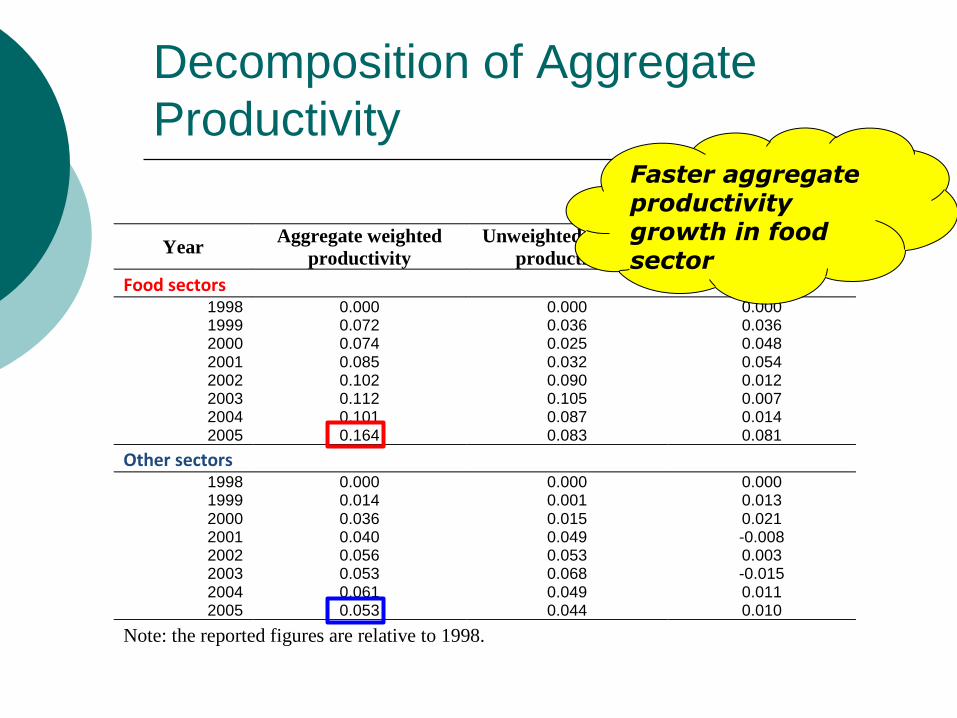
Decomposition of Aggregate
Productivity
Year
Aggregate weighted
productivity Unweighted average
productivity Covariance
Food sectors 1998 0.000 0.000 0.000 1999 0.072 0.036 0.036 2000 0.074 0.025 0.048 2001 0.085 0.032 0.054 2002 0.102 0.090 0.012 2003 0.112 0.105 0.007 2004 0.101 0.087 0.014 2005 0.164 0.083 0.081
Other sectors 1998 0.000 0.000 0.000
1999 0.014 0.001 0.013 2000 0.036 0.015 0.021 2001 0.040 0.049 -0.008 2002 0.056 0.053 0.003 2003 0.053 0.068 -0.015 2004 0.061 0.049 0.011 2005 0.053 0.044 0.010
Note: the reported figures are relative to 1998.
Faster aggregate productivity growth in food sector
Decomposition of Aggregate
Productivity
Year
Aggregate weighted
productivity Unweighted average
productivity Covariance
Food sectors 1998 0.000 0.000 0.000 1999 0.072 0.036 0.036 2000 0.074 0.025 0.048 2001 0.085 0.032 0.054 2002 0.102 0.090 0.012 2003 0.112 0.105 0.007 2004 0.101 0.087 0.014 2005 0.164 0.083 0.081
Other sectors 1998 0.000 0.000 0.000
1999 0.014 0.001 0.013 2000 0.036 0.015 0.021 2001 0.040 0.049 -0.008 2002 0.056 0.053 0.003 2003 0.053 0.068 -0.015 2004 0.061 0.049 0.011 2005 0.053 0.044 0.010
Note: the reported figures are relative to 1998.
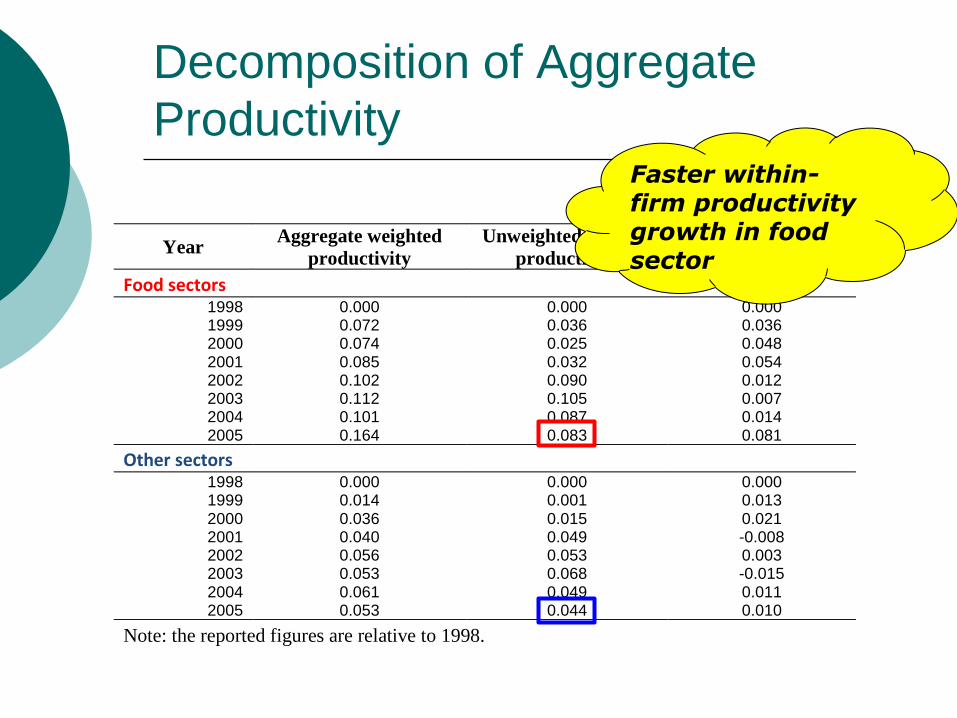
Faster within-firm productivity growth in food sector

Decomposition of Aggregate
Productivity
Year
Aggregate weighted
productivity Unweighted average
productivity Covariance
Food sectors 1998 0.000 0.000 0.000 1999 0.072 0.036 0.036 2000 0.074 0.025 0.048 2001 0.085 0.032 0.054 2002 0.102 0.090 0.012 2003 0.112 0.105 0.007 2004 0.101 0.087 0.014 2005 0.164 0.083 0.081
Other sectors 1998 0.000 0.000 0.000
1999 0.014 0.001 0.013 2000 0.036 0.015 0.021 2001 0.040 0.049 -0.008 2002 0.056 0.053 0.003 2003 0.053 0.068 -0.015 2004 0.061 0.049 0.011 2005 0.053 0.044 0.010
Note: the reported figures are relative to 1998.
Reallocation played a greater role in food sector

Decomposition of Aggregate
Productivity
Econometric analysis confirms that both within-firm productivity growth and reallocation of market shares toward more productive producers have been stimulated by entry of foreign retail chains

Summary
Global retail chains are larger in terms of employment and capital investment, more capital intensive, and display higher labor productivity
Expansion of global retail chains leads to an improved performance in the supplying industries
Large firms seem to be affected more than SMEs
Entry of global retail chains stimulates both within-firm productivity growth as well as reallocation of market shares towards more productive suppliers
Another piece of evidence in favor of services liberalization
References
Basker, Emek (2005a) Job Creation or Destruction? Labor-Market Effects of Wal-Mart Expansion. Review of Economics and Statistics 87(1): 174-183
Basker, Emek (2005b). Selling a Cheaper Mousetrap: Wal-Mart's Effect on Retail Prices. Journal of Urban Economics 58(2): 203-229
Chavez, Manuel (2002) The Transformation of Mexican Retailing with NAFTA. Development Policy Review, 20(4): 503-13
Durand, Cedric (2007). Externalities from Foreign Direct Investment in the Mexican Retailing Sector. Cambridge Journal of Economics 31 (3): 393-411
Haskel, Jonathan E., Sonia C. Pereira, and Matthew J. Slaughter (2007). Does Inward Foreign Direct Investment Boost the Productivity of Domestic Firms? Review of Economics and Statistics, 89(2)
Javorcik, Beata S. (2004). Does Foreign Direct Investment Increase the Productivity of Domestic Firms? In Search of Spillovers through Backward Linkages. American Economic Review 94(3): 605-627
References
Javorcik, Beata S. and Yue Li (2013) Do the Biggest Aisles Serve a Brighter Future? Global Retail Chains and Their Implications for Romania. Journal of International Economics, 90(2): 348–363
Javorcik, Beata S. and Yue Li (2014) Global Retail Chains and the Supplying Industries: Evidence from Romania CESifo Economic Studies 60 (1): 107-134
Javorcik, Beata S., Wolfgang Keller and James R.Tybout (2008). Openness and Industrial Response in a Wal-Mart World: A Case Study of Mexican Soaps, Detergents and Surfactant Producers. The World Economy, 31(12)
Jia, Panle (2008) What Happens when Wal-Mart comes to Town? An Empirical Analysis of the Discount Retailing Industry," Econometrica 76(6): 1263-1316
Tegel, S. (2003) Every Day Higher Sales: Wal-Mart Wunderkind Walmex shows them how it’s done in a down economy: The Giant 24, Latin Trade (August) Downloaded February 15, 2006 from http://www..ndarticles.com/p/articles/mi_m0BEK/is_8_11/ai_106860473