Embed Size (px)
Citation preview
FDI trends and APEC performance

2
FDI in the current market FDI in the current market
GIPB ResultsGIPB Results
Implications for IPIsImplications for IPIs
Learning Objectives of the CourseLearning Objectives of the Course

3
FDI in the recent economic recession
Source: World Investment Report 2012, United Nations Conference on Trade and Development UNCTAD Global Investment Trends Monitor, Issue No. 9, 2012
Recession Most severe recession since the Great
Depression
Global FDI flows dropped by about 40% between 2007 and 2009.
Recovery FDI inflows increased across all major
economic groupings in 2011
In developing and transition economies driven by robust greenfield investments, in developed countries due largely to cross-border M&As
Slower FDI growth predicted in 2012
Business response Significant decrease in access to credit
Re-capitalization of banks is taking place slowly in many countries
Lower corporate profits
Leading site selection firms report slowdown and postponement of investment projects
Companies restructuring to deal with the crisis; cautious about recovery
Investment plans frozen or discarded
De-locations and outright plant closures

4
Investment flows – Global
Global FDI in 2011 at $1.5 trillionFDI inflows rose 16%, but remained 23% below their 2007 peak
Developing and transition economies respectively accounted for 45% and 6% of global FDI
Source: World Investment Report 2012, United Nations Conference on Trade and Development
FDI inflows, global and by groups of economies, 1995-2011 (Billions of dollars)
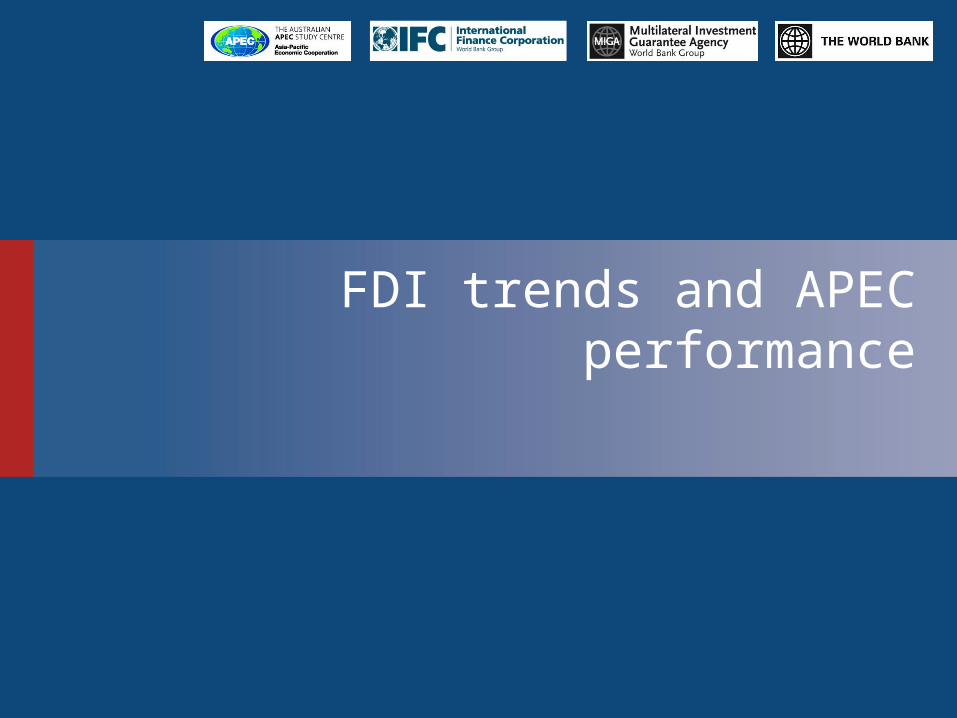
2011 investment flows – Developing economies and APEC
Developing economies
FDI inflows increased by 11%, reaching a record $684 billion
APEC
FDI inflows increased by 16% to $733 billion
Accounted for nearly half of the global total
APEC-8
FDI inflows increased by 6% to $82 billion
FDI inflows to China increased by 8%, to the USA by 15% and to Russia by 22%.
5

Investment flows – APEC
Like the global trend of the last 20 years, inflows have trended strongly upward with periodic setbacks.
APEC’s recovery has been stronger: 2011 only 8% under the 2007 peak
Most inflows go to the U.S. (31% of 2011 total), PR China (17%), Hong Kong, China (11%) and Russia (7%)
6
FDI Inflows to APEC, 1992-2011
US
$ bi
llion
Source: UNCTAD FDI Database
0
100
200
300
400
500
600
700
800
900
68123143
176211
250318
461
572
343
239213
382315
580
738794
478
632
733
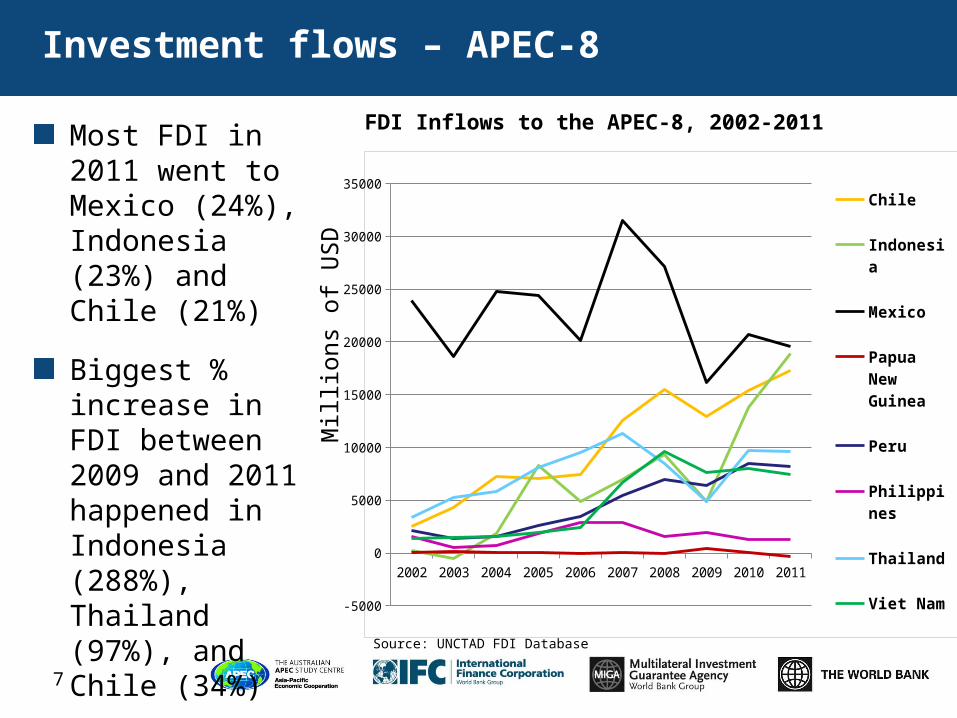
Investment flows – APEC-8
Most FDI in 2011 went to Mexico (24%), Indonesia (23%) and Chile (21%)
Biggest % increase in FDI between 2009 and 2011 happened in Indonesia (288%), Thailand (97%), and Chile (34%)
7
Mill
ions
of
US
D
Source: UNCTAD FDI Database
FDI Inflows to the APEC-8, 2002-2011
2002 2003 2004 2005 2006 2007 2008 2009 2010 2011
-5000
0
5000
10000
15000
20000
25000
30000
35000
Chile
Indonesia
Mexico
Papua New Guinea
Peru
Philippines
Thailand
Viet Nam
Prospects for FDI recovery: 2012-2014
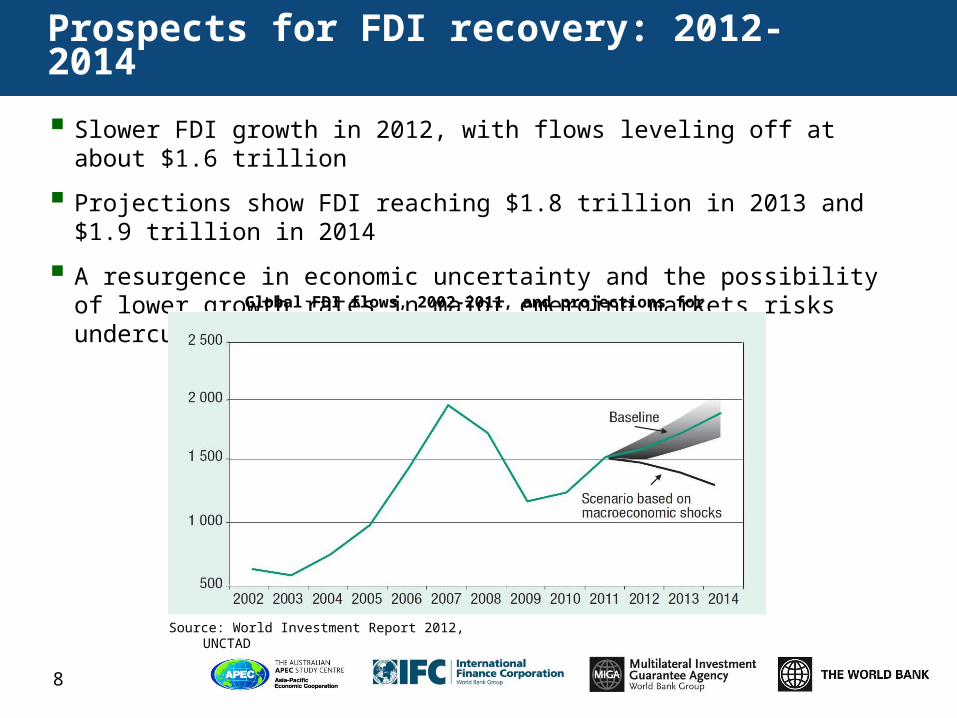
Slower FDI growth in 2012, with flows leveling off at about $1.6 trillion
Projections show FDI reaching $1.8 trillion in 2013 and $1.9 trillion in 2014
A resurgence in economic uncertainty and the possibility of lower growth rates in major emerging markets risks undercutting this favorable trend
Source: World Investment Report 2012, UNCTAD
Global FDI flows, 2002-2011, and projections for 2012-2014
8

Top 20 source countries for FDI in 2011
9
US = Japan + UK + France + Hong Kong
US$ billion
What can governments do to improve their chances?
Longer term:
Better infrastructure and skills ..... Expensive investments
Market size/growth and factor costs are functions of the
market - difficult to influence.
Proximity to markets, climate, resource endowments, and
other natural characteristics are what they are.
10

Short term:
A better investment climate:
Can be achieved with greater simplicity, transparency, and predictability
Is a result of better public organization, coordination, and communication with the private sector
Reduces costs and risk to investors, instantly improving the expected return on investment for your location
Good facilitation - compensates (at least to an extent) for weaknesses in the investment climate, giving investors clarity and security where there is none, through the provision of information and assistance.
11
What can governments do to improve their chances?
Why IPIs should bridge the corporate information gap
Information markets do not work perfectly. As a result, companies often limit their search to those locations they are already familiar with.
Effective IPI marketing convinces companies to consider different countries and new types of opportunities.
Current financial instability may make companies more cautious about their medium-term foreign expansions.
Making investor-relevant information easily available lessens their perceptions of risk.
Having highly relevant, accurate, and up-to-date information reduces an investor’s market entry cost.
Providing that information to investors, makes a location more competitive.
12

13
GIPB ResultsGIPB Results
FDI in the Current marketFDI in the Current market
Implications for IPIsImplications for IPIs
Learning Objectives of the CourseLearning Objectives of the Course
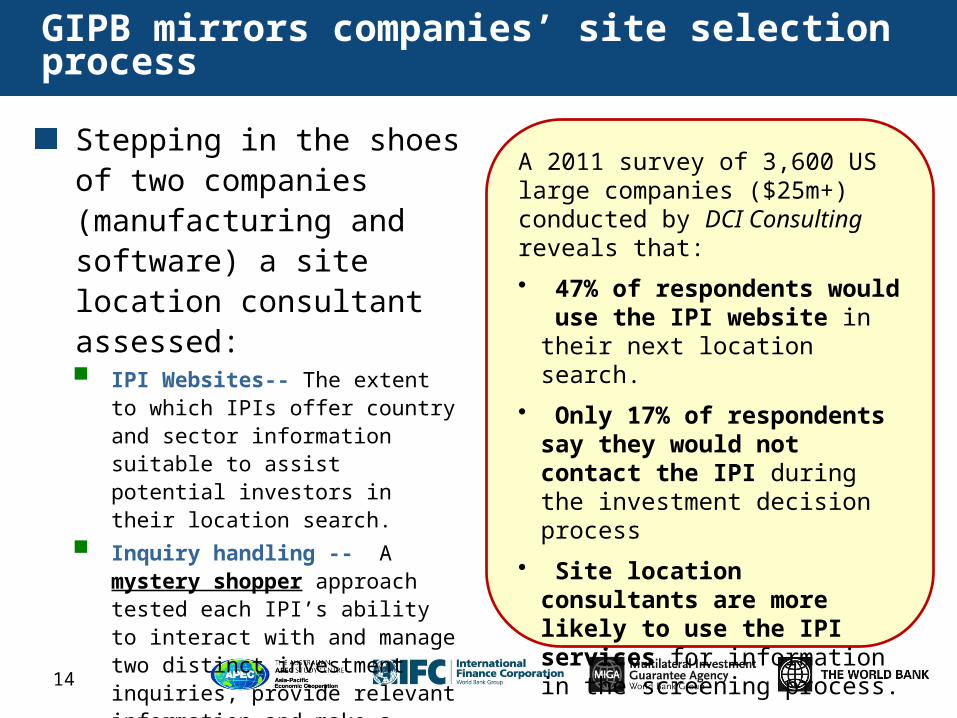
GIPB mirrors companies’ site selection process
Stepping in the shoes of two companies (manufacturing and software) a site location consultant assessed: IPI Websites-- The extent to which
IPIs offer country and sector information suitable to assist potential investors in their location search.
Inquiry handling -- A mystery shopper approach tested each IPI’s ability to interact with and manage two distinct investment inquiries, provide relevant information and make a business case for investment.
14
A 2011 survey of 3,600 US large companies ($25m+) conducted by DCI Consulting reveals that:
• 47% of respondents would use the IPI website in their next location search.
• Only 17% of respondents say they would not contact the IPI during the investment decision process
• Site location consultants are more likely to use the IPI services for information in the screening process.
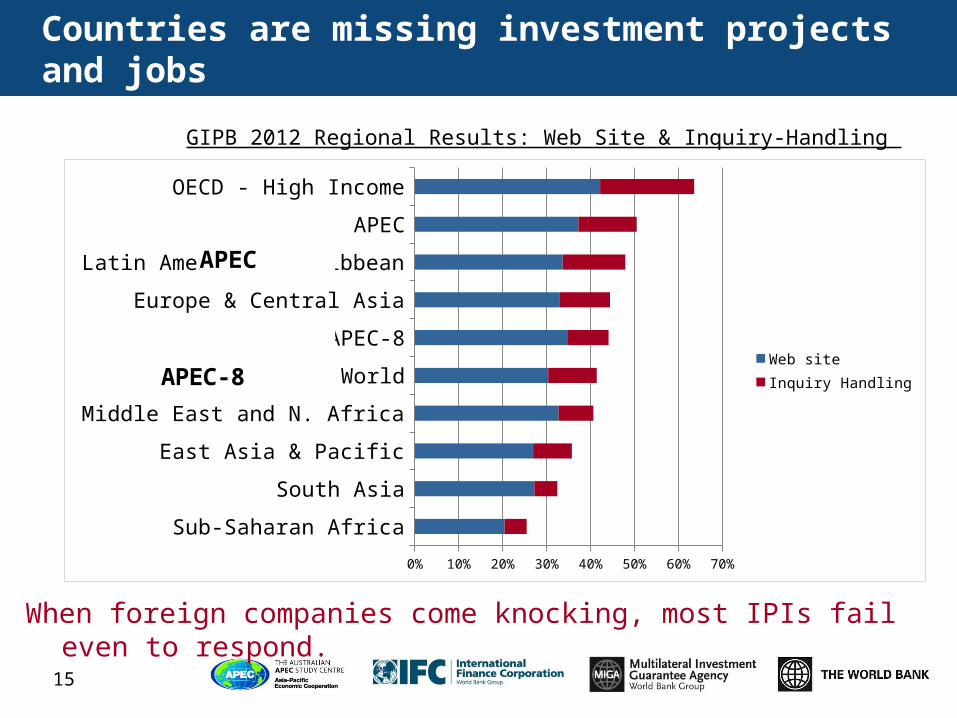
Countries are missing investment projects and jobs
15
GIPB 2012 Regional Results: Web Site & Inquiry-Handling
Sub-Saharan Africa
South Asia
East Asia & Pacific
Middle East and N. Africa
World
APEC-8
Europe & Central Asia
Latin America & Caribbean
APEC
OECD - High Income
0% 10% 20% 30% 40% 50% 60% 70%
Web site
Inquiry Handling
APEC-8
APEC
When foreign companies come knocking, most IPIs fail even to respond.

2009-2012 trends
Overall, Web sites improved from 59% to 61%.
Average inquiry-handling dropped from an already weak 28% to 22%.
APEC-8, LAC, and SSA were flat.
Only MENA showed significant progress.
All other regions did worse in 2012.
Regional Comparison 2006*, 2009, 2012
16
% change from GIPB 2009
*GIPB 2006 did not assess Australia , Brunei Darussalam, Canada, Chinese Taipei, Japan, Malaysia, Mexico, New Zealand, Peru, Russia, or the United States.
0%
10%
20%
30%
40%
50%
60%
70%
80%
GIPB 2006GIPB 2009GIPB 2012
0%
-3%-4%
6%1%
-5%1%
-2%
-6%
APEC-8
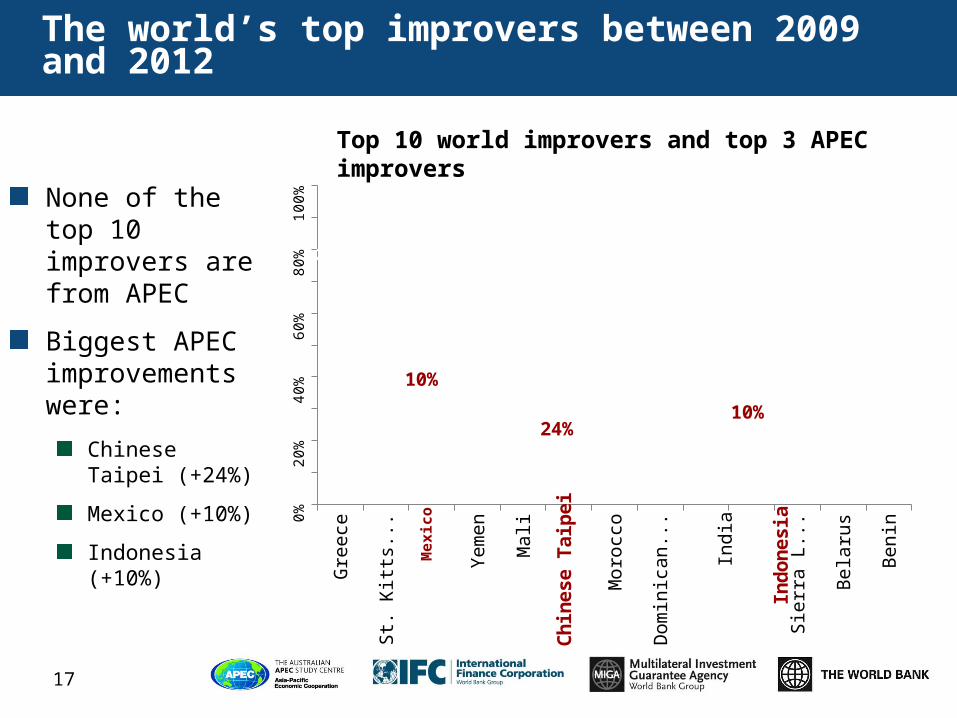
The world’s top improvers between 2009 and 2012
None of the top 10 improvers are from APEC
Biggest APEC improvements were:
Chinese Taipei (+24%)
Mexico (+10%)
Indonesia (+10%)
17
Top 10 world improvers and top 3 APEC improvers
Gre
ece
St.
Kitt
s a
nd
...
Ye
me
n
Ma
li
Mo
rocc
o
Do
min
ica
n R
...
Ind
ia
Sie
rra
Le
on
e
Be
laru
s
Be
nin0%
20%
40%
60%
80%
100%
28 %
31%
10%
40% 52%
24%
41% 36% 25%
10% 33% 26%
26%
Mex
ico
Ch
ines
e T
aip
ei
In
don
esia
Ind
ia

APEC performance (by tier)
18
BEST PRACTICE: 81-100%
GOOD: 61-80%
AVERAGE: 41-60%
WEAK: 21-40%
VERY WEAK: 0-20%
Hong Kong, China
AustraliaCanada
New Zealand Singapore
Brunei Darussalam Chile Chinese Taipei Indonesia Japan Rep. of Korea Malaysia Mexico Peru Philippines Thailand USA
Papua New GuineaPeople’s Republic of China
Viet Nam
Russia
19
GIPB ResultsGIPB Results
FDI in the Current MarketFDI in the Current Market
Implications for IPIsImplications for IPIs
Learning Objectives of the CourseLearning Objectives of the Course

20
Get the basics right …… facilitation, facilitation, facilitation
IPIs underestimate what is needed
Without proper facilitation no investment promotion effort will pay off
The smaller the IPI budget, the more sense facilitation makes
Focus on the basics: Walk before you run
Countries where doing business is more challenging
Bigger role for the IPI to inform and facilitate foreign investors
Lesser known countries
Bridge the information gap through the work of the IPI to attract investment
The Web allows all IPIs to promote cost-effectively
…... but there must also be a capacity to directly interact with investors
21
GIPB ResultsGIPB Results
FDI in the Current MarketFDI in the Current Market
Learning Objectives of the CourseLearning Objectives of the Course
Implications for IPIsImplications for IPIs

Learning objectives of the GIPB course
Day One
Understand the types of information investors need and their process for site selection decision making
Engage in a simulated investor inquiry simulation and discuss the realities and challenges of competing for investment
Review a case study of why the application of good investment facilitation techniques matters
Learn how to effectively promote your location online
22
Learning objectives of the GIPB course
Day Two
Apply learning about online investment promotion from Day One to a case on an IPI Web site
Understand the standards of performance for providing support to investors and how to evaluate the quality of responses to investor inquiries
Learn how to meet investors’ information needs through the appropriate design of IPI services and supporting systems and processes
Engage in an effective inquiry handling exercise
Develop an action plan to strengthen investment facilitation
23
Thank you.
Questions