Embed Size (px)
Citation preview
CONFIDENTIAL
FCF and Economic Profit
ValuationGreg [email protected]+44 207 88 33 643
David [email protected]+44 207 88 33 645
CONFIDENTIAL
1
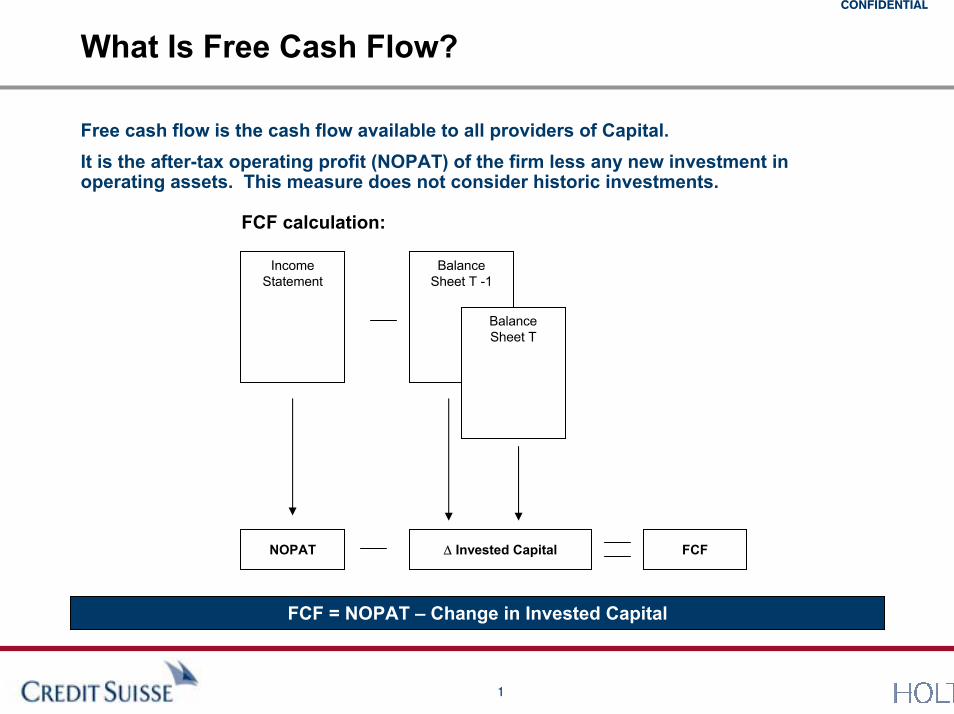
What Is Free Cash Flow?
Free cash flow is the cash flow available to all providers of Capital. It is the after-tax operating profit (NOPAT) of the firm less any new investment in operating assets. This measure does not consider historic investments.
FCF calculation:
IncomeStatement
BalanceSheet T -1
Balance Sheet T
NOPAT ∆ Invested Capital FCF
FCF = NOPAT � Change in Invested Capital
CONFIDENTIAL
2
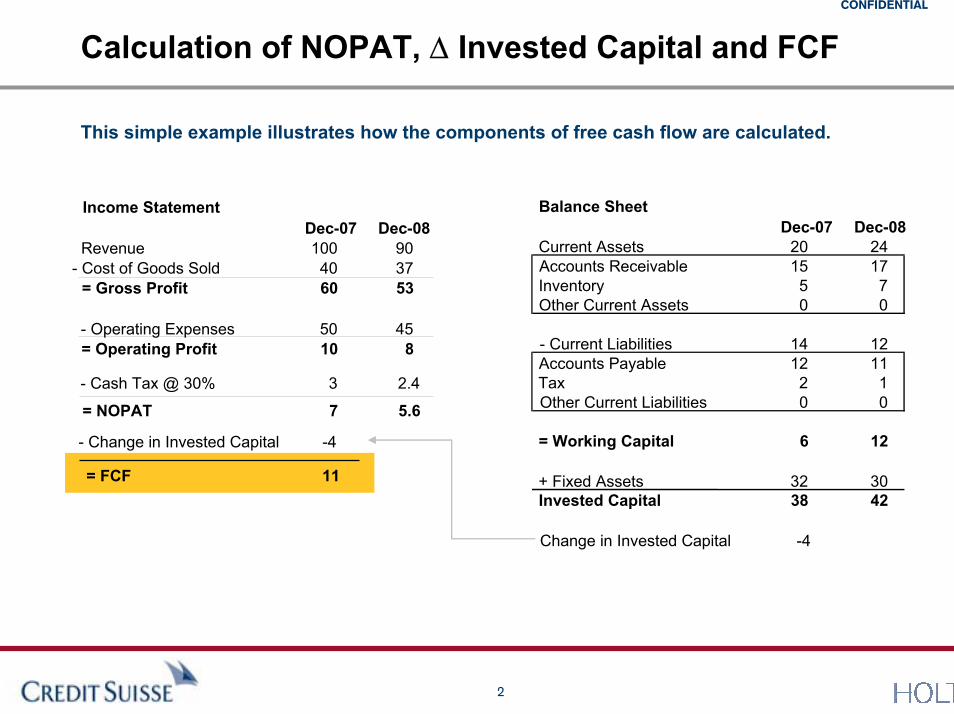
Calculation of NOPAT, ∆ Invested Capital and FCF
This simple example illustrates how the components of free cash flow are calculated.
Balance SheetDec-07 Dec-08
Current Assets 20 24Accounts Receivable 15 17Inventory 5 7Other Current Assets 0 0
Income StatementDec-071004060
Dec-08903753
Revenue- Cost of Goods Sold
= Gross Profit
- Operating Expenses= Operating Profit
5010
458
- Cash Tax @ 30% 3 2.4
= NOPAT 7 5.6
- Current Liabilities 14 12Accounts Payable 12 11Tax 2 1Other Current Liabilities 0 0
= Working Capital 6 12
+ Fixed Assets 32 30Invested Capital 38 42
Change in Invested Capital -4
= FCF 11
- Change in Invested Capital -4
CONFIDENTIAL
3
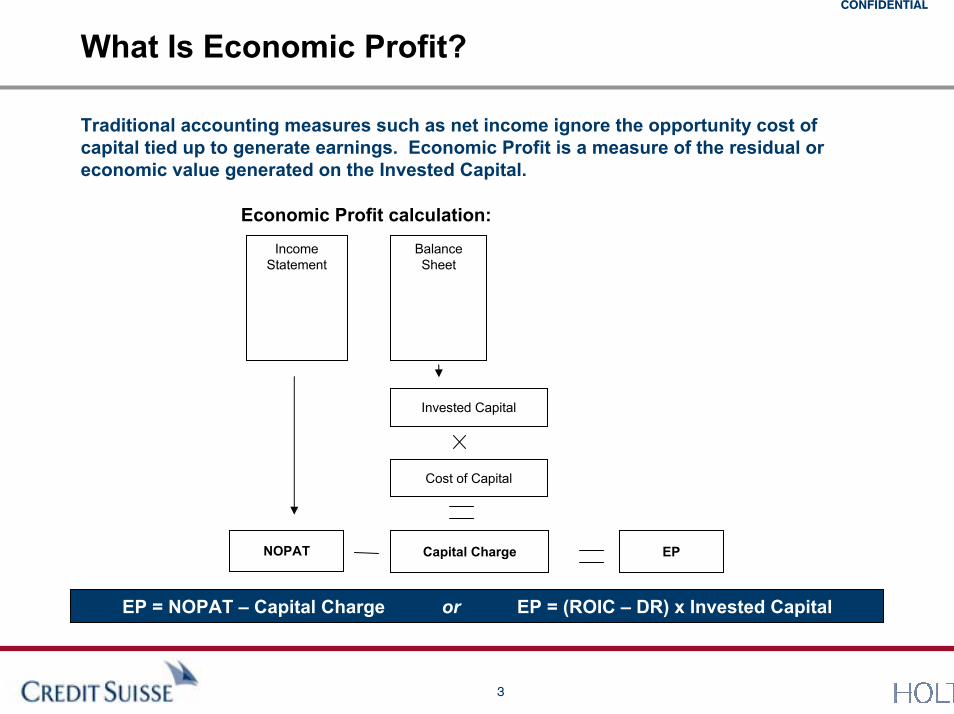
What Is Economic Profit?
Traditional accounting measures such as net income ignore the opportunity cost of capital tied up to generate earnings. Economic Profit is a measure of the residual or economic value generated on the Invested Capital.
Cost of Capital
EP
BalanceSheet
Invested Capital
IncomeStatement
NOPAT Capital Charge
Economic Profit calculation:
EP = NOPAT � Capital Charge or EP = (ROIC � DR) x Invested Capital
CONFIDENTIAL
4
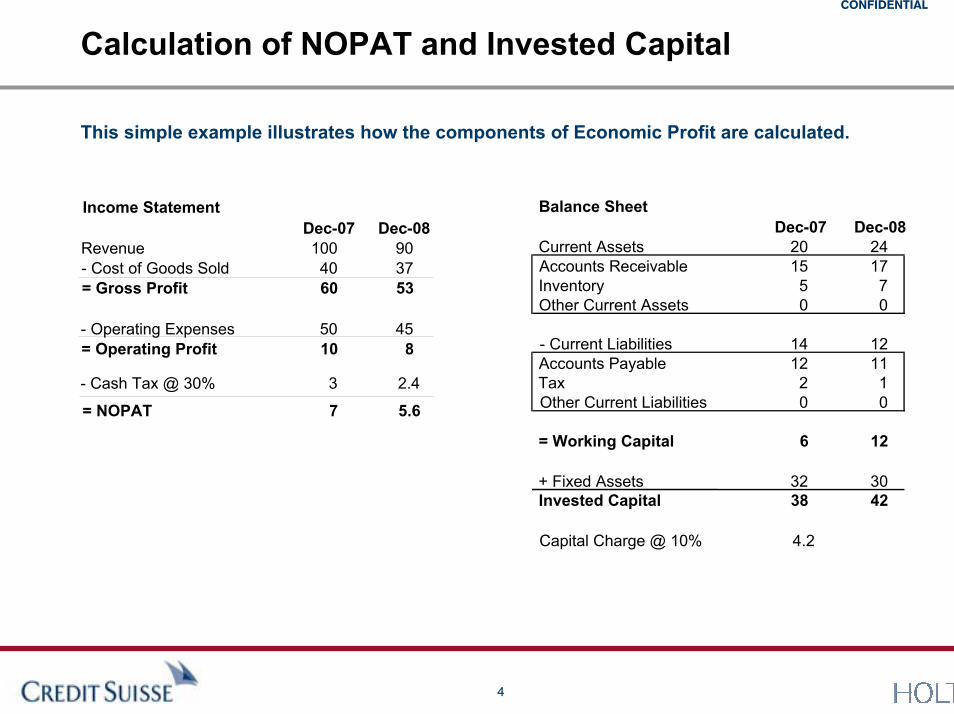
Calculation of NOPAT and Invested Capital
This simple example illustrates how the components of Economic Profit are calculated.
Balance SheetDec-07 Dec-08
Current Assets 20 24Accounts Receivable 15 17Inventory 5 7Other Current Assets 0 0
Income StatementDec-071004060
Dec-08903753
Revenue- Cost of Goods Sold= Gross Profit
- Operating Expenses= Operating Profit
5010
458
- Cash Tax @ 30% 3 2.4
= NOPAT 7 5.6
- Current Liabilities 14 12Accounts Payable 12 11Tax 2 1Other Current Liabilities 0 0
= Working Capital 6 12
+ Fixed AssetsInvested Capital
3238
3042
Capital Charge @ 10% 4.2
CONFIDENTIAL
5
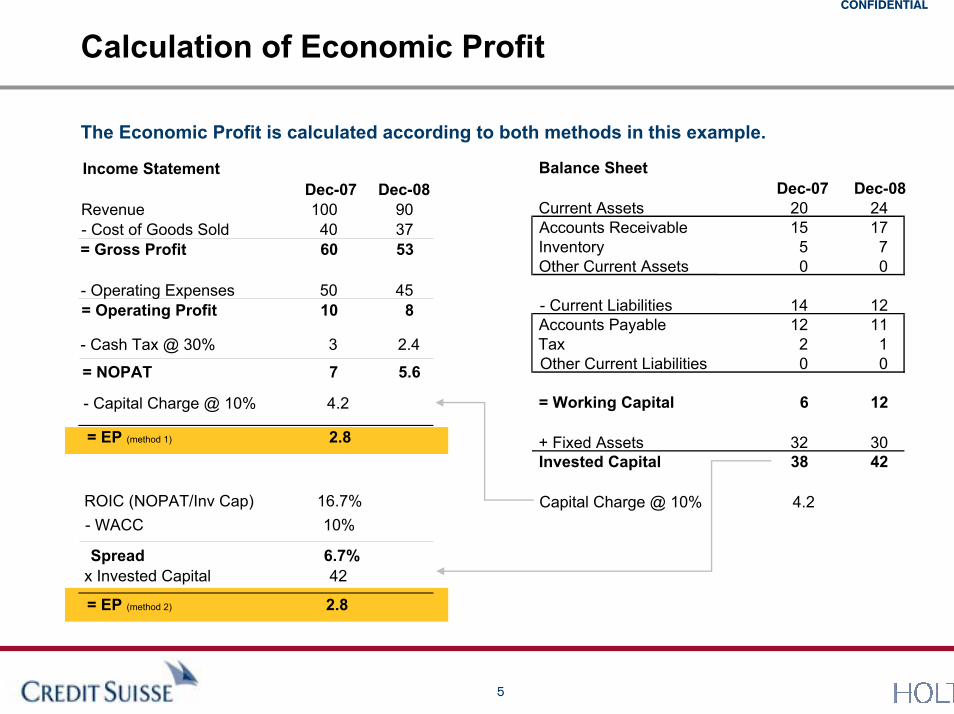
Calculation of Economic Profit
The Economic Profit is calculated according to both methods in this example.
Balance SheetDec-07 Dec-08
Current Assets 20 24Accounts Receivable 15 17Inventory 5 7Other Current Assets 0 0
Income StatementDec-071004060
Dec-08903753
Revenue- Cost of Goods Sold= Gross Profit
- Operating Expenses= Operating Profit
5010
458
- Cash Tax @ 30% 3 2.4
= NOPAT 7 5.6
- Current Liabilities 14 12Accounts Payable 12 11Tax 2 1Other Current Liabilities 0 0
= Working Capital 6 12
+ Fixed Assets 32 30Invested Capital 38 42
Capital Charge @ 10% 4.2
= EP (method 1) 2.8
- Capital Charge @ 10% 4.2
= EP (method 2)
ROIC (NOPAT/Inv Cap) 16.7%- WACC 10%
Spread 6.7%x Invested Capital 42
2.8
CONFIDENTIAL
6
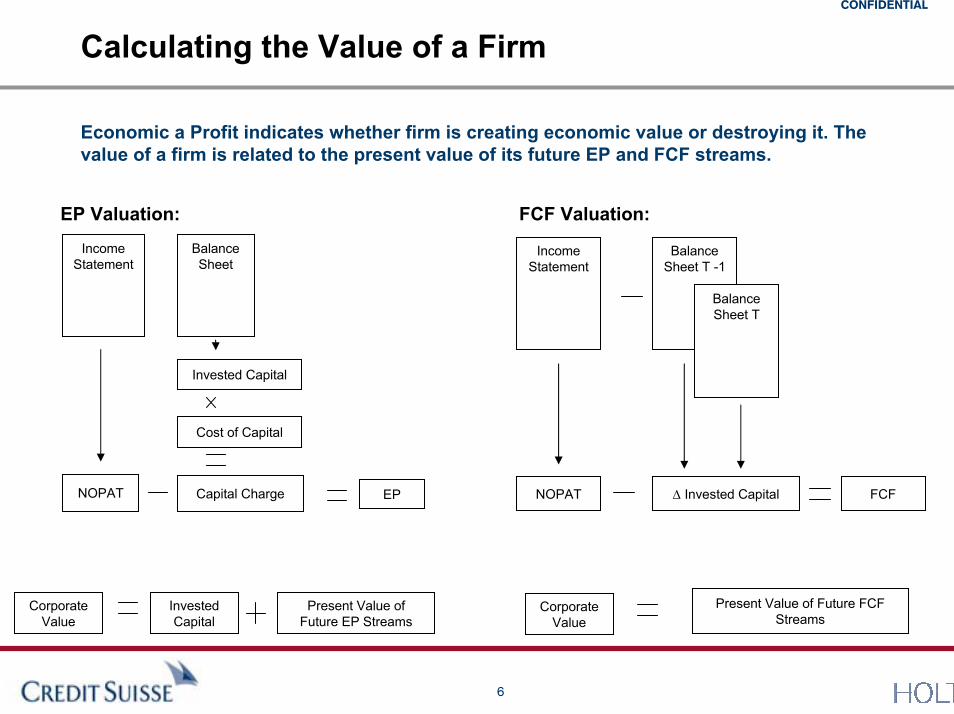
Calculating the Value of a Firm
Economic a Profit indicates whether firm is creating economic value or destroying it. The value of a firm is related to the present value of its future EP and FCF streams.
EP Valuation: FCF Valuation:
IncomeStatement
BalanceSheet
IncomeStatement
BalanceSheet T -1
Balance Sheet T
Invested Capital
Cost of Capital
NOPAT Capital Charge NOPAT ∆ Invested Capital FCFEP
Present Value of Future FCF Streams
Corporate Value
Invested Capital
Present Value of Future EP Streams
Corporate Value
CONFIDENTIAL
7
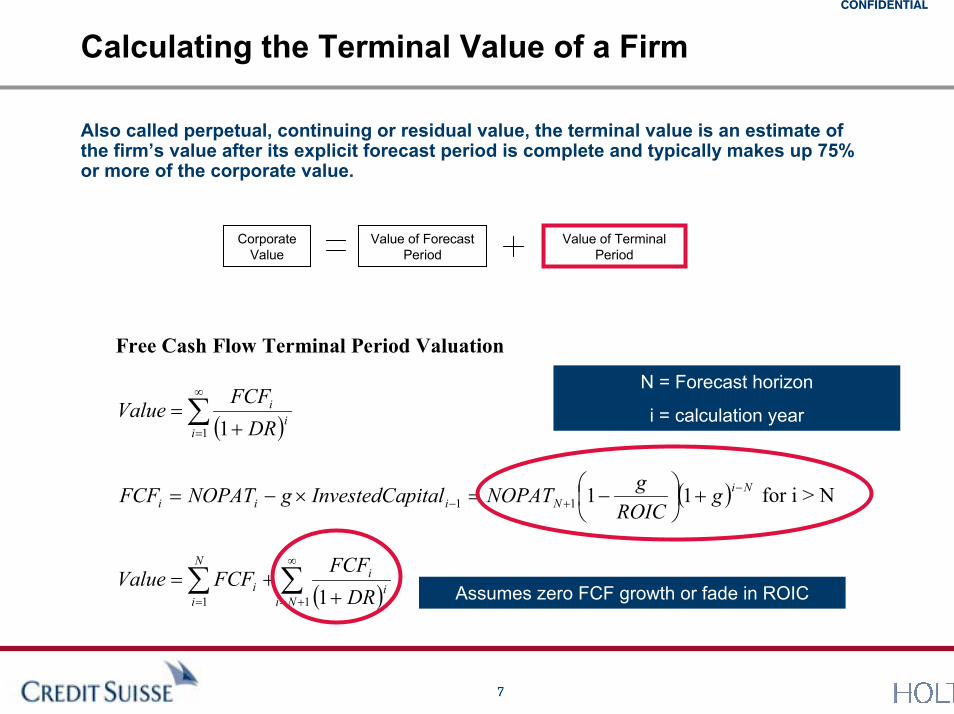
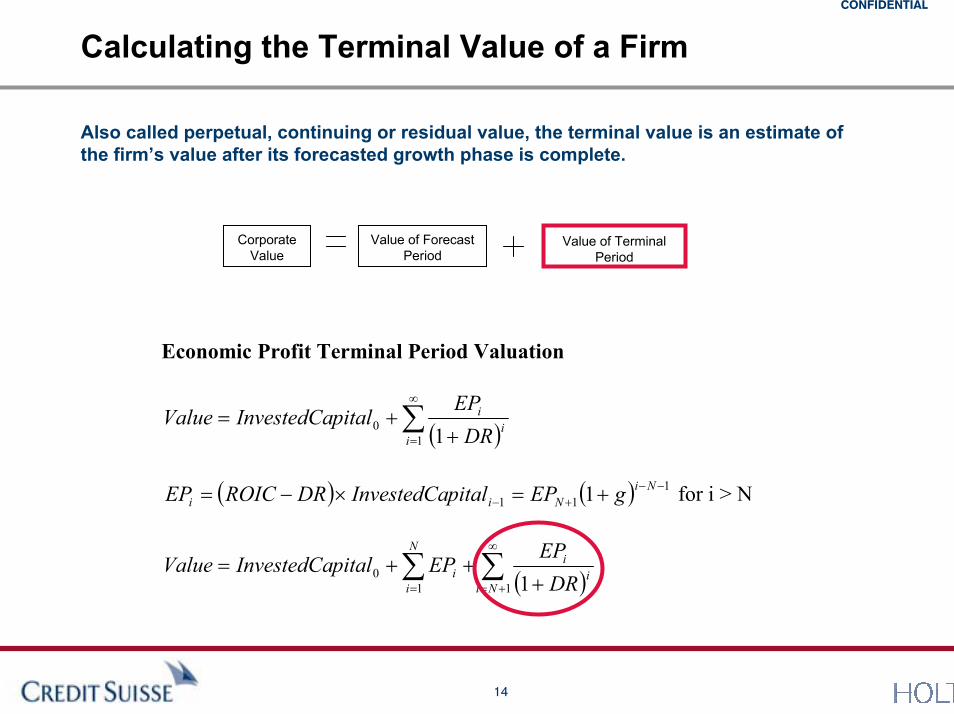
Calculating the Terminal Value of a Firm
Also called perpetual, continuing or residual value, the terminal value is an estimate of the firm�s value after its explicit forecast period is complete and typically makes up 75% or more of the corporate value.
Value of Terminal Period
Corporate Value
Value of Forecast Period
Free Cash Flow Terminal Period Valuation
( )∑∞
= +=
1 1ii
i
DRFCF
Value
( ) NiNiii g
ROICgNOPATpitalInvestedCagNOPATFCF −
+− +⎟⎠⎞
⎜⎝⎛ −=×−= 1111 for i > N
( )∑∑∞
+== ++=
11 1Nii
iN
ii DR
FCFFCFValue
Assumes zero FCF growth or fade in ROIC
N = Forecast horizon
i = calculation year
CONFIDENTIAL
8
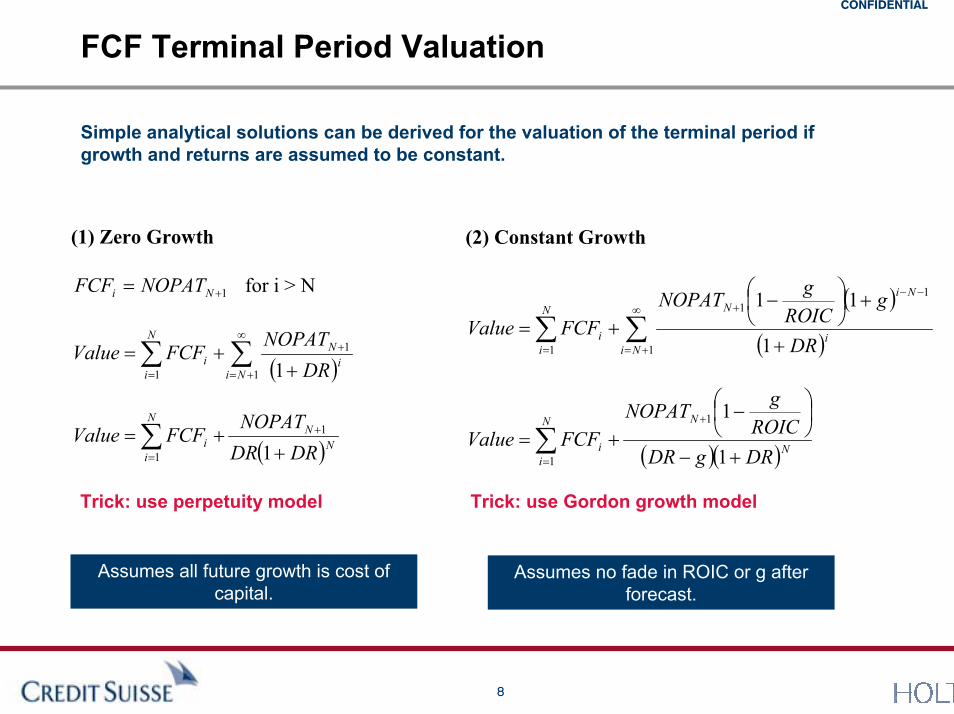
FCF Terminal Period Valuation
Simple analytical solutions can be derived for the valuation of the terminal period if growth and returns are assumed to be constant.
(1) Zero Growth
1+= Ni NOPATFCF for i > N
( )∑∑∞
+=
+
= ++=
1
1
1 1Nii
NN
ii DR
NOPATFCFValue
( )NN
N
ii DRDR
NOPATFCFValue
++= +
=∑ 1
1
1
(2) Constant Growth
( )
( )∑∑∞
+=
−−+
= +
+⎟⎠⎞
⎜⎝⎛ −
+=1
11
1 1
11
Nii
NiNN
ii DR
gROICgNOPAT
FCFValue
( )( )NNN
ii DRgDR
ROICgNOPAT
FCFValue+−
⎟⎠⎞
⎜⎝⎛ −
+=+
=∑ 1
11
1
Trick: use perpetuity model Trick: use Gordon growth model
Assumes all future growth is cost of capital.
Assumes no fade in ROIC or g after forecast.
CONFIDENTIAL
9
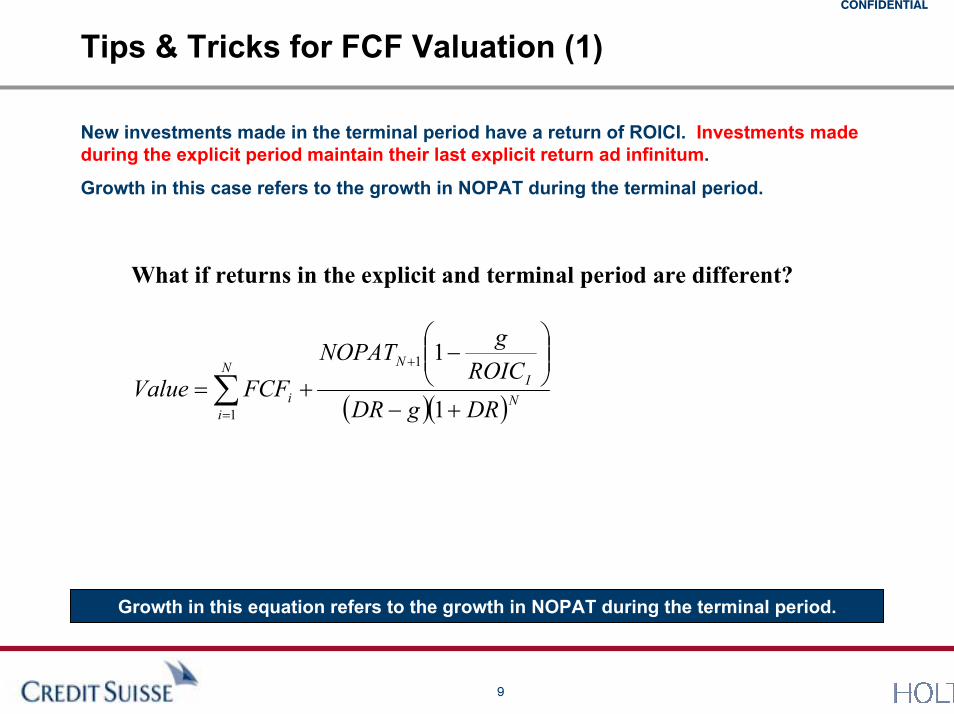
Tips & Tricks for FCF Valuation (1)
New investments made in the terminal period have a return of ROICI. Investments made during the explicit period maintain their last explicit return ad infinitum.
Growth in this case refers to the growth in NOPAT during the terminal period.
What if returns in the explicit and terminal period are different?
( )( )NI
NN
ii DRgDR
ROICgNOPAT
FCFValue+−
⎟⎟⎠
⎞⎜⎜⎝
⎛−
+=+
=∑ 1
11
1
Growth in this equation refers to the growth in NOPAT during the terminal period.

CONFIDENTIAL
10
Example of FCF Valuation
FCF Example
Initial Growth 20% Value of Explicit FCF -112Terminal Growth 5% Value of Terminal Period 2,028Initial ROIC 15% Total Value 1,916Terminal ROIIC 10%WACC 10%
Year 0 1 2 3 4 5 6Sales 1,000 1,200 1,440 1,728 2,074 2,177NOPAT 150 180 216 259 311 327
Working Capital 500 600 720 864 1,037 1,115 1,196Net Fixed Assets 500 600 720 864 1,037 1,115 1,196Invested Capital 1,000 1,200 1,440 1,728 2,074 2,229 2,392
0.1NOPAT 150 180 216 259 311 327- Investment 200 240 288 346 156 163FCF -50 -60 -72 -86 156 163
MetricsFCF -50 -60 -72 -86 156 163EP 50 60 72 86 104 104ROIC 15% 15% 15% 15% 15% 15%NOPAT Growth 20% 20% 20% 20% 5%Invested Capital Growth 20% 20% 20% 20% 8% 7%Investment Growth 20% 20% 20% -55% 5%
CONFIDENTIAL
11
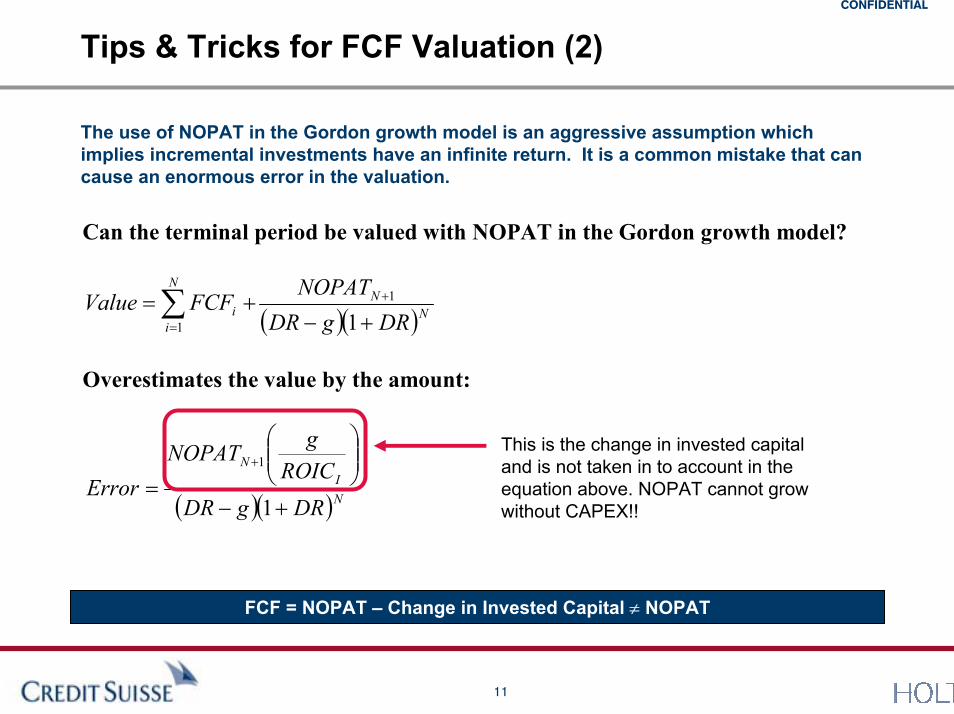
Tips & Tricks for FCF Valuation (2)
The use of NOPAT in the Gordon growth model is an aggressive assumption which implies incremental investments have an infinite return. It is a common mistake that can cause an enormous error in the valuation.
Can the terminal period be valued with NOPAT in the Gordon growth model?
( )( )NN
N
ii DRgDR
NOPATFCFValue
+−+= +
=∑ 1
1
1
Overestimates the value by the amount:
( )( )NI
N
DRgDRROICgNOPAT
Error+−
⎟⎟⎠
⎞⎜⎜⎝
⎛
=+
1
1
This is the change in invested capital and is not taken in to account in the equation above. NOPAT cannot grow without CAPEX!!
FCF = NOPAT � Change in Invested Capital ≠ NOPAT
CONFIDENTIAL
12
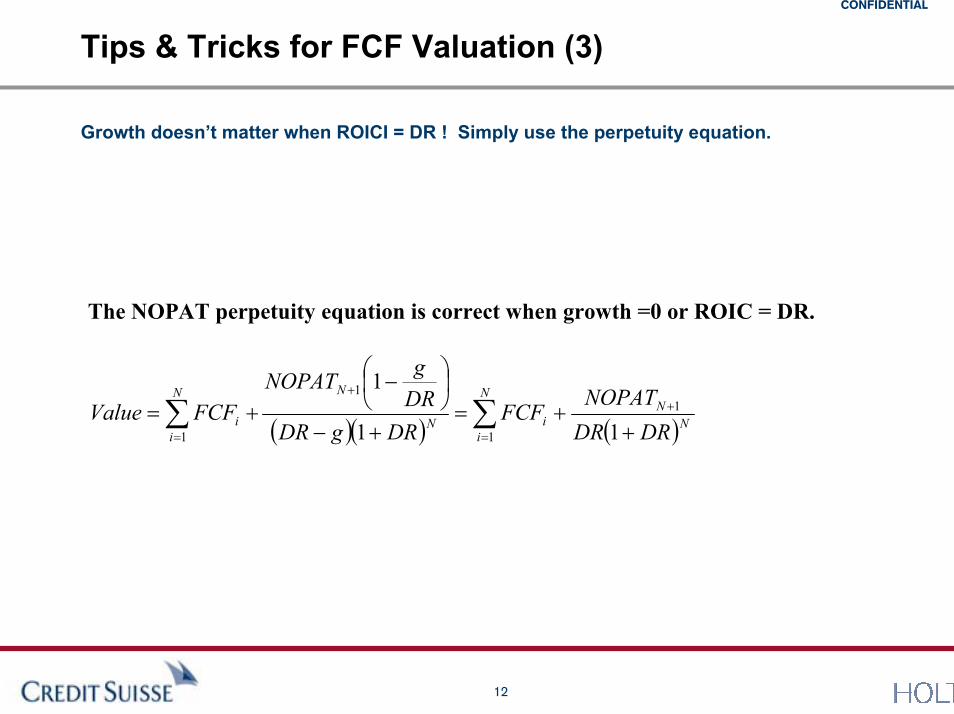
Tips & Tricks for FCF Valuation (3)
Growth doesn�t matter when ROICI = DR ! Simply use the perpetuity equation.
The NOPAT perpetuity equation is correct when growth =0 or ROIC = DR.
( )( ) ( )∑∑=
++
= ++=
+−
⎟⎠⎞
⎜⎝⎛ −
+=N
iN
NiN
NN
ii DRDR
NOPATFCF
DRgDRDRgNOPAT
FCFValue1
11
1 11
1
CONFIDENTIAL
13
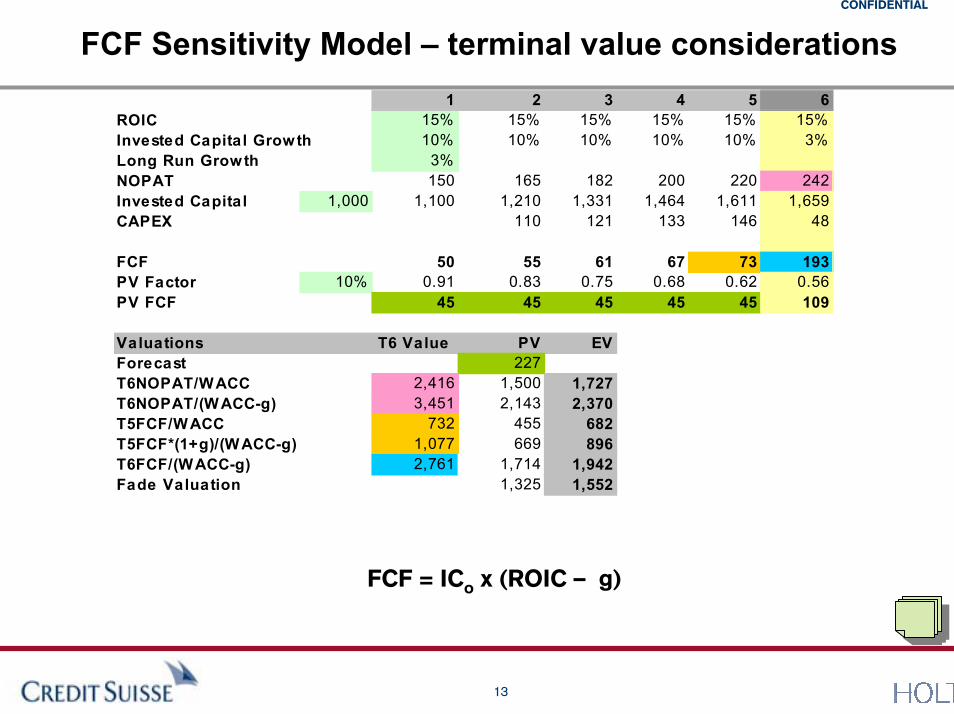
FCF Sensitivity Model � terminal value considerations1 2 3 4 5 6
ROIC 15% 15% 15% 15% 15% 15%Invested Capital Growth 10% 10% 10% 10% 10% 3%Long Run Growth 3%NOPAT 150 165 182 200 220 242Invested Capital 1,000 1,100 1,210 1,331 1,464 1,611 1,659CAPEX 110 121 133 146 48
FCF 50 55 61 67 73 193PV Factor 10% 0.91 0.83 0.75 0.68 0.62 0.56PV FCF 45 45 45 45 45 109
Valuations T6 Value PV EVForecast 227T6NOPAT/WACC 2,416 1,500 1,727T6NOPAT/(WACC-g) 3,451 2,143 2,370T5FCF/WACC 732 455 682T5FCF*(1+g)/(WACC-g) 1,077 669 896T6FCF/(WACC-g) 2,761 1,714 1,942Fade Valuation 1,325 1,552
FCF = ICo x (ROIC � g)
CONFIDENTIAL
14
Calculating the Terminal Value of a Firm
Also called perpetual, continuing or residual value, the terminal value is an estimate of the firm�s value after its forecasted growth phase is complete.
Value of Terminal Period
Corporate Value
Value of Forecast Period
Economic Profit Terminal Period Valuation
( )∑∞
= ++=
10 1i
ii
DREP
pitalInvestedCaValue
( ) ( ) 1
11 1 −−+− +=×−= Ni
Nii gEPpitalInvestedCaDRROICEP for i > N
( )∑∑∞
+== +++=
110 1Ni
ii
N
ii DR
EPEPpitalInvestedCaValue
CONFIDENTIAL
15
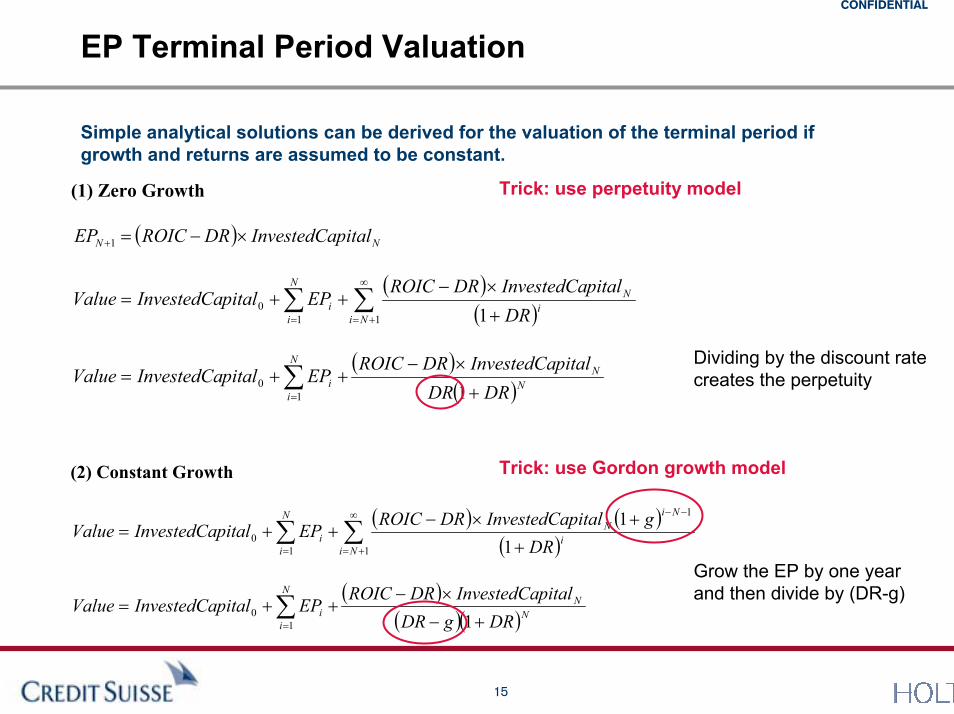
EP Terminal Period Valuation
Simple analytical solutions can be derived for the valuation of the terminal period if growth and returns are assumed to be constant.
Trick: use perpetuity model(1) Zero Growth
( ) NN pitalInvestedCaDRROICEP ×−=+1
( )( )∑∑
∞
+== +
×−++=
110 1Ni
iN
N
ii DR
pitalInvestedCaDRROICEPpitalInvestedCaValue
( )
( )NN
N
ii DRDR
pitalInvestedCaDRROICEPpitalInvestedCaValue
+
×−++= ∑
= 110
Dividing by the discount rate creates the perpetuity
Trick: use Gordon growth model(2) Constant Growth
( ) ( )( )∑∑
∞
+=
−−
= +
+×−++=
1
1
10 1
1Ni
i
NiN
N
ii DR
gpitalInvestedCaDRROICEPpitalInvestedCaValue
( )
( )( )NN
N
ii DRgDR
pitalInvestedCaDRROICEPpitalInvestedCaValue
+−
×−++= ∑
= 110
Grow the EP by one year and then divide by (DR-g)
CONFIDENTIAL
16
Tips & Tricks for EP Valuation (1)
New investments made in the terminal period have a return of ROICI. Investments made during the explicit period maintain their last explicit return ad infinitum. Growth in this case refers to the growth in NOPAT during the terminal period.
What if returns in the explicit and terminal period are different?
( )
( )
( )( )NI
IN
NN
N
ii DRgDRDR
DRROICROICgNOPAT
DRDREP
EPInvCapValue+−
−⎟⎟⎠
⎞⎜⎜⎝
⎛
++
++=+
+
=∑ 11
11
10
Growth in this equation refers to the growth in NOPAT during the terminal period.
CONFIDENTIAL
17
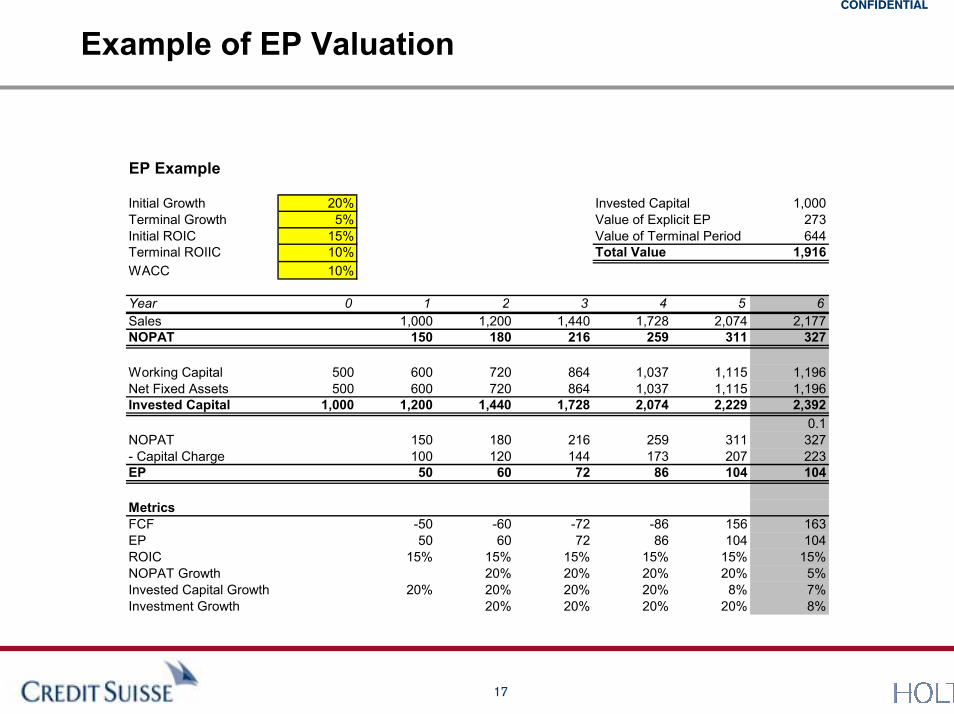
Example of EP Valuation
EP Example
Initial Growth 20% Invested Capital 1,000Terminal Growth 5% Value of Explicit EP 273Initial ROIC 15% Value of Terminal Period 644Terminal ROIIC 10% Total Value 1,916WACC 10%
Year 0 1 2 3 4 5 6Sales 1,000 1,200 1,440 1,728 2,074 2,177NOPAT 150 180 216 259 311 327
Working Capital 500 600 720 864 1,037 1,115 1,196Net Fixed Assets 500 600 720 864 1,037 1,115 1,196Invested Capital 1,000 1,200 1,440 1,728 2,074 2,229 2,392
0.1NOPAT 150 180 216 259 311 327- Capital Charge 100 120 144 173 207 223EP 50 60 72 86 104 104
MetricsFCF -50 -60 -72 -86 156 163EP 50 60 72 86 104 104ROIC 15% 15% 15% 15% 15% 15%NOPAT Growth 20% 20% 20% 20% 5%Invested Capital Growth 20% 20% 20% 20% 8% 7%Investment Growth 20% 20% 20% 20% 8%
CONFIDENTIAL
18
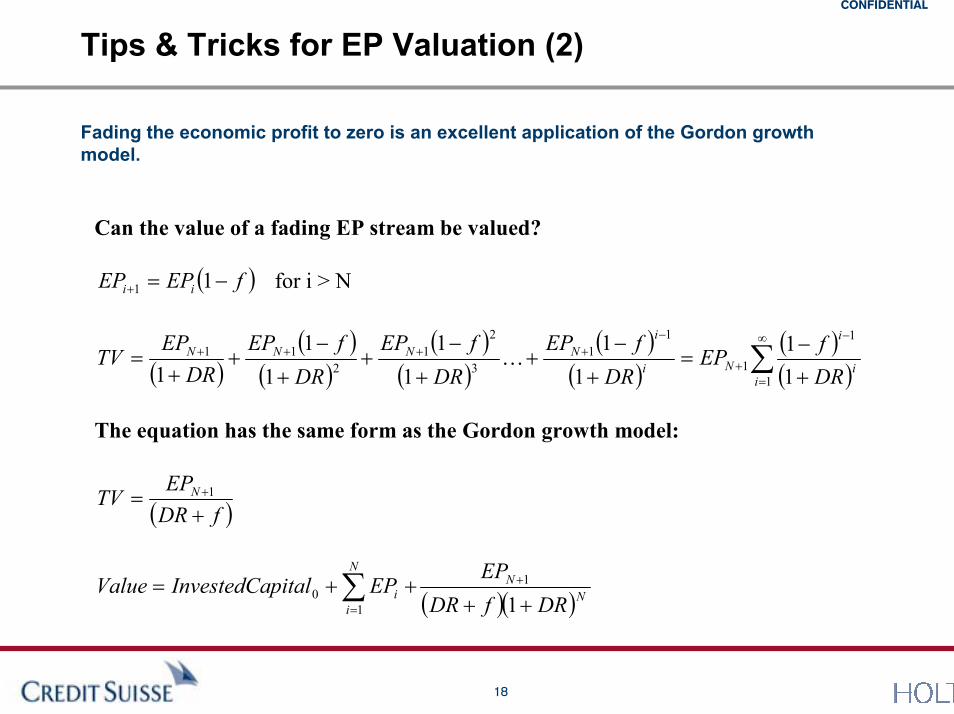
Tips & Tricks for EP Valuation (2)
Fading the economic profit to zero is an excellent application of the Gordon growth model.
Can the value of a fading EP stream be valued?
( )fEPEP ii −=+ 11 for i > N
( )( )
( )( )
( )( )
( )( )( )∑
∞
=
−
+
−++++
+−
=+
−+
+
−+
+
−+
+=
1
1
1
11
3
21
211
11
11
11
11
1 ii
i
Ni
iNNNN
DRfEP
DRfEP
DRfEP
DRfEP
DREP
TV K
The equation has the same form as the Gordon growth model:
( )fDREP
TV N
+= +1
( )( )NN
N
ii DRfDR
EPEPpitalInvestedCaValue
++++= +
=∑ 1
1
10
CONFIDENTIAL
19
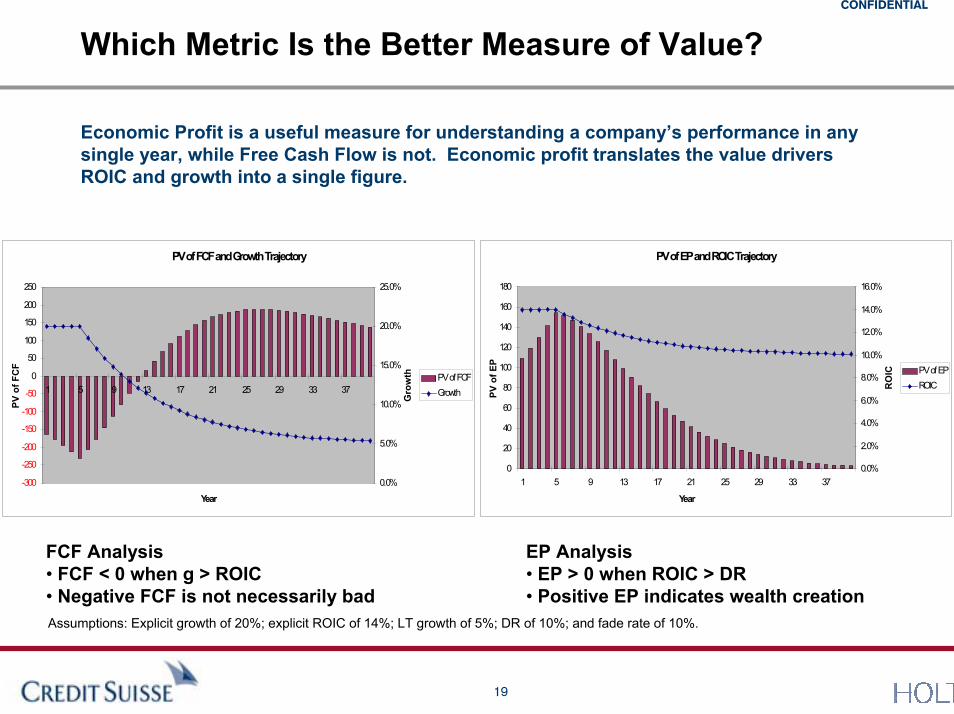
Which Metric Is the Better Measure of Value?
Economic Profit is a useful measure for understanding a company�s performance in any single year, while Free Cash Flow is not. Economic profit translates the value drivers ROIC and growth into a single figure.
PV of FCF and Growth Trajectory
-300
-250
-200
-150
-100
-50
0
50
100
150
200
250
1 5 9 13 17 21 25 29 33 37
Year
PV o
f FC
F
0.0%
5.0%
10.0%
15.0%
20.0%
25.0%
Gro
wth PV of FCF
Growth
PV of EP and ROIC Trajectory
0
20
40
60
80
100
120
140
160
180
1 5 9 13 17 21 25 29 33 37
YearPV
of E
P
0.0%
2.0%
4.0%
6.0%
8.0%
10.0%
12.0%
14.0%
16.0%
RO
IC PV of EPROIC
FCF Analysis� FCF < 0 when g > ROIC� Negative FCF is not necessarily bad
EP Analysis� EP > 0 when ROIC > DR� Positive EP indicates wealth creation
Assumptions: Explicit growth of 20%; explicit ROIC of 14%; LT growth of 5%; DR of 10%; and fade rate of 10%.

CONFIDENTIAL
20
DCF Valuation � Common Errors
Forecast horizon too short � terminal value too high (>90%)
Uneconomic continuing value � no reversion to mean returns
Cost of capital � focus on value drivers instead
Mismatch between earnings and investment growth � Capex vs earnings
Improper reflection of other liabilities - pensions
Premium to public market value � increasing value to private buyer
Double counting � using new debt and acquisition
Scenarios � too few hence too much reliance on a single point valuation
Source: Mauboussin on Strategy, Legg Mason Capital Management, March 2006. http://www.lmcm.com/pdf/CommonErrors.pdf
CONFIDENTIAL
21
Disclosure and Notice
References to Credit Suisse include all of the subsidiaries and affiliates of Credit Suisse operating under its investment banking division. For more information on our structure, please follow the attached link:
http://www.creditsuisse.com/en/who_we_are/ourstructure.html
This material has been prepared by individual sales and/or trading personnel of Credit Suisse Securities (Europe) Limited or its subsidiaries or affiliates (collectively "Credit Suisse") and not by Credit Suisse's research department. It is not investment research or a research recommendation for the purposes of FSA rules as it does not constitute substantive research or analysis. All Credit Suisse research recommendations can be accessed through the following hyperlink: https://s.research-and-analytics.csfb.com/login.asp subject to the use of a suitable login. This material is provided for information purposes, is intended for your use only and does not constitute an invitation or offer to subscribe for or purchase any of the products or services mentioned. The information provided is not intended to provide a sufficient basis on which to make an investment decision. It is intended only to provide observations and views of the said individual sales and/or trading personnel, which may be different from, or inconsistent with, the observations and views of Credit Suisse analysts or other Credit Suisse sales and/or trading personnel, or the proprietary positions of Credit Suisse. Observations and views of the salesperson or trader may change at any time without notice. Information and opinions presented in this material have beenobtained or derived from sources believed by Credit Suisse to be reliable, but Credit Suisse makes no representation as to their accuracy or completeness. Credit Suisse accepts no liability for loss arising from the use of this material. This material is directed exclusively at Credit Suisse's market professional and institutional investor customers ie market counterparties and intermediate customers as defined by the rules of the Financial Services Authority. It is not intended for private customers and such persons should not rely on this material. Moreover, any investment or service to which this material may relate, will not be made available by Credit Suisse to such private customers. All valuations are subject to Credit Suisse valuation terms. Information provided on trades executed with Credit Suisse will not constitute an official confirmation of the trade details.
FOR IMPORTANT DISCLOSURES on companies covered in Credit Suisse Investment Banking Division research reports, please see www.credit-suisse.com/researchdisclosures.
Backtested, hypothetical or simulated performance results have inherent limitations. Simulated results are achieved by the retroactive application of a backtested model itself designed with the benefit of hindsight. The backtesting of performance differs from the actual account performance because the investment strategy may be adjusted at any time, for any reason and can continue to be changed until desired or better performance results are achieved. Alternative modeling techniques or assumptions might produce significantly different results and prove to be more appropriate. Past hypothetical backtest results are neither an indicator nor a guarantee of future returns. Actual results will vary from the analysis.With respect to the analysis in this report based on the HOLT� methodology, Credit Suisse certifies that (1) the views expressed in this report accurately reflect the HOLT methodology and (2) no part of the Firm�s compensation was, is, or will be directly related to the specific views disclosed in this report. The HOLT methodology does not assign ratings to a security. It is an analytical tool that involves use of a set of proprietary quantitative algorithms and warranted value calculations, collectively called the HOLT valuation model, that are consistently applied to all the companies included in its database. Third-party data (including consensus earnings estimates) are systematically translated into a number of default variables and incorporated into the algorithms available in the HOLT valuation model. The source financial statement, pricing, and earnings data provided by outside data vendors are subject to quality control and may also be adjusted to more closely measure the underlying economics of firm performance. These adjustments provide consistency when analyzing a single company across time, or analyzing multiple companies across industries or national borders. The default scenario that is produced by the Credit Suisse HOLT valuation model establishes the baseline valuation for a security, and a userthen may adjust the default variables to produce alternative scenarios, any of which could occur. The HOLT methodology does not assign a price target to a security. The default scenario that is produced by the HOLT valuation model establishes a warranted price for a security, and as the third-party data are updated, the warranted price may also change. The default variables may also be adjusted to produce alternative warranted prices, any of which could occur. Additional information about the HOLT methodology is available on request.Credit Suisse Securities (Europe) Limited is authorised and regulated by the Financial Services Authority.
CFROI®, CFROE, HOLT, HOLTfolio, HOLTSelect, HS60, HS40, ValueSearch, AggreGator, Signal Flag and �Powered by HOLT� are trademarks or registered trademarks of Credit Suisse or itsaffiliates in the United States and other countries.HOLT is a corporate performance and valuation advisory service of Credit Suisse© 2007 Credit Suisse and its subsidiaries and affiliates. All rights reservedSeptember 1 2007