Embed Size (px)
Citation preview
FCE Bank plcIntErIm rEport and FInanCIal statEmEntsfor the half year ended 30 June 2015
2 FCE Bank plc – INTERIM REPORT AND FINANCIAL STATEMENTS – 2015
Definitions
Definitions For the purpose of this report the term i. '2014 Annual Report and Accounts' means FCE's consolidated annual financial statements as at and for the year ended
31 December 2014. ii. 'Interim Report' means FCE's consolidated interim report and financial statements as at and for the half year ended 30
June 2015. iii. 'Company' means FCE Bank plc including all its European branches, but excluding its subsidiaries and SEs. iv. ‘Europe’ means the 19 markets where FCE provides financial services. These are: Austria, Belgium, Britain, Czech
Republic, Denmark, Finland, France, Germany, Greece, Hungary, Ireland, Italy, Netherlands, Norway, Poland, Portugal, Spain, Sweden and Switzerland.
v. 'Group' or 'FCE' means the Company and its subsidiaries and SEs. vi. ‘FCSH’ means FCSH GmbH, a limited liability company incorporated under the laws of Switzerland and a direct
subsidiary of FCI. vii. 'FCI' means Ford Credit International Inc., a company incorporated under the laws of Delaware USA and a direct
subsidiary of Ford Credit. viii. 'Ford Credit' or 'FMCC' means Ford Motor Credit Company LLC, a limited liability company organised under the laws of
Delaware USA and an indirect wholly owned subsidiary of Ford. ix. 'Ford' means Ford Motor Company, a company incorporated under the laws of Delaware USA and the Group’s ultimate
parent company. In some cases, this term may mean Ford Motor Company and all or some of its affiliates. x. 'Forso' or 'the Forso JV' means a joint venture finance company established with CA Consumer Finance, a consumer
credit subsidiary of Credit Agricole S.A., in June 2008 which provides customer and dealer automotive financing in the Nordic markets.
xi. 'Risk Based Equity' or 'RBE' is a process which allocates equity based on an assessment of the inherent risk in each location. Borrowing costs are adjusted versus those reported under IFRS, to reflect the cost impact of changes in the level of debt that would be required to match the revised equity requirements. RBE enables the risk/return of individual locations to be evaluated from an FCE perspective.
xii. ‘Structured Entities’ or 'SE' means a bankruptcy-remote entity whose operations are limited to the acquisition and financing of specific assets (which may include the issue of asset backed securities and making payments on these securities) and in which FCE usually has no legal ownership or management control.
xiii. 'PRA' is the Prudential Regulation Authority, an independent non-governmental body that is a subsidiary of the Bank of England. It is responsible for the ‘Prudential’ regulation (such as capital and liquidity requirements) of the systemically important firms, including banks (as well as insurers and certain investment firms) in the United Kingdom.
xiv. 'FCA' is the Financial Conduct Authority and acts as the ‘Conduct’ regulator of firms regulated by the PRA, supervising how firms conduct their business. The FCA is looking to promote confidence and transparency in financial services and to give greater protection for consumers of financial services in the United Kingdom.
xv. ‘MBC’ is FCE’s Manchester Business Centre. For a comprehensive list of definitions refer to the 'Glossary of defined terms' on page 121 of FCE’s 2014 Annual Report and Accounts.
FCE Bank plc – INTERIM REPORT AND FINANCIAL STATEMENTS – 2015 3
Contents
Highlights ............................................................................... 4
Chief Executive Officer’s statement ..................................... 5 Business overview: Description of the business .............. 6 Overview .................................................................................. 6 Organisational Structure ......................................................... 6 Product segments .................................................................... 6 Major markets .......................................................................... 7 Principal risks and uncertainties ............................................. 7 Risk management .................................................................... 7 Business performance update ............................................. 8 Business environment ............................................................. 8 Profit performance summary .................................................... 8 Net loans and advances to customers ................................... 10 Net credit losses .................................................................... 10 Retail past due exposures ..................................................... 11 Analysis of retail past due exposures .................................... 11 Capital.................................................................................... 12 Dividends ............................................................................... 12 Funding .................................................................................. 12 Liquidity.................................................................................. 13 Credit ratings ......................................................................... 14 Future prospects ................................................................... 14
Statement of directors' responsibilities .................................. 15 Independent review report to FCE Bank plc .......................... 16
Condensed consolidated half-yearly statement of profit and loss and other comprehensive income .................................. 17 Condensed consolidated half-yearly statement of financial position .................................................................................. 18 Condensed consolidated half-yearly statement of cash flows .............................................................................. 19 Condensed consolidated half-yearly statement of changes in equity ................................................................................. 20 Index to the notes to the condensed consolidated half-yearly financial statements for the half year ended 30 June 2015.... 21 Notes to the condensed consolidated half-yearly financial statements for the half year ended 30 June 2015 .................. 22
Key financial ratios and terms ................................................ 42 Website addresses ................................................................ 44
Financial statements Review for the half year ended 30 June 2015
Other information
Review for the half year ended 30 June 2015
4 FCE Bank plc – INTERIM REPORT AND FINANCIAL STATEMENTS – 2015
Highlights
10
8
76 8
1
34
115
99
11
1
86
121
107
91
91
59
106
125
124
100
123
1st Half2011
2nd Half2011
1st Half2012
2nd Half2012
1st Half2013
2nd Half2013
1st Half2014
2nd Half2014
1st Half2015
PBT
Profit from Operating Activitiesas calculated on page 7
0.22%
0.19%
0.21%0.20%
0.19%
0.17%
0.12%
0.16%
0.10%
1st Half2011
2011 1st Half2012
2012 1st Half2013
2013 1st Half2014
2014 1st Half2015
Net losses as % of average net loans andadvances (excludes exceptional items)
11,288
9,783
9,0648,703
9,541 9,351
10,724 10,54811,066
201130-Jun
201131-Dec
201230-Jun
201231-Dec
201330-Jun
201331-Dec
201430-Jun
201431-Dec
201530-Jun
Total Net Loans andAdvances to Customers
Profit before tax (PBT)£ Millions
Credit loss ratio
Total Net Loans and Advances£ Millions
Review for the half year ended 30 June 2015
FCE Bank plc – INTERIM REPORT AND FINANCIAL STATEMENTS – 2015 5
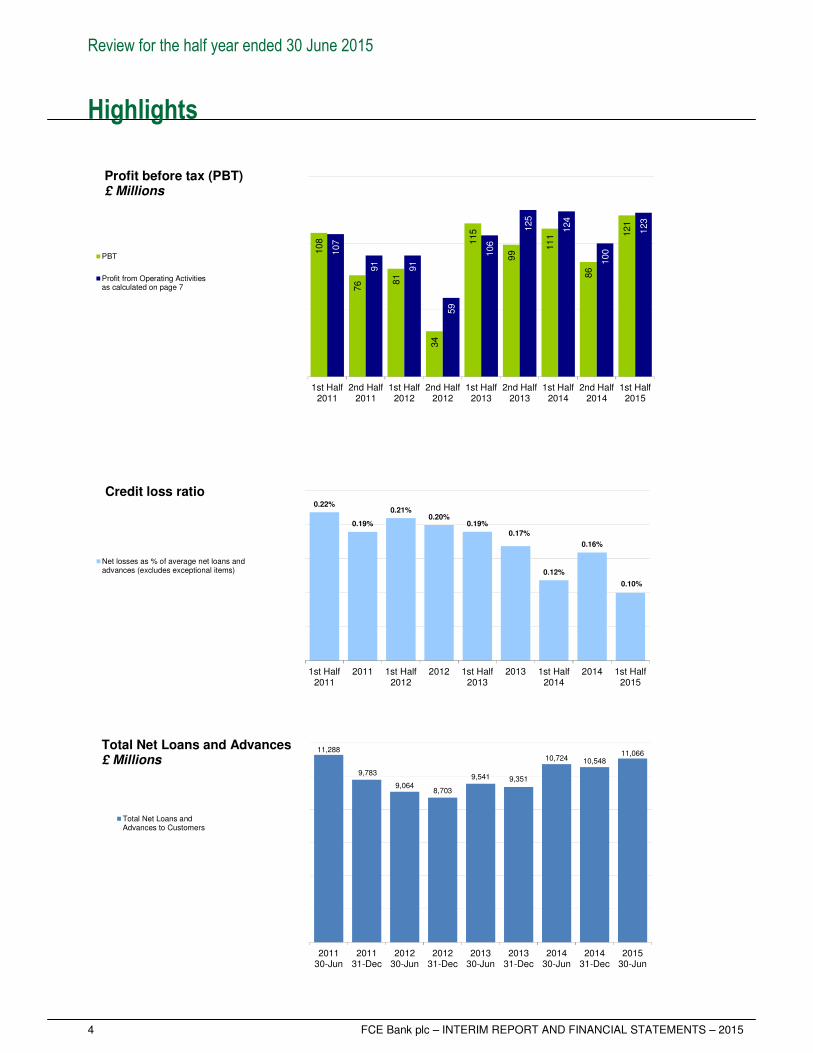
Chief Executive Officer’s statement I am pleased to report that FCE Bank enjoyed a strong first half as it continues to successfully grow its business in a controlled manner. Total loans and advances have grown by about £2 billion since 2012 whilst our effective management of credit risk continues to deliver historically low credit losses. This performance is reflected in a solid first half profit of £121 million. Our strong results would not have been possible without the expertise and the dedication of FCE’s team in 15 European countries. I take this opportunity to record my thanks for their outstanding performance during the first half of the year. Highlights of FCE’s performance in the first half of 2015 include: Profitability FCE’s first half profit before tax is £10 million higher than for the same period last year. The improvement reflects increased receivables and changes in the fair value adjustments to financial instruments and foreign exchange effects, partially offset by the impact of lower portfolio pricing on financing margin. Consistent with FCE’s capital plan and subject to Board review and approval, FCE expects to pay a dividend in the second half of 2015. Assets and portfolio During the first six months of 2015 FCE’s net loans and advances increased, reflecting higher contract volumes and dealer stocks, partially offset by the impact of the relative strength of sterling on the value of FCE’s Euro-denominated receivables. The majority of FCE’s business continues to be focused in the UK and German markets, which represent 69% of its net loans and advances to customers. Sales FCE continued to increase its share of Ford’s registrations during the first half of 2015, and now finances 39.0% compared with 36.5% in the first half of 2014. Our One Ford approach ensures close integration with Ford in each European location, which makes Ford’s products more accessible to retail and fleet customers. In addition, we continue to work with a range of carefully selected partner organisations to deliver products including insurance and full service leasing. This approach ensures we have a full range
of automotive financial services and allows us to deepen and strengthen relationships with our customers across our European network. Operational effectiveness In 2014 we opened our Manchester Business Centre (MBC) in the UK. This centre now provides services to Ford dealers in the UK, Belgium, Czech Republic and the Netherlands. Efforts continue regarding the transfer of wholesale operations to the MBC from other European markets. In addition to consolidating wholesale operations within the MBC, we have also decided to relocate our UK Retail operation from our Customer Service Centre in St Albans, UK, to the MBC. Recruitment is now taking place internally and externally so that the MBC can begin servicing UK retail customers early next year. Funding FCE continues to hold investment-grade ratings from all three major ratings agencies, is well capitalised and has access to appropriate funding from diverse sources. For details of public funding raised during 2015, please see page 12. In addition, FCE now has retail receivables pre-positioned with the Bank of England which supports access to the Discount Window Facility. Risk management FCE continues to deliver a historically low credit loss ratio. This demonstrates the strength of our origination and servicing procedures together with our unique knowledge, acquired over many decades, of the European automotive financing business. Outlook Looking to the rest of 2015 and beyond, FCE aims to help Ford sell more vehicles, more often, to more satisfied customers. Through efficient delivery of this strategy, I expect FCE’s controlled growth to continue in support of the expansion of Ford of Europe’s market share. Nick Rothwell Chief Executive Officer, FCE Bank plc. 27 August 2015
Review for the half year ended 30 June 2015
6 FCE Bank plc – INTERIM REPORT AND FINANCIAL STATEMENTS – 2015
Business overview: Description of the business Overview FCE’s primary focus is to profitably support the sale of Ford vehicles. FCE works with Ford to maximise customer and dealer satisfaction and loyalty, offering a wide variety of financing products and outstanding service. As a result, FCE is uniquely positioned to drive incremental sales, improve customer satisfaction and owner loyalty to Ford, and direct profits and distributions back to Ford to support its overall business, including vehicle development. FCE continually improves processes with a focus on customer and dealer satisfaction whilst managing costs and ensuring the efficient use of capital.
Organisational structure
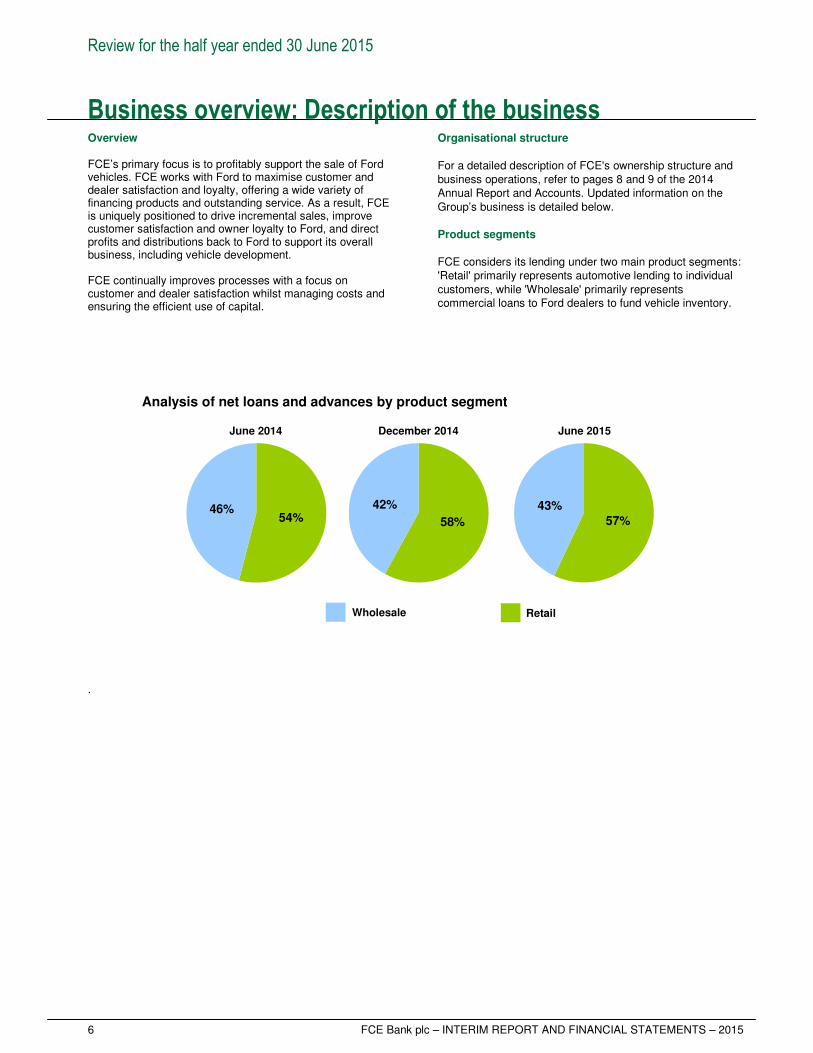
For a detailed description of FCE's ownership structure and business operations, refer to pages 8 and 9 of the 2014 Annual Report and Accounts. Updated information on the Group’s business is detailed below. Product segments FCE considers its lending under two main product segments: 'Retail' primarily represents automotive lending to individual customers, while 'Wholesale' primarily represents commercial loans to Ford dealers to fund vehicle inventory.
57%
43%
June 2015
58%
42%
December 2014
54%46%
June 2014
Analysis of net loans and advances by product segment
Wholesale Retail
.
Review for the half year ended 30 June 2015
FCE Bank plc – INTERIM REPORT AND FINANCIAL STATEMENTS – 2015 7
Business overview: Description of the business Major markets
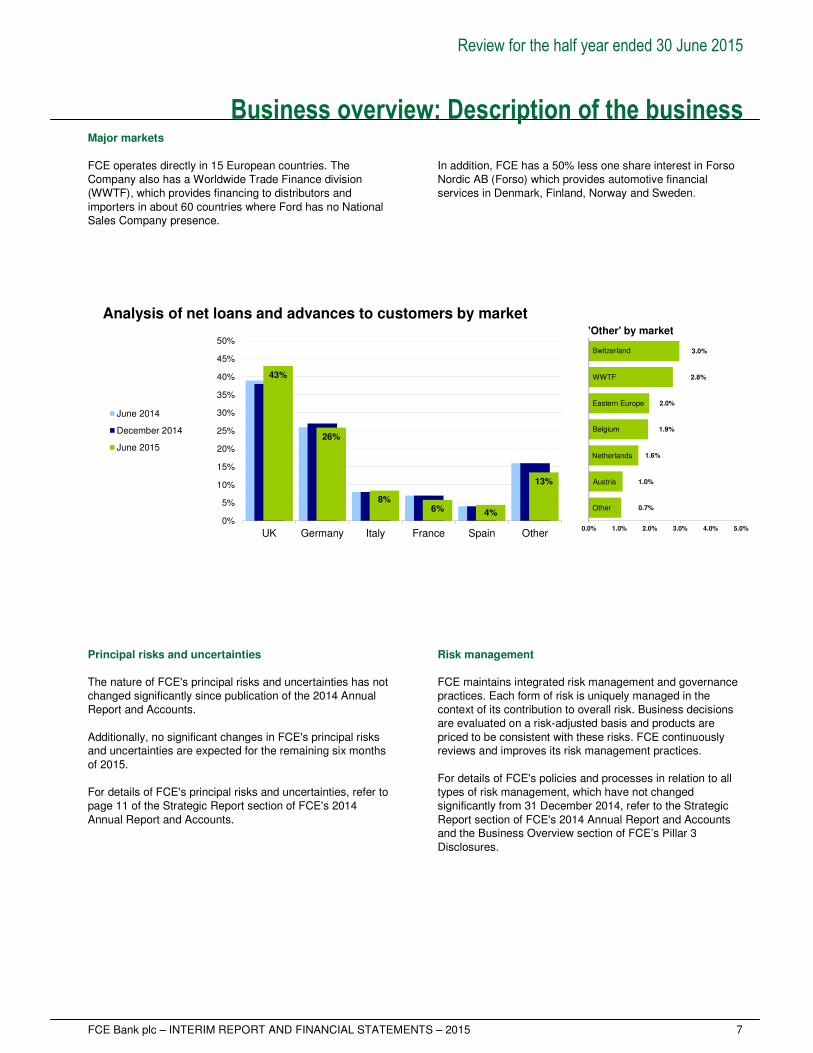
FCE operates directly in 15 European countries. The Company also has a Worldwide Trade Finance division (WWTF), which provides financing to distributors and importers in about 60 countries where Ford has no National Sales Company presence.
In addition, FCE has a 50% less one share interest in Forso Nordic AB (Forso) which provides automotive financial services in Denmark, Finland, Norway and Sweden.
43%
26%
8%6% 4%
13%
0%
5%
10%
15%
20%
25%
30%
35%
40%
45%
50%
UK Germany Italy France Spain Other
June 2014
December 2014
June 2015
Analysis of net loans and advances to customers by market
0.0% 1.0% 2.0% 3.0% 4.0% 5.0%
Switzerland
Eastern Europe
1.9%
'Other' by market
0.7%
1.6%
2.0%
2.8%
3.0%
WWTF
Netherlands
Belgium
Austria
Other
1.0%
Principal risks and uncertainties The nature of FCE's principal risks and uncertainties has not changed significantly since publication of the 2014 Annual Report and Accounts. Additionally, no significant changes in FCE's principal risks and uncertainties are expected for the remaining six months of 2015. For details of FCE's principal risks and uncertainties, refer to page 11 of the Strategic Report section of FCE's 2014 Annual Report and Accounts.
Risk management FCE maintains integrated risk management and governance practices. Each form of risk is uniquely managed in the context of its contribution to overall risk. Business decisions are evaluated on a risk-adjusted basis and products are priced to be consistent with these risks. FCE continuously reviews and improves its risk management practices. For details of FCE's policies and processes in relation to all types of risk management, which have not changed significantly from 31 December 2014, refer to the Strategic Report section of FCE's 2014 Annual Report and Accounts and the Business Overview section of FCE’s Pillar 3 Disclosures.
Review for the half year ended 30 June 2015
8 FCE Bank plc – INTERIM REPORT AND FINANCIAL STATEMENTS – 2015
Business performance update Business environment During the period, FCE experienced improved economic conditions across Europe including stronger industry sales. In particular, FCE benefited from a strong performance in the UK, its largest market. With a significant proportion of FCE’s assets and income being in Euros, FCE’s results are also impacted by the relative weakening of the Euro against sterling.
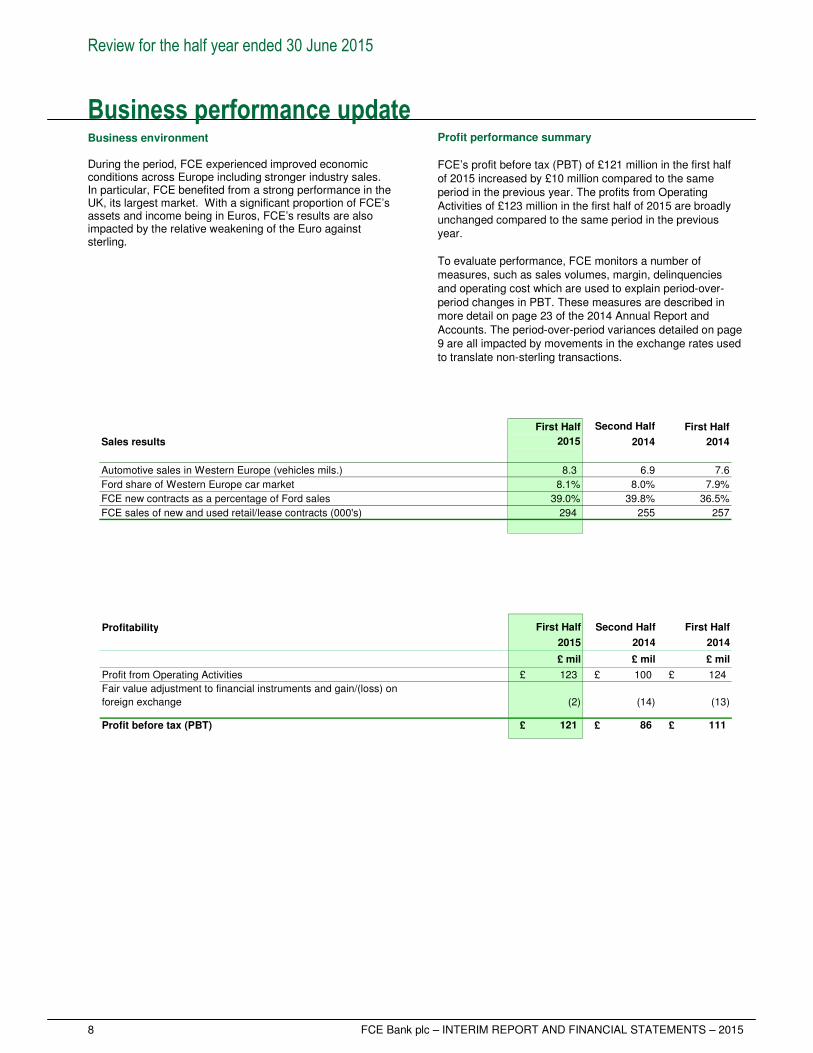
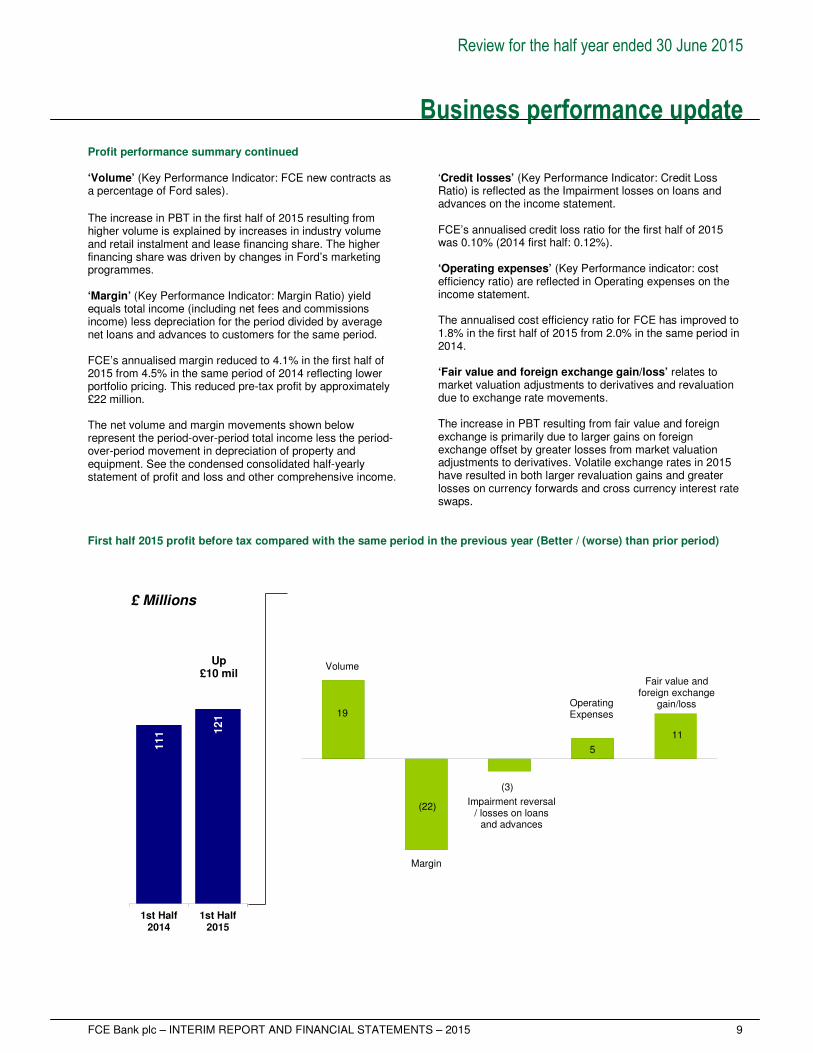
Profit performance summary FCE’s profit before tax (PBT) of £121 million in the first half of 2015 increased by £10 million compared to the same period in the previous year. The profits from Operating Activities of £123 million in the first half of 2015 are broadly unchanged compared to the same period in the previous year. To evaluate performance, FCE monitors a number of measures, such as sales volumes, margin, delinquencies and operating cost which are used to explain period-over-period changes in PBT. These measures are described in more detail on page 23 of the 2014 Annual Report and Accounts. The period-over-period variances detailed on page 9 are all impacted by movements in the exchange rates used to translate non-sterling transactions.
First Half First Half
Sales results 2014 2014
Automotive sales in Western Europe (vehicles mils.) 8.3 6.9 7.6
Ford share of Western Europe car market 8.1% 8.0% 7.9%
FCE new contracts as a percentage of Ford sales 39.0% 39.8% 36.5%
FCE sales of new and used retail/lease contracts (000's) 294 255 257
2015
Second Half
Profitability
2015 2014 2014
£ mil £ mil £ mil
Profit from Operating Activities £ 123 £ 100 £ 124
Fair value adjustment to financial instruments and gain/(loss) on
foreign exchange (2) (14) (13)
Profit before tax (PBT) £ 121 £ 86 £ 111
First Half Second Half First Half
Review for the half year ended 30 June 2015
FCE Bank plc – INTERIM REPORT AND FINANCIAL STATEMENTS – 2015 9
Business performance update
Profit performance summary continued ‘Volume’ (Key Performance Indicator: FCE new contracts as a percentage of Ford sales).
The increase in PBT in the first half of 2015 resulting from higher volume is explained by increases in industry volume and retail instalment and lease financing share. The higher financing share was driven by changes in Ford’s marketing programmes. ‘Margin’ (Key Performance Indicator: Margin Ratio) yield equals total income (including net fees and commissions income) less depreciation for the period divided by average net loans and advances to customers for the same period. FCE’s annualised margin reduced to 4.1% in the first half of 2015 from 4.5% in the same period of 2014 reflecting lower portfolio pricing. This reduced pre-tax profit by approximately £22 million. The net volume and margin movements shown below represent the period-over-period total income less the period-over-period movement in depreciation of property and equipment. See the condensed consolidated half-yearly statement of profit and loss and other comprehensive income.
‘Credit losses’ (Key Performance Indicator: Credit Loss Ratio) is reflected as the Impairment losses on loans and advances on the income statement. FCE’s annualised credit loss ratio for the first half of 2015 was 0.10% (2014 first half: 0.12%).
‘Operating expenses’ (Key Performance indicator: cost efficiency ratio) are reflected in Operating expenses on the income statement. The annualised cost efficiency ratio for FCE has improved to 1.8% in the first half of 2015 from 2.0% in the same period in 2014. ‘Fair value and foreign exchange gain/loss’ relates to market valuation adjustments to derivatives and revaluation due to exchange rate movements. The increase in PBT resulting from fair value and foreign exchange is primarily due to larger gains on foreign exchange offset by greater losses from market valuation adjustments to derivatives. Volatile exchange rates in 2015 have resulted in both larger revaluation gains and greater losses on currency forwards and cross currency interest rate swaps.
First half 2015 profit before tax compared with the same period in the previous year (Better / (worse) than prior period)
111 1
21
1st Half2014
1st Half2015
Volume
19
(22)
11
Margin
Impairment reversal / losses on loans
and advances
Operating Expenses
Fair value and foreign exchange
gain/loss
(3)
5
Up£10 mil
£ Millions
Review for the half year ended 30 June 2015
10 FCE Bank plc – INTERIM REPORT AND FINANCIAL STATEMENTS – 2015
Business performance update
Net loans and advances to customers FCE’s loans and advances by product type as at 30 June 2015, 31 December 2014 and 30 June 2014 were as set out in the table below
Net loans and advances increased in 2015 from the year end position. The growth in the portfolio reflects the increase in contract sales and higher dealer stocks which is partially offset by the impact of the relative strength of sterling on the value of Euro-denominated loans. .
2015 2014 2014
Notes £ mil £ mil £ mil
Retail excluding finance lease £ 5,475 £ 5,215 £ 4,890
Finance lease 861 855 879
Wholesale 4,730 4,478 4,955
Net loans and advances 2 £ 11,066 £ 10,548 £ 10,724
30 June 31 December 30 June
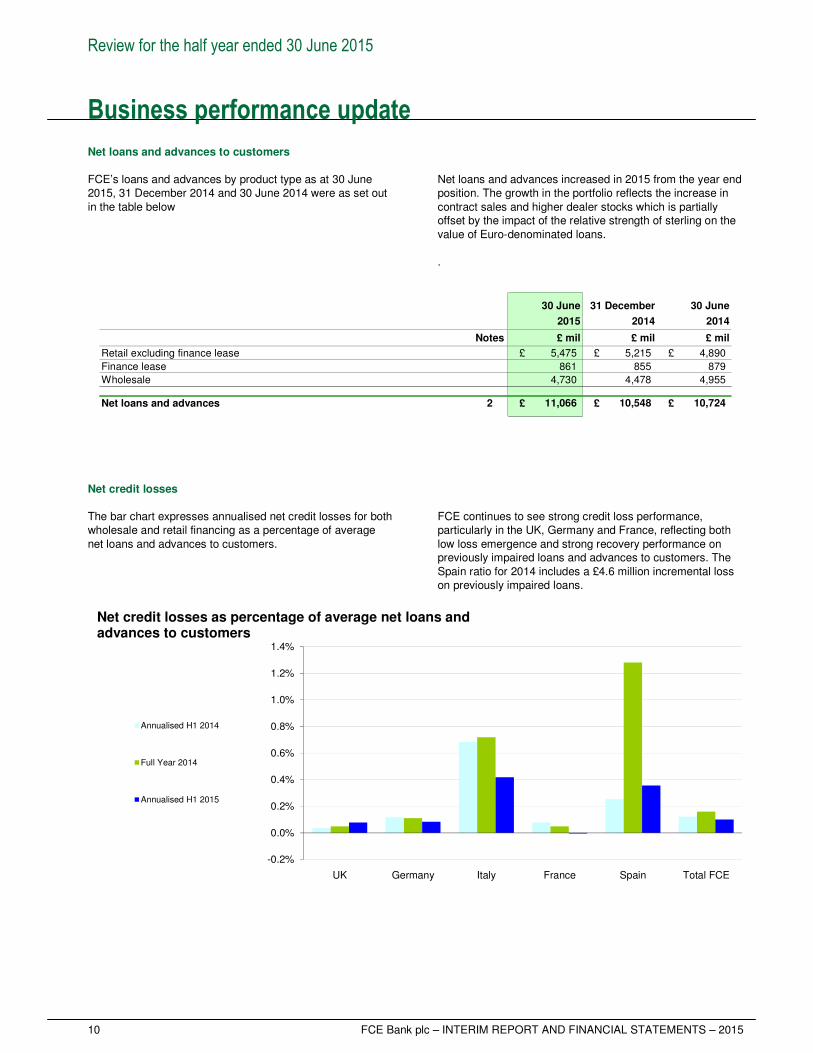
Net credit losses The bar chart expresses annualised net credit losses for both wholesale and retail financing as a percentage of average net loans and advances to customers.
FCE continues to see strong credit loss performance, particularly in the UK, Germany and France, reflecting both low loss emergence and strong recovery performance on previously impaired loans and advances to customers. The Spain ratio for 2014 includes a £4.6 million incremental loss on previously impaired loans.
-0.2%
0.0%
0.2%
0.4%
0.6%
0.8%
1.0%
1.2%
1.4%
UK Germany Italy France Spain Total FCE
Annualised H1 2014
Full Year 2014
Annualised H1 2015
Net credit losses as percentage of average net loans and advances to customers
Review for the half year ended 30 June 2015
FCE Bank plc – INTERIM REPORT AND FINANCIAL STATEMENTS – 2015 11
Business performance update Retail past due exposures
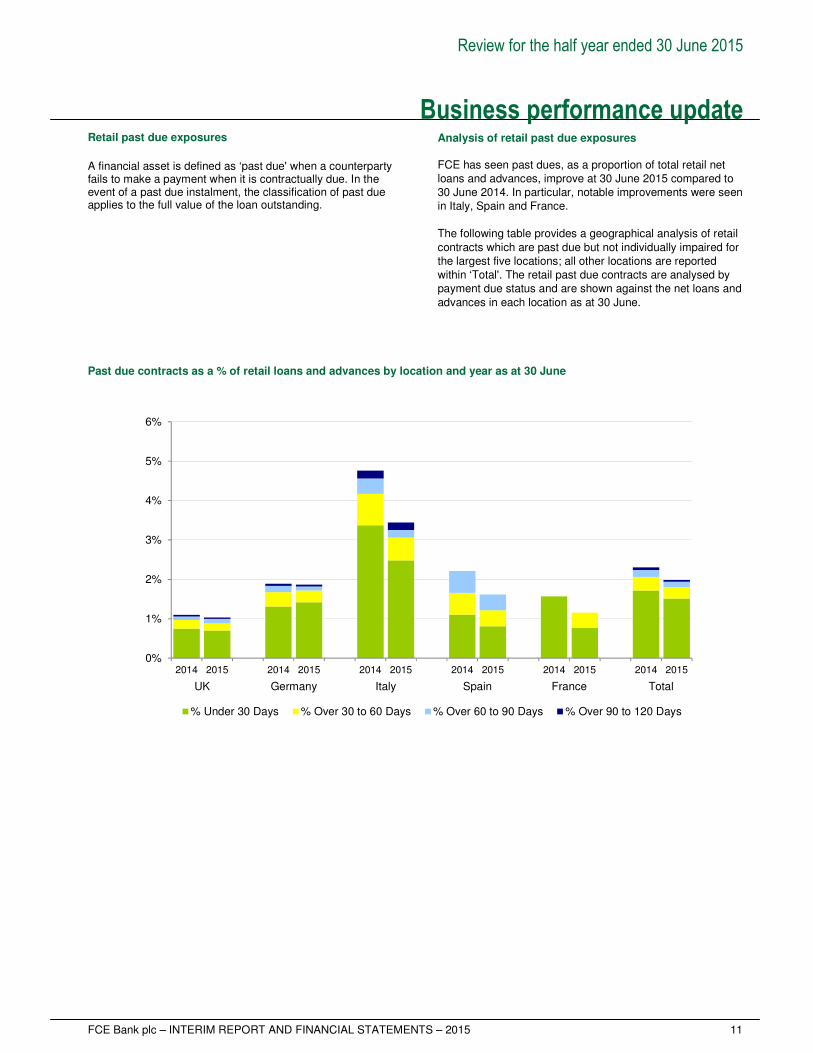
A financial asset is defined as ‘past due' when a counterparty fails to make a payment when it is contractually due. In the event of a past due instalment, the classification of past due applies to the full value of the loan outstanding.
Analysis of retail past due exposures FCE has seen past dues, as a proportion of total retail net loans and advances, improve at 30 June 2015 compared to 30 June 2014. In particular, notable improvements were seen in Italy, Spain and France. The following table provides a geographical analysis of retail contracts which are past due but not individually impaired for the largest five locations; all other locations are reported within ‘Total'. The retail past due contracts are analysed by payment due status and are shown against the net loans and advances in each location as at 30 June.
Past due contracts as a % of retail loans and advances by location and year as at 30 June
0%
1%
2%
3%
4%
5%
6%
2014 2015 2014 2015 2014 2015 2014 2015 2014 2015 2014 2015
% Under 30 Days % Over 30 to 60 Days % Over 60 to 90 Days % Over 90 to 120 Days
UK Germany Spain France TotalItaly
Review for the half year ended 30 June 2015
12 FCE Bank plc – INTERIM REPORT AND FINANCIAL STATEMENTS – 2015
Business performance update Capital
FCE’s policy is to manage its capital base to targeted levels that exceed all regulatory requirements and support anticipated changes in assets and foreign currency exchange rates. FCE complied with this policy for the half year ended 30 June 2015. FCE’s Common Equity Tier 1 (CET1) capital ratio and total capital ratio were 15.5% and 17.7% respectively as at 30 June 2015. Dividends
No dividend payments were made in the first half of 2015. This was in line with FCE’s capital plan. Funding FCE's funding strategy is to have sufficient liquidity to profitably support Ford, its dealers and customers through economic cycles. FCE maintains a substantial cash balance, committed funding capacity, and access to diverse funding sources.
During the first half of 2015, and consistent with its funding plan and the Board’s consideration, FCE raised £1.8 billion of public term funding consisting of about £1.4 billion of unsecured term debt and a £0.4 billion public securitisation transaction. In June FCE also amended and extended a 3.5 year £760 million syndicated credit facility (maturing October 2017) to a 3.5 year £830 million syndicated credit facility (maturing October 2018). Securitisation continues to represent an important portion of FCE’s funding due to cost and funding diversity benefits. At 30 June 2015, secured debt was 32% of net loans and advances to customers. During July and August 2015, FCE raised a further £0.2 billion in the public unsecured market. .
Net cash inflow from public funding raised for the six months ending
2015 2014
Net cash Net cash
inflow inflow
£ bil £ bil
- Unsecured debt £ 1.4 £ 1.5
- Securitisation 0.4 0.4
Total £ 1.8 £ 1.9
30 June 30 June
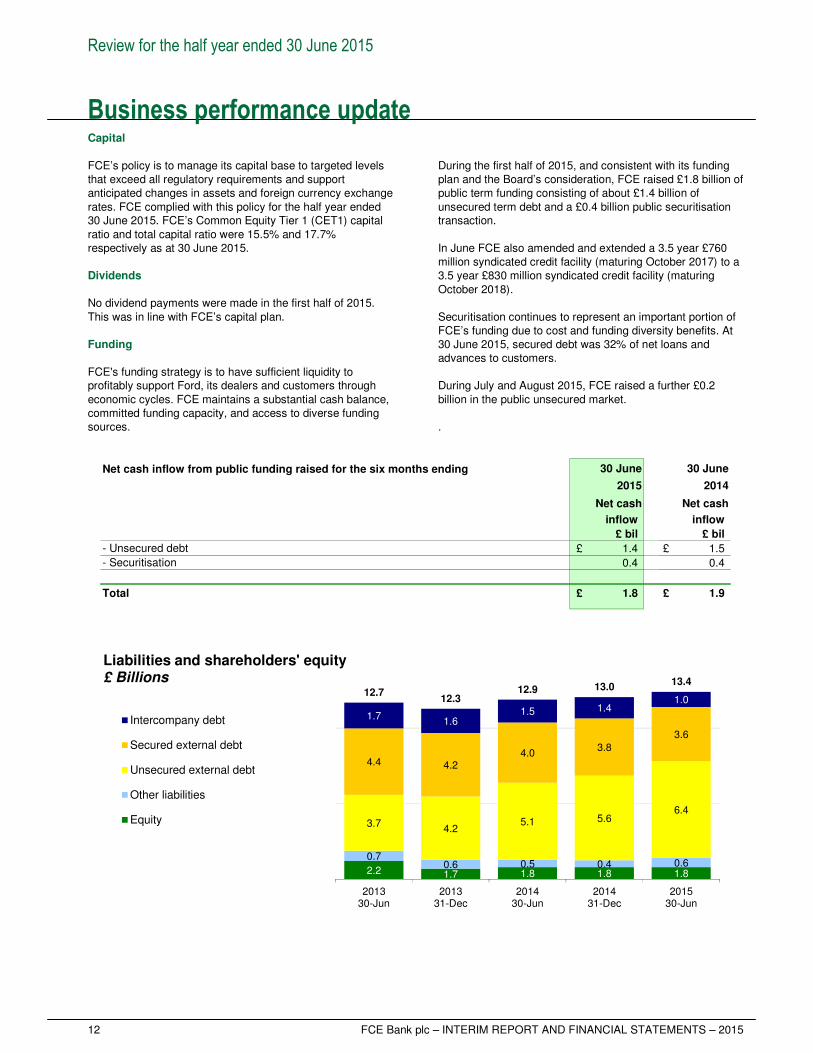
2.2 1.7 1.8 1.8 1.8
0.70.6 0.5 0.4 0.6
3.74.2
5.1 5.66.4
4.4 4.24.0
3.8
3.6
1.71.6
1.5 1.41.0
12.712.3
12.9 13.013.4
201330-Jun
201331-Dec
201430-Jun
201431-Dec
201530-Jun
Intercompany debt
Secured external debt
Unsecured external debt
Other liabilities
Equity
Liabilities and shareholders' equity£ Billions
Review for the half year ended 30 June 2015
FCE Bank plc – INTERIM REPORT AND FINANCIAL STATEMENTS – 2015 13
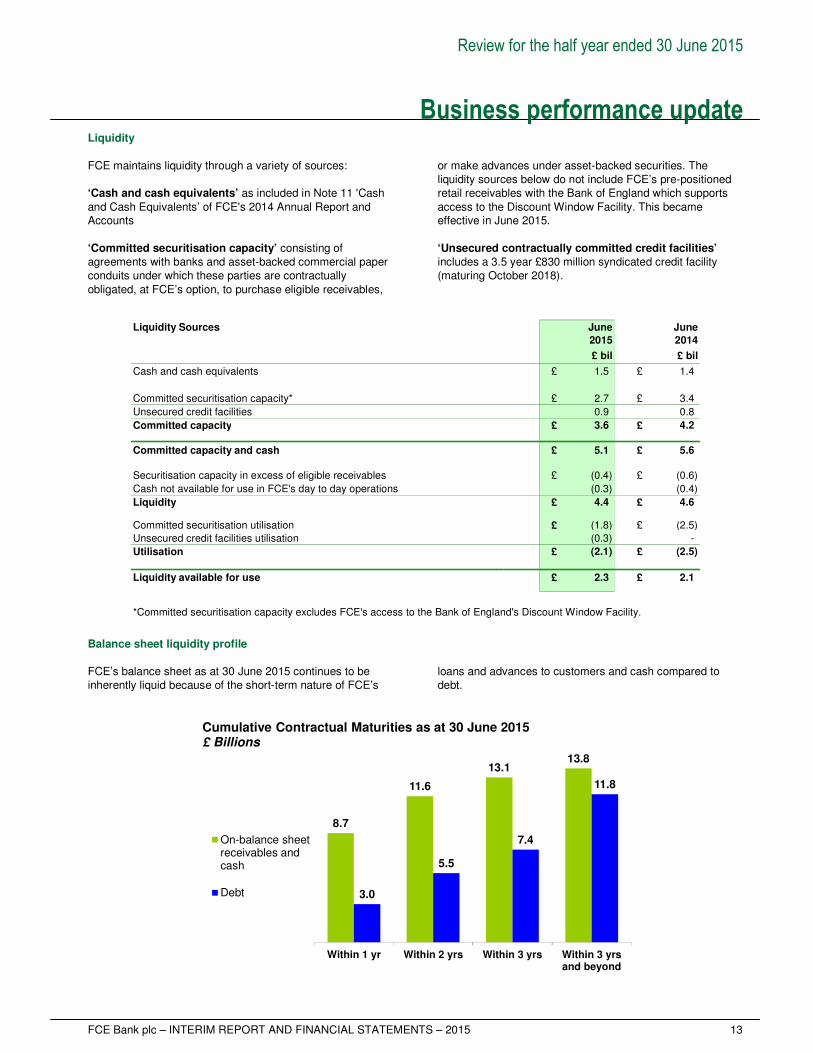
Business performance update Liquidity
FCE maintains liquidity through a variety of sources: ‘Cash and cash equivalents’ as included in Note 11 'Cash and Cash Equivalents’ of FCE's 2014 Annual Report and Accounts
‘Committed securitisation capacity’ consisting of agreements with banks and asset-backed commercial paper conduits under which these parties are contractually obligated, at FCE’s option, to purchase eligible receivables,
or make advances under asset-backed securities. The liquidity sources below do not include FCE’s pre-positioned retail receivables with the Bank of England which supports access to the Discount Window Facility. This became effective in June 2015.
‘Unsecured contractually committed credit facilities’ includes a 3.5 year £830 million syndicated credit facility (maturing October 2018).
Liquidity Sources June June
£ bil £ bil
Cash and cash equivalents £ 1.5 £ 1.4
Committed securitisation capacity* £ 2.7 £ 3.4
Unsecured credit facilities 0.9 0.8
Committed capacity £ 3.6 £ 4.2
Committed capacity and cash £ 5.1 £ 5.6
Securitisation capacity in excess of eligible receivables £ (0.4) £ (0.6)
Cash not available for use in FCE's day to day operations (0.3) (0.4)
Liquidity £ 4.4 £ 4.6
Committed securitisation utilisation £ (1.8) £ (2.5)
Unsecured credit facilities utilisation (0.3) -
Utilisation £ (2.1) £ (2.5)
Liquidity available for use £ 2.3 £ 2.1
*Committed securitisation capacity excludes FCE's access to the Bank of England's Discount Window Facility.
2015 2014
Balance sheet liquidity profile
FCE’s balance sheet as at 30 June 2015 continues to be inherently liquid because of the short-term nature of FCE’s
loans and advances to customers and cash compared to debt.
8.7
11.6
13.113.8
3.0
5.5
7.4
11.8
Within 1 yr Within 2 yrs Within 3 yrs Within 3 yrsand beyond
Cumulative Contractual Maturities as at 30 June 2015£ Billions
On-balance sheetreceivables andcash
Debt
Review for the half year ended 30 June 2015
14 FCE Bank plc – INTERIM REPORT AND FINANCIAL STATEMENTS – 2015
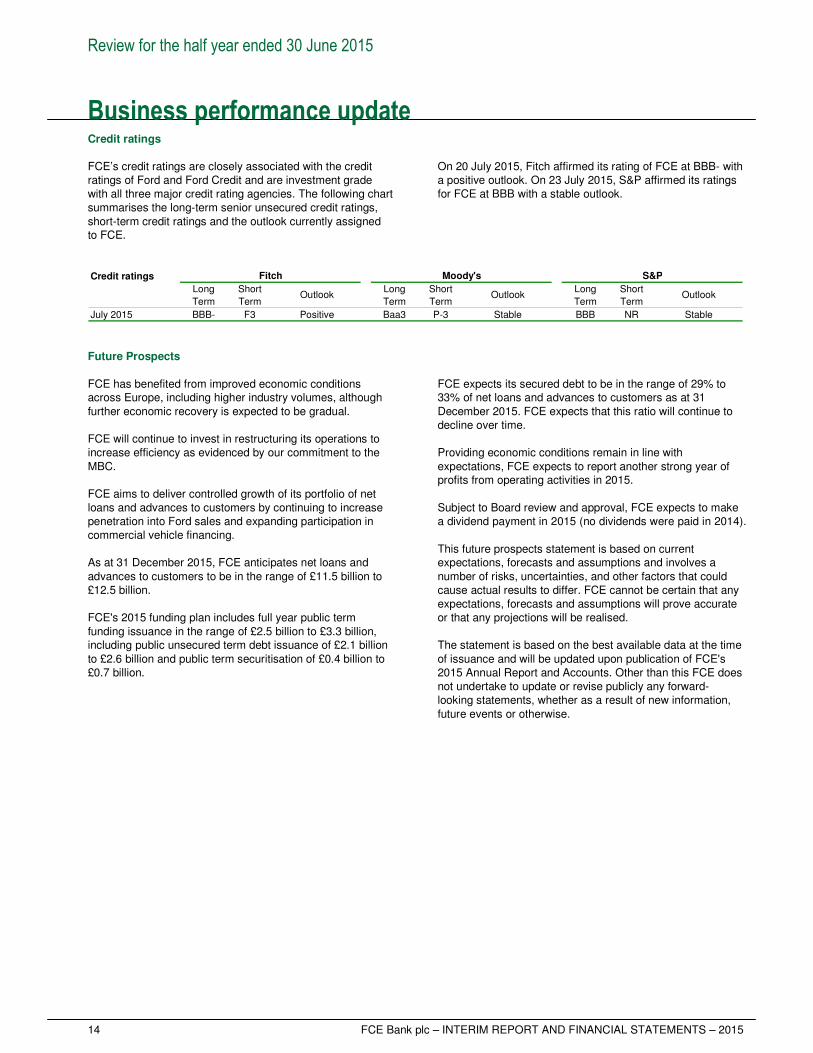
Business performance update Credit ratings FCE’s credit ratings are closely associated with the credit ratings of Ford and Ford Credit and are investment grade with all three major credit rating agencies. The following chart summarises the long-term senior unsecured credit ratings, short-term credit ratings and the outlook currently assigned to FCE.
On 20 July 2015, Fitch affirmed its rating of FCE at BBB- with a positive outlook. On 23 July 2015, S&P affirmed its ratings for FCE at BBB with a stable outlook.
Credit ratings
Long Short Long Short Long Short
Term Term Term Term Term Term
July 2015 BBB- F3 Positive Baa3 P-3 Stable BBB NR Stable
Fitch Moody's S&P
Outlook Outlook Outlook
Future Prospects FCE has benefited from improved economic conditions across Europe, including higher industry volumes, although further economic recovery is expected to be gradual. FCE will continue to invest in restructuring its operations to increase efficiency as evidenced by our commitment to the MBC. FCE aims to deliver controlled growth of its portfolio of net loans and advances to customers by continuing to increase penetration into Ford sales and expanding participation in commercial vehicle financing. As at 31 December 2015, FCE anticipates net loans and advances to customers to be in the range of £11.5 billion to £12.5 billion. FCE's 2015 funding plan includes full year public term funding issuance in the range of £2.5 billion to £3.3 billion, including public unsecured term debt issuance of £2.1 billion to £2.6 billion and public term securitisation of £0.4 billion to £0.7 billion.
FCE expects its secured debt to be in the range of 29% to 33% of net loans and advances to customers as at 31 December 2015. FCE expects that this ratio will continue to decline over time. Providing economic conditions remain in line with expectations, FCE expects to report another strong year of profits from operating activities in 2015. Subject to Board review and approval, FCE expects to make a dividend payment in 2015 (no dividends were paid in 2014). This future prospects statement is based on current expectations, forecasts and assumptions and involves a number of risks, uncertainties, and other factors that could cause actual results to differ. FCE cannot be certain that any expectations, forecasts and assumptions will prove accurate or that any projections will be realised. The statement is based on the best available data at the time of issuance and will be updated upon publication of FCE's 2015 Annual Report and Accounts. Other than this FCE does not undertake to update or revise publicly any forward-looking statements, whether as a result of new information, future events or otherwise.
Financial statements
FCE Bank plc – INTERIM REPORT AND FINANCIAL STATEMENTS – 2015 15
Statement of directors' responsibilities Responsibility statement
The Directors confirm that the condensed consolidated half-yearly financial statements (the 'financial statements') of FCE have been prepared in accordance with IAS 34 as adopted by the European Union and give a true and fair view of the assets, liabilities, financial position and profit as required by Disclosure and Transparency Rules (DTR) 4.2.4. The Directors also confirm that the 'Review for the half year ended 30 June 2015' includes a fair review of the information
required by the DTR 4.2.7, namely: • an indication of important events that have occurred during
the first six months and their impact on the condensed set of financial statements;
• and a description of the principal risks and uncertainties for the remaining six months of the financial year.
On behalf of the Board Nick Rothwell Paul Kiernan Chief Executive Officer Executive Director, Finance 27 August 2015
Financial statements
16 FCE Bank plc – INTERIM REPORT AND FINANCIAL STATEMENTS – 2015
Independent review report to FCE Bank plc Report on the condensed consolidated interim financial statements
Our conclusion We have reviewed the condensed consolidated half-yearly financial statements, defined below, in the interim report and financial statements of FCE Bank plc for the six months ended 30 June 2015. Based on our review, nothing has come to our attention that causes us to believe that the condensed consolidated half-yearly financial statements are not prepared, in all material respects, in accordance with International Accounting Standard 34 as adopted by the European Union and the Disclosure and Transparency Rules of the United Kingdom's Financial Conduct Authority. This conclusion is to be read in the context of what we say in the remainder of this report. What we have reviewed
The condensed consolidated half-yearly financial statements, which are prepared by FCE Bank plc, comprise: • the condensed consolidated half-yearly statement of financial position as at 30 June 2015; • the condensed consolidated half-yearly statement of profit and loss and other comprehensive income for the period then ended; • the condensed consolidated half-yearly statement of cash flows for the period then ended; • the condensed consolidated half-yearly statement of changes in equity for the period then ended; and • the related notes to the condensed consolidated half-yearly financial statements. As disclosed in note 1, the financial reporting framework that has been applied in the preparation of the full annual financial statements of the group is applicable law and International Financial Reporting Standards (IFRSs) as adopted by the European Union. The condensed consolidated half-yearly financial statements included in the interim report and financial statements have been prepared in accordance with International Accounting Standard 34, ‘Interim Financial Reporting’, as adopted by the European Union and the Disclosure and Transparency Rules of the United Kingdom's Financial Conduct Authority.
What a review of condensed consolidated financial statements involves We conducted our review in accordance with International Standard on Review Engagements (UK and Ireland) 2410, ‘Review of Interim Financial Information Performed by the Independent Auditor of the Entity’ issued by the Auditing Practices Board for use in the United Kingdom. A review of interim financial information consists of making enquiries, primarily of persons responsible for financial and accounting matters, and applying analytical and other review procedures. A review is substantially less in scope than an audit conducted in accordance with International Standards on Auditing (UK and Ireland) and, consequently, does not enable us to obtain assurance that we would become aware of all significant matters that might be identified in an audit. Accordingly, we do not express an audit opinion. We have read the other information contained in the interim report and financial statements and considered whether it contains any apparent misstatements or material inconsistencies with the information in the condensed consolidated half-yearly financial statements. Responsibilities for the condensed consolidated interim financial statements and the review Our responsibilities and those of the directors
1,2
The interim report and financial statements, including the condensed consolidated half-yearly financial statements, is the responsibility of, and has been approved by, the directors. The directors are responsible for preparing the interim report and financial statements in accordance with the Disclosure and Transparency Rules of the United Kingdom's Financial Conduct Authority. Our responsibility is to express to the company a conclusion on the condensed consolidated half-yearly financial statements in the interim report and financial statements based on our review. This report, including the conclusion, has been prepared for and only for the company for the purpose of complying with the Disclosure and Transparency Rules of the Financial Conduct Authority and for no other purpose. We do not, in giving this conclusion, accept or assume responsibility for any other purpose or to any other person to whom this report is shown or into whose hands it may come save where expressly agreed by our prior consent in writing.
PricewaterhouseCoopers LLP Chartered Accountants 27 August 2015 London
Notes: 1. The maintenance and integrity of the FCE Bank plc website is the responsibility of the directors; the work carried out by the auditors does not involve consideration of these matters and, accordingly, the auditors accept no responsibility for any changes that may have occurred to the
financial statements since they were initially presented on the website. 2. Legislation in the United Kingdom governing the preparation and dissemination of financial statements may differ from legislation in other jurisdictions.
Financial statements
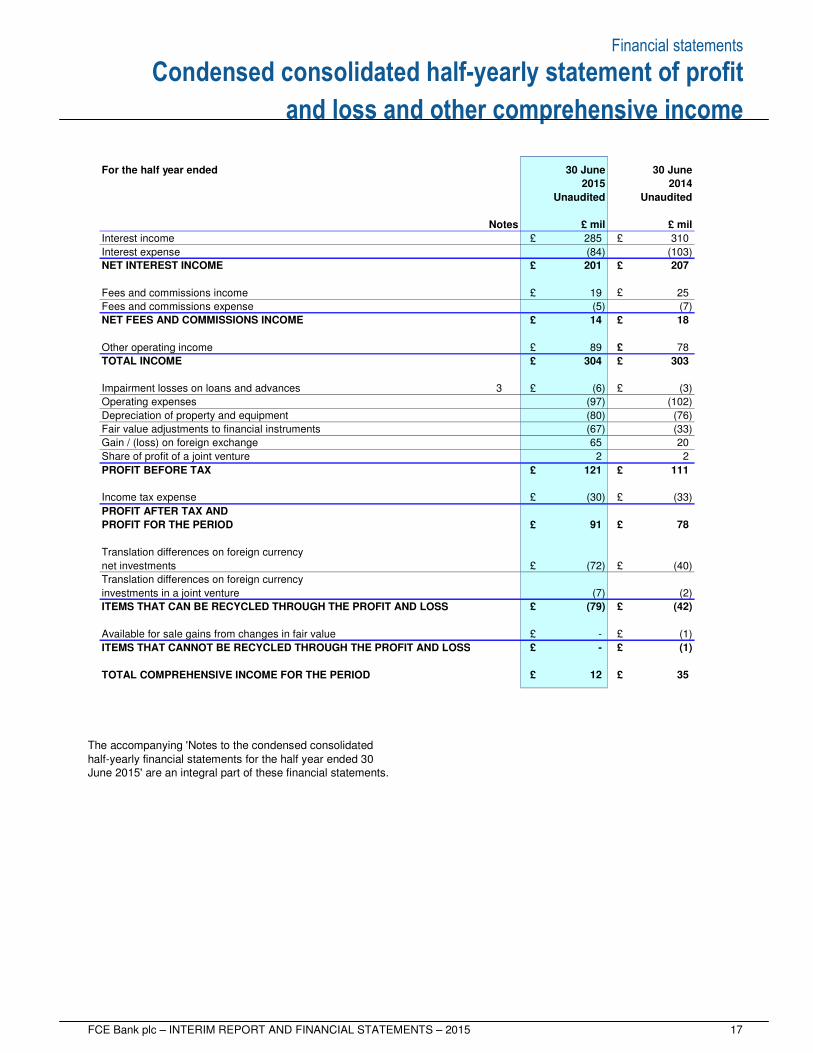
FCE Bank plc – INTERIM REPORT AND FINANCIAL STATEMENTS – 2015 17
Condensed consolidated half-yearly statement of profit
and loss and other comprehensive income
For the half year ended 30 June 30 June
2015 2014
Unaudited Unaudited
Notes £ mil £ mil
Interest income £ 285 £ 310
Interest expense (84) (103)
NET INTEREST INCOME £ 201 £ 207
Fees and commissions income £ 19 £ 25
Fees and commissions expense (5) (7)
NET FEES AND COMMISSIONS INCOME £ 14 £ 18
Other operating income £ 89 £ 78
TOTAL INCOME £ 304 £ 303
Impairment losses on loans and advances 3 £ (6) £ (3)
Operating expenses (97) (102)
Depreciation of property and equipment (80) (76)
Fair value adjustments to financial instruments (67) (33)
Gain / (loss) on foreign exchange 65 20
Share of profit of a joint venture 2 2
PROFIT BEFORE TAX £ 121 £ 111
Income tax expense £ (30) £ (33)
PROFIT AFTER TAX AND
PROFIT FOR THE PERIOD £ 91 £ 78
Translation differences on foreign currency
net investments £ (72) £ (40)
Translation differences on foreign currency
investments in a joint venture (7) (2)
ITEMS THAT CAN BE RECYCLED THROUGH THE PROFIT AND LOSS £ (79) £ (42)
Available for sale gains from changes in fair value £ - £ (1)
ITEMS THAT CANNOT BE RECYCLED THROUGH THE PROFIT AND LOSS £ - £ (1)
TOTAL COMPREHENSIVE INCOME FOR THE PERIOD £ 12 £ 35
The accompanying 'Notes to the condensed consolidated half-yearly financial statements for the half year ended 30 June 2015' are an integral part of these financial statements.
Financial statements
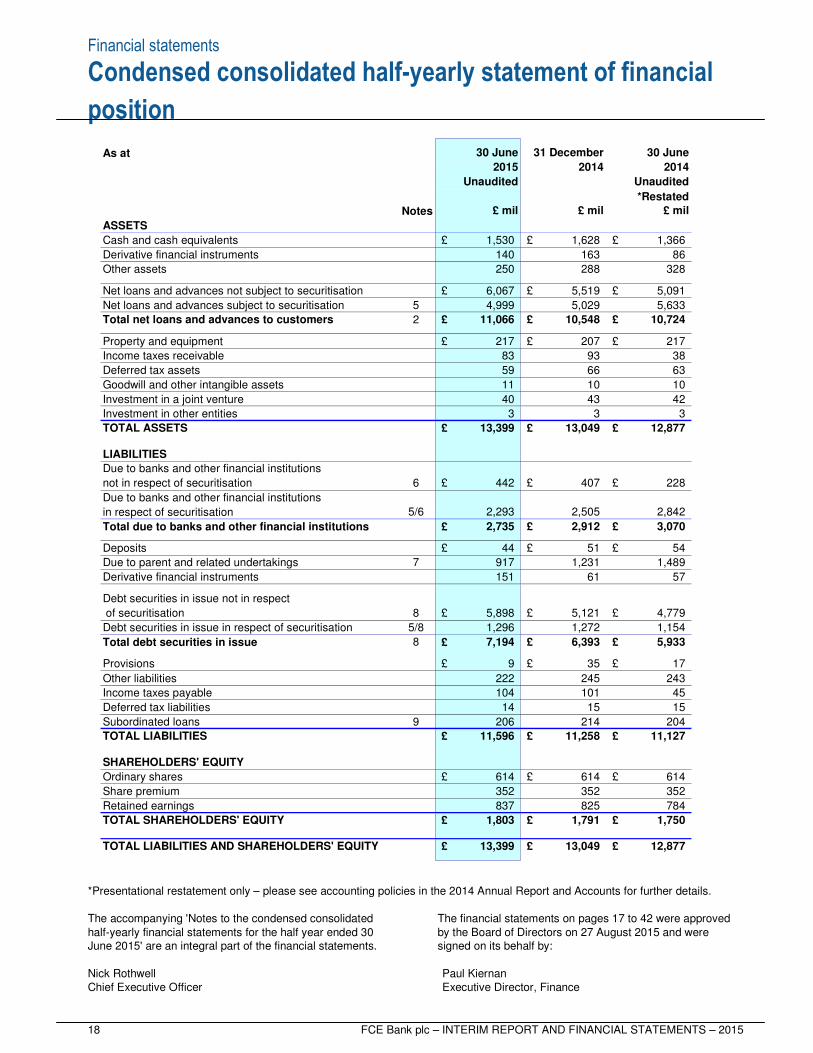
18 FCE Bank plc – INTERIM REPORT AND FINANCIAL STATEMENTS – 2015
Condensed consolidated half-yearly statement of financial
position
As at
*Restated
Notes
ASSETS
Cash and cash equivalents £ 1,530 £ 1,628 £ 1,366
Derivative financial instruments 140 163 86
Other assets 250 288 328
Net loans and advances not subject to securitisation £ 6,067 £ 5,519 £ 5,091
Net loans and advances subject to securitisation 5 4,999 5,029 5,633
Total net loans and advances to customers 2 £ 11,066 £ 10,548 £ 10,724
Property and equipment £ 217 £ 207 £ 217
Income taxes receivable 83 93 38
Deferred tax assets 59 66 63
Goodwill and other intangible assets 11 10 10
Investment in a joint venture 40 43 42
Investment in other entities 3 3 3
TOTAL ASSETS £ 13,399 £ 13,049 £ 12,877
LIABILITIES
Due to banks and other financial institutions
not in respect of securitisation 6 £ 442 £ 407 £ 228
Due to banks and other financial institutions
in respect of securitisation 5/6 2,293 2,505 2,842
Total due to banks and other financial institutions £ 2,735 £ 2,912 £ 3,070
Deposits £ 44 £ 51 £ 54
Due to parent and related undertakings 7 917 1,231 1,489
Derivative financial instruments 151 61 57
Debt securities in issue not in respect
of securitisation 8 £ 5,898 £ 5,121 £ 4,779
Debt securities in issue in respect of securitisation 5/8 1,296 1,272 1,154
Total debt securities in issue 8 £ 7,194 £ 6,393 £ 5,933
Provisions £ 9 £ 35 £ 17
Other liabilities 222 245 243
Income taxes payable 104 101 45
Deferred tax liabilities 14 15 15
Subordinated loans 9 206 214 204
TOTAL LIABILITIES £ 11,596 £ 11,258 £ 11,127
SHAREHOLDERS' EQUITY
Ordinary shares £ 614 £ 614 £ 614
Share premium 352 352 352
Retained earnings 837 825 784
TOTAL SHAREHOLDERS' EQUITY £ 1,803 £ 1,791 £ 1,750
TOTAL LIABILITIES AND SHAREHOLDERS' EQUITY £ 13,399 £ 13,049 £ 12,877
31 December
£ mil
30 June30 June
20142015
Unaudited
£ mil
Unaudited
£ mil
2014
*Presentational restatement only – please see accounting policies in the 2014 Annual Report and Accounts for further details. The accompanying 'Notes to the condensed consolidated half-yearly financial statements for the half year ended 30 June 2015' are an integral part of the financial statements.
The financial statements on pages 17 to 42 were approved by the Board of Directors on 27 August 2015 and were signed on its behalf by:
Nick Rothwell Paul Kiernan Chief Executive Officer Executive Director, Finance
Financial statements
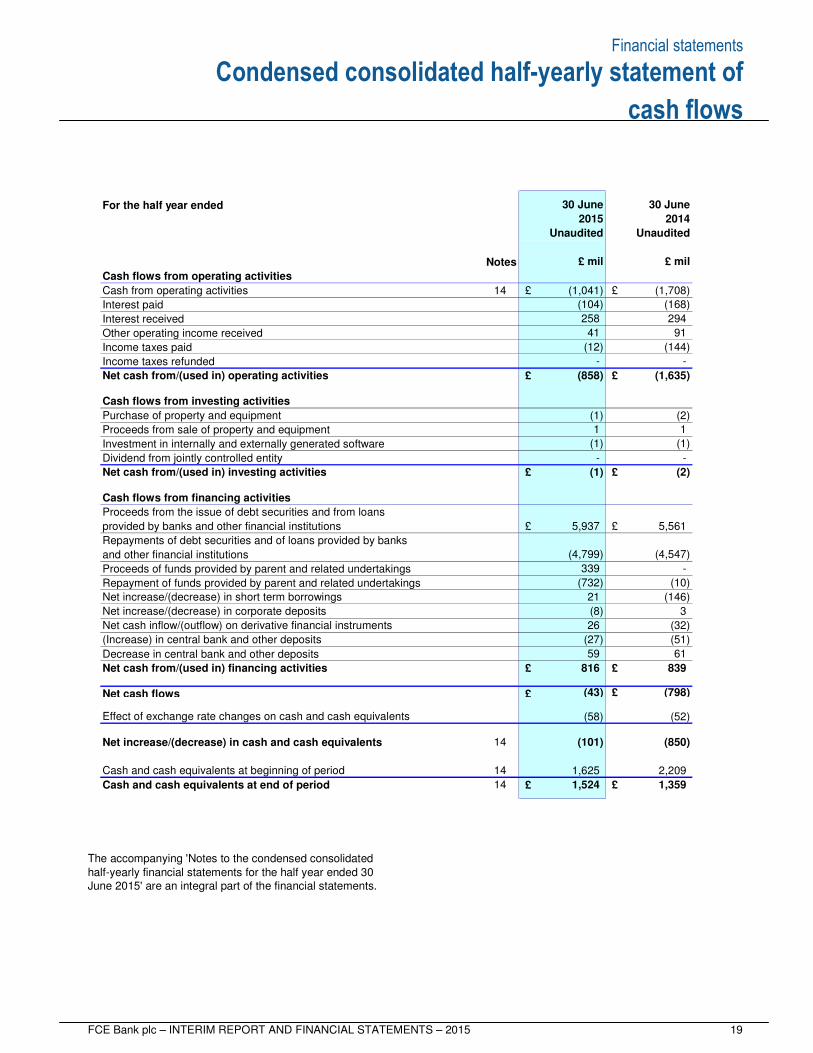
FCE Bank plc – INTERIM REPORT AND FINANCIAL STATEMENTS – 2015 19
Condensed consolidated half-yearly statement of
cash flows
For the half year ended
Notes
Cash flows from operating activities
Cash from operating activities 14 £ (1,041) £ (1,708)
Interest paid (104) (168)
Interest received 258 294
Other operating income received 41 91
Income taxes paid (12) (144)
Income taxes refunded - -
Net cash from/(used in) operating activities £ (858) £ (1,635)
Cash flows from investing activities
Purchase of property and equipment (1) (2)
Proceeds from sale of property and equipment 1 1
Investment in internally and externally generated software (1) (1)
Dividend from jointly controlled entity - -
Net cash from/(used in) investing activities £ (1) £ (2)
Cash flows from financing activities
Proceeds from the issue of debt securities and from loans
provided by banks and other financial institutions £ 5,937 £ 5,561
Repayments of debt securities and of loans provided by banks
and other financial institutions (4,799) (4,547)
Proceeds of funds provided by parent and related undertakings 339 -
Repayment of funds provided by parent and related undertakings (732) (10)
Net increase/(decrease) in short term borrowings 21 (146)
Net increase/(decrease) in corporate deposits (8) 3
Net cash inflow/(outflow) on derivative financial instruments 26 (32)
(Increase) in central bank and other deposits (27) (51)
Decrease in central bank and other deposits 59 61
Net cash from/(used in) financing activities £ 816 £ 839
Net cash flows £ (43) £ (798)
Effect of exchange rate changes on cash and cash equivalents (58) (52)
Net increase/(decrease) in cash and cash equivalents 14 (101) (850)
Cash and cash equivalents at beginning of period 14 1,625 2,209
Cash and cash equivalents at end of period 14 £ 1,524 £ 1,359
Unaudited
30 June
2014
Unaudited
2015
30 June
£ mil£ mil
The accompanying 'Notes to the condensed consolidated half-yearly financial statements for the half year ended 30 June 2015' are an integral part of the financial statements.
Financial statements
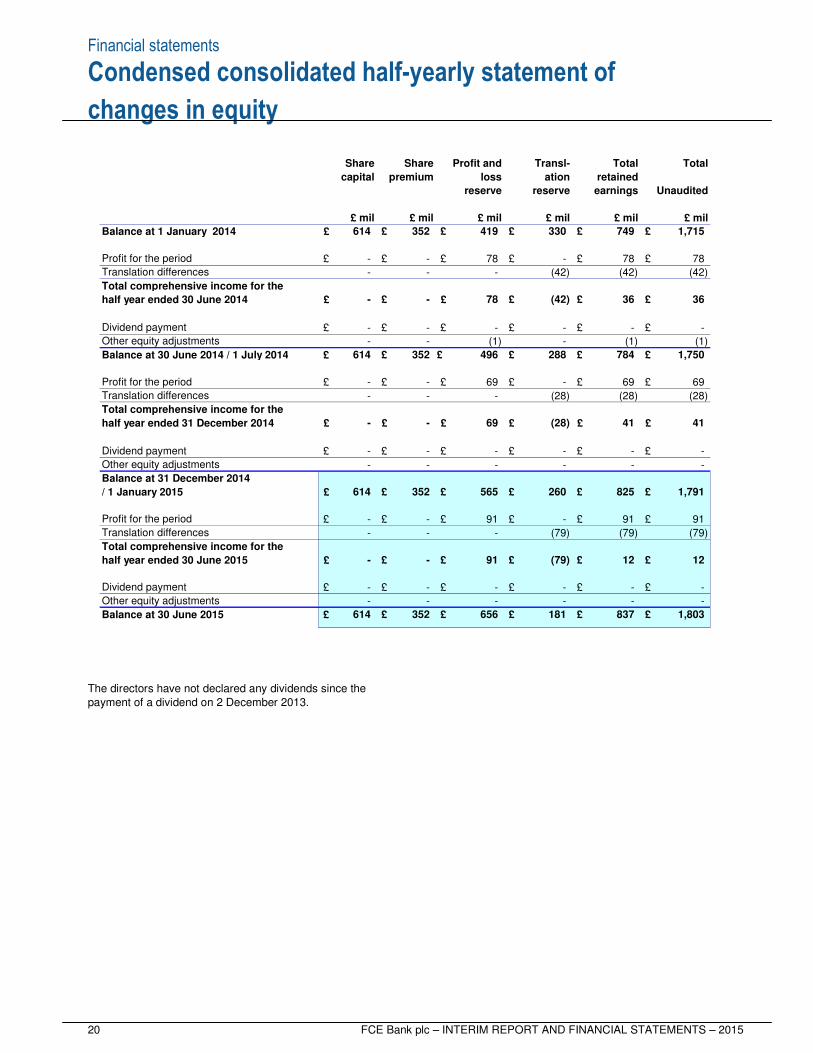
20 FCE Bank plc – INTERIM REPORT AND FINANCIAL STATEMENTS – 2015
Condensed consolidated half-yearly statement of
changes in equity
Balance at 1 January 2014 £ 614 £ 352 £ 419 £ 330 £ 749 £ 1,715
Profit for the period £ - £ - £ 78 £ - £ 78 £ 78
Translation differences - - - (42) (42) (42)
Total comprehensive income for the
half year ended 30 June 2014 £ - £ - £ 78 £ (42) £ 36 £ 36
Dividend payment £ - £ - £ - £ - £ - £ -
Other equity adjustments - - (1) - (1) (1)
Balance at 30 June 2014 / 1 July 2014 £ 614 £ 352 £ 496 £ 288 £ 784 £ 1,750
Profit for the period £ - £ - £ 69 £ - £ 69 £ 69
Translation differences - - - (28) (28) (28)
Total comprehensive income for the
half year ended 31 December 2014 £ - £ - £ 69 £ (28) £ 41 £ 41
Dividend payment £ - £ - £ - £ - £ - £ -
Other equity adjustments - - - - - -
Balance at 31 December 2014
/ 1 January 2015 £ 614 £ 352 £ 565 £ 260 £ 825 £ 1,791
Profit for the period £ - £ - £ 91 £ - £ 91 £ 91
Translation differences - - - (79) (79) (79)
Total comprehensive income for the
half year ended 30 June 2015 £ - £ - £ 91 £ (79) £ 12 £ 12
Dividend payment £ - £ - £ - £ - £ - £ -
Other equity adjustments - - - - - -
Balance at 30 June 2015 £ 614 £ 352 £ 656 £ 181 £ 837 £ 1,803
£ mil£ mil£ mil
Unaudited
£ mil£ mil£ mil
reserve reserve
Transl- TotalProfit and
loss
earnings
Total
retained ationcapital
Share Share
premium
The directors have not declared any dividends since the payment of a dividend on 2 December 2013.
Financial statements
FCE Bank plc – INTERIM REPORT AND FINANCIAL STATEMENTS – 2015 21
Notes to the condensed consolidated half-yearly financial
statements for the half year ended 30 June 2015
Policy 1 Accounting policies ............................................... 22 Balance sheet 2 Loans and advances to customers ....................... 23 3 Provision for incurred losses .................................. 24 4 Provision for vehicle residual value losses ........... 25 5 Securitisation and related financing ...................... 26 6 Due to banks and other financial institutions ......... 28 7 Due to parent and related undertakings ................. 29 8 Debt securities in issue .......................................... 30 9 Subordinated loans ................................................ 31 Other 10 Contingent liabilities ............................................... 32 11 Credit risk .............................................................. 33 12 Related party transactions ..................................... 35 13 Segment reporting ................................................ 36 14 Note to the consolidated half-yearly statement of cash flows .......................................................... 39 15 Financial assets and financial liabilities ................. 41
Index to the Notes to the financial statements
Financial statements
22 FCE Bank plc – INTERIM REPORT AND FINANCIAL STATEMENTS – 2015
Notes to the condensed consolidated half-yearly financial
statements for the half year ended 30 June 2015 1 ACCOUNTING POLICIES
The condensed consolidated half-yearly financial statements have been prepared in accordance with IAS 34, 'Interim financial reporting' as adopted by the European Union and with the Disclosure and Transparency Rules of the Financial Conduct Authority. These condensed consolidated half-yearly financial statements do not constitute statutory accounts within the meaning of section 434 of the Companies Act 2006. Statutory accounts for the year ended 31 December 2014 were approved by the Board of Directors on 19 March 2015 and delivered to the Registrar of Companies on 17 April 2015. The independent auditors’ report on those accounts was unqualified, did not contain an “emphasis of matter” paragraph and did not contain any statement under section 498 (2) and 498 (3) of the Companies Act 2006.
The financial information contained in this document does not include all of the information required for full annual financial statements, and should be read in conjunction with the Group's consolidated financial statements in the 2014 Annual Report and Accounts which are prepared in accordance with International Financial Reporting Standards as adopted by the European Union. Results for an interim period should not be considered indicative of results for a full year. The principal accounting policies adopted in the preparation of these interim consolidated financial statements are consistent with the accounting policies as presented in the FCE 2014 Annual Report and Accounts. All accounting standards that were effective and had to be applied from 1 January 2015 have been implemented by FCE. These do not have a material impact on FCE’s consolidated financial statements.
Financial statements
FCE Bank plc – INTERIM REPORT AND FINANCIAL STATEMENTS – 2015 23
Notes to the condensed consolidated half-yearly financial
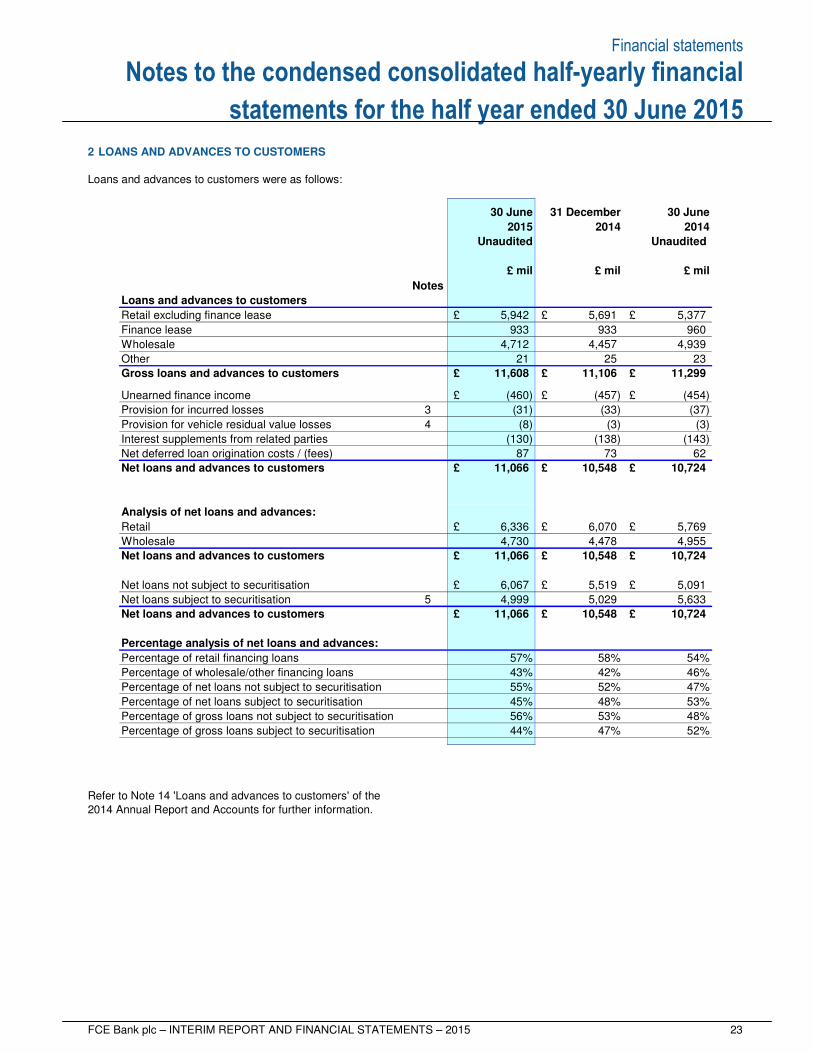
statements for the half year ended 30 June 2015 2 LOANS AND ADVANCES TO CUSTOMERS Loans and advances to customers were as follows:
Notes
Loans and advances to customers
Retail excluding finance lease £ 5,942 £ 5,691 £ 5,377
Finance lease 933 933 960
Wholesale 4,712 4,457 4,939
Other 21 25 23
Gross loans and advances to customers £ 11,608 £ 11,106 £ 11,299
Unearned finance income £ (460) £ (457) £ (454)
Provision for incurred losses 3 (31) (33) (37)
Provision for vehicle residual value losses 4 (8) (3) (3)
Interest supplements from related parties (130) (138) (143)
Net deferred loan origination costs / (fees) 87 73 62
Net loans and advances to customers £ 11,066 £ 10,548 £ 10,724
Analysis of net loans and advances:
Retail £ 6,336 £ 6,070 £ 5,769
Wholesale 4,730 4,478 4,955
Net loans and advances to customers £ 11,066 £ 10,548 £ 10,724
Net loans not subject to securitisation £ 6,067 £ 5,519 £ 5,091
Net loans subject to securitisation 5 4,999 5,029 5,633
Net loans and advances to customers £ 11,066 £ 10,548 £ 10,724
Percentage analysis of net loans and advances:
Percentage of retail financing loans 57% 58% 54%
Percentage of wholesale/other financing loans 43% 42% 46%
Percentage of net loans not subject to securitisation 55% 52% 47%
Percentage of net loans subject to securitisation 45% 48% 53%
Percentage of gross loans not subject to securitisation 56% 53% 48%
Percentage of gross loans subject to securitisation 44% 47% 52%
£ mil
2014
£ mil
30 June
20142015
Unaudited Unaudited
£ mil
31 December 30 June
Refer to Note 14 'Loans and advances to customers' of the 2014 Annual Report and Accounts for further information.
Financial statements
24 FCE Bank plc – INTERIM REPORT AND FINANCIAL STATEMENTS – 2015
Notes to the condensed consolidated half-yearly financial
statements for the half year ended 30 June 2015 3 PROVISION FOR INCURRED LOSSES
30 June 31 December 30 June
2015 2014 2014
Unaudited Unaudited
£ mil £ mil £ mil
Notes
Retail
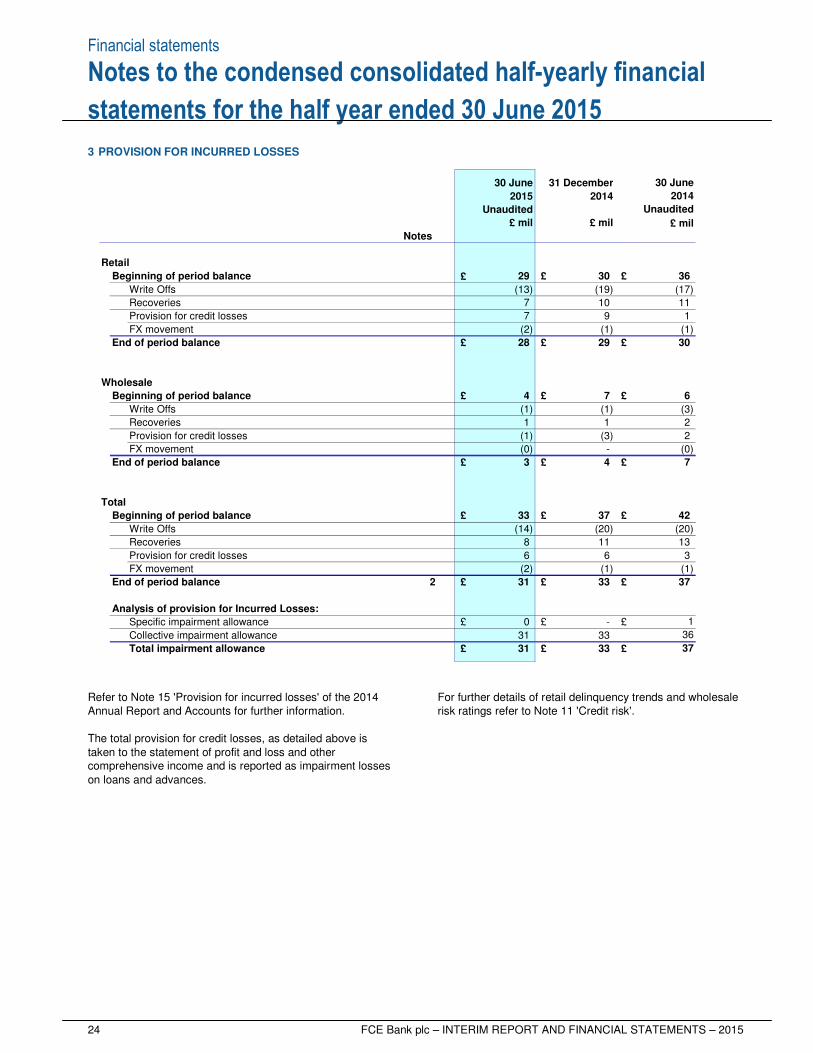
Beginning of period balance £ 29 £ 30 £ 36
Write Offs (13) (19) (17)
Recoveries 7 10 11
Provision for credit losses 7 9 1
FX movement (2) (1) (1)
End of period balance £ 28 £ 29 £ 30
Wholesale
Beginning of period balance £ 4 £ 7 £ 6
Write Offs (1) (1) (3)
Recoveries 1 1 2
Provision for credit losses (1) (3) 2
FX movement (0) - (0)
End of period balance £ 3 £ 4 £ 7
Total
Beginning of period balance £ 33 £ 37 £ 42
Write Offs (14) (20) (20)
Recoveries 8 11 13
Provision for credit losses 6 6 3
FX movement (2) (1) (1)
End of period balance 2 £ 31 £ 33 £ 37
Analysis of provision for Incurred Losses:
Specific impairment allowance £ 0 £ - £ 1
Collective impairment allowance 31 33 36
Total impairment allowance £ 31 £ 33 £ 37
Refer to Note 15 'Provision for incurred losses' of the 2014 Annual Report and Accounts for further information. The total provision for credit losses, as detailed above is taken to the statement of profit and loss and other comprehensive income and is reported as impairment losses on loans and advances.
For further details of retail delinquency trends and wholesale risk ratings refer to Note 11 'Credit risk'.
Financial statements
FCE Bank plc – INTERIM REPORT AND FINANCIAL STATEMENTS – 2015 25
Notes to the condensed consolidated half-yearly financial
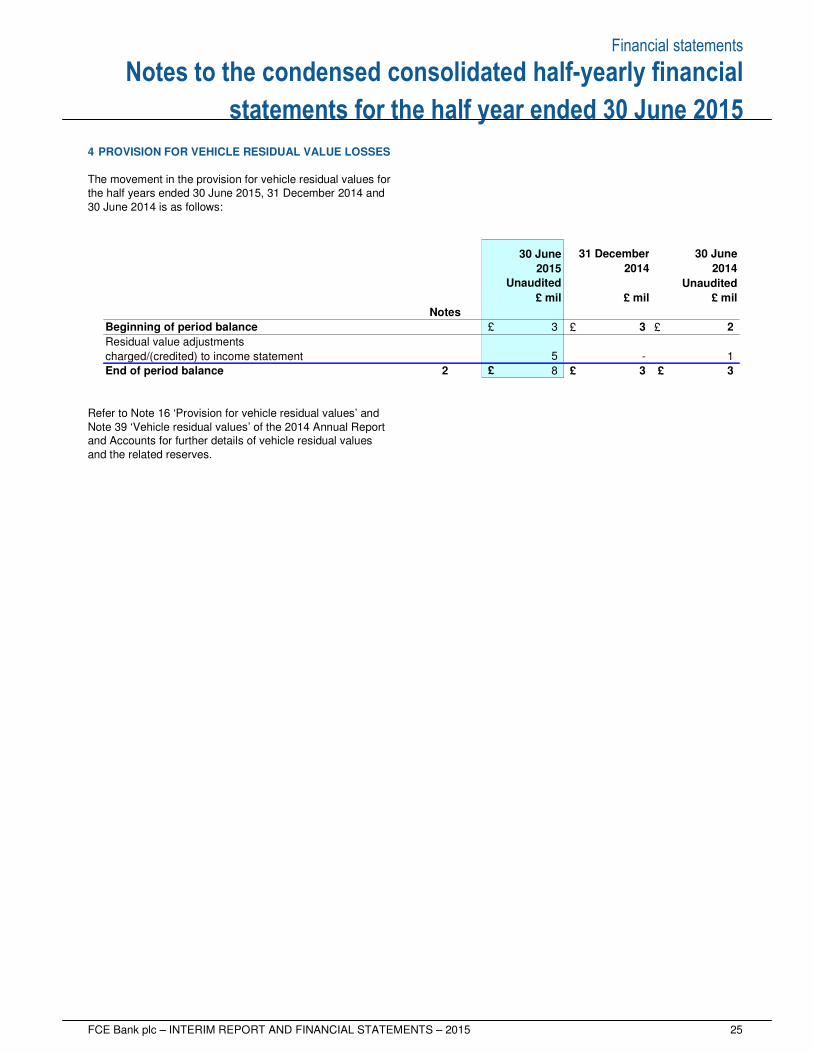
statements for the half year ended 30 June 2015 4 PROVISION FOR VEHICLE RESIDUAL VALUE LOSSES The movement in the provision for vehicle residual values for the half years ended 30 June 2015, 31 December 2014 and 30 June 2014 is as follows:
30 June 31 December 30 June
2015 2014 2014
Unaudited Unaudited
£ mil £ mil £ mil
Notes
Beginning of period balance £ 3 £ 3 £ 2
Residual value adjustments
charged/(credited) to income statement 5 - 1
End of period balance 2 £ 8 £ 3 £ 3 Refer to Note 16 ‘Provision for vehicle residual values’ and Note 39 ‘Vehicle residual values’ of the 2014 Annual Report and Accounts for further details of vehicle residual values and the related reserves.
Financial statements
26 FCE Bank plc – INTERIM REPORT AND FINANCIAL STATEMENTS – 2015
Notes to the condensed consolidated half-yearly financial
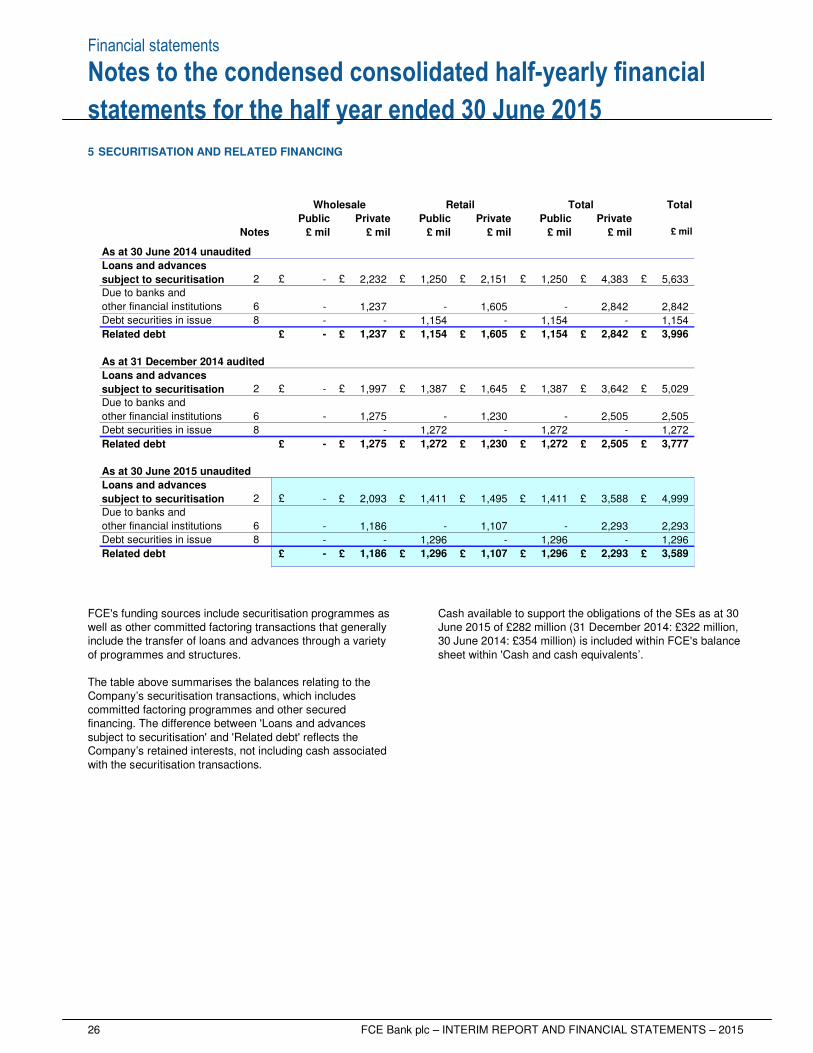
statements for the half year ended 30 June 2015 5 SECURITISATION AND RELATED FINANCING
Notes
As at 30 June 2014 unaudited
2 £ - £ 2,232 £ 1,250 £ 2,151 £ 1,250 £ 4,383 £ 5,633
Due to banks and
other financial institutions 6 - 1,237 - 1,605 - 2,842 2,842
Debt securities in issue 8 - - 1,154 - 1,154 - 1,154
Related debt £ - £ 1,237 £ 1,154 £ 1,605 £ 1,154 £ 2,842 £ 3,996
As at 31 December 2014 audited
2 £ - £ 1,997 £ 1,387 £ 1,645 £ 1,387 £ 3,642 £ 5,029
Due to banks and
other financial institutions 6 - 1,275 - 1,230 - 2,505 2,505
Debt securities in issue 8 - 1,272 - 1,272 - 1,272
Related debt £ - £ 1,275 £ 1,272 £ 1,230 £ 1,272 £ 2,505 £ 3,777
As at 30 June 2015 unaudited
2 £ - £ 2,093 £ 1,411 £ 1,495 £ 1,411 £ 3,588 £ 4,999
Due to banks and
other financial institutions 6 - 1,186 - 1,107 - 2,293 2,293
Debt securities in issue 8 - - 1,296 - 1,296 - 1,296
Related debt £ - £ 1,186 £ 1,296 £ 1,107 £ 1,296 £ 2,293 £ 3,589
Wholesale
Private
£ mil£ mil
Retail
£ mil
Public
£ mil
Public
Loans and advances
subject to securitisation
Loans and advances
subject to securitisation
Loans and advances
subject to securitisation
Private Public
TotalTotal
£ mil£ mil£ mil
Private
FCE's funding sources include securitisation programmes as well as other committed factoring transactions that generally include the transfer of loans and advances through a variety of programmes and structures. The table above summarises the balances relating to the Company’s securitisation transactions, which includes committed factoring programmes and other secured financing. The difference between 'Loans and advances subject to securitisation' and 'Related debt' reflects the Company’s retained interests, not including cash associated with the securitisation transactions.
Cash available to support the obligations of the SEs as at 30 June 2015 of £282 million (31 December 2014: £322 million, 30 June 2014: £354 million) is included within FCE's balance sheet within 'Cash and cash equivalents’.

Financial statements
FCE Bank plc – INTERIM REPORT AND FINANCIAL STATEMENTS – 2015 27
Notes to the condensed consolidated half-yearly financial
statements for the half year ended 30 June 2015 5 SECURITISATION AND RELATED FINANCING continued Transaction structures The Company utilises both amortising and revolving structures, and in all cases programmes provide for matched funding of the loans and advances, with securitisation debt having a maturity profile similar to the related loan. The majority of its programmes also include a contractual commitment to fund existing and future loans and advances subject to conditions described more fully below. In amortising structures, which involve the sale of a static pool of assets, the associated funding is repaid only through the liquidation of the securitised loan and therefore its maturity profile is similar to the related assets. In revolving structures, the Company may continue to sell new eligible assets originated over an agreed period of time called the revolving period, and obtain funding from the transaction investors. In the event that a contractual commitment is not renewed at the end of the revolving period, all loans securitised at the point of non-renewal remain funded, and the related debt is repaid as the loans liquidate.
Within revolving structures the Company uses both flat and variable funding structures. In flat revolving structures during the revolving period new assets are sold into the transaction to maintain a constant level of funding. In variable funding structures, utilisation levels are at the discretion of FCE. For further details on FCE's securitisation programme, refer to Note 17 'Securitisation and related financing' in the 2014 Annual Report and Accounts. At 30 June 2015, outstanding flat revolving capacity totalled £0.2 billion (December 2014: £0.2 billion, June 2014: £0.2 billion), with the revolving period ending October 2015. Variable funding revolving structures at 30 June 2015 totalled £2.7 billion of committed capacity (December 2014: £3.2 billion, June 2014: £3.4 billion) of which £1.0 billion matures during the remainder of 2015 and the balance having various maturity dates between October 2015 and August 2017. At 30 June 2015, £1.8 billion (December 2014: £2.2 billion, June 2014: £2.5 billion) of the variable funding committed capacity was utilised.
Revolving structure capacity
Balance at 1 January 2015 £ 3.4
Committed capacity maturing in the first half of 2015 £ (1.5)
Committed capacity renewed in the first half of 2015 1.0
Other net capacity increase/(reduction) actions 0.1
Exchange adjustments (0.1)
Balance at 30 June 2015 £ 2.9
Variable funding committed capacity £ 2.7
Flat revolving capacity 0.2
Balance at 30 June 2015 £ 2.9
£ bil
Financial statements
28 FCE Bank plc – INTERIM REPORT AND FINANCIAL STATEMENTS – 2015
Notes to the condensed consolidated half-yearly financial
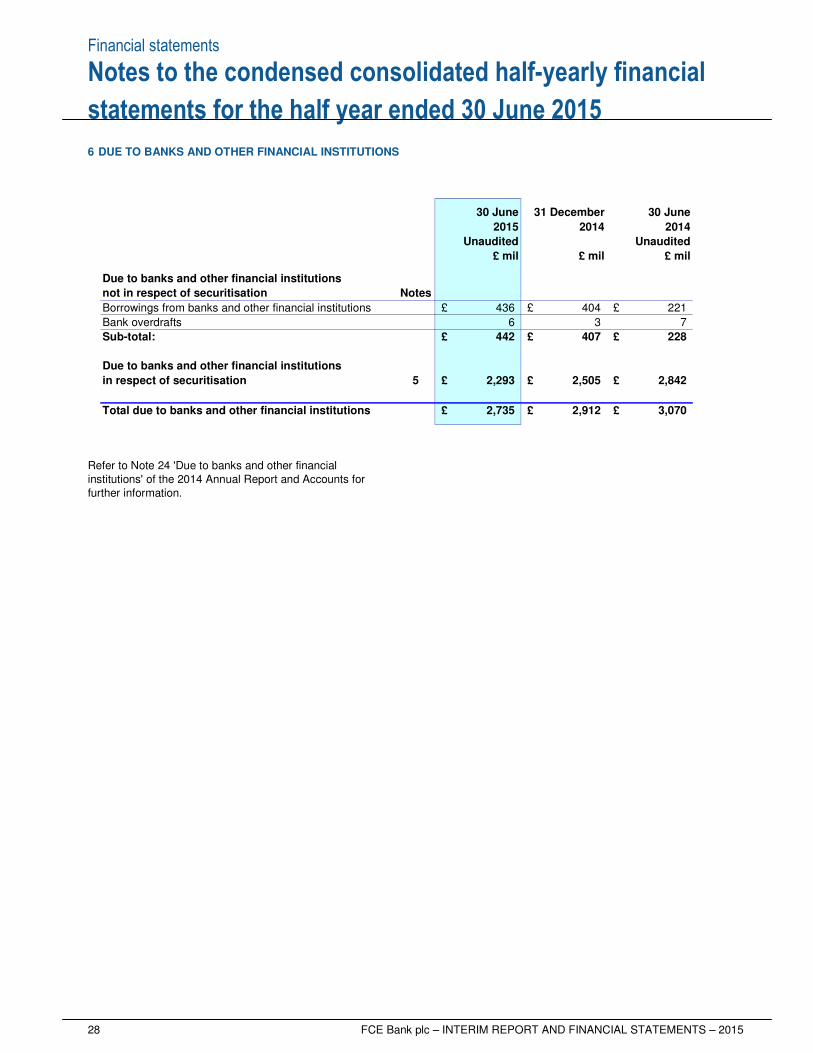
statements for the half year ended 30 June 2015 6 DUE TO BANKS AND OTHER FINANCIAL INSTITUTIONS
Due to banks and other financial institutions
not in respect of securitisation Notes
Borrowings from banks and other financial institutions £ 436 £ 404 £ 221
Bank overdrafts 6 3 7
Sub-total: £ 442 £ 407 £ 228
Due to banks and other financial institutions
in respect of securitisation 5 £ 2,293 £ 2,505 £ 2,842
Total due to banks and other financial institutions £ 2,735 £ 2,912 £ 3,070
£ mil
Unaudited
£ mil
2014
31 December
£ mil
30 June30 June
20142015
Unaudited
Refer to Note 24 'Due to banks and other financial institutions' of the 2014 Annual Report and Accounts for further information.
Financial statements
FCE Bank plc – INTERIM REPORT AND FINANCIAL STATEMENTS – 2015 29
Notes to the condensed consolidated half-yearly financial
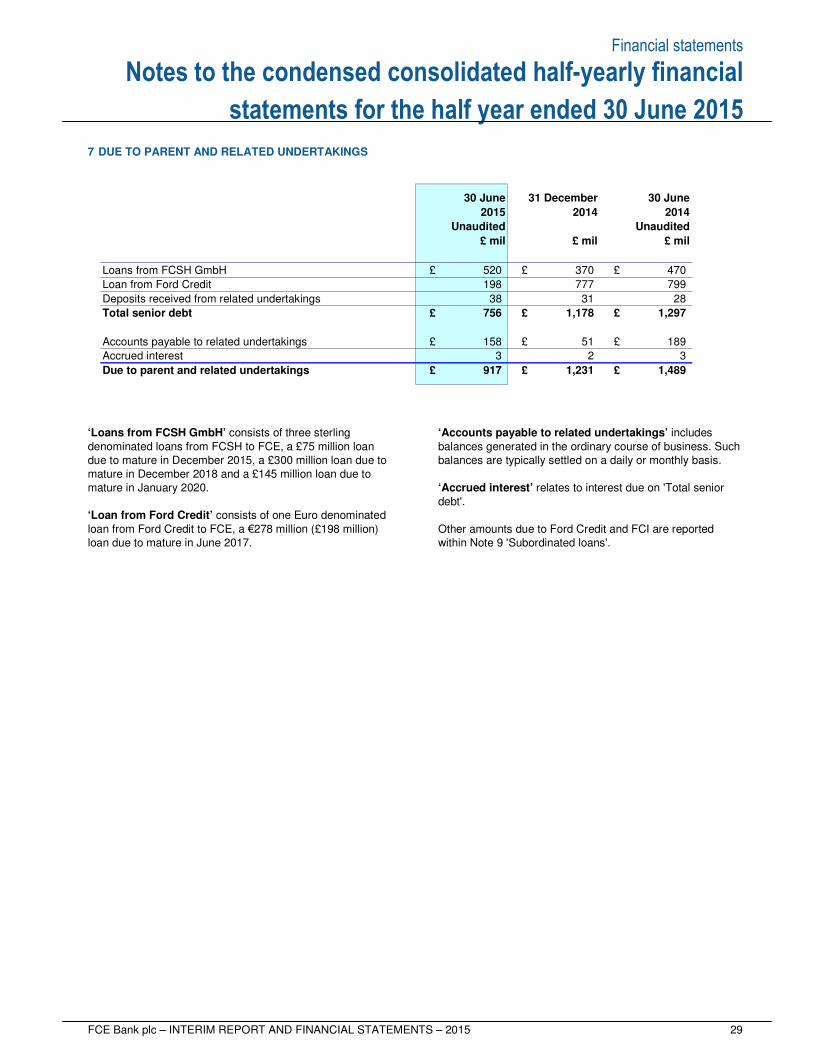
statements for the half year ended 30 June 2015 7 DUE TO PARENT AND RELATED UNDERTAKINGS
Loans from FCSH GmbH £ 520 £ 370 £ 470
Loan from Ford Credit 198 777 799
Deposits received from related undertakings 38 31 28
Total senior debt £ 756 £ 1,178 £ 1,297
Accounts payable to related undertakings £ 158 £ 51 £ 189
Accrued interest 3 2 3
Due to parent and related undertakings £ 917 £ 1,231 £ 1,489
£ mil
Unaudited
£ mil
2014
31 December
£ mil
30 June30 June
20142015
Unaudited
‘Loans from FCSH GmbH’ consists of three sterling denominated loans from FCSH to FCE, a £75 million loan due to mature in December 2015, a £300 million loan due to mature in December 2018 and a £145 million loan due to mature in January 2020. ‘Loan from Ford Credit’ consists of one Euro denominated loan from Ford Credit to FCE, a €278 million (£198 million) loan due to mature in June 2017.
‘Accounts payable to related undertakings’ includes balances generated in the ordinary course of business. Such balances are typically settled on a daily or monthly basis. ‘Accrued interest’ relates to interest due on 'Total senior debt'. Other amounts due to Ford Credit and FCI are reported within Note 9 'Subordinated loans'.
Financial statements
30 FCE Bank plc – INTERIM REPORT AND FINANCIAL STATEMENTS – 2015
Notes to the condensed consolidated half-yearly financial
statements for the half year ended 30 June 2015 8 DEBT SECURITIES IN ISSUE
Notes
Listed debt:
Public issuance Euro Medium Term Notes £ 5,598 £ 4,806 £ 4,443
Sub-total listed Euro Medium Term Notes £ 5,598 £ 4,806 £ 4,443
Obligations arising from securitisation of loans and advances 5 £ 1,296 £ 1,272 £ 1,154
Sub-total listed debt £ 6,894 £ 6,078 £ 5,597
Unlisted debt:
Private issuance Euro Medium Term Notes £ 264 £ 276 £ 280
Schuldschein (refer to definition below) 36 39 56
Debt securities in issue £ 7,194 £ 6,393 £ 5,933
Analysis of debt securities in issue:
Unsecured borrowings £ 5,898 £ 5,121 £ 4,779
Obligations arising from securitisation of loans and advances 5 1,296 1,272 1,154
Debt securities in issue £ 7,194 £ 6,393 £ 5,933
£ mil
2014
31 December
£ mil
30 June30 June
20142015
Unaudited
£ mil
Unaudited
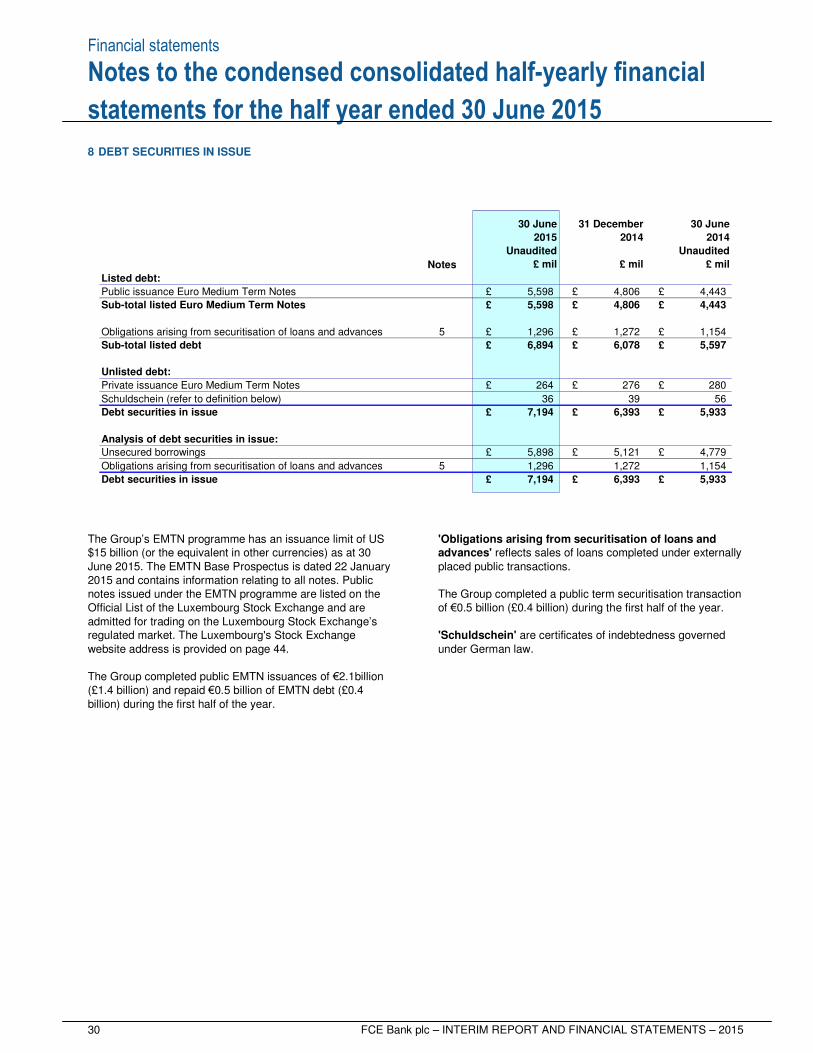
The Group’s EMTN programme has an issuance limit of US $15 billion (or the equivalent in other currencies) as at 30 June 2015. The EMTN Base Prospectus is dated 22 January 2015 and contains information relating to all notes. Public notes issued under the EMTN programme are listed on the Official List of the Luxembourg Stock Exchange and are admitted for trading on the Luxembourg Stock Exchange’s regulated market. The Luxembourg's Stock Exchange website address is provided on page 44. The Group completed public EMTN issuances of €2.1billion (£1.4 billion) and repaid €0.5 billion of EMTN debt (£0.4 billion) during the first half of the year.
'Obligations arising from securitisation of loans and advances' reflects sales of loans completed under externally placed public transactions. The Group completed a public term securitisation transaction of €0.5 billion (£0.4 billion) during the first half of the year. 'Schuldschein' are certificates of indebtedness governed under German law.
Financial statements
FCE Bank plc – INTERIM REPORT AND FINANCIAL STATEMENTS – 2015 31
Notes to the condensed consolidated half-yearly financial
statements for the half year ended 30 June 2015 9 SUBORDINATED LOANS
Perpetual loans £ 206 £ 214 £ 204
£ 206 £ 214 £ 204
£ 206 £ 214 £ 204
£ 206 £ 214 £ 204
£ 139 £ 140 £ 128
67 74 76
Total subordinated loans £ 206 £ 214 £ 204
Unaudited
£ mil
Tier 2 Value of perpetual loans
Total tier 2 value
Due to Ford Credit
Total loan amounts
Analysis of subordinated loans
Due to FCI
£ mil£ mil
30 June
2014
30 June 31 December
2014
Unaudited
2015
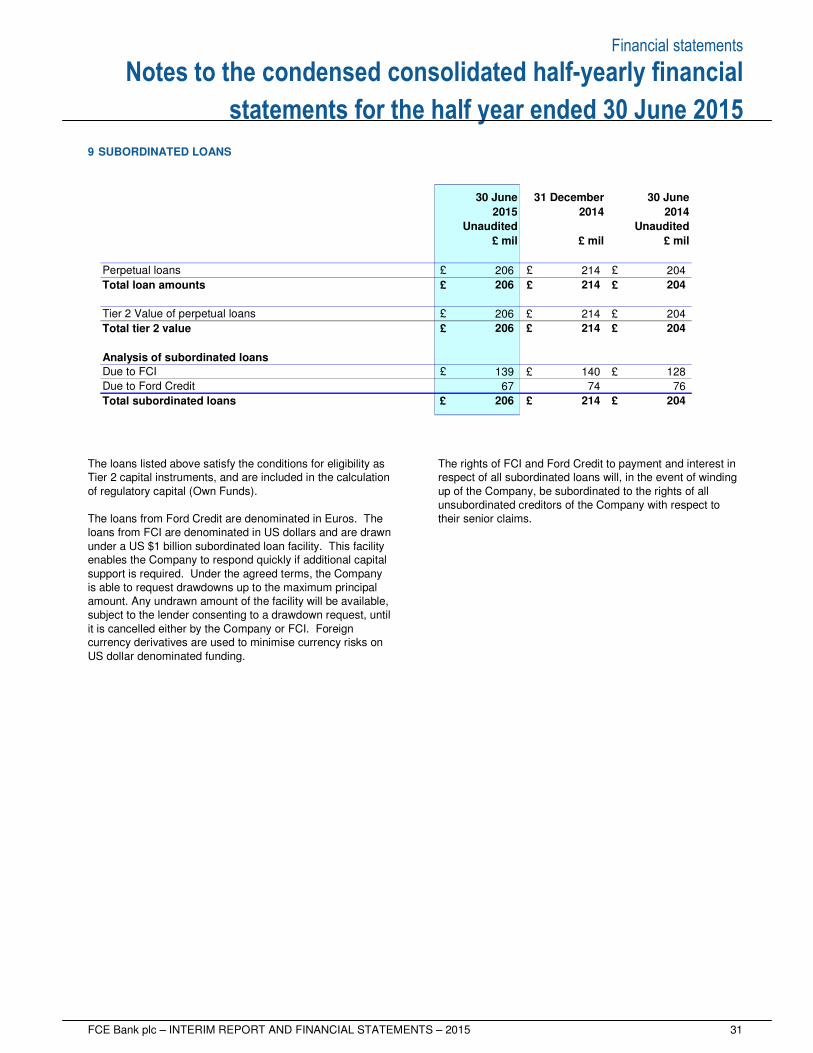
The loans listed above satisfy the conditions for eligibility as Tier 2 capital instruments, and are included in the calculation of regulatory capital (Own Funds). The loans from Ford Credit are denominated in Euros. The loans from FCI are denominated in US dollars and are drawn under a US $1 billion subordinated loan facility. This facility enables the Company to respond quickly if additional capital support is required. Under the agreed terms, the Company is able to request drawdowns up to the maximum principal amount. Any undrawn amount of the facility will be available, subject to the lender consenting to a drawdown request, until it is cancelled either by the Company or FCI. Foreign currency derivatives are used to minimise currency risks on US dollar denominated funding.
The rights of FCI and Ford Credit to payment and interest in respect of all subordinated loans will, in the event of winding up of the Company, be subordinated to the rights of all unsubordinated creditors of the Company with respect to their senior claims.
Financial statements
32 FCE Bank plc – INTERIM REPORT AND FINANCIAL STATEMENTS – 2015
Notes to the condensed consolidated half-yearly financial
statements for the half year ended 30 June 2015 10 CONTINGENT LIABILITIES
2015 2014 2014
Unaudited Unaudited
Guarantees provided on behalf of Ford £ 50 £ 65 £ 79
1 1 1
Total guarantees £ 51 £ 66 £ 80
Other guarantees provided to third parties
£ mil £ mil
30 June
£ mil
31 December 30 June
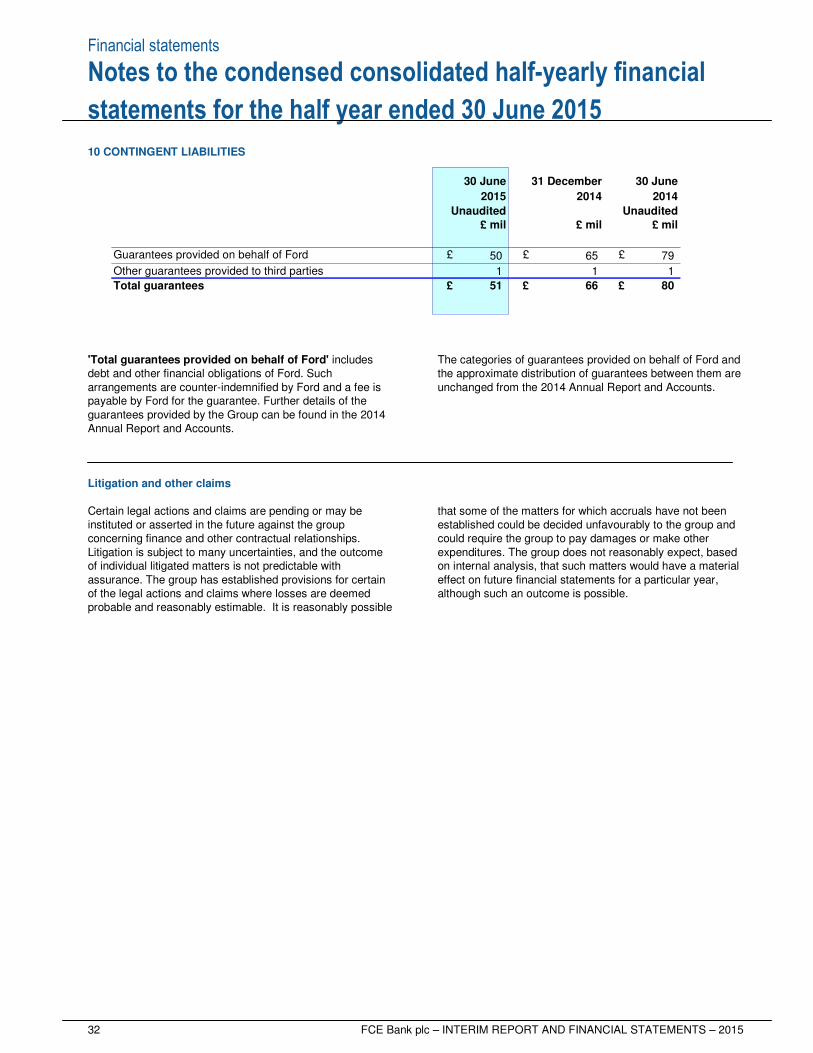
'Total guarantees provided on behalf of Ford' includes debt and other financial obligations of Ford. Such arrangements are counter-indemnified by Ford and a fee is payable by Ford for the guarantee. Further details of the guarantees provided by the Group can be found in the 2014 Annual Report and Accounts.
The categories of guarantees provided on behalf of Ford and the approximate distribution of guarantees between them are unchanged from the 2014 Annual Report and Accounts.
Litigation and other claims Certain legal actions and claims are pending or may be instituted or asserted in the future against the group concerning finance and other contractual relationships. Litigation is subject to many uncertainties, and the outcome of individual litigated matters is not predictable with assurance. The group has established provisions for certain of the legal actions and claims where losses are deemed probable and reasonably estimable. It is reasonably possible
that some of the matters for which accruals have not been established could be decided unfavourably to the group and could require the group to pay damages or make other expenditures. The group does not reasonably expect, based on internal analysis, that such matters would have a material effect on future financial statements for a particular year, although such an outcome is possible.
Financial statements
FCE Bank plc – INTERIM REPORT AND FINANCIAL STATEMENTS – 2015 33
Notes to the condensed consolidated half-yearly financial
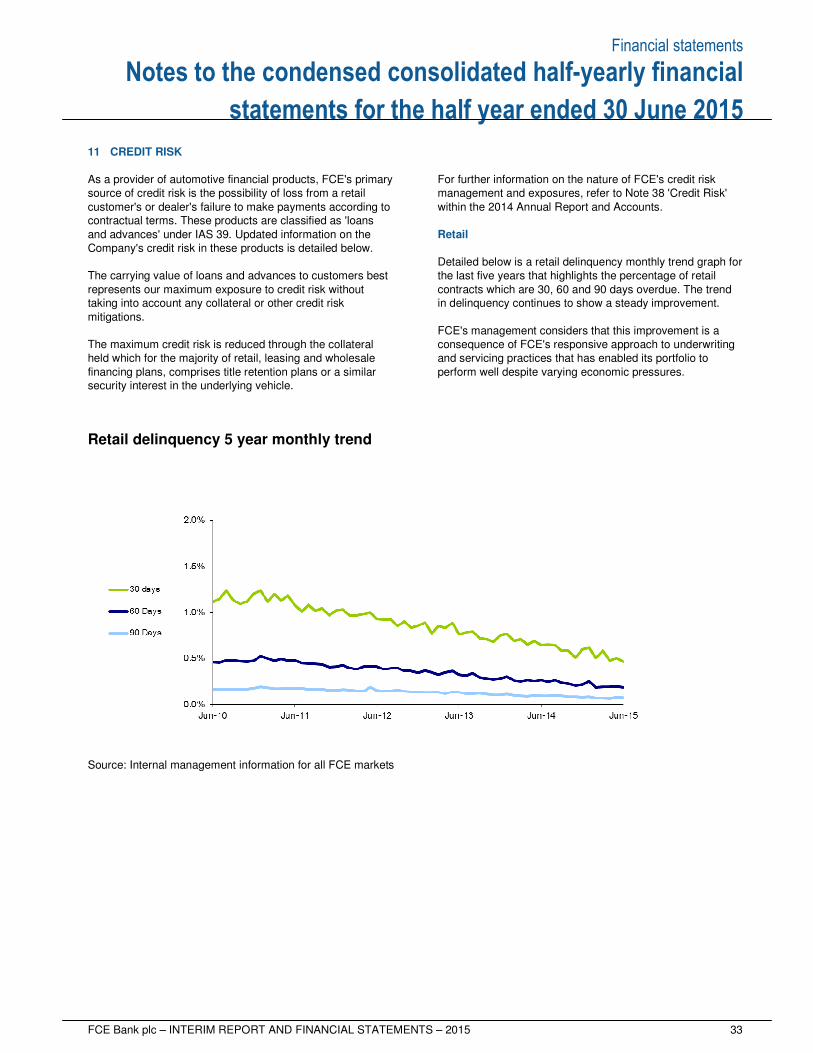
statements for the half year ended 30 June 2015 11 CREDIT RISK As a provider of automotive financial products, FCE's primary source of credit risk is the possibility of loss from a retail customer's or dealer's failure to make payments according to contractual terms. These products are classified as 'loans and advances' under IAS 39. Updated information on the Company's credit risk in these products is detailed below. The carrying value of loans and advances to customers best represents our maximum exposure to credit risk without taking into account any collateral or other credit risk mitigations. The maximum credit risk is reduced through the collateral held which for the majority of retail, leasing and wholesale financing plans, comprises title retention plans or a similar security interest in the underlying vehicle.
For further information on the nature of FCE's credit risk management and exposures, refer to Note 38 'Credit Risk' within the 2014 Annual Report and Accounts. Retail Detailed below is a retail delinquency monthly trend graph for the last five years that highlights the percentage of retail contracts which are 30, 60 and 90 days overdue. The trend in delinquency continues to show a steady improvement. FCE's management considers that this improvement is a consequence of FCE's responsive approach to underwriting and servicing practices that has enabled its portfolio to perform well despite varying economic pressures.
Retail delinquency 5 year monthly trend
Source: Internal management information for all FCE markets
Financial statements
34 FCE Bank plc – INTERIM REPORT AND FINANCIAL STATEMENTS – 2015
Notes to the condensed consolidated half-yearly financial
statements for the half year ended 30 June 2015
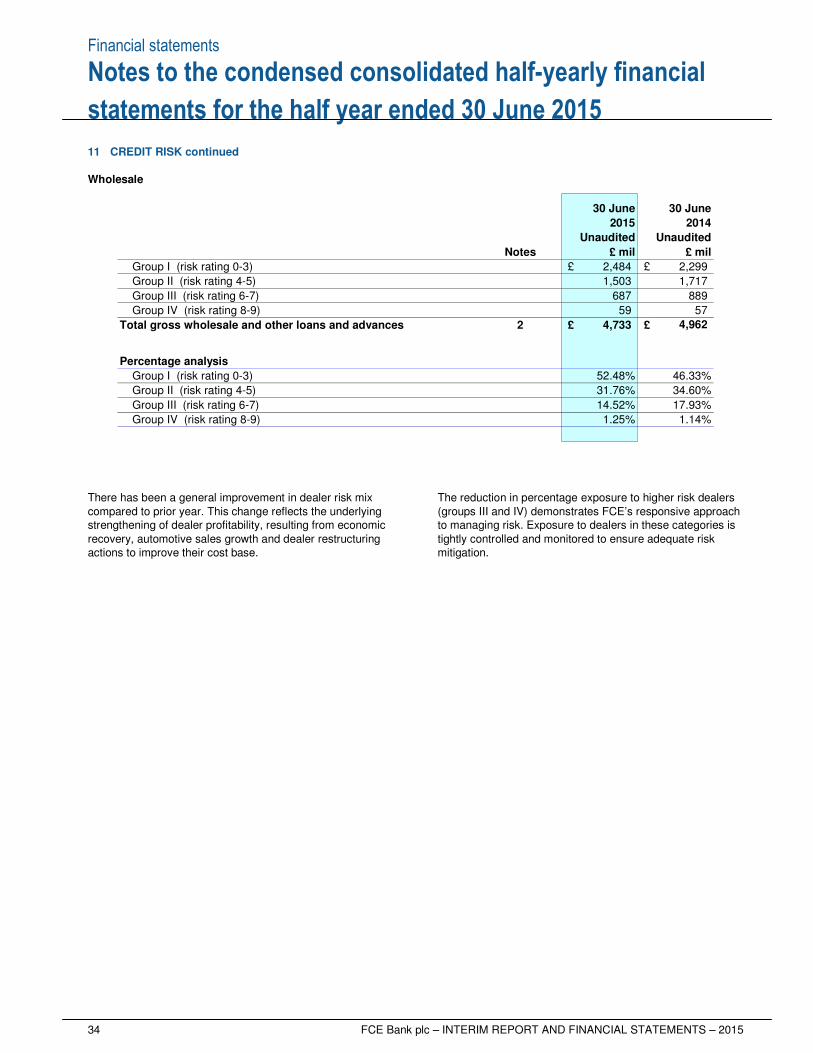
11 CREDIT RISK continued Wholesale
30 June 30 June
2015 2014
Unaudited Unaudited
Notes £ mil £ mil
Group I (risk rating 0-3) £ 2,484 £ 2,299
Group II (risk rating 4-5) 1,503 1,717
Group III (risk rating 6-7) 687 889
Group IV (risk rating 8-9) 59 57
Total gross wholesale and other loans and advances 2 £ 4,733 £ 4,962
Percentage analysis
Group I (risk rating 0-3) 52.48% 46.33%
Group II (risk rating 4-5) 31.76% 34.60%
Group III (risk rating 6-7) 14.52% 17.93%
Group IV (risk rating 8-9) 1.25% 1.14%
There has been a general improvement in dealer risk mix compared to prior year. This change reflects the underlying strengthening of dealer profitability, resulting from economic recovery, automotive sales growth and dealer restructuring actions to improve their cost base.
The reduction in percentage exposure to higher risk dealers (groups III and IV) demonstrates FCE’s responsive approach to managing risk. Exposure to dealers in these categories is tightly controlled and monitored to ensure adequate risk mitigation.
Financial statements
FCE Bank plc – INTERIM REPORT AND FINANCIAL STATEMENTS – 2015 35
Notes to the condensed consolidated half-yearly financial
statements for the half year ended 30 June 2015
12 RELATED PARTY TRANSACTIONS
Refer to Note 43 'Related party transactions' of the 2014 Annual Report and Accounts for information on parties related to FCE and details of associated transactions. Updates to transactions from the year ended 31 December 2014 are detailed below: Transactions with parent undertakings Refer to Note 7 for details of transactions with the Company’s parent and related undertakings and Note 9 for the details of the Company’s subordinated debt. Service fees charged to FCE by parent undertakings relate to technical and administrative advice and services provided by Ford Credit. The amount of service fees charged for the six month period to 30 June 2015 totalled £5 million (30 June 2014: £5 million). Transactions with directors and officers Refer to page 57 of FCE's 2014 Annual Report and Accounts for details of the terms of the loans made to directors and officers.
Transactions with entities under common control
As at 30 June 2015, unearned interest supplements reported in Note 2 'Loans and advances to customers' totalled £130 million (30 June 2014: £143 million). As at 30 June 2015, unearned income supplements and other support payments received from related parties for motor vehicles held for use by FCE as the lessor under operating leases as reported in 'Other liabilities' totalled £34 million (30 June 2014: £41 million). Associated interest and income supplements earned and recorded in the income statement for the six months ended 30 June 2015 totalled £200 million (30 June 2014: £219 million). Due to an arrangement with Ford relating to FCE’s operating lease portfolio, under which Ford indemnifies FCE for the majority of residual value losses and receives the benefit of the majority of residual value gains, payments totalling £4 million were made to Ford for the six month period to 30 June 2015 (30 June 2014 £4 million). Certain amounts in relation to UK taxes are payable to Ford Motor Company UK under group relief arrangements. Refer to Note 19 and Note 43 of the 2014 Annual Report and Accounts for further details. FCE participates in defined benefit pension plans operated by Ford in the UK and Germany. FCE accounts for such plans by recognising a cost equal to any contributions payable for the period. Refer to Note 34 ‘Retirement benefit obligations’ of the 2014 Annual Report and Accounts for further details.
Financial statements
36 FCE Bank plc – INTERIM REPORT AND FINANCIAL STATEMENTS – 2015
Notes to the condensed consolidated half-yearly financial
statements for the half year ended 30 June 2015
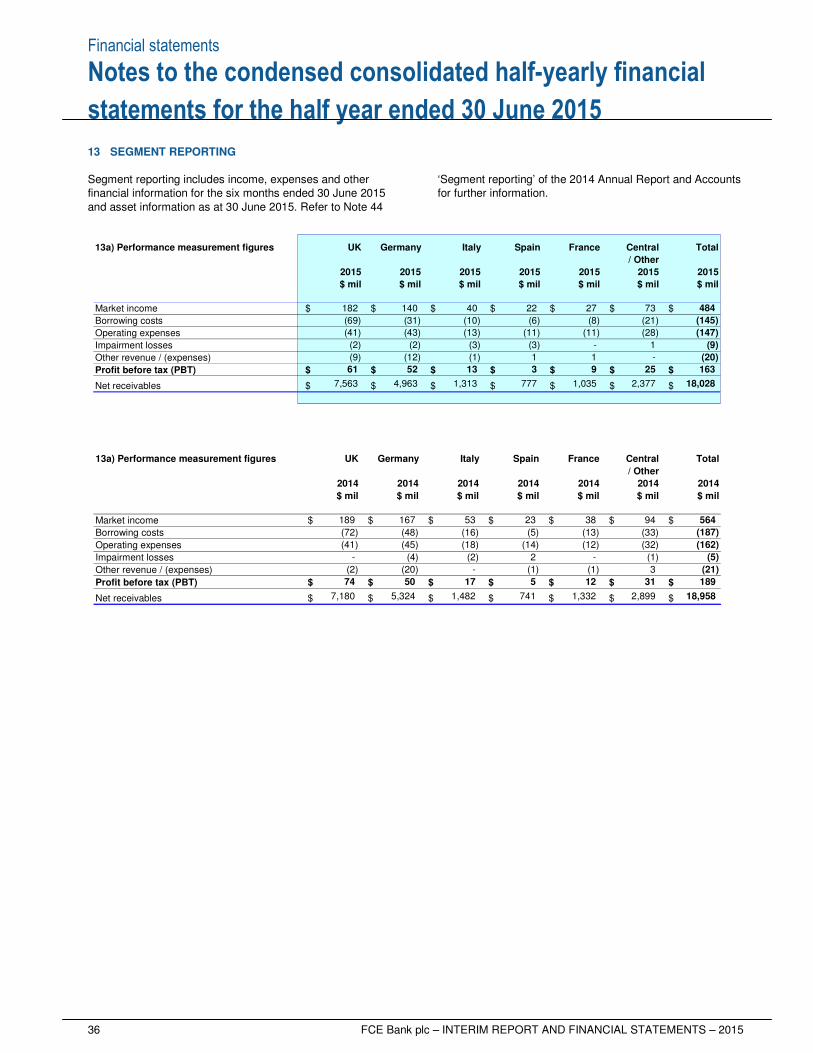
13 SEGMENT REPORTING Segment reporting includes income, expenses and other financial information for the six months ended 30 June 2015 and asset information as at 30 June 2015. Refer to Note 44
‘Segment reporting’ of the 2014 Annual Report and Accounts for further information.
13a) Performance measurement figures
Market income $ $ $ $ $ $ $
Borrowing costs
Operating expenses
Impairment losses
Other revenue / (expenses)
Profit before tax (PBT) $ $ $ $ $ $ $
Net receivables $ $ $ $ $ $ $
(43)
(9)
61
7,563
(2)
13
(12)
52
4,963 1,313
(2)
$ mil
182
(69)
(41)
UK
2015
$ mil
(10) (31)
777
3
1
2015
ItalyGermany
2015
140 40
$ mil
(8)
-
1,035
9
1
(13) (11)
(3)
(1)
(3)
(11)
Spain
2015
$ mil $ mil
France
2015
22
(6)
27
Total
20152015
$ mil
Central
$ mil
/ Other
(147)
(145)
484
(9)
18,028
(20)
163
73
1
(21)
(28)
2,377
-
25
13a) Performance measurement figures
Market income $ $ $ $ $ $ $
Borrowing costs
Operating expenses
Impairment losses
Other revenue / (expenses)
Profit before tax (PBT) $ $ $ $ $ $ $
Net receivables $ $ $ $ $ $ $ 7,180 5,324 1,482 741 1,332 2,899
(21)
189
18,958
74 50 17 5 12 31
(2) (20) - (1) (1) 3
(162)
- (4) (2) 2 - (1) (5)
(41) (45) (18) (14) (12) (32)
564
(72) (48) (16) (5) (13) (33) (187)
189 167 53 23 38 94
$ mil $ mil $ mil $ mil $ mil $ mil $ mil
Total
/ Other
2014 2014 2014 2014 2014 2014 2014
UK Germany Italy Spain France Central
Financial statements
FCE Bank plc – INTERIM REPORT AND FINANCIAL STATEMENTS – 2015 37
Notes to the condensed consolidated half-yearly financial
statements for the half year ended 30 June 2015
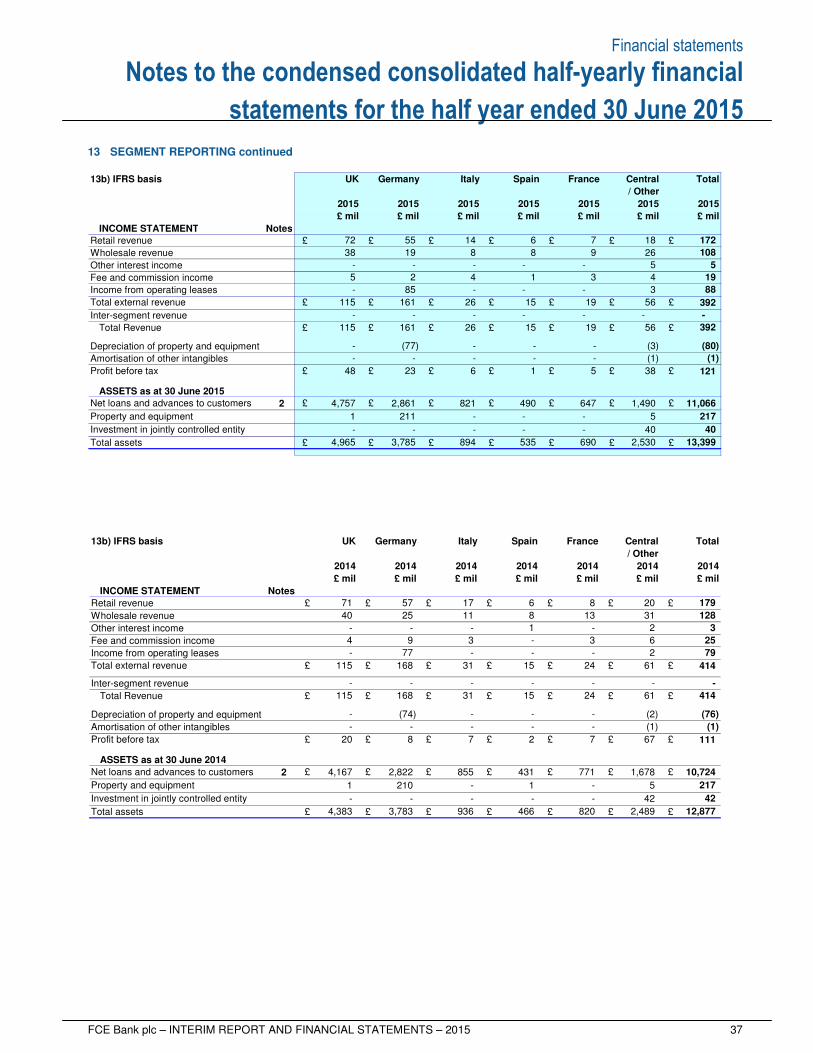
13 SEGMENT REPORTING continued 13b) IFRS basis
INCOME STATEMENT Notes
Retail revenue £ £ £ £ £ £ £
Wholesale revenue
Other interest income
Fee and commission income
Income from operating leases
Total external revenue £ £ £ £ £ £ £
Inter-segment revenue
Total Revenue £ £ £ £ £ £ £
Depreciation of property and equipment
Amortisation of other intangibles
Profit before tax £ £ £ £ £ £ £
ASSETS as at 30 June 2015
Net loans and advances to customers 2 £ £ £ £ £ £ £
Property and equipment
Investment in jointly controlled entity
Total assets £ £ £ £ £ £ £
5
26
18
4
-
1
535
-
13,399
40
(80)
(1)
121
11,066
217
392
690 2,530
40
Spain
£ mil
2015 2015
/ Other
8
6
France
2015
£ mil
-
490
1
-
15
Italy
-
821
£ mil
Germany
2015
(77)
23
2,861
3,785
85
55
19
-
2
161
-
894
172
£ mil
2015
TotalCentral
-
108
5
19
-
392
88
-
19
- -
161
2015
38
(1)
(3)
6
56
3
56
-
-
9
19
5
1,490
3
72 14 7
£ mil £ mil
-
5
-
38
-
4
8
-
-
115 26
- -
2015
UK
-
115
48
-
4,757
1
- -
211 - - -
-
-
4,965
£ mil
-
26 15
-
5
647
-
13b) IFRS basis
INCOME STATEMENT Notes
Retail revenue £ £ £ £ £ £ £
Wholesale revenue
Other interest income
Fee and commission income
Income from operating leases
Total external revenue £ £ £ £ £ £ £
Inter-segment revenue
Total Revenue £ £ £ £ £ £ £
Depreciation of property and equipment
Amortisation of other intangibles
Profit before tax £ £ £ £ £ £ £
ASSETS as at 30 June 2014
Net loans and advances to customers 2 £ £ £ £ £ £ £
Property and equipment
Investment in jointly controlled entity
Total assets £ £ £ £ £ £ £
UK Germany Italy Spain France Central Total
/ Other
2014 2014 2014 2014 2014 2014 2014
£ mil £ mil £ mil £ mil £ mil £ mil £ mil
31 128
71 57 17 6 8 20
- 1 - 2
179
40 25 11 8 13
3
4 9 3 - 3 6 25
- -
61 414
- 77 - - - 2
- - - -
79
115 168 31 15 24
-
115 168 31 15 24 61 414
- -
(1) (1)
- (74) - - - (2) (76)
- - - - -
20 8 7 2 7 67 111
1,678 10,724
- 1 - 5
4,167 2,822 855 431 771
217 1 210
- - - - - 42
936 466 820 2,489
42
12,877 4,383 3,783
Financial statements
38 FCE Bank plc – INTERIM REPORT AND FINANCIAL STATEMENTS – 2015
Notes to the condensed consolidated half-yearly financial
statements for the half year ended 30 June 2015
13 SEGMENT REPORTING continued
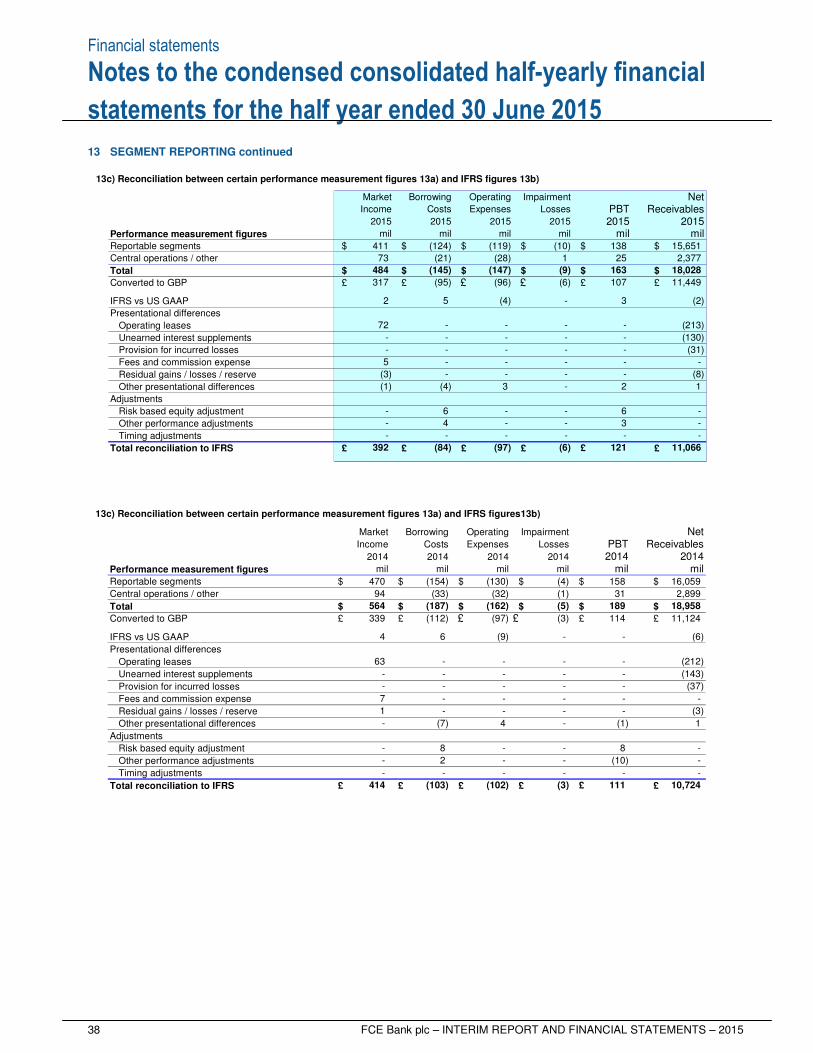
13c) Reconciliation between certain performance measurement figures 13a) and IFRS figures 13b)
NetPBT Receivables
Performance measurement figures mil milReportable segments $ $ $ $ $ $
Central operations / other
Total $ $ $ $ $ $
Converted to GBP £ £ £ £ £ £
IFRS vs US GAAP
Presentational differences
Operating leases
Unearned interest supplements
Provision for incurred losses
Fees and commission expense
Residual gains / losses / reserve
Other presentational differences
Adjustments
Risk based equity adjustment
Other performance adjustments
Timing adjustments
Total reconciliation to IFRS £ £ £ £ £ £
mil mil
Borrowing
mil mil
Losses
ImpairmentMarket
Income
Operating
Costs Expenses
-
-
-
-
-
- -
-
-
-
-
-
-
-
(8)
(213)
(130)
(31)
-
-
-
-
- 6
2 1
-
-
-
-
3
-
(84)
- -
(97)
-
-
(6)
- -
3
121 11,066
-
-
6
5
-
4
(4)
-
72
(1)
-
392
-
-
(96)
(3)
-
18,028
(6)
(4) (2)
11,449
3
107
2,377
15,651
163
2
317
- 5
(95)
(10)
(9)
1 25
138
(28)
(119)
(147)
411
484
73
(124)
(21)
(145)
2015 2015 2015 2015 2015 2015
13c) Reconciliation between certain performance measurement figures 13a) and IFRS figures13b)
NetPBT Receivables
Performance measurement figures mil milReportable segments $ $ $ $ $ $
Central operations / other
Total $ $ $ $ $ $
Converted to GBP £ £ £ £ £ £
IFRS vs US GAAP
Presentational differences
Operating leases
Unearned interest supplements
Provision for incurred losses
Fees and commission expense
Residual gains / losses / reserve
Other presentational differences
Adjustments
Risk based equity adjustment
Other performance adjustments
Timing adjustments
Total reconciliation to IFRS £ £ £ £ £ £ 414 (103) (102) (3) 111 10,724
- - - - - -
- 2 - - (10) -
- 8 - - 8 -
- (7) 4 - (1) 1
1 - - - - (3)
7 - - - - -
- - - - - (37)
- (212)
- - - - - (143)
63 - - -
4 6 (9) - - (6)
339 (112) (97) (3) 114 11,124
564 (187) (162) (5) 189 18,958
158 16,059
94 (33) (32) (1) 31 2,899
mil mil mil mil
470 (154) (130) (4)
Market Borrowing Operating Impairment
Income Costs Expenses Losses
2014 2014 2014 2014 2014 2014
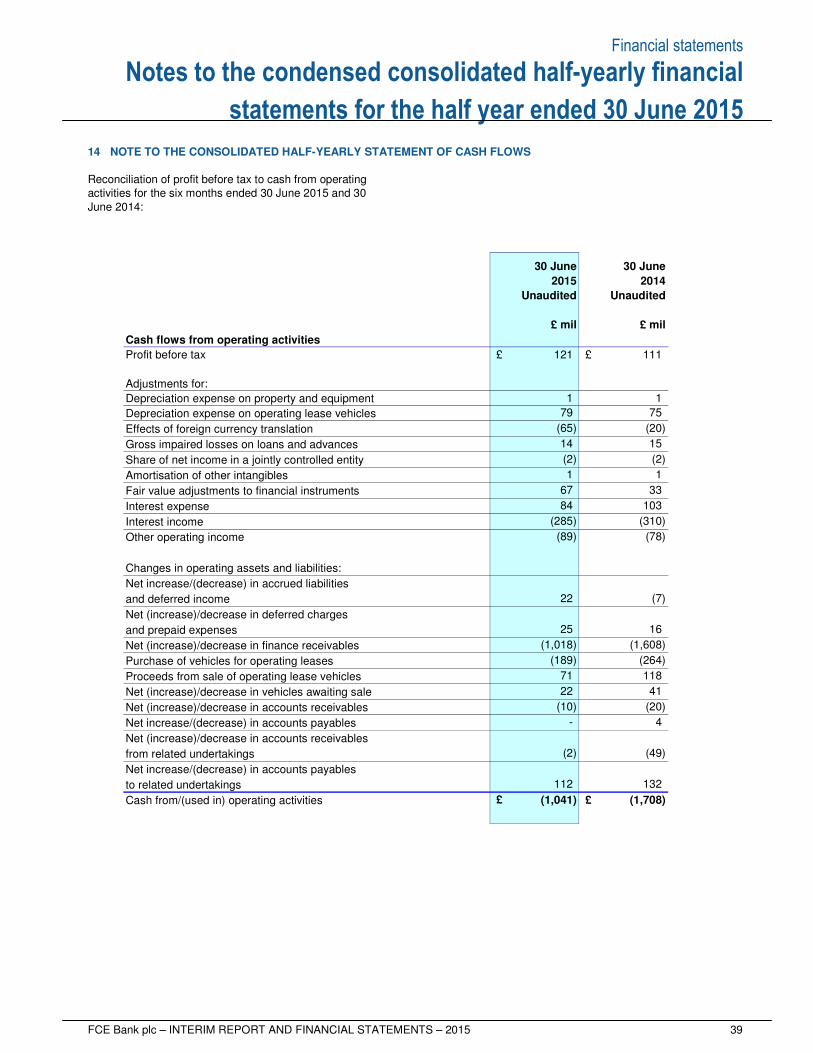
Financial statements
FCE Bank plc – INTERIM REPORT AND FINANCIAL STATEMENTS – 2015 39
Notes to the condensed consolidated half-yearly financial
statements for the half year ended 30 June 2015 14 NOTE TO THE CONSOLIDATED HALF-YEARLY STATEMENT OF CASH FLOWS Reconciliation of profit before tax to cash from operating activities for the six months ended 30 June 2015 and 30 June 2014:
Cash flows from operating activities
Profit before tax £ 121 £ 111
Adjustments for:
Depreciation expense on property and equipment 1 1
Depreciation expense on operating lease vehicles 79 75
Effects of foreign currency translation (65) (20)
Gross impaired losses on loans and advances 14 15
Share of net income in a jointly controlled entity (2) (2)
Amortisation of other intangibles 1 1
Fair value adjustments to financial instruments 67 33
Interest expense 84 103
Interest income (285) (310)
Other operating income (89) (78)
Changes in operating assets and liabilities:
Net increase/(decrease) in accrued liabilities
and deferred income 22 (7)
Net (increase)/decrease in deferred charges
and prepaid expenses 25 16
Net (increase)/decrease in finance receivables (1,018) (1,608)
Purchase of vehicles for operating leases (189) (264)
Proceeds from sale of operating lease vehicles 71 118
Net (increase)/decrease in vehicles awaiting sale 22 41
Net (increase)/decrease in accounts receivables (10) (20)
Net increase/(decrease) in accounts payables - 4
Net (increase)/decrease in accounts receivables
from related undertakings (2) (49)
Net increase/(decrease) in accounts payables
to related undertakings 112 132
Cash from/(used in) operating activities £ (1,041) £ (1,708)
2015
30 June
Unaudited
30 June
Unaudited
2014
£ mil £ mil
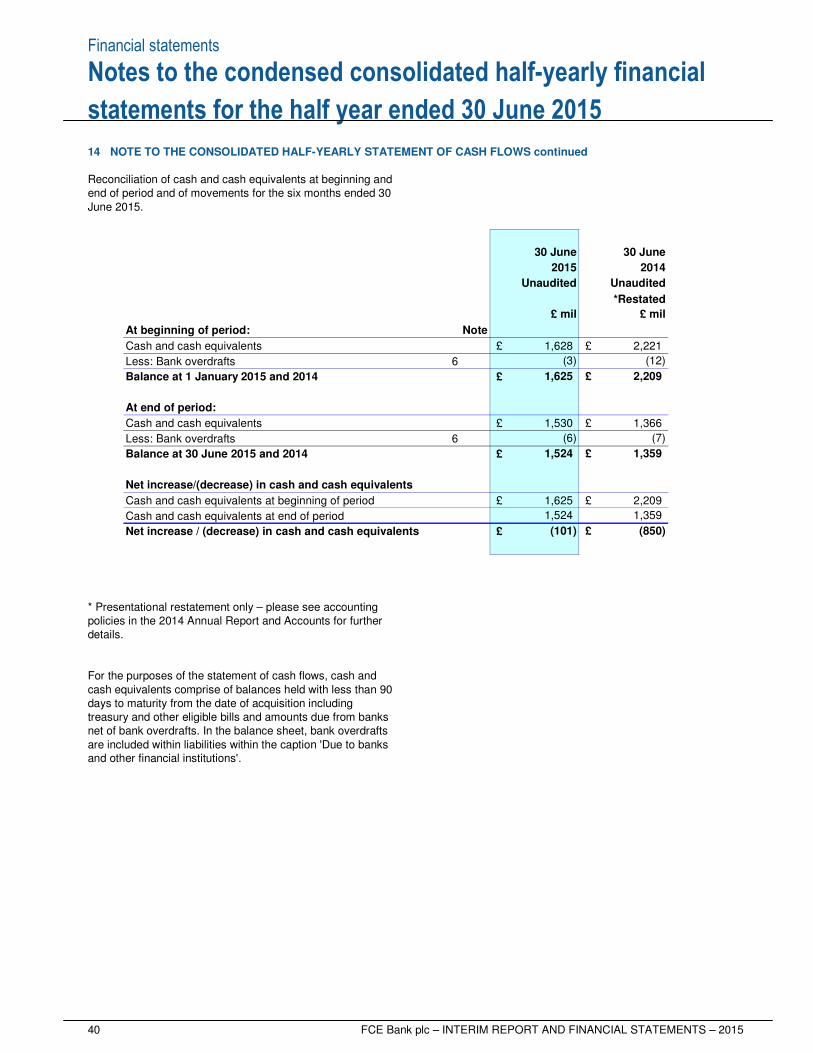
Financial statements
40 FCE Bank plc – INTERIM REPORT AND FINANCIAL STATEMENTS – 2015
Notes to the condensed consolidated half-yearly financial
statements for the half year ended 30 June 2015 14 NOTE TO THE CONSOLIDATED HALF-YEARLY STATEMENT OF CASH FLOWS continued Reconciliation of cash and cash equivalents at beginning and end of period and of movements for the six months ended 30 June 2015.
*Restated
At beginning of period: Note
Cash and cash equivalents £ 1,628 £ 2,221
Less: Bank overdrafts 6 (3) (12)
Balance at 1 January 2015 and 2014 £ 1,625 £ 2,209
At end of period:
Cash and cash equivalents £ 1,530 £ 1,366
Less: Bank overdrafts 6 (6) (7)
Balance at 30 June 2015 and 2014 £ 1,524 £ 1,359
Net increase/(decrease) in cash and cash equivalents
Cash and cash equivalents at beginning of period £ 1,625 £ 2,209
Cash and cash equivalents at end of period 1,524 1,359
Net increase / (decrease) in cash and cash equivalents £ (101) £ (850)
£ mil
30 June 30 June
2015 2014
£ mil
Unaudited Unaudited
* Presentational restatement only – please see accounting policies in the 2014 Annual Report and Accounts for further details. For the purposes of the statement of cash flows, cash and cash equivalents comprise of balances held with less than 90 days to maturity from the date of acquisition including treasury and other eligible bills and amounts due from banks net of bank overdrafts. In the balance sheet, bank overdrafts are included within liabilities within the caption 'Due to banks and other financial institutions'.
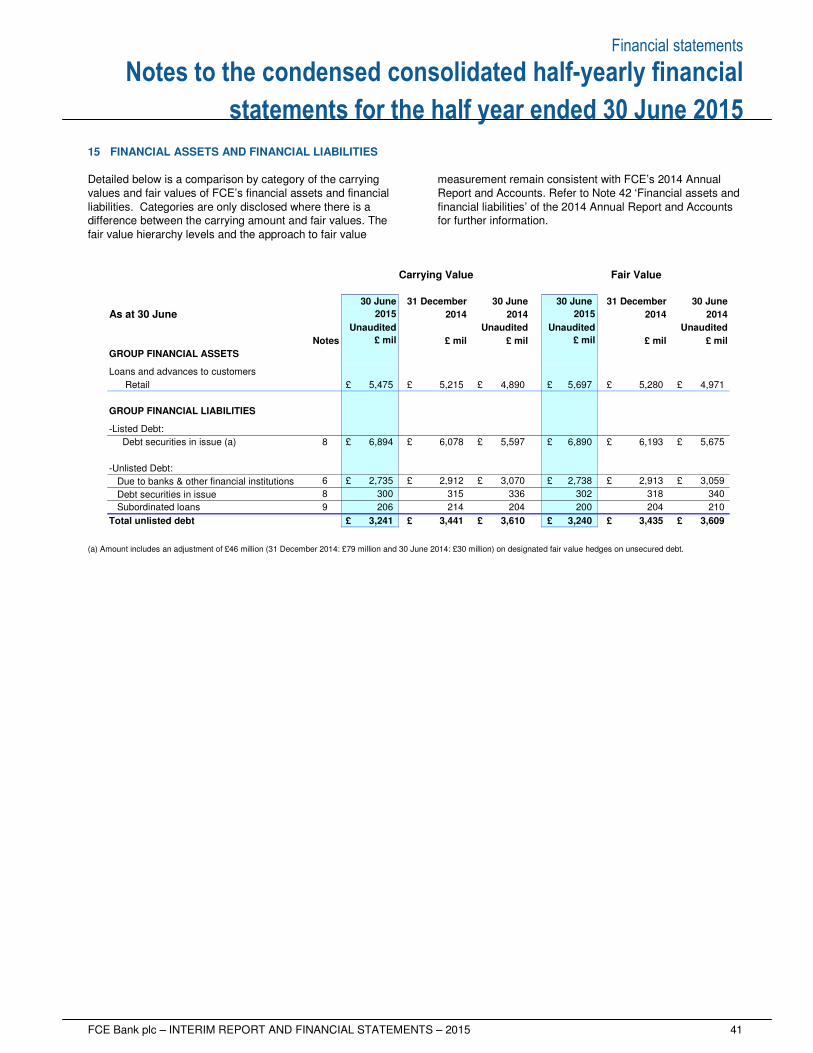
Financial statements
FCE Bank plc – INTERIM REPORT AND FINANCIAL STATEMENTS – 2015 41
Notes to the condensed consolidated half-yearly financial
statements for the half year ended 30 June 2015
15 FINANCIAL ASSETS AND FINANCIAL LIABILITIES Detailed below is a comparison by category of the carrying values and fair values of FCE’s financial assets and financial liabilities. Categories are only disclosed where there is a difference between the carrying amount and fair values. The fair value hierarchy levels and the approach to fair value
measurement remain consistent with FCE’s 2014 Annual Report and Accounts. Refer to Note 42 ‘Financial assets and financial liabilities’ of the 2014 Annual Report and Accounts for further information.
30 June 31 December 30 June 30 June 31 December 30 June
As at 30 June 2014 2014 2014 2014
Unaudited Unaudited Unaudited Unaudited
Notes £ mil £ mil £ mil £ mil
GROUP FINANCIAL ASSETS
Loans and advances to customers
Retail £ 5,475 £ 5,215 £ 4,890 £ 5,697 £ 5,280 £ 4,971
GROUP FINANCIAL LIABILITIES
-Listed Debt:
Debt securities in issue (a) 8 £ 6,894 £ 6,078 £ 5,597 £ 6,890 £ 6,193 £ 5,675
-Unlisted Debt:
Due to banks & other financial institutions 6 £ 2,735 £ 2,912 £ 3,070 £ 2,738 £ 2,913 £ 3,059
Debt securities in issue 8 300 315 336 302 318 340
Subordinated loans 9 206 214 204 200 204 210
Total unlisted debt £ 3,241 £ 3,441 £ 3,610 £ 3,240 £ 3,435 £ 3,609
£ mil £ mil
Carrying Value Fair Value
2015 2015
(a) Amount includes an adjustment of £46 million (31 December 2014: £79 million and 30 June 2014: £30 million) on designated fair value hedges on unsecured debt.
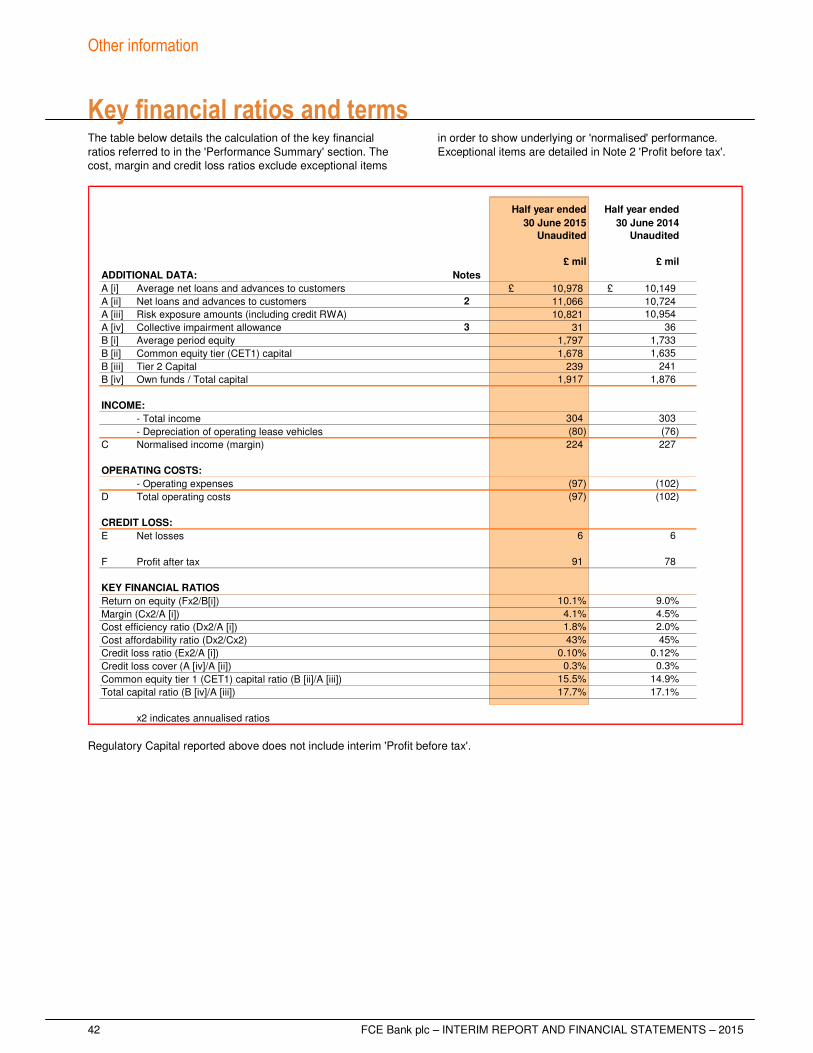
Other information
42 FCE Bank plc – INTERIM REPORT AND FINANCIAL STATEMENTS – 2015
Key financial ratios and terms The table below details the calculation of the key financial ratios referred to in the 'Performance Summary' section. The cost, margin and credit loss ratios exclude exceptional items
in order to show underlying or 'normalised' performance. Exceptional items are detailed in Note 2 'Profit before tax'.
30 June 2015 30 June 2014
ADDITIONAL DATA: Notes
A [i] Average net loans and advances to customers £ 10,978 £ 10,149
A [ii] Net loans and advances to customers 2 11,066 10,724
A [iii] Risk exposure amounts (including credit RWA) 10,821 10,954
A [iv] Collective impairment allowance 3 31 36
B [i] Average period equity 1,797 1,733
B [ii] Common equity tier (CET1) capital 1,678 1,635
B [iii] Tier 2 Capital 239 241
B [iv] Own funds / Total capital 1,917 1,876
INCOME:
- Total income 304 303
- Depreciation of operating lease vehicles (80) (76)
C Normalised income (margin) 224 227
OPERATING COSTS:
- Operating expenses (97) (102)
D Total operating costs (97) (102)
CREDIT LOSS:
E Net losses 6 6
F Profit after tax 91 78
KEY FINANCIAL RATIOS
Return on equity (Fx2/B[i]) 10.1% 9.0%
Margin (Cx2/A [i]) 4.1% 4.5%
Cost efficiency ratio (Dx2/A [i]) 1.8% 2.0%
Cost affordability ratio (Dx2/Cx2) 43% 45%
Credit loss ratio (Ex2/A [i]) 0.10% 0.12%
Credit loss cover (A [iv]/A [ii]) 0.3% 0.3%
Common equity tier 1 (CET1) capital ratio (B [ii]/A [iii]) 15.5% 14.9%
Total capital ratio (B [iv]/A [iii]) 17.7% 17.1%
x2 indicates annualised ratios
Half year ended
£ mil£ mil
Unaudited
Half year ended
Unaudited
Regulatory Capital reported above does not include interim 'Profit before tax'.
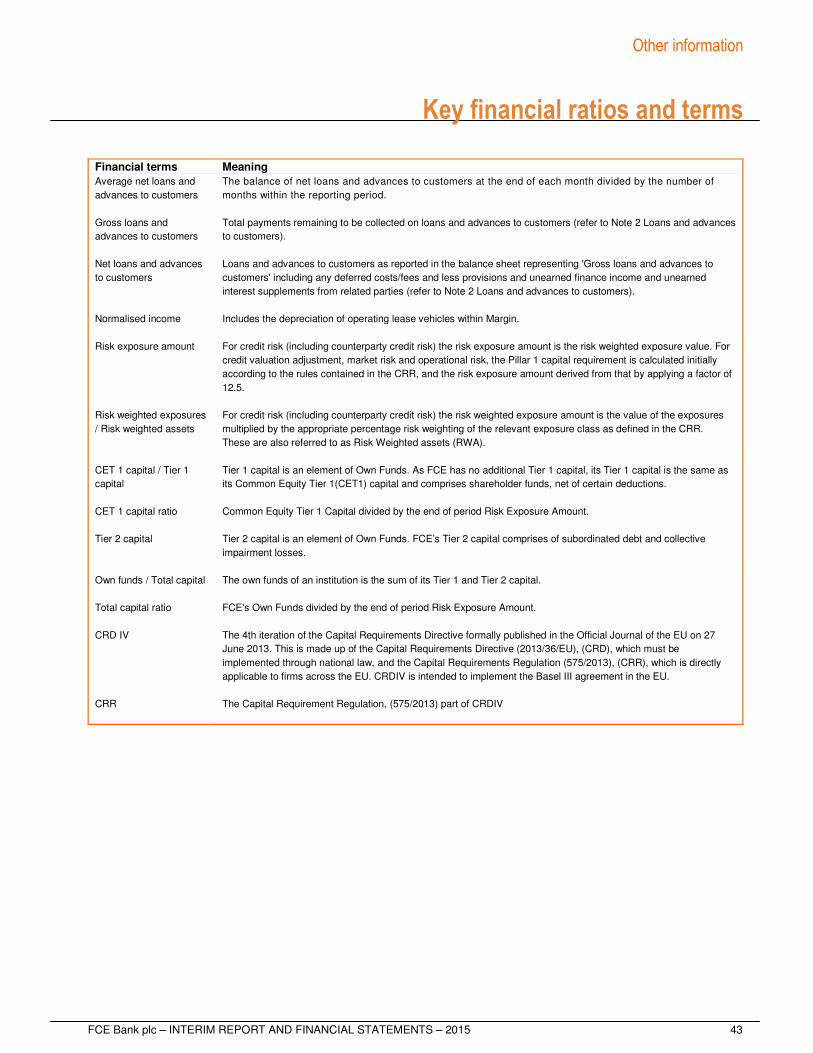
Other information
FCE Bank plc – INTERIM REPORT AND FINANCIAL STATEMENTS – 2015 43
Key financial ratios and terms
Financial terms Meaning
Average net loans and
advances to customers
The balance of net loans and advances to customers at the end of each month divided by the number of
months within the reporting period.
Gross loans and
advances to customers
Total payments remaining to be collected on loans and advances to customers (refer to Note 2 Loans and advances
to customers).
Net loans and advances
to customers
Loans and advances to customers as reported in the balance sheet representing 'Gross loans and advances to
customers' including any deferred costs/fees and less provisions and unearned finance income and unearned
interest supplements from related parties (refer to Note 2 Loans and advances to customers).
Normalised income Includes the depreciation of operating lease vehicles within Margin.
Risk exposure amount
For credit risk (including counterparty credit risk) the risk exposure amount is the risk weighted exposure value. For
credit valuation adjustment, market risk and operational risk, the Pillar 1 capital requirement is calculated initially
according to the rules contained in the CRR, and the risk exposure amount derived from that by applying a factor of
12.5.
Risk weighted exposures
/ Risk weighted assets
For credit risk (including counterparty credit risk) the risk weighted exposure amount is the value of the exposures
multiplied by the appropriate percentage risk weighting of the relevant exposure class as defined in the CRR.
These are also referred to as Risk Weighted assets (RWA).
CET 1 capital / Tier 1
capital
Tier 1 capital is an element of Own Funds. As FCE has no additional Tier 1 capital, its Tier 1 capital is the same as
its Common Equity Tier 1(CET1) capital and comprises shareholder funds, net of certain deductions.
CET 1 capital ratio
Common Equity Tier 1 Capital divided by the end of period Risk Exposure Amount.
Tier 2 capital
Tier 2 capital is an element of Own Funds. FCE’s Tier 2 capital comprises of subordinated debt and collective
impairment losses.
Own funds / Total capital
The own funds of an institution is the sum of its Tier 1 and Tier 2 capital.
Total capital ratio
FCE's Own Funds divided by the end of period Risk Exposure Amount.
CRD IV The 4th iteration of the Capital Requirements Directive formally published in the Official Journal of the EU on 27
June 2013. This is made up of the Capital Requirements Directive (2013/36/EU), (CRD), which must be
implemented through national law, and the Capital Requirements Regulation (575/2013), (CRR), which is directly
applicable to firms across the EU. CRDIV is intended to implement the Basel III agreement in the EU.
CRR The Capital Requirement Regulation, (575/2013) part of CRDIV
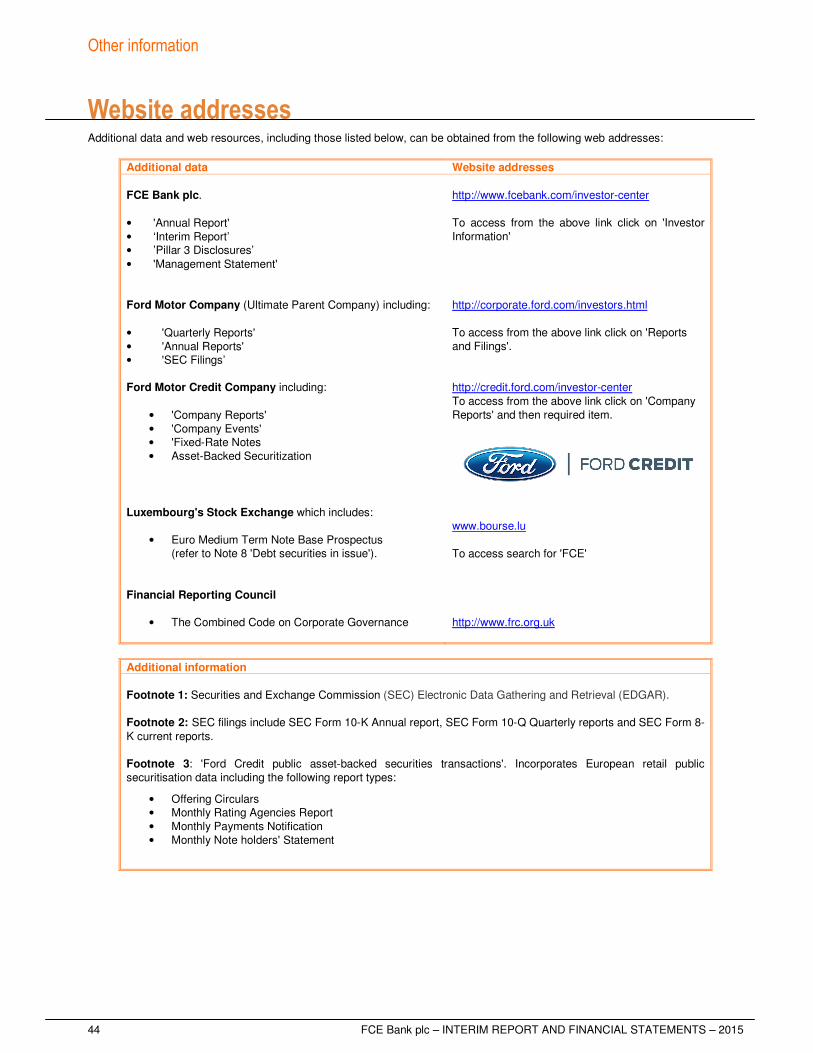
Other information
44 FCE Bank plc – INTERIM REPORT AND FINANCIAL STATEMENTS – 2015
Website addresses Additional data and web resources, including those listed below, can be obtained from the following web addresses:
Additional data Website addresses
FCE Bank plc. • 'Annual Report' • ‘Interim Report’ • ’Pillar 3 Disclosures’ • 'Management Statement'
http://www.fcebank.com/investor-center To access from the above link click on 'Investor Information'
Ford Motor Company (Ultimate Parent Company) including: • 'Quarterly Reports' • 'Annual Reports' • 'SEC Filings’
http://corporate.ford.com/investors.html To access from the above link click on 'Reports and Filings'.
Ford Motor Credit Company including:
• 'Company Reports' • 'Company Events' • 'Fixed-Rate Notes • Asset-Backed Securitization
http://credit.ford.com/investor-center To access from the above link click on 'Company Reports' and then required item.
Luxembourg's Stock Exchange which includes:
• Euro Medium Term Note Base Prospectus (refer to Note 8 'Debt securities in issue').
www.bourse.lu To access search for 'FCE'
Financial Reporting Council
• The Combined Code on Corporate Governance
http://www.frc.org.uk
Additional information
Footnote 1: Securities and Exchange Commission (SEC) Electronic Data Gathering and Retrieval (EDGAR). Footnote 2: SEC filings include SEC Form 10-K Annual report, SEC Form 10-Q Quarterly reports and SEC Form 8-K current reports. Footnote 3: 'Ford Credit public asset-backed securities transactions'. Incorporates European retail public securitisation data including the following report types:
• Offering Circulars • Monthly Rating Agencies Report • Monthly Payments Notification • Monthly Note holders' Statement

FCE Bank plc
Interim Report and
Financial Statements For the half year ended 30 June 2015