Embed Size (px)
Citation preview

Report No.: FD960115L07 1 Report Format Version 2.0.6
FCC DoC TEST REPORT
REPORT NO.: FD960115L07 MODEL NO.: XO-B2 (Refer to item 3.1 for the more details) RECEIVED: Jan. 12, 2007
TESTED: Feb. 09 ~ Oct. 05, 2007 ISSUED: Oct. 08, 2007
APPLICANT: OLPC ADDRESS: 1 Cambridge Center, Cambridge, Massachusetts,
02142 USA
ISSUED BY: Advance Data Technology Corporation LAB ADDRESS: No. 47, 14th Ling, Chia Pau Tsuen, Lin Kou Hsiang
244, Taipei Hsien, Taiwan, R.O.C. TEST LOCATION: No. 19, Hwa Ya 2nd Rd., Wen Hwa Tsuen, Kwei
Shan Hsiang, Taoyuan Hsien 333, Taiwan, R.O.C. This test report consists of 24 pages in total. It may be duplicated completely for legal use with the approval of the applicant. It should not be reproduced except in full, without the written approval of our laboratory. The client should not use it to claim product endorsement by TAF, A2LA or any government agency. The test results in the report only apply to the tested sample.
Report No.: FD960115L07 2 Report Format Version 2.0.6
Table of Contents
1 CERTIFICATION ......................................................................................................... 3 2 SUMMARY OF TEST RESULTS................................................................................. 4
2.1 MEASUREMENT UNCERTAINTY .............................................................................. 4 3 GENERAL INFORMATION.......................................................................................... 5
3.1 GENERAL DESCRIPTION OF EUT............................................................................ 5
3.2 DESCRIPTION OF TEST MODES.............................................................................. 6
3.3 DESCRIPTION OF SUPPORT UNITS........................................................................ 6
3.4 CONFIGURATION OF SYSTEM UNDER TEST......................................................... 7
4 TEST TYPES AND RESULTS ..................................................................................... 8
4.1 CONDUCTED EMISSION MEASUREMENT .............................................................. 8
4.1.1 LIMITS OF CONDUCTED EMISSION MEASUREMENT ........................................... 8
4.1.2 TEST INSTRUMENTS ................................................................................................ 8
4.1.3 TEST PROCEDURES ................................................................................................. 9
4.1.4 DEVIATION FROM TEST STANDARD ....................................................................... 9
4.1.5 TEST SETUP .............................................................................................................. 9
4.1.6 EUT OPERATING CONDITIONS.............................................................................. 10
4.1.7 TEST RESULTS ........................................................................................................ 11
4.2 RADIATED EMISSION MEASUREMENT................................................................. 13
4.2.1 LIMITS OF RADIATED EMISSION MEASUREMENT............................................... 13
4.2.2 TEST INSTRUMENTS .............................................................................................. 14
4.2.3 TEST PROCEDURES ............................................................................................... 15
4.2.4 DEVIATION FROM TEST STANDARD ..................................................................... 15
4.2.5 TEST SETUP ............................................................................................................ 16
4.2.6 EUT OPERATING CONDITIONS.............................................................................. 16
4.2.7 TEST RESULTS ........................................................................................................ 17 5 PHOTOGRAPHS OF THE TEST CONFIGURATION................................................ 21 6 INFORMATION ON THE TESTING LABORATORIES .............................................. 23 7 APPENDIX A –MODIFICATION RECORDERS FOR ENGINEERING CHANGES TO
THE EUT BY THE LAB .......................................................................................... 24
Report No.: FD960115L07 3 Report Format Version 2.0.6
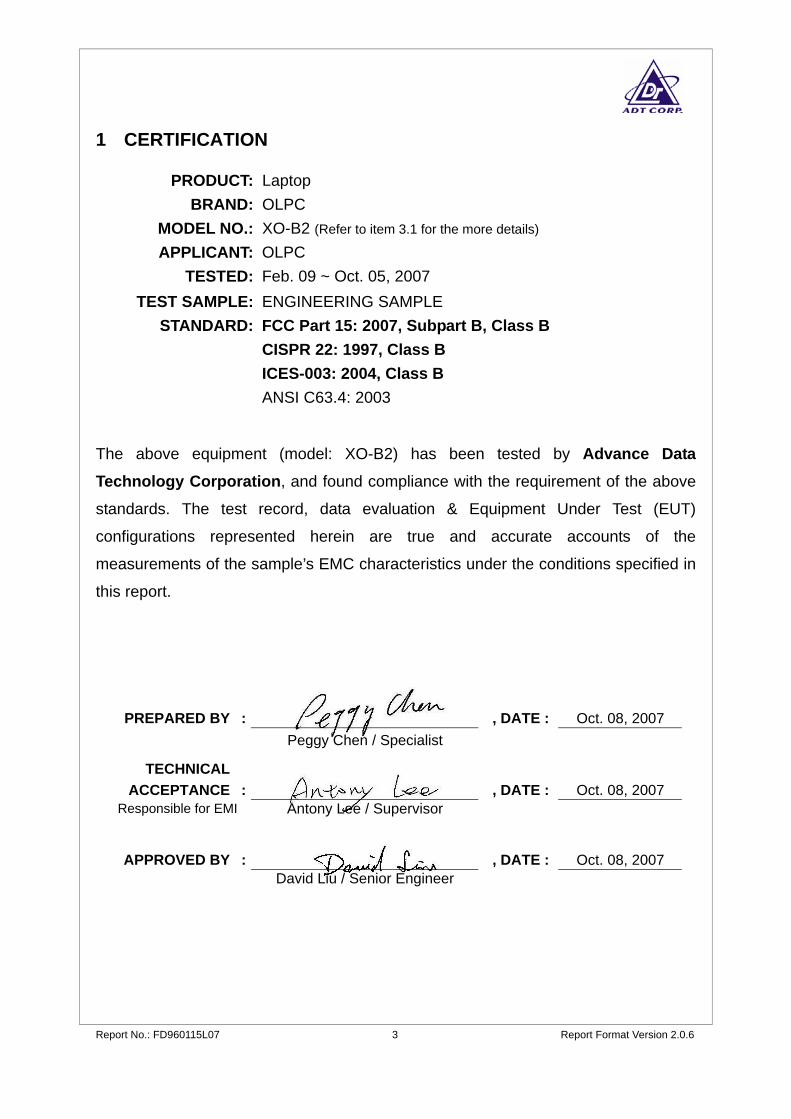
1 CERTIFICATION
PRODUCT: Laptop BRAND: OLPC
MODEL NO.: XO-B2 (Refer to item 3.1 for the more details) APPLICANT: OLPC
TESTED: Feb. 09 ~ Oct. 05, 2007 TEST SAMPLE: ENGINEERING SAMPLE
STANDARD: FCC Part 15: 2007, Subpart B, Class B CISPR 22: 1997, Class B ICES-003: 2004, Class B ANSI C63.4: 2003
The above equipment (model: XO-B2) has been tested by Advance Data Technology Corporation, and found compliance with the requirement of the above
standards. The test record, data evaluation & Equipment Under Test (EUT)
configurations represented herein are true and accurate accounts of the
measurements of the sample’s EMC characteristics under the conditions specified in
this report.
PREPARED BY :
, DATE : Oct. 08, 2007 Peggy Chen / Specialist
TECHNICAL ACCEPTANCE :
, DATE : Oct. 08, 2007 Responsible for EMI Antony Lee / Supervisor
APPROVED BY :
, DATE : Oct. 08, 2007
David Liu / Senior Engineer

Report No.: FD960115L07 4 Report Format Version 2.0.6
2 SUMMARY OF TEST RESULTS The EUT has been tested according to the following specifications.
EMISSION Standard Test Type Result Remarks
Conducted emission test PASS
Meet the requirement of limit.Minimum passing margin is -2.60 dB at 0.544 MHz.
FCC Part 15: 2007, Subpart B, Class B CISPR 22: 1997, Class B ICES-003: 2004, Class B Radiated emission
test PASSMeet the requirement of limit.Minimum passing margin is -2.56 dB at 968.99 MHz.
Note: The limit for radiated test for 30-1000 MHz was performed according to CISPR 22:1997, which was specified in FCC PART 15 Subpart B 15.109(g). Also the limits of ICES-003:2004 and CISPR 22:1997 are same.
2.1 MEASUREMENT UNCERTAINTY Where relevant, the following measurement uncertainty levels have been estimated for tests performed on the EUT as specified in CISPR 16-4-2:
Measurement Frequency Uncertainty Conducted emissions 9kHz ~ 30MHz 2.44 dB
30MHz ~ 200MHz 3.39 dB 200MHz ~1000MHz 3.43 dB Radiated emissions
1GHz ~ 18GHz 2.26 dB This uncertainty represents an expanded uncertainty expressed at approximately the 95% confidence level using a coverage factor of k=2.
Report No.: FD960115L07 5 Report Format Version 2.0.6
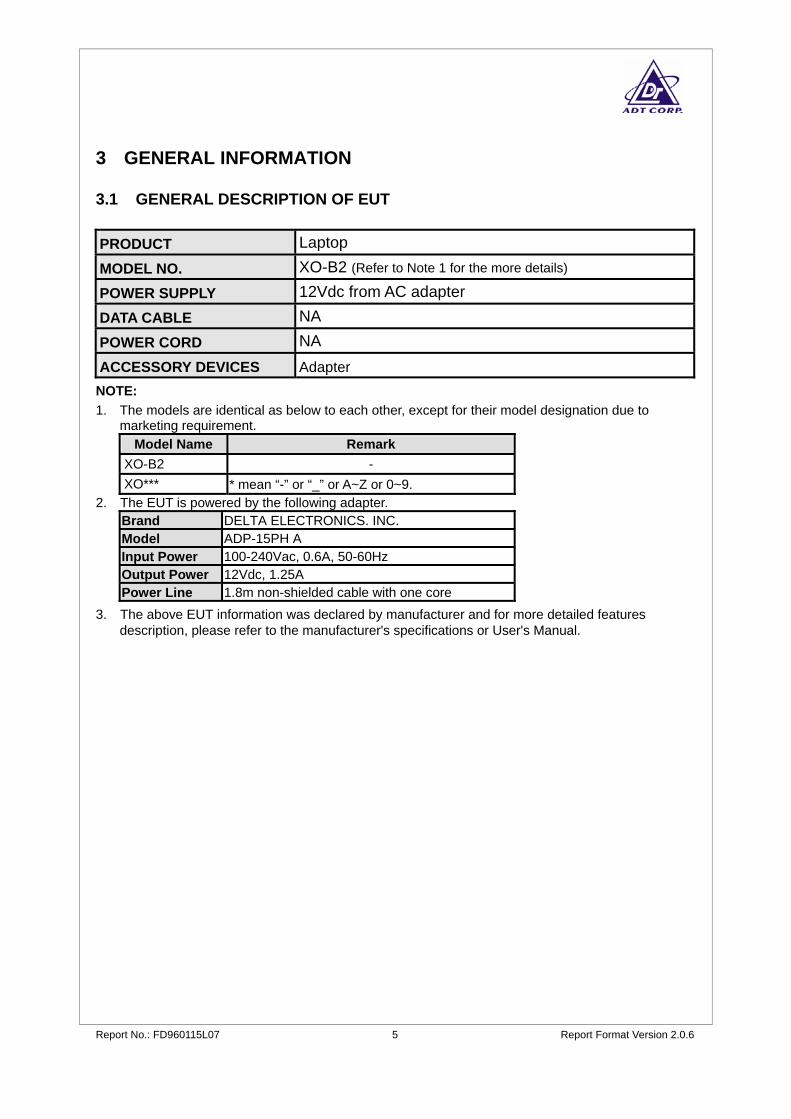
3 GENERAL INFORMATION 3.1 GENERAL DESCRIPTION OF EUT PRODUCT Laptop MODEL NO. XO-B2 (Refer to Note 1 for the more details) POWER SUPPLY 12Vdc from AC adapter DATA CABLE NA POWER CORD NA ACCESSORY DEVICES Adapter
NOTE: 1. The models are identical as below to each other, except for their model designation due to
marketing requirement. Model Name Remark
XO-B2 - XO*** * mean “-” or “_” or A~Z or 0~9.
2. The EUT is powered by the following adapter. Brand DELTA ELECTRONICS. INC. Model ADP-15PH A Input Power 100-240Vac, 0.6A, 50-60Hz Output Power 12Vdc, 1.25A Power Line 1.8m non-shielded cable with one core
3. The above EUT information was declared by manufacturer and for more detailed features description, please refer to the manufacturer's specifications or User's Manual.
Report No.: FD960115L07 6 Report Format Version 2.0.6
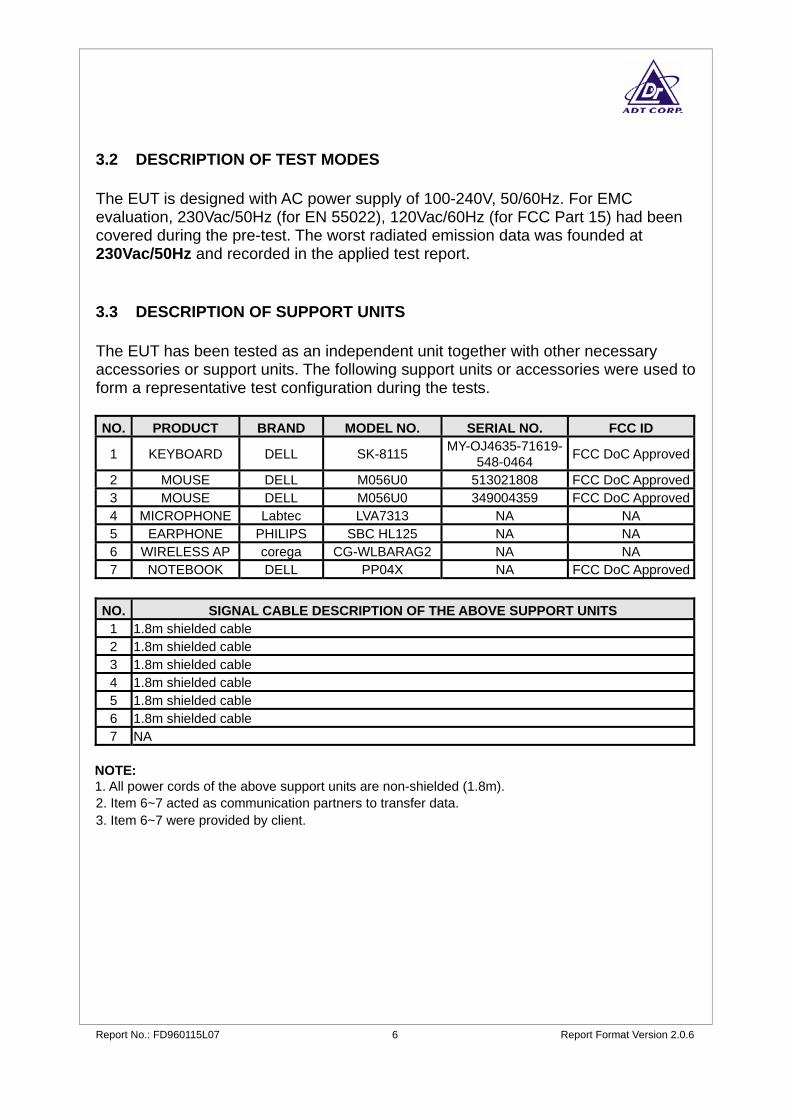
3.2 DESCRIPTION OF TEST MODES The EUT is designed with AC power supply of 100-240V, 50/60Hz. For EMC evaluation, 230Vac/50Hz (for EN 55022), 120Vac/60Hz (for FCC Part 15) had been covered during the pre-test. The worst radiated emission data was founded at 230Vac/50Hz and recorded in the applied test report. 3.3 DESCRIPTION OF SUPPORT UNITS The EUT has been tested as an independent unit together with other necessary accessories or support units. The following support units or accessories were used to form a representative test configuration during the tests. NO. PRODUCT BRAND MODEL NO. SERIAL NO. FCC ID
1 KEYBOARD DELL SK-8115 MY-OJ4635-71619-548-0464 FCC DoC Approved
2 MOUSE DELL M056U0 513021808 FCC DoC Approved3 MOUSE DELL M056U0 349004359 FCC DoC Approved4 MICROPHONE Labtec LVA7313 NA NA 5 EARPHONE PHILIPS SBC HL125 NA NA 6 WIRELESS AP corega CG-WLBARAG2 NA NA 7 NOTEBOOK DELL PP04X NA FCC DoC Approved
NO. SIGNAL CABLE DESCRIPTION OF THE ABOVE SUPPORT UNITS
1 1.8m shielded cable 2 1.8m shielded cable 3 1.8m shielded cable 4 1.8m shielded cable 5 1.8m shielded cable 6 1.8m shielded cable 7 NA
NOTE: 1. All power cords of the above support units are non-shielded (1.8m). 2. Item 6~7 acted as communication partners to transfer data. 3. Item 6~7 were provided by client.
Report No.: FD960115L07 7 Report Format Version 2.0.6
EUT
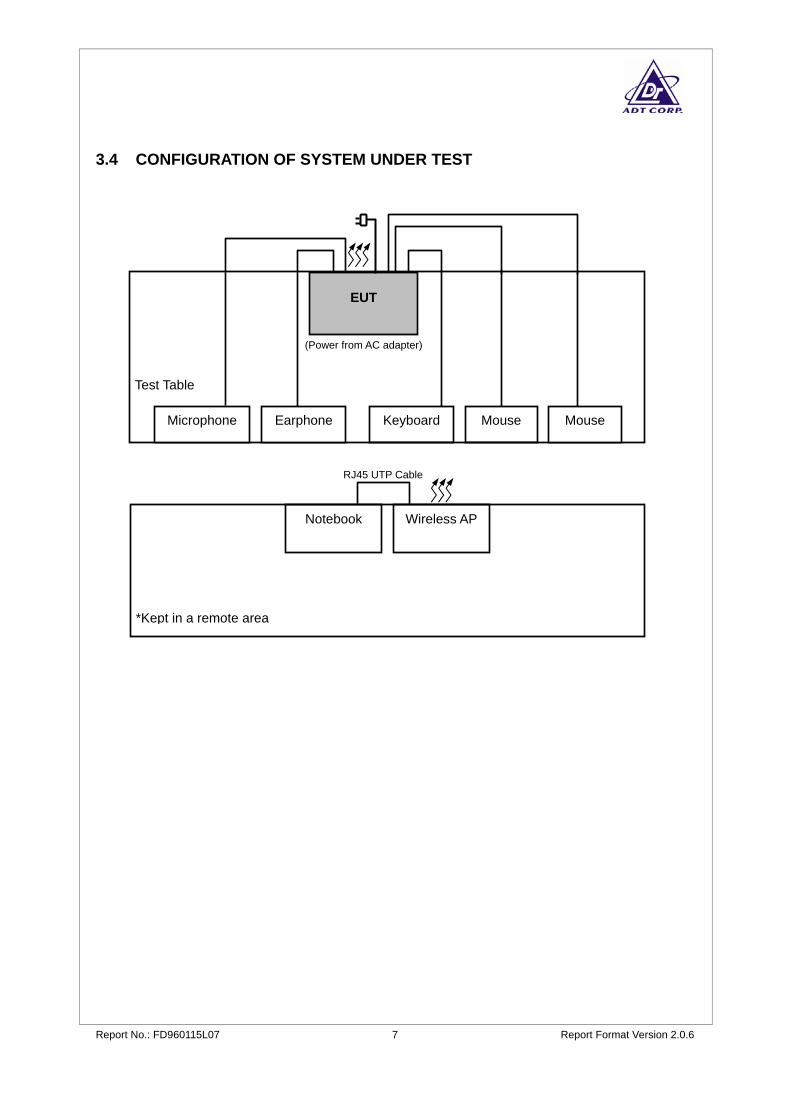
3.4 CONFIGURATION OF SYSTEM UNDER TEST
Test Table
(Power from AC adapter)
Earphone
*Kept in a remote area
Wireless AP
Mouse Keyboard Microphone Mouse
Notebook
RJ45 UTP Cable
Report No.: FD960115L07 8 Report Format Version 2.0.6
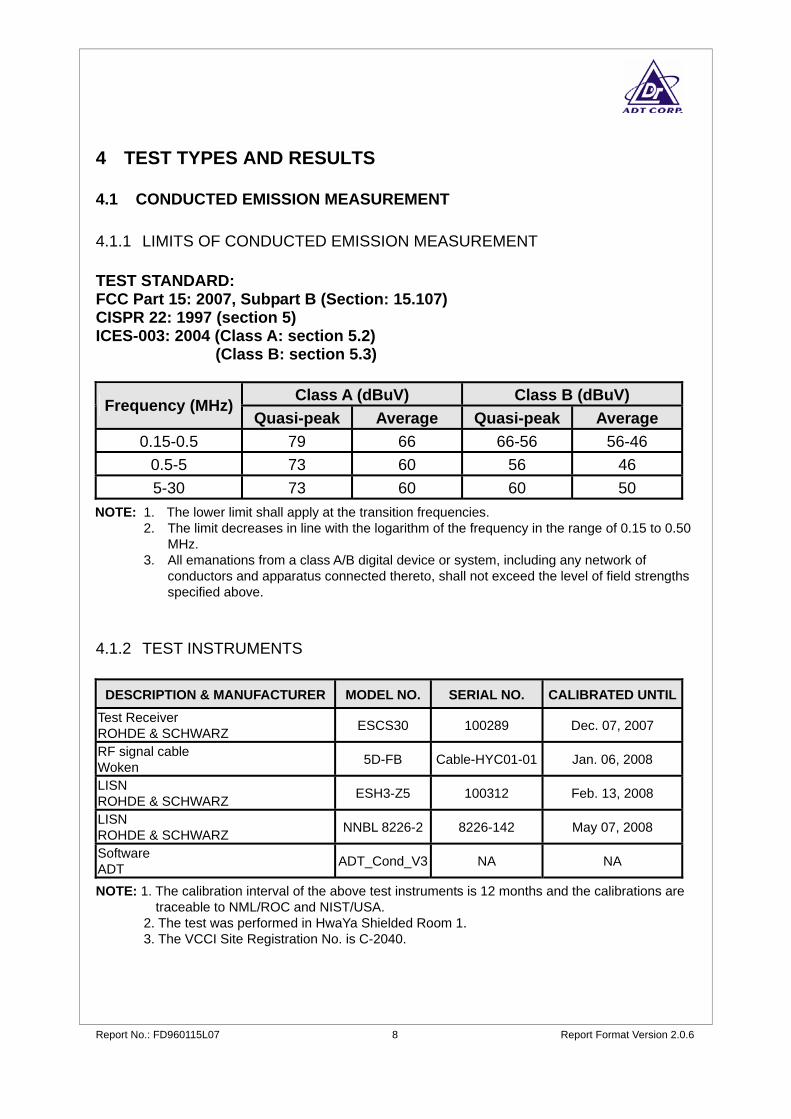
4 TEST TYPES AND RESULTS 4.1 CONDUCTED EMISSION MEASUREMENT 4.1.1 LIMITS OF CONDUCTED EMISSION MEASUREMENT TEST STANDARD: FCC Part 15: 2007, Subpart B (Section: 15.107) CISPR 22: 1997 (section 5) ICES-003: 2004 (Class A: section 5.2)
(Class B: section 5.3)
Class A (dBuV) Class B (dBuV) Frequency (MHz)Quasi-peak Average Quasi-peak Average
0.15-0.5 79 66 66-56 56-46 0.5-5 73 60 56 46 5-30 73 60 60 50
NOTE: 1. The lower limit shall apply at the transition frequencies. 2. The limit decreases in line with the logarithm of the frequency in the range of 0.15 to 0.50
MHz. 3. All emanations from a class A/B digital device or system, including any network of
conductors and apparatus connected thereto, shall not exceed the level of field strengths specified above.
4.1.2 TEST INSTRUMENTS
DESCRIPTION & MANUFACTURER MODEL NO. SERIAL NO. CALIBRATED UNTILTest Receiver ROHDE & SCHWARZ ESCS30 100289 Dec. 07, 2007
RF signal cable Woken 5D-FB Cable-HYC01-01 Jan. 06, 2008
LISN ROHDE & SCHWARZ ESH3-Z5 100312 Feb. 13, 2008
LISN ROHDE & SCHWARZ NNBL 8226-2 8226-142 May 07, 2008
Software ADT ADT_Cond_V3 NA NA
NOTE: 1. The calibration interval of the above test instruments is 12 months and the calibrations are traceable to NML/ROC and NIST/USA.
2. The test was performed in HwaYa Shielded Room 1. 3. The VCCI Site Registration No. is C-2040.
Report No.: FD960115L07 9 Report Format Version 2.0.6
4.1.3 TEST PROCEDURES The basic test procedure was in accordance with ANSI C63.4: 2003 (section 7), CISPR 22 (section 9) and ICES-003:2004 (section 4). a. The EUT was placed 0.4 meters from the conducting wall of the shielded room
with EUT being connected to the power mains through a line impedance stabilization network (LISN). Other support units were connected to the power mains through another LISN. The two LISNs provide 50 ohm/ 50uH of coupling impedance for the measuring instrument.
b. Both lines of the power mains connected to the EUT were checked for maximum conducted interference.
c. The frequency range from 150kHz to 30MHz was searched. Emission levels under Limit - 20dB was not recorded.
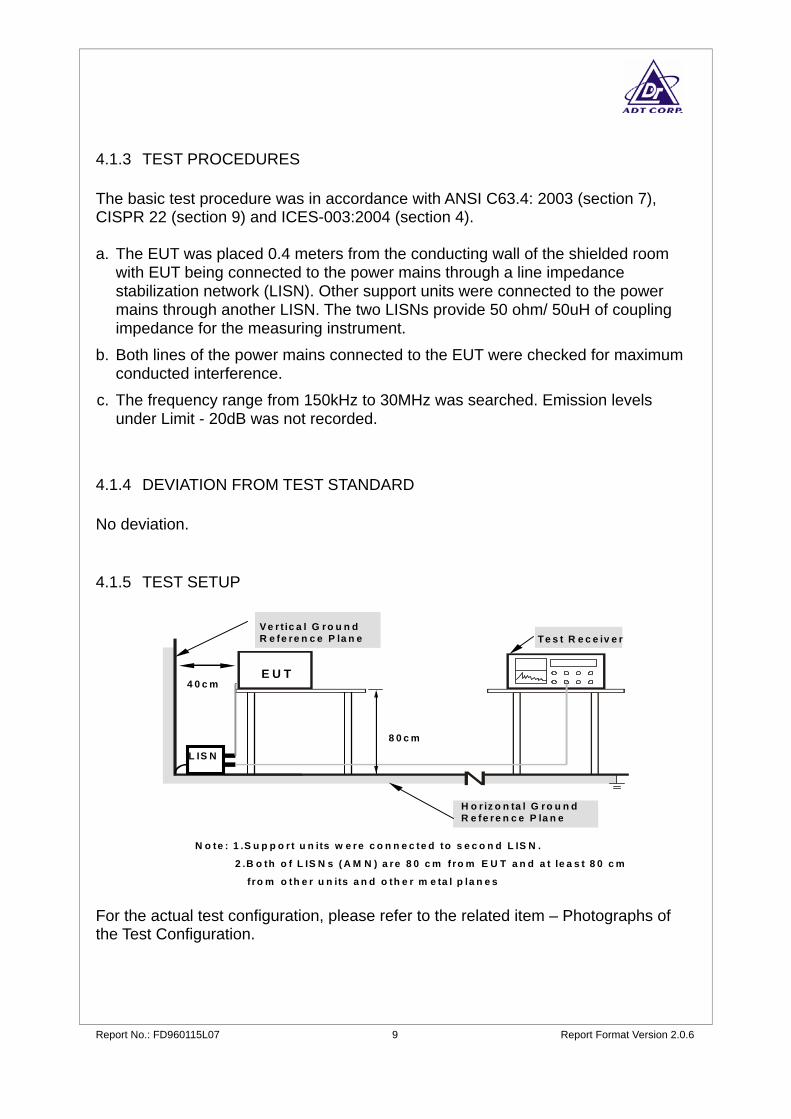
4.1.4 DEVIATION FROM TEST STANDARD No deviation. 4.1.5 TEST SETUP
N o te : 1 .S u p p o r t u n its w e re c o n n e c te d to s e c o n d L IS N .
2 .B o th o f L IS N s ( A M N ) a re 8 0 c m f ro m E U T a n d a t le a s t 8 0 c m
f ro m o th e r u n its a n d o th e r m e ta l p la n e s
4 0 c m
8 0 c m
Te s t R e c e iv e r
H o r iz o n ta l G ro u n dR e fe re n c e P la n e
E U T
L IS N
V e r t ic a l G ro u n dR e fe re n c e P la n e
For the actual test configuration, please refer to the related item – Photographs of the Test Configuration.
Report No.: FD960115L07 10 Report Format Version 2.0.6
4.1.6 EUT OPERATING CONDITIONS
a. Placed the EUT on the testing table. b. The EUT ran a test program to enable EUT under transmission/receiving
condition continuously at specific channel frequency. c. Prepared a notebook and wireless AP outside of testing area to act as a
communication partner. d. Sent data to EUT by command "PING" from the communication partner.

Report No.: FD960115L07 11 Report Format Version 2.0.6
4.1.7 TEST RESULTS
INPUT POWER (SYSTEM) 120 Vac, 60 Hz 6dB
BANDWIDTH 9 kHz
ENVIRONMENTAL CONDITIONS
24 deg. C, 67% RH, 1006 hPa PHASE Line 1
TESTED BY Ban Hsieh
Reading Value Emission Level Limit Margin Freq. Corr.
Factor [dB (uV)] [dB (uV)] [dB (uV)] (dB) No
[MHz] (dB) Q.P. AV. Q.P. AV. Q.P. AV. Q.P. AV. 1 0.272 0.21 51.00 46.35 51.21 46.56 61.04 51.04 -9.83 -4.48 2 0.545 0.22 47.41 42.44 47.63 42.66 56.00 46.00 -8.37 -3.34 3 0.688 0.22 49.80 40.30 50.02 40.52 56.00 46.00 -5.98 -5.48 4 0.823 0.23 48.15 39.90 48.38 40.13 56.00 46.00 -7.62 -5.87 5 0.959 0.24 45.86 38.09 46.10 38.33 56.00 46.00 -9.90 -7.67 6 1.081 0.24 46.67 41.15 46.91 41.39 56.00 46.00 -9.09 -4.61 7 1.229 0.24 47.48 40.43 47.72 40.67 56.00 46.00 -8.28 -5.33 8 2.153 0.27 46.73 40.06 47.00 40.33 56.00 46.00 -9.00 -5.67 9 2.934 0.32 42.33 - 42.65 - 56.00 46.00 -13.35 - 10 3.563 0.36 41.28 - 41.64 - 56.00 46.00 -14.36 - 11 4.617 0.41 38.75 - 39.16 - 56.00 46.00 -16.84 -
REMARKS: 1. Q.P. and AV. are abbreviations of quasi-peak and average individually. 2. "-": The Quasi-peak reading value also meets average limit and measurement with the average detector is unnecessary. 3. The emission levels of other frequencies were very low against the limit. 4. Margin value = Emission level - Limit value 5. Correction factor = Insertion loss + Cable loss 6. Emission Level = Correction Factor + Reading Value.
Report No.: FD960115L07 12 Report Format Version 2.0.6
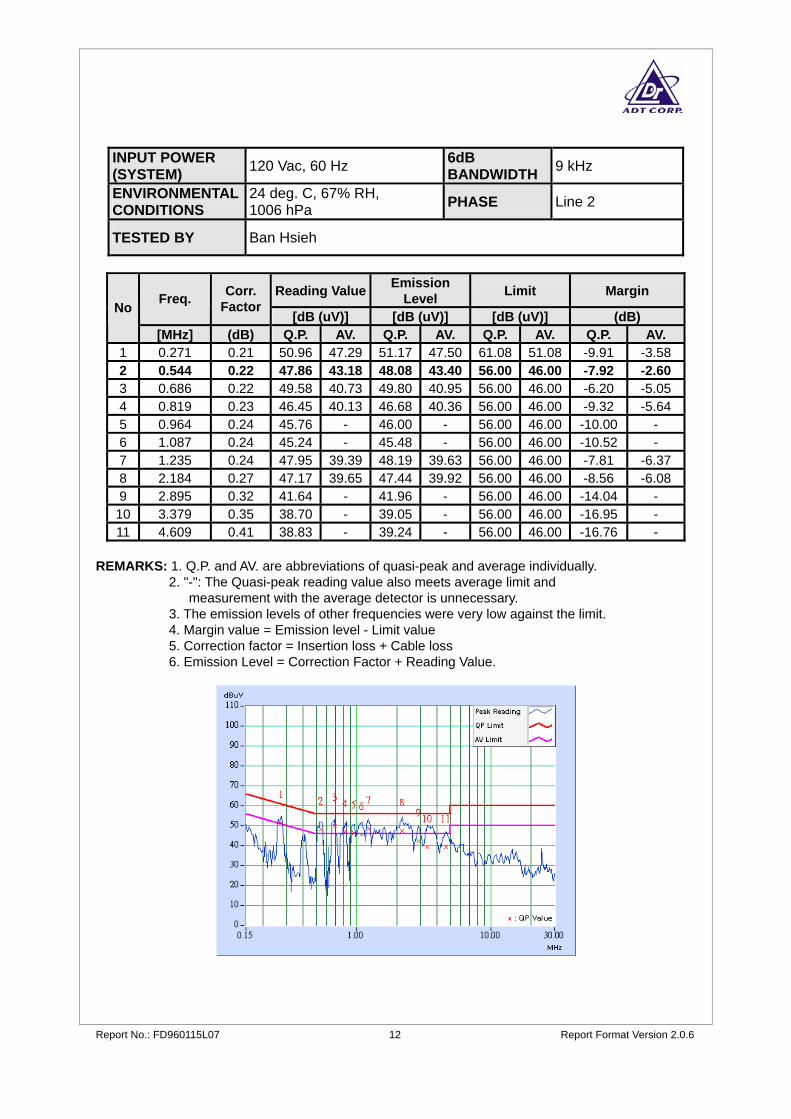
INPUT POWER (SYSTEM) 120 Vac, 60 Hz 6dB
BANDWIDTH 9 kHz
ENVIRONMENTAL CONDITIONS
24 deg. C, 67% RH, 1006 hPa PHASE Line 2
TESTED BY Ban Hsieh
Reading Value Emission Level Limit Margin Freq. Corr.
Factor [dB (uV)] [dB (uV)] [dB (uV)] (dB) No
[MHz] (dB) Q.P. AV. Q.P. AV. Q.P. AV. Q.P. AV. 1 0.271 0.21 50.96 47.29 51.17 47.50 61.08 51.08 -9.91 -3.58 2 0.544 0.22 47.86 43.18 48.08 43.40 56.00 46.00 -7.92 -2.60 3 0.686 0.22 49.58 40.73 49.80 40.95 56.00 46.00 -6.20 -5.05 4 0.819 0.23 46.45 40.13 46.68 40.36 56.00 46.00 -9.32 -5.64 5 0.964 0.24 45.76 - 46.00 - 56.00 46.00 -10.00 - 6 1.087 0.24 45.24 - 45.48 - 56.00 46.00 -10.52 - 7 1.235 0.24 47.95 39.39 48.19 39.63 56.00 46.00 -7.81 -6.37 8 2.184 0.27 47.17 39.65 47.44 39.92 56.00 46.00 -8.56 -6.08 9 2.895 0.32 41.64 - 41.96 - 56.00 46.00 -14.04 - 10 3.379 0.35 38.70 - 39.05 - 56.00 46.00 -16.95 - 11 4.609 0.41 38.83 - 39.24 - 56.00 46.00 -16.76 -
REMARKS: 1. Q.P. and AV. are abbreviations of quasi-peak and average individually. 2. "-": The Quasi-peak reading value also meets average limit and measurement with the average detector is unnecessary. 3. The emission levels of other frequencies were very low against the limit. 4. Margin value = Emission level - Limit value 5. Correction factor = Insertion loss + Cable loss 6. Emission Level = Correction Factor + Reading Value.
Report No.: FD960115L07 13 Report Format Version 2.0.6
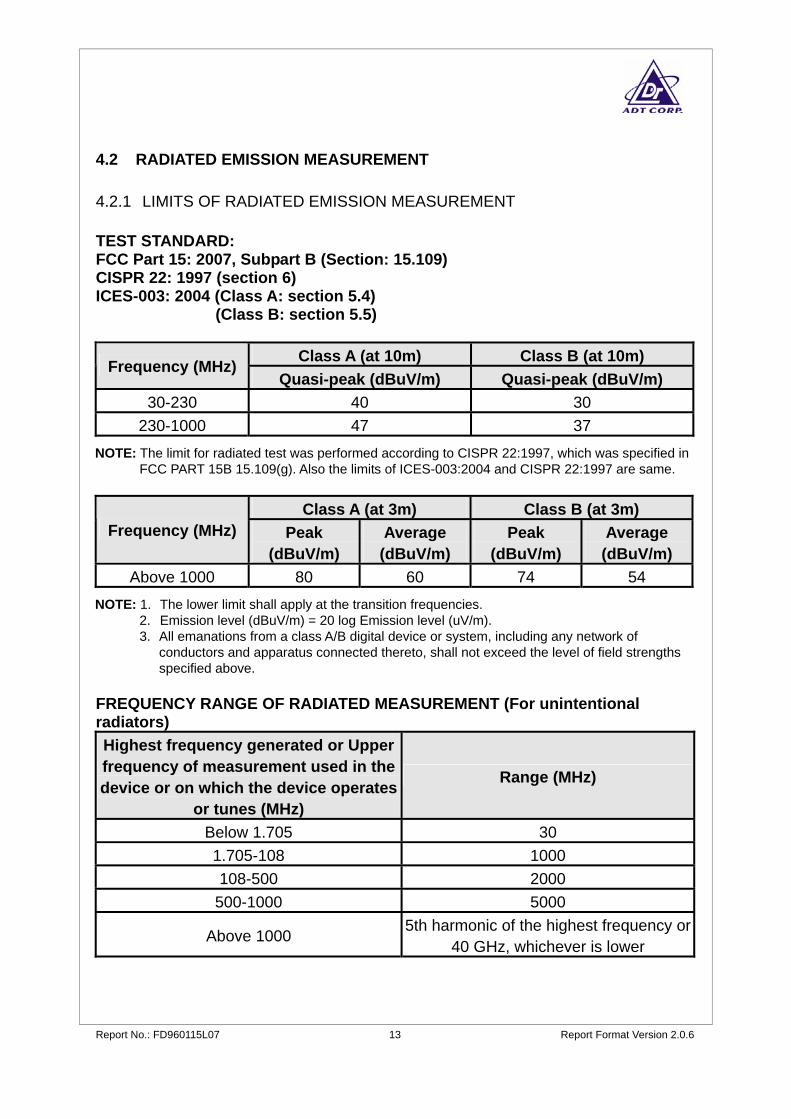
4.2 RADIATED EMISSION MEASUREMENT 4.2.1 LIMITS OF RADIATED EMISSION MEASUREMENT TEST STANDARD: FCC Part 15: 2007, Subpart B (Section: 15.109) CISPR 22: 1997 (section 6) ICES-003: 2004 (Class A: section 5.4)
(Class B: section 5.5)
Class A (at 10m) Class B (at 10m) Frequency (MHz)Quasi-peak (dBuV/m) Quasi-peak (dBuV/m)
30-230 40 30 230-1000 47 37
NOTE: The limit for radiated test was performed according to CISPR 22:1997, which was specified in FCC PART 15B 15.109(g). Also the limits of ICES-003:2004 and CISPR 22:1997 are same.
Class A (at 3m) Class B (at 3m)
Frequency (MHz) Peak (dBuV/m)
Average (dBuV/m)
Peak (dBuV/m)
Average (dBuV/m)
Above 1000 80 60 74 54 NOTE: 1. The lower limit shall apply at the transition frequencies.
2. Emission level (dBuV/m) = 20 log Emission level (uV/m). 3. All emanations from a class A/B digital device or system, including any network of
conductors and apparatus connected thereto, shall not exceed the level of field strengths specified above.
FREQUENCY RANGE OF RADIATED MEASUREMENT (For unintentional radiators) Highest frequency generated or Upper frequency of measurement used in the device or on which the device operates
or tunes (MHz)
Range (MHz)
Below 1.705 30 1.705-108 1000 108-500 2000
500-1000 5000
Above 1000 5th harmonic of the highest frequency or 40 GHz, whichever is lower
Report No.: FD960115L07 14 Report Format Version 2.0.6
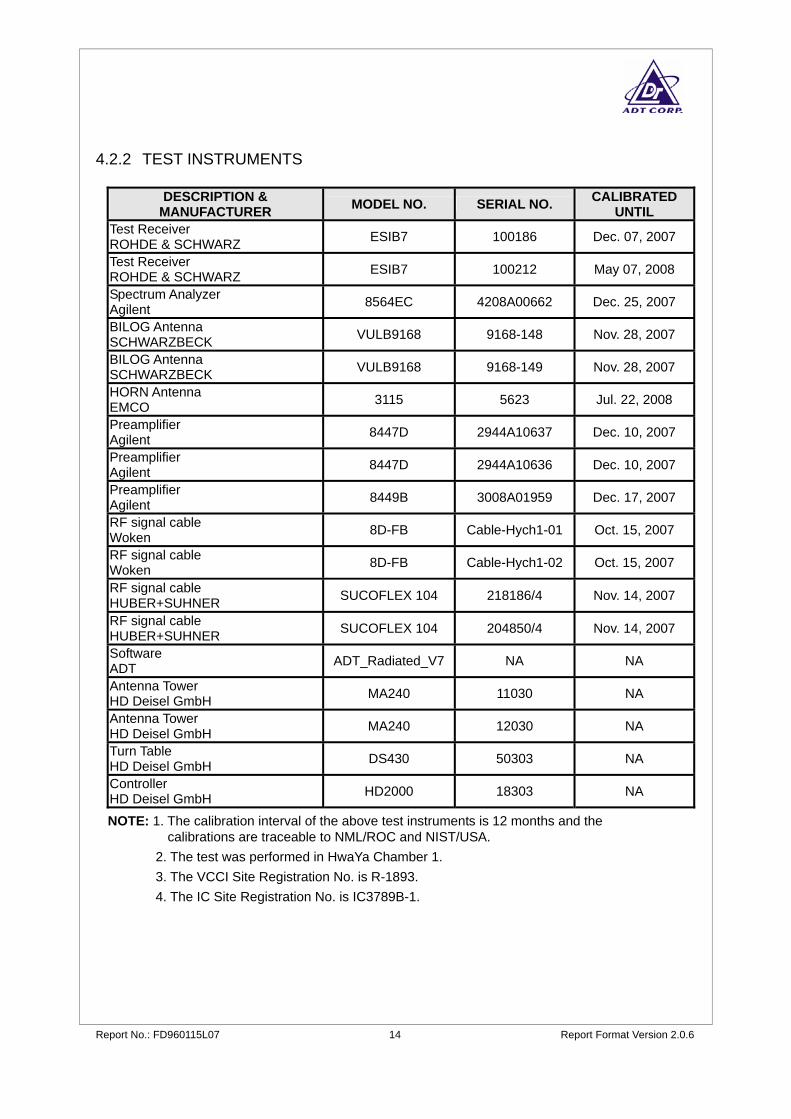
4.2.2 TEST INSTRUMENTS
DESCRIPTION & MANUFACTURER MODEL NO. SERIAL NO. CALIBRATED
UNTIL Test Receiver ROHDE & SCHWARZ ESIB7 100186 Dec. 07, 2007
Test Receiver ROHDE & SCHWARZ ESIB7 100212 May 07, 2008
Spectrum Analyzer Agilent 8564EC 4208A00662 Dec. 25, 2007
BILOG Antenna SCHWARZBECK VULB9168 9168-148 Nov. 28, 2007
BILOG Antenna SCHWARZBECK VULB9168 9168-149 Nov. 28, 2007
HORN Antenna EMCO 3115 5623 Jul. 22, 2008
Preamplifier Agilent 8447D 2944A10637 Dec. 10, 2007
Preamplifier Agilent 8447D 2944A10636 Dec. 10, 2007
Preamplifier Agilent 8449B 3008A01959 Dec. 17, 2007
RF signal cable Woken 8D-FB Cable-Hych1-01 Oct. 15, 2007
RF signal cable Woken 8D-FB Cable-Hych1-02 Oct. 15, 2007
RF signal cable HUBER+SUHNER SUCOFLEX 104 218186/4 Nov. 14, 2007
RF signal cable HUBER+SUHNER SUCOFLEX 104 204850/4 Nov. 14, 2007
Software ADT ADT_Radiated_V7 NA NA
Antenna Tower HD Deisel GmbH MA240 11030 NA
Antenna Tower HD Deisel GmbH MA240 12030 NA
Turn Table HD Deisel GmbH DS430 50303 NA
Controller HD Deisel GmbH HD2000 18303 NA
NOTE: 1. The calibration interval of the above test instruments is 12 months and the calibrations are traceable to NML/ROC and NIST/USA.
2. The test was performed in HwaYa Chamber 1. 3. The VCCI Site Registration No. is R-1893. 4. The IC Site Registration No. is IC3789B-1.
Report No.: FD960115L07 15 Report Format Version 2.0.6
4.2.3 TEST PROCEDURES The basic test procedure was in accordance with ANSI C63.4-2003 (section 8), CISPR 22 (section 10) and ICES-003: 2004 (section 4). a. The EUT was placed on the top of a rotating table 0.8 meters above the ground
at a 10 meters semi-anechoic chamber. The table was rotated 360 degrees to determine the position of the highest radiation.
b. The EUT was set 10 / 3 meters away from the interference-receiving antenna, which was mounted on the top of a variable-height antenna tower.
c. The antenna is a broadband antenna, and its height is varied from one meter to four meters above the ground to determine the maximum value of the field strength. Both horizontal and vertical polarizations of the antenna are set to make the measurement.
d. For each suspected emission, the EUT was arranged to its worst case and then the antenna was tuned to heights from 1 meter to 4 meters and the rotatable table was turned from 0 degrees to 360 degrees to find the maximum reading.
e. The test-receiver system was set to quasi-peak detect function and specified bandwidth with maximum hold mode when the test frequency is below 1 GHz.
NOTE: The resolution bandwidth and video bandwidth of test receiver/spectrum analyzer is 120 kHz for quasi-peak detection (QP) at frequency below 1 GHz.
4.2.4 DEVIATION FROM TEST STANDARD No deviation.
Report No.: FD960115L07 16 Report Format Version 2.0.6
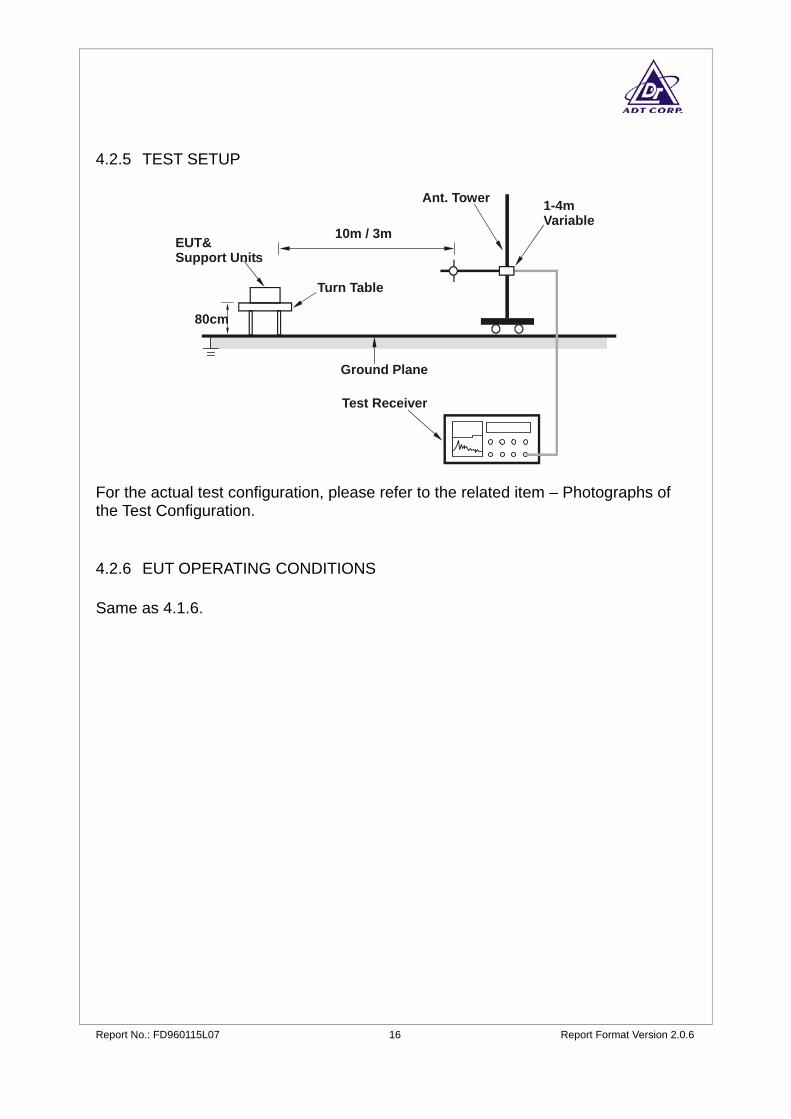
4.2.5 TEST SETUP
For the actual test configuration, please refer to the related item – Photographs of the Test Configuration. 4.2.6 EUT OPERATING CONDITIONS Same as 4.1.6.
10m / 3m
Ant. Tower 1-4m Variable
Turn Table
EUT& Support Units
Ground Plane
Test Receiver
80cm
Report No.: FD960115L07 17 Report Format Version 2.0.6
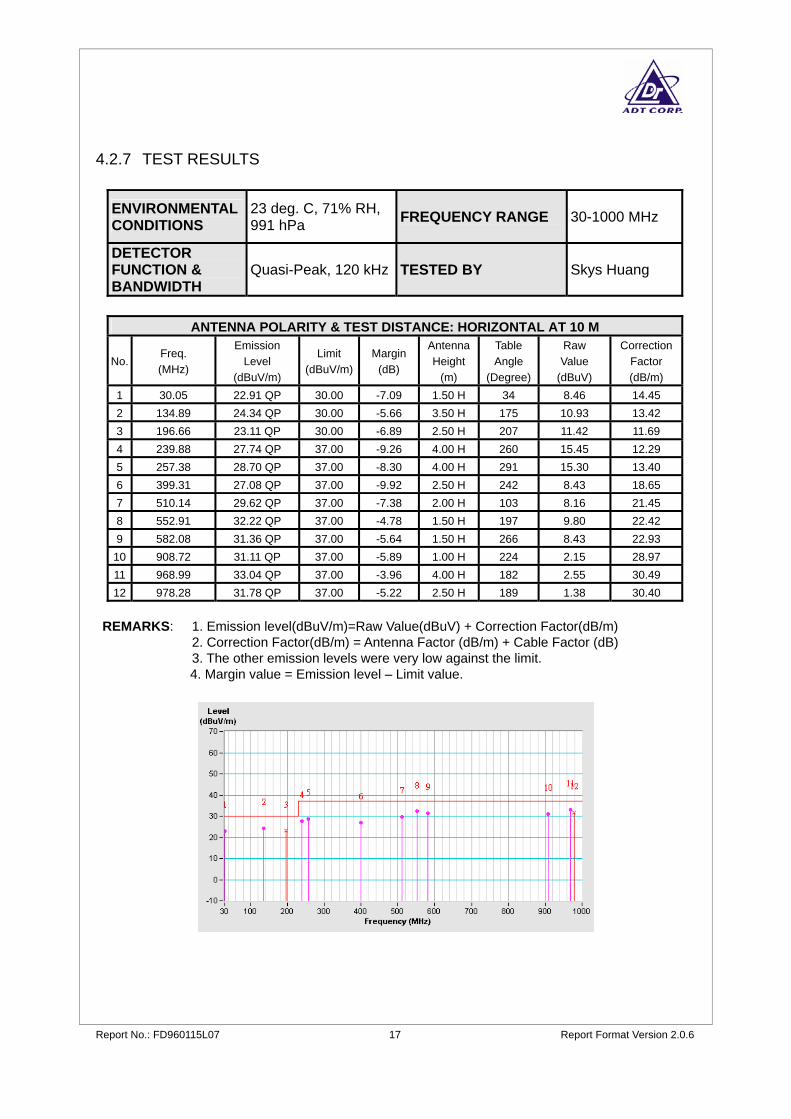
4.2.7 TEST RESULTS
ENVIRONMENTAL CONDITIONS
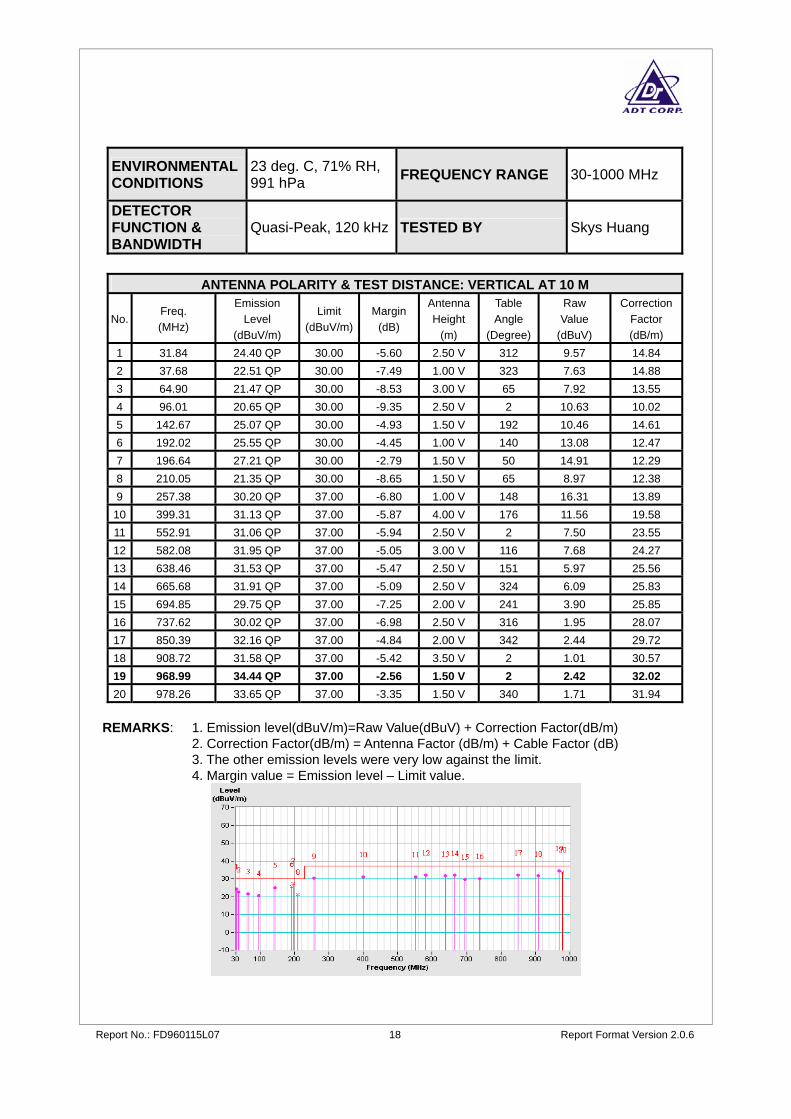
23 deg. C, 71% RH, 991 hPa FREQUENCY RANGE 30-1000 MHz
DETECTOR FUNCTION & BANDWIDTH
Quasi-Peak, 120 kHz TESTED BY Skys Huang
ANTENNA POLARITY & TEST DISTANCE: HORIZONTAL AT 10 M
No. Freq. (MHz)
Emission Level
(dBuV/m)
Limit (dBuV/m)
Margin(dB)
AntennaHeight
(m)
Table Angle
(Degree)
Raw Value
(dBuV)
CorrectionFactor (dB/m)
1 30.05 22.91 QP 30.00 -7.09 1.50 H 34 8.46 14.45 2 134.89 24.34 QP 30.00 -5.66 3.50 H 175 10.93 13.42 3 196.66 23.11 QP 30.00 -6.89 2.50 H 207 11.42 11.69 4 239.88 27.74 QP 37.00 -9.26 4.00 H 260 15.45 12.29 5 257.38 28.70 QP 37.00 -8.30 4.00 H 291 15.30 13.40 6 399.31 27.08 QP 37.00 -9.92 2.50 H 242 8.43 18.65 7 510.14 29.62 QP 37.00 -7.38 2.00 H 103 8.16 21.45 8 552.91 32.22 QP 37.00 -4.78 1.50 H 197 9.80 22.42 9 582.08 31.36 QP 37.00 -5.64 1.50 H 266 8.43 22.93
10 908.72 31.11 QP 37.00 -5.89 1.00 H 224 2.15 28.97 11 968.99 33.04 QP 37.00 -3.96 4.00 H 182 2.55 30.49 12 978.28 31.78 QP 37.00 -5.22 2.50 H 189 1.38 30.40
REMARKS: 1. Emission level(dBuV/m)=Raw Value(dBuV) + Correction Factor(dB/m) 2. Correction Factor(dB/m) = Antenna Factor (dB/m) + Cable Factor (dB) 3. The other emission levels were very low against the limit.
4. Margin value = Emission level – Limit value.
Report No.: FD960115L07 18 Report Format Version 2.0.6
ENVIRONMENTAL CONDITIONS
23 deg. C, 71% RH, 991 hPa FREQUENCY RANGE 30-1000 MHz
DETECTOR FUNCTION & BANDWIDTH
Quasi-Peak, 120 kHz TESTED BY Skys Huang
ANTENNA POLARITY & TEST DISTANCE: VERTICAL AT 10 M
No. Freq. (MHz)
Emission Level
(dBuV/m)
Limit (dBuV/m)
Margin(dB)
AntennaHeight
(m)
Table Angle
(Degree)
Raw Value
(dBuV)
CorrectionFactor (dB/m)
1 31.84 24.40 QP 30.00 -5.60 2.50 V 312 9.57 14.84 2 37.68 22.51 QP 30.00 -7.49 1.00 V 323 7.63 14.88 3 64.90 21.47 QP 30.00 -8.53 3.00 V 65 7.92 13.55 4 96.01 20.65 QP 30.00 -9.35 2.50 V 2 10.63 10.02 5 142.67 25.07 QP 30.00 -4.93 1.50 V 192 10.46 14.61 6 192.02 25.55 QP 30.00 -4.45 1.00 V 140 13.08 12.47 7 196.64 27.21 QP 30.00 -2.79 1.50 V 50 14.91 12.29 8 210.05 21.35 QP 30.00 -8.65 1.50 V 65 8.97 12.38 9 257.38 30.20 QP 37.00 -6.80 1.00 V 148 16.31 13.89
10 399.31 31.13 QP 37.00 -5.87 4.00 V 176 11.56 19.58 11 552.91 31.06 QP 37.00 -5.94 2.50 V 2 7.50 23.55 12 582.08 31.95 QP 37.00 -5.05 3.00 V 116 7.68 24.27 13 638.46 31.53 QP 37.00 -5.47 2.50 V 151 5.97 25.56 14 665.68 31.91 QP 37.00 -5.09 2.50 V 324 6.09 25.83 15 694.85 29.75 QP 37.00 -7.25 2.00 V 241 3.90 25.85 16 737.62 30.02 QP 37.00 -6.98 2.50 V 316 1.95 28.07 17 850.39 32.16 QP 37.00 -4.84 2.00 V 342 2.44 29.72 18 908.72 31.58 QP 37.00 -5.42 3.50 V 2 1.01 30.57 19 968.99 34.44 QP 37.00 -2.56 1.50 V 2 2.42 32.02 20 978.26 33.65 QP 37.00 -3.35 1.50 V 340 1.71 31.94
REMARKS: 1. Emission level(dBuV/m)=Raw Value(dBuV) + Correction Factor(dB/m) 2. Correction Factor(dB/m) = Antenna Factor (dB/m) + Cable Factor (dB) 3. The other emission levels were very low against the limit.
4. Margin value = Emission level – Limit value.
Report No.: FD960115L07 19 Report Format Version 2.0.6
ENVIRONMENTAL CONDITIONS
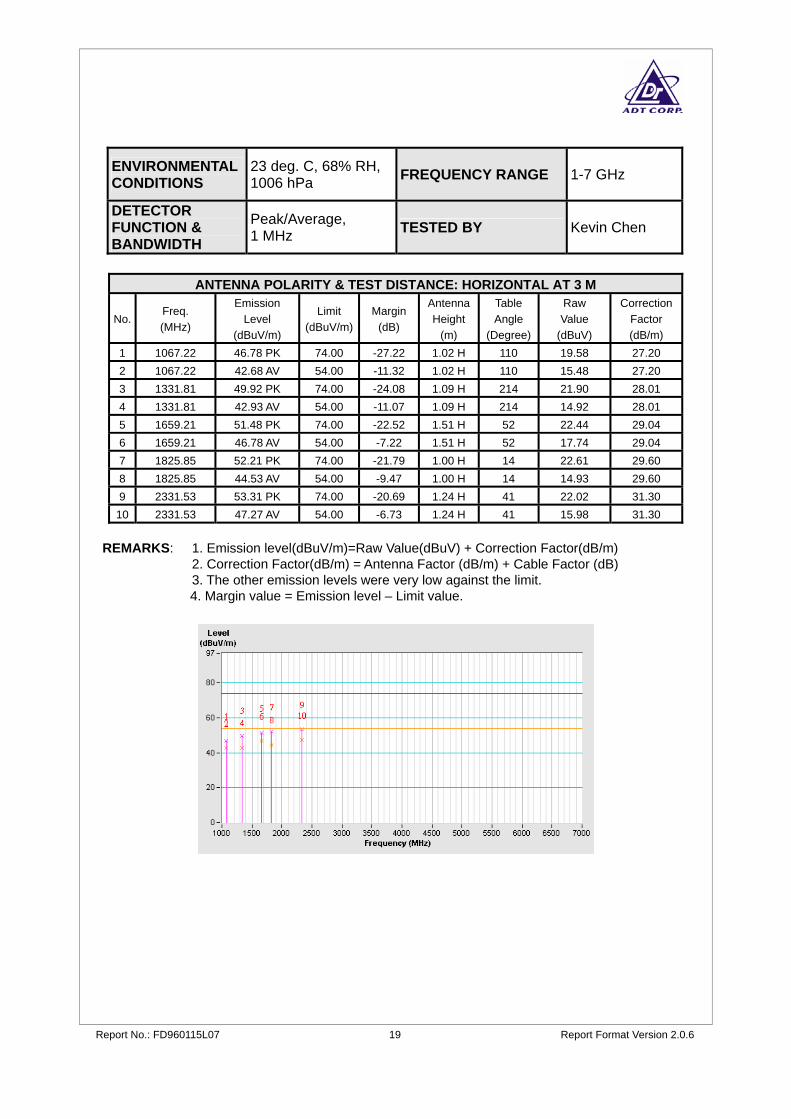
23 deg. C, 68% RH, 1006 hPa FREQUENCY RANGE 1-7 GHz
DETECTOR FUNCTION & BANDWIDTH
Peak/Average, 1 MHz TESTED BY Kevin Chen
ANTENNA POLARITY & TEST DISTANCE: HORIZONTAL AT 3 M
No. Freq. (MHz)
Emission Level
(dBuV/m)
Limit (dBuV/m)
Margin(dB)
AntennaHeight
(m)
Table Angle
(Degree)
Raw Value
(dBuV)
CorrectionFactor (dB/m)
1 1067.22 46.78 PK 74.00 -27.22 1.02 H 110 19.58 27.20 2 1067.22 42.68 AV 54.00 -11.32 1.02 H 110 15.48 27.20 3 1331.81 49.92 PK 74.00 -24.08 1.09 H 214 21.90 28.01 4 1331.81 42.93 AV 54.00 -11.07 1.09 H 214 14.92 28.01 5 1659.21 51.48 PK 74.00 -22.52 1.51 H 52 22.44 29.04 6 1659.21 46.78 AV 54.00 -7.22 1.51 H 52 17.74 29.04 7 1825.85 52.21 PK 74.00 -21.79 1.00 H 14 22.61 29.60 8 1825.85 44.53 AV 54.00 -9.47 1.00 H 14 14.93 29.60 9 2331.53 53.31 PK 74.00 -20.69 1.24 H 41 22.02 31.30
10 2331.53 47.27 AV 54.00 -6.73 1.24 H 41 15.98 31.30 REMARKS: 1. Emission level(dBuV/m)=Raw Value(dBuV) + Correction Factor(dB/m) 2. Correction Factor(dB/m) = Antenna Factor (dB/m) + Cable Factor (dB) 3. The other emission levels were very low against the limit.
4. Margin value = Emission level – Limit value.
Report No.: FD960115L07 20 Report Format Version 2.0.6
ENVIRONMENTAL CONDITIONS
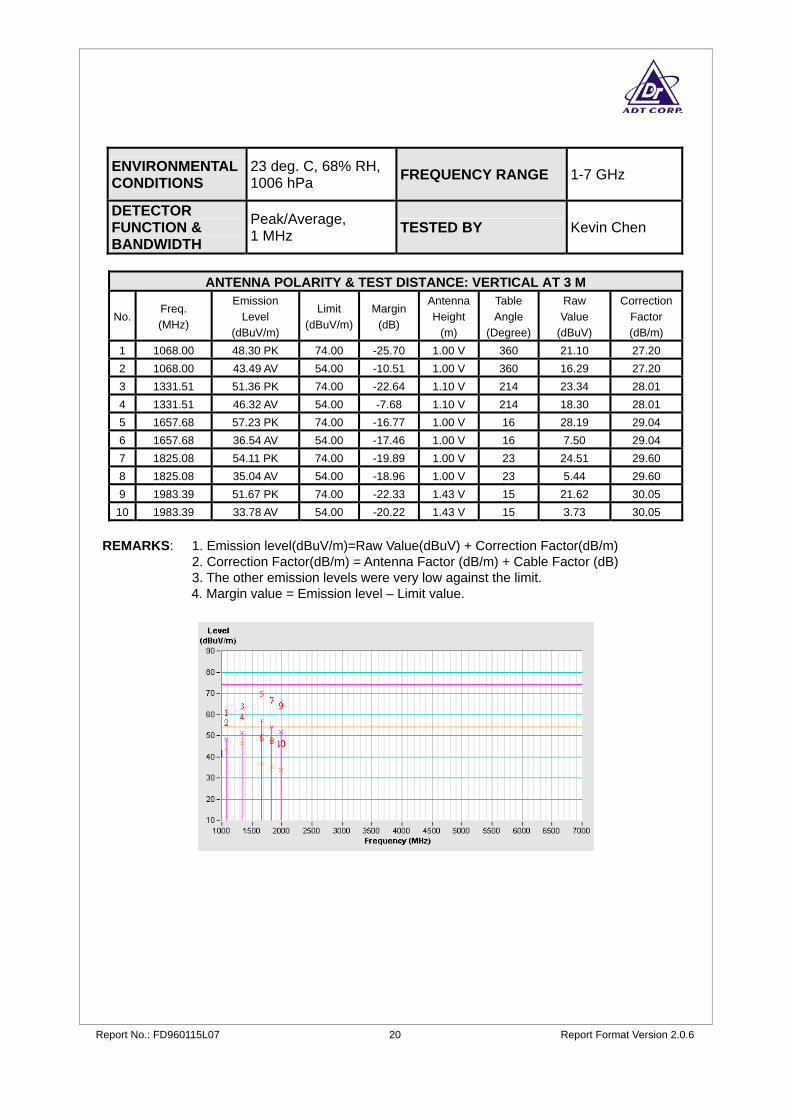
23 deg. C, 68% RH, 1006 hPa FREQUENCY RANGE 1-7 GHz
DETECTOR FUNCTION & BANDWIDTH
Peak/Average, 1 MHz TESTED BY Kevin Chen
ANTENNA POLARITY & TEST DISTANCE: VERTICAL AT 3 M
No. Freq. (MHz)
Emission Level
(dBuV/m)
Limit (dBuV/m)
Margin(dB)
AntennaHeight
(m)
Table Angle
(Degree)
Raw Value
(dBuV)
CorrectionFactor (dB/m)
1 1068.00 48.30 PK 74.00 -25.70 1.00 V 360 21.10 27.20 2 1068.00 43.49 AV 54.00 -10.51 1.00 V 360 16.29 27.20 3 1331.51 51.36 PK 74.00 -22.64 1.10 V 214 23.34 28.01 4 1331.51 46.32 AV 54.00 -7.68 1.10 V 214 18.30 28.01 5 1657.68 57.23 PK 74.00 -16.77 1.00 V 16 28.19 29.04 6 1657.68 36.54 AV 54.00 -17.46 1.00 V 16 7.50 29.04 7 1825.08 54.11 PK 74.00 -19.89 1.00 V 23 24.51 29.60 8 1825.08 35.04 AV 54.00 -18.96 1.00 V 23 5.44 29.60 9 1983.39 51.67 PK 74.00 -22.33 1.43 V 15 21.62 30.05
10 1983.39 33.78 AV 54.00 -20.22 1.43 V 15 3.73 30.05 REMARKS: 1. Emission level(dBuV/m)=Raw Value(dBuV) + Correction Factor(dB/m) 2. Correction Factor(dB/m) = Antenna Factor (dB/m) + Cable Factor (dB) 3. The other emission levels were very low against the limit.
4. Margin value = Emission level – Limit value.
Report No.: FD960115L07 21 Report Format Version 2.0.6
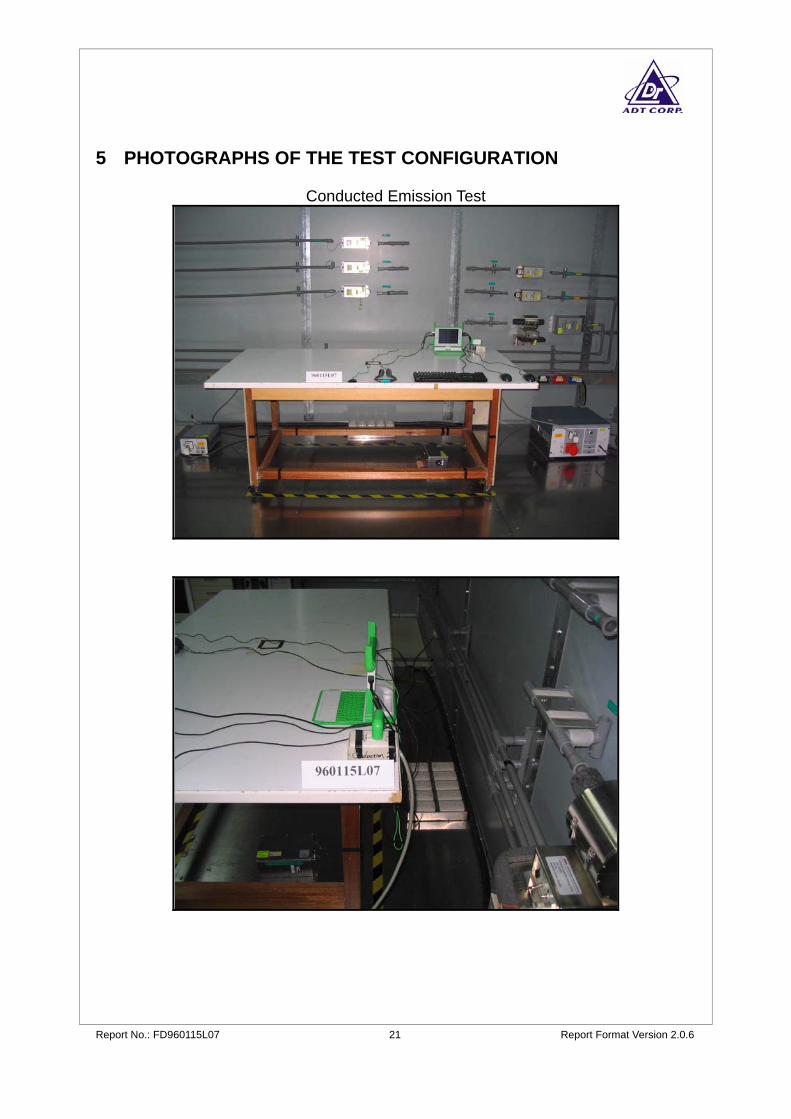
5 PHOTOGRAPHS OF THE TEST CONFIGURATION
Conducted Emission Test

Report No.: FD960115L07 22 Report Format Version 2.0.6
Radiated Emission Test
Report No.: FD960115L07 23 Report Format Version 2.0.6
6 INFORMATION ON THE TESTING LABORATORIES We, ADT Corp., were founded in 1988 to provide our best service in EMC, Radio, Telecom and Safety consultation. Our laboratories are accredited and approved by the following approval agencies according to ISO/IEC 17025: USA FCC, UL, A2LA Germany TUV Rheinland Japan VCCI Norway NEMKO Canada INDUSTRY CANADA, CSA R.O.C. TAF, BSMI, NCC Netherlands Telefication Singapore GOST-ASIA(MOU) Russia CERTIS(MOU) Copies of accreditation certificates of our laboratories obtained from approval agencies can be downloaded from our web site: www.adt.com.tw/index.5/phtml. If you have any comments, please feel free to contact us at the following: Linko EMC/RF Lab Tel: 886-2-26052180 Fax: 886-2-26051924
Hsin Chu EMC/RF Lab Tel: 886-3-5935343 Fax: 886-3-5935342
Hwa Ya EMC/RF/Safety/Telecom Lab Tel: 886-3-3183232 Fax: 886-3-3185050
Web Site: www.adt.com.tw The address and road map of all our labs can be found in our web site also.
Report No.: FD960115L07 24 Report Format Version 2.0.6
7 APPENDIX A –MODIFICATION RECORDERS FOR ENGINEERING
CHANGES TO THE EUT BY THE LAB No any modifications are made to the EUT by the lab during the test.