Embed Size (px)
Citation preview

ASSESS BODY WEIGHT ESTlL\fATION, REPRODUCTIVE
AND NUTRITION OF BUFFALOES AT BA KELALAN.
By
HARRYPUDUNDAWAT
A Thesis Submitted in Partial Fulfilment of the Requirements for the Degree of
Master of Science.
Faculty of Resource Science and Technology UNIVERSITY MALAYSIA SARA W AK
2004

Acknowledgements
I would like to thank the State director of Health Department Sarawak, Dr. Yao
Sik Chi for allowing me to attend this course.
Secondly, I wish to record my sincere thanks to my supervisor, Associate Prof
Dr. Andrew Alek Tuen for his guidance, patience and assistance in producing this
thesis. Without his assistance this could have not been possible.
Thirdly, I would like to thank my dear wife, Madam Alau Buaye for her
understanding, prayer, emotional support and help in editing my work, my son
Martin and daughter Marina in arranging the maps and plates.
Fourthly, my thanks and gratitude to my brother Dennis Tadem, my course mates,
Mr. Peter Luke and Miss Liew for helping me with GPS mapping, and other
course mates who have either directly or indirectly helped or encouraged me in
producing this thesis.
Finally, I would like to thank UNIMAS for giving me the opportunity to pursue
this course at the university.
.. 11

Pusat Khidmat Maklumat Abdemik UNIVERSITI MALAYSIA SARAWAK
·_-_._.......,
TABLE OF CONTENTS
CHAPTER 1 INTRODUCTION
1.1 Objectives of the study 2
CHAPTER 2 LITERATURE REVIEW 4
2.1 Buffalo industry in Malaysia 4
2.1.1 Distribution and population 8
2.1.2 Buffalo farm structure, size, management
and stocking rate 17
2.1.3 Livestock performances 21
2.2 Buffalo nutrition 24
2.2.1 Nutrients requirement 24
2.2.2 Food types and composition 29
CHAPTER 3 ESTIMATION OF BODY WEIGHT 32 .,
3.1 Introduction 32 , "
3.2 Study site 33 '.'
3.3 Materials and methods 33 ;'i
.;
3.4 Data analysis 36 ./
:1• !~3.5 Results and discussion 36
3.5.1 Estimation of body weight using Murtidjo's
Formula 36
CHAPTER 4 PRODUCTION PERFORMANCE AND NUTRITION 40
EVALUATION OF BUFF ALOES IN BA KELALAN
4.1 Introduction 40
4.2 Study site 41
4.3 Materials and methods 46
4.3.1 Sampling sites 46
4.3.2 Field methods 46
4.3.3 Laboratory method 48
III

4.4 Results and Discussion 49
4.4.1 Buffalo management practices 49
4.4.2 Animal performances 50
4.4.2.1 Reproductive performance 50
4.4.2.2 Sex ratio and male fertility 52
4.4.2.3 Mortality 53
4.4.3 Forage consumption 53
4.4.4 Nutrient content of locally available feeds 56
CHAPTER 5 SUMMARY, CONCLUSION AND 59
RECOMMENDAnONS
,. I "
IV

LIST OF TABLES.
NO. TITLE OF TABLES
1 Buffalo Population in Malaysia in 2000 by state 10
2. Buffalo population in Sarawak in 1999 14
3. Buffalo population in Lawas district in 1998 15
4. Buffalo population in Ba Kelalan sub~district 16
5. Growth traits of buffalo 22
6. Reproduction traits of buffalo 23
7. Buffaloes Daily Nutrients Requirements 26
8. Ranges ofmineral contents of pasture grass 28
9. Chemical composition of selected local grasses (%DM) 31
10 Buffalo traits by height, length, weight and chest
circumference 37 " ~ I
11. Cattle traits by height, length, weight and chest
circumference 38
12. Comparison ofactual weight with estimated weight 39
13. Reproductive performance and estimated weight ofbuffalo
at Farm A 50
14 Reproductive performance and estimated weight ofbuffalo
at Farm B 51
15 Nutrient composition ofplants consumed by buffaloes at
BaKelalan 56
v

LIST OF FIGURES
NO TITLE
Water buffalo (Bubalus bubalis) 4
2 Distribution of buffalo in Malaysia for the year 2000 9
3 Ruminant livestock population in Malaysia (1970-2002) 11
4 Ruminant livestock population in Sarawak (1990-2002) 12
5 Ruminant livestock population in Sabah (1997-2000) 13
6 Parameter to estimate body weight ofbuflalo (Murtidjo,1989) 34
7 Weighing machine 35
8 Race with head bail to restrain a single animal 35
9 Buffalo provides transportation 41
10 Locality map ofBa kelalan 42
11 Farm A sampling points 43
12 Farm B sampling points 43 /r .'
13 Typical condition of Grazing area in Ba kelalan 45 ,.
14 Quadrats 48 '.
:!. ••
)
VI

ABSTRACT
The buffaloes have contributed greatly in many aspects of socio-economic
livelihood of rural farmers in the country. For example, they provide meat, milk,
labour for the wet paddy farmers by ploughing the fields, and weeding the fields
by eating out the grasses and paddy stalks after harvesting. In the process, the
animals fertilize the fields through the deposit of the dung. They also provide
transport to drag jungle and farm products from the fields to the store house.
Besides, they act as "living bank" to the rural farmers. The animals are sold for
cash whenever financial needs arise. '
The population of the animal in the country has declined steadily over the years. "
Some of the factors contributing towards this decline are such as the
mechanization of the wet rice cultivation taking over the role of the animals
providing draught power, high slaughtering rate, low reproduction, competing use
of grazing lands with other uses such as agricultural activities, housing and
industries.
The aim of this study is to document the productive performance of buffaloes in
Ba Kelalan and investigate some of the factors that influence production factors.
It was concluded that the local forage quantity is inadequate, Mineral contents are
low, calves mortality rate is very high and the model developed for the estimation
of buffalo body weight is not significant The formula developed by Murtidjo
(1998) can be used to estimate the weight of the buffalo. Female buffaloes are
fertile and reproductive.
Vll

ABSTRAK
Kerbau merupakan haiwan ternakan di Malaysia. Kerhau telah menyumhang
hanyak terhadap kehidupan sosio-ekonomi petani-petani di Negara ini.
Contohnya, kerbau membekal daging dan susu. Selatn itu, kerhau diguna untuk
memajak sawah padi dan makan rumput rampai serat jerami padi selepas menuai
sawah padi sambi! membajakan sawah dengan tahi mereka. Kerbau juga diguna
untuk mengangkut hasil hutan dan hasil tanaman dart ladang. fa juga merupakan
" bank yang hidup" bagi petani-petani. Apabila ada keperluan kewangan,
kerbaulah yang dijual untuk mendapatkan wang.
Populasi kerbau di negara int terus menurun sejak heberapa tahun dahulu.
Penurunan populasi ini di sebahkan oleh heherapa faktor. Antara sehah tni
adalah peranan kerbau dalam pemajakan sawah padi diamhil alih oleh mesin,
,Jkadar sembelihan yang tinggt, kadar pemhiakan yang rendah dan saingan l'
kegunaan tanah yang biasa dtgunakan sehagai ladang perternakan kerbau dart ,. "
industri pertanian, perumahan dan industri.
Tu}uan kajian ini adalah untuk mendokumentasikan presta.<;i keberhasilan kerbau
yang memhrangsangkan di Ba kelalan dan mengkaji faktor-faktor yang
mempengaruhi prestasi keberhasilan ternakan ini.
Adalall dirumuskan hallawa kuantiti fora} tempatan adalah sangat kurang, kadar
kematian anak kerhau adalah sangat tinggi, kandungan mineral adalall rendah
dalam rum put tempatan tetapi pembiakan kerhau adalah baik. Model atau
fbrmula yang dibentuk untuk menentukan berat kerbau dengan menggunakan
kaedah panjang, tinggi dan saiz dada kerbau tidak signifikan. Formula yang di
gunakan olell Murtidjo (1998) adalall signifikan. Kerhau betina adalall subur dan
pemhiakan yang baik.
V111
CHAPTER ONE
INTRODUCTION
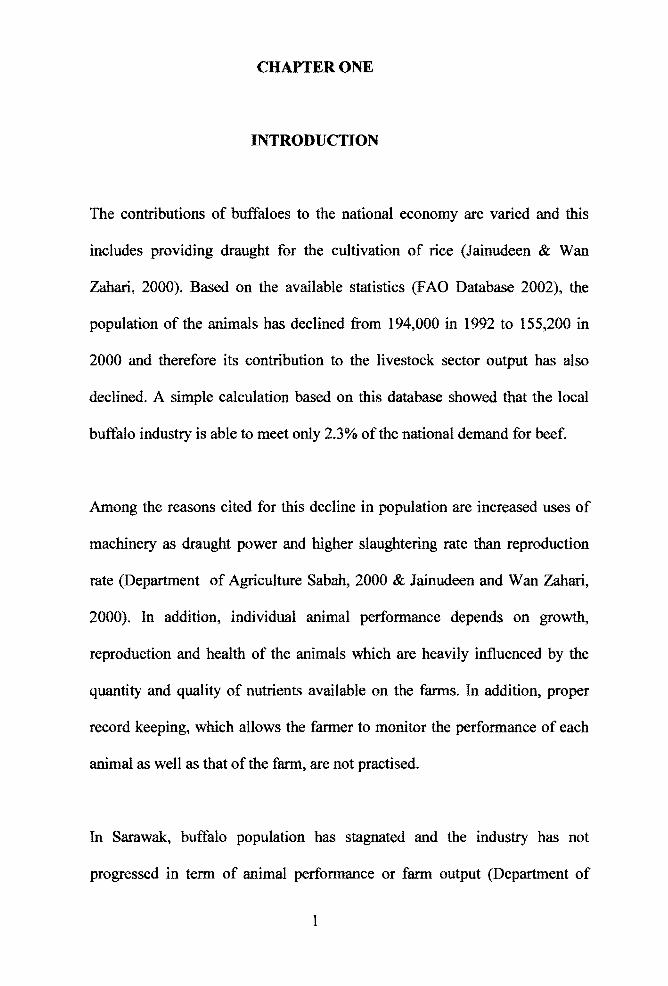
The contributions of buffaloes to the national economy are varied and this
includes providing draught for the cultivation of rice (Jainudeen & Wan
Zahari, 2000). Based on the available statistics (F AO Database 2002), the
population of the animals has declined from 194,000 in 1992 to 155,200 in
2000 and therefore its contribution to the livestock sector output has also
declined. A simple calculation based on this database showed that the local
buffalo industry is able to meet only 2.3% ofthe national demand for beef. ;! ".
Among the reasons cited for this decline in population are increased uses of
machinery as draught power and higher slaughtering rate than reproduction
rate (Department of Agriculture Sabah, 2000 & Jainudeen and Wan Zahari,
2000). In addition, individual animal performance depends on growth,
reproduction and health of the animals which are heavily influenced by the
quantity and quality of nutrients available on the farms. In addition, proper
record keeping, which allows the farmer to monitor the performance of each
animal as well as that of the farm, are not practised.
In Sarawak, buffalo population has stagnated and the industry has not
progressed in term of animal performance or farm output (Department of
1

Agriculture, Sarawak, 2000). Partly, this is due to lack of research, and
therefore knowledge and information on buffalo production in Sarawak is
lacking. Research that can contribute to improved production includes
nutrition, reproduction and management. Recognizing the lack of knowledge
and information on various aspects of management, nutrition and
reproduction, I investigated a method to estimate live-weight of the animal,
the estimated nutrient intake and study the reproductive performance of
buffaloes at two farms in Ba Kelalan, Lawas.
A cheap and reliable method to weigh the animals at the farm level is an
important component of efficient animal management because this enable the
farmers to monitor the growth performance of the animals. Thirdly, the
farmers would not be short-changed by the middle-men in the transaction. At
this moment, the farmers are not able to buy the machine, as it is too costly.
1.1 The objectives of the study are:
• To determine a practical method of estimating the body weight of the
animal at the farm level.
• To document the management performance practices two buffalo farms in
Ba Kelalan.
• To compare the productive performance of the animal at two different
farms
2
\

• To determine the amount of grass eaten by the animals after a three day
period.
• To determine the protein, fibres, mineral contents of the most common
local grass eaten by the animals.
Based on the above objectives, this study is divided into four parts, (a)
estimation of body weight, (b) production performance, (c) grass
consumption, and (d) nutrition quantity and quality.
3

CHAPTER TWO
LITERA TURE REVIEW
2.1. Buffalo Industry in Malaysia.
The buffalo (Bubalus bubalis) found in Malaysia is represented mostly by the
swamp type (Sani et ai., 1990) as seen in Figure 1. The animals have played
an important role in the overall growth of the Malaysia agriculture sector.
The animal provided draught power for the cultivation of rice field. For
example, the animals are used by the fanners to plough the paddy fields to
loosen up the soil in preparation of planting paddy seedlings. The animals
also provide labour for transporting or carrying agriculture products from the
fanns to the settlements and provide meat, which is a good source of protein.
Figure 1. Water buffalo (Bubalus bubalis) at Ba Kelalan
4

Pusat 'Khidmat Maklnm~t Akademi1c UNIVEltSrn MALAYSIA SAkAWAK
The domesticated swamp buffalo found in Malaysia was originally brought
from Burma and Thailand (Devendra, 1982). They are different from the
bison of northern United States and the wild buffalo of Africa. The other
species of wild buffaloes are the Anoa (Anoa depressicorous), of Sulawesi,
Indonesia and the Ami (Bubalus arnee) ofIndia. Those found in the east and
west coast of Sabah were brought by the Chinese immigrants from China to
work in the wet paddy farms in 1898 (Tuen & Razak, 1986). Mr, Bagul
Lupong, the paramount chief of the Lun Bawang community in Lawas
district related that the buffaloes were brought into the district from Sabah
around the 1900s. Since then, buffaloes have become very much part of the
community socio-economic welfare. According to Mr. Selutan Libang, the
headman of Kampong Long Langai, the buffaloes were brought to Ba
Kelalan between 1910-1920 from Batu Danau, Limbang.
The ruminant industry in the country when compared with the non-ruminant
sector is on the decline (Wong & Chen, 1998). The Department of Veterinary
Services, Malaysia (2004) report shows a steady decline in buffalo
population. For example, in 1970, the population of buffaloes in West
Malaysia was 233,040 heads and dropped to 87, 948 heads in 2000. The total
drop in a period of thirty two years is about 62.6%, which is about 2% drop
annually. In Sabah, the same scenario is happening. For example, in 1997, the
population of buffaloes was 48,000 and dropped to 42,318 heads in 2000,
which is about 5,682 heads in four years or 12 % per year (Department of
5

Agriculture Sabah, 2000). The decline of buffalo population in Sarawak was
minimaL For example, the buffalo population was 10,646 heads while in
1999 was 10,640 heads (Department of Agriculture Sarawak, 2000).
However, the decline is worrisome in Ba Kelalan sub-district For example,
the animal population in 1995 was 1,127 heads but in 1998, the number had
decreased to 847 heads as in Table 4 (Department of Agriculture Sarawak,
2003). The same situation is happening in the study area, Kampong Long
Langai, Ba Kelalan. Statistics obtained the Jawatan Kuasa Kemajuan dan
Keselamatan Kampong (JKKK), Long Langai revealed that there were 250
. rheads of buffalo in the village in 1993. However, in 2003 there were only 155 "
, ,),
(heads, which is about 40% decline in the last eight years. '. .
The decline in population of the animal in the country could be due to many
factors. McDowell (1985) suggested the following reasons that might have
contributed to this situation especially in the tropical region. These include
lower quality of feeds, deficiencies of specific nutrients, poor management,
more losses from diseases and parasites. According to Jainudeen and Zaharai
(2000), the decline of the animal population in the country are due to
declining role of the animal in the wet rice farming after the introduction of
machinery in rice cultivation industry especially in the west Malaysian states
such as Kedah, Pahang, Kelantan, Negeri Sembilan, Perak and Terengganu.
In view of this, the farmers have neglected the animal production. In Sabah,
slaughtering rate and poor reproduction rate are the main causes of the
decline. In Ba Kelalan, the farmers say that high mortality rate among the
6

calves, low reproduction rate, poor food quality and quantity, limited area for
grazing and low farm prices are some of the problems confronting the
industry,
Realizing the problems facing the ruminant industry in the country, the
government had formulated a new thrust in the Malaysian New Agriculture
Policy (NAP) in 1984. The new thrust for the livestock industry sector was
to commercialize the ruminants farming and the protection of the
environment against degradation from livestock farming activities
(Department of Agriculture Sarawak 8th Malaysian Report, 2000). Under this
new policy, the private sectors who have the fund and technology are
encouraged to spearhead the industry. Modem farming approaches and large
scale farming are encouraged. Livestock integration with crops plantation
such as oil palms are to be promoted. In Sarawak, the state government had
identified issues such as unavailability of feed resources, lack of total quality
farm management and herd health reproduction are some of the major
problems faced in the larger ruminant industry. Thus, the state government
has decided to address the issues identified through various strategies
outlined in the Eight Malaysia Plan (2000-2004). For example, the
government would continue to give assistance in the form of finances, tools
and equipment to the sincere farmers.
" i·
.. . i
, I, I
l
7

r
2.1.1 Distribution and Population.
In Malaysi~ the buffalo population distribution is closely associated with
human population, land use and topographical condition. For example, in
West Malaysia, buffaloes are mostly found in the wet paddy producing states.
In Sabah, buffaloes are found in the interior region such as Keningau and
Tambunan and the western parts of the state where wet rice fields are mostly
located. In Sarawak, the population is concentrated in the northern region of
the state, in the districts of Limbang and Lawas where it is also associated
with wet paddy farming.
The buffalo distribution in the country in the year 2000 is shown in Figure 2.
All the states in the country have buffaloes with the exception of the Federal
Territory. About 58 % of the total popUlation of buffaloes were found in . . West Malaysia in 2000, about 34 % were found in Sabah while the remaining
~
8 % were found in Sarawak. The state of Sabah had the highest number of
buffaloes in 2000 with 52,000 heads which is about 35 % of the total
population, followed by the state of Pahang with 17 % while Sarawak had 8
% of the total popUlation.
8

PERLIS
i~
~ SASAH / 11,832 ~
~)
~J9 "'~
SARAWAK t' 11,832
SA KELALAN
t l'
148
't JOHOR 2,988
5503
Figure 2. Distribution of buffalo in Malaysia for the year 2000
Source: Veterinary Services Department Malaysia (2000)
9

r
The average male-female ratio for West Malaysia is 1 :2.3 as in Table 1. For
good and effective reproduction, the ratio of male and female should be 1:1 0
(Nordin, 1997). In contrast, the male and female ratio for the state of Pedis is
3: 1 which is opposite to that ofother states. Perlis had more male than female
buffalo perhaps because they imported the male animals for slaughter as the
dressing percentage are better than the female animals. Sex ratio data is not
available for Sarawak and Sabah.
Table 1: Buffalo population distribution in Malaysia in 2000 by state.
TotalState Male Female %
Pedis 114 34 0.09%
Kedah 2,914 8,341 11,255 7.56% \,
I ~,
• /
l'f
, IPenang 109 197 306 0.20% .' !
:;. \ 7 (Perak 2,849 9,220 12,069 8.11% lit
~ ~,Selangor 44 153 697 0.46% t ~ : l
.< " ~:Negeri Sembilan 2,780 2,780 5,560 3.73% ,.,'. 1:,1"
j~ JMalacca 1,546 3,984 5,503 3.70% I" ,~
Johor 1,016 1,972 2,988 2.00%
Pahang 7,125 18,372 25,497 17.14%
Terengganu 3,283 8,075 11,358 7.63%
Kelantan 3,792 5,709 9,501 6.38%
Federal Territory
Sabah NA NA 52,000 34.96%
Sarawak NA NA 11,832 7.95%
Total
Source: Dept. ofveterinary Services, Malaysia 2002
10

Available records show that the buffalo population, when compared with the
other ruminants in West Malaysia, had been declining in the last 30 years
(Figure 3) at the rate of 4,642 heads annually or 3 %. In contrast, the
population of cattle and sheep has increased by 120 and 21 % respectively.
The decline in buffalo population is thought to be related to the increase use
of machinery in rice cultivation and scarcity of grazing land due to
competition from other land use such as housing, industries and other
agricultural activities such as oil palm plantation. On the other hand, the huge
increase in sheep and cattle is partly due to the integration of sheep and cattle
rearing with plantation. Sheep are the preferred animal for integration
because they cause less damage to the crops. Buffaloes are not suitable for
integration because they need ponds for wallowing. In Malaysia, buffalo
farming is closely related to the number of households in an area (Ariff et aI.,
1997). However, personal experience with the local farmers show that some
of the other factors contributing to larger population of the animal in any area
are the availability of grazing lands and financial ability of the farmers to
purchase or own the animals.
800,000
700,000
600,000
500,000
400,000
300,000
200,000
100,000
o
r-
c-
h
c- r-
r-
I I r-
I l I D.
lEI Buffalo
• Cattle
o Goats
o Sheep
1970 1980 1990 2000 2002
Figure 3: Ruminant livestock population in Malaysia 1970-2002
Source: Veterinary Services Malaysia, Department ofAgriculture 2004
11

20,000
15,000 r-
r-r 10,000
5,000
o 1990 1995 1996 1997 1998 1999
o Buffalo
• Cattle
o Goat
o Sheep
Figure 4: Ruminant Livestock population in Sarawak 1990-1999
Source: Department of Agriculture Sarawak, 2000
The population of buffaloes in Sarawak for the past nine years had stagnated
(Figure 4). For example, the population of buffaloes in 1990 was 10,646
while in 1999 was 10,640. The other ruminants such as cattle, goats and
sheep were declining in numbers as well. For example, in 1990 there were
15,134 heads of cattle in Sarawak but in 1999, there were only 8,064. From
the statistics above, it can be seen that the state had not responded to the
National Agriculture Policy (1986) call for aggressive thrust in ruminant
farming. The suggested integrated farming of cattle with plantation had not
been carried out aggressively in the state as compared to West Malaysia. As
for buffaloes, the population remained stagnant due to the poor marketing
access for the animals (Department of Agriculture Sarawak, 2000). At one
time, Brunei was the major consumer of the animal especially for the animal
in Limbang and Lawas districts. However, since the middle of 1900, they
have reduced the import of the animals to protect their own cattle farms in the
12

Northern territory of Australia. This market loss has resulted in fewer farmers
continuing their buffalo fanning activities.
o Buffalo 60,000
• Cattle
50,000 o Goat
DSheep40,000
30,000
20,000
10,000
o 1997 1998 1999 2000
Figure 5: Ruminant Livestock Population in Sabah 1997-2000
Source: Veterinary Service, Sabah 2002
Similarly, the population of buffaloes and other ruminants in Sabah had also
declined especially since 1998 (Figure 5). For example, the total number of
buffaloes in Sabah in 1997 was 48,000 while in 2000 there were 42,000
heads. The decline is about 6,000 heads over a period of four years, which is
about 12 %. The reasons given by the Veterinary Department Sabah (2002)
are high slaughtering and poor reproductive rate of the animals. The cattle
industry is as poor as the one found in Sarawak. The cattle population
increased only by a small margin of 1,727 heads from 44,817 heads in 1997
to 46,544 heads in 2000. The increase is only about 4 %.
13

Table 2: Buffalo Population in Sarawak in 1999
Total
Kuching 13
SriAman 11
Sibu 56
Miri 607
Limbang 9,923
Sarikei 23
Kapit 23
Samarahan 0
Bintulu 0
Total 10,640
Source: Agriculture Statistics Sarawak, Department ofAgriculture 2000
The distribution of buffalo population in Sarawak is shown in Table 2. Most
of the buffaloes in Sarawak are found in the Limbang division, which
accounts for 93% of the total number of the animals found in the state. This is
I"
t
because of its close proximity with Brunei that was once a good market prior
to the middle of 1980. Secondly, the animals are closely related to wet paddy
farming which is the main farming activity of the natives in the district of
Lawas (Department of Agriculture, Lawas, 1990). Thirdly, buffaloes are
used as a form of dowry payment among the Bisaya and Lun Bawang
community who are predominantly found in the Limbang division.
{'
14

--- ....
Table 3: Buffalo Population in Lawas District
Sub-district Population (1998)
Sundar
Trusan
LawaslPunang
Long Sukang
Long Semadoh
Ba Kelalan
819
414
677
210
1062
847
Total 4,096
Source: Department ofAgriculture, Lawas 2000
The population distribution of buffaloes in Lawas District is shown in Table
3. Lawas District buffalo population contributes to 41 % of the total
population in the Limbang division. Long Semadoh sub-district has the most
number of buffalo in Lawas district, which is about 26 % of the total 'i
population. f, +,
.'
.
15

T
Table 4: Buffalo population in Ba Kelalan sub-district in 1995 and 1998
Villages 1995 1998
Puneng Kelalan 73 53
LongMuda 82 52
Long Kumap 67 50
Long Lemutut 76 46
Long Langai 184 156
LongRitan 160 80
Long Rusu 107 136
Buduk Bui 120 120
BudukAru 114 98
..Pa Tawaing 97 57 .1
Total 1,127 847 "
'\','-,' ,
Source: Department ofAgriculture, Lawas 2000. f. . ~
In Ba Kelalan sub-district, Kampong Long Langai has the highest number of
the animals in 1998, accounting for 18 % of the total number of the animal in
this sub-district as in Table 4. This is followed by Kampong Long Rusu
which has about 16 % of the total population. This is partly due to the
availability of grazing land compared with the other villages in the area
which has limited grazing land. However, the population of the animal in
Long Ritan declined by 50 % due to the demise of the older farmers. Their
children have migrated to the town areas.
16