Embed Size (px)
Citation preview

RESEARCH ARTICLE Open Access
Prospecting major genes in dairy buffaloesGMF de Camargo1*†, RR Aspilcueta-Borquis1†, MRS Fortes2†, R. Porto-Neto3†, DF Cardoso1, DJA Santos1,SA Lehnert3, A. Reverter3, SS Moore4 and H. Tonhati1
Abstract
Background: Asian buffaloes (Bubalus bubalis) have an important socio-economic role. The majority of thepopulation is situated in developing countries. Due to the scarce resources in these countries, very few species-specific biotechnology tools exist and a lot of cattle-derived technologies are applied to buffaloes. However, theapplication of cattle genomic tools to buffaloes is not straightforward and, as results suggested, despite genomesequences similarity the genetic polymorphisms are different.
Results: The first SNP chip genotyping platform designed specifically for buffaloes has recently become available.Herein, a genome-wide association study (GWAS) and gene network analysis carried out in buffaloes is presented.Target phenotypes were six milk production and four reproductive traits. GWAS identified SNP with significantassociations and suggested candidate genes that were specific to each trait and also genes with pleiotropic effect,associated to multiple traits.
Conclusions: Network predictions of interactions between these candidate genes may guide further molecularanalyses in search of disruptive mutations, help select genes for functional experiments and evidence metabolismdifferences in comparison to cattle. The cattle SNP chip does not offer an optimal coverage of buffalo genome,thereafter the development of new buffalo-specific genetic technologies is warranted. An annotated referencegenome would greatly facilitate genetic research, with potential impact to buffalo-based dairy production.
Keywords: Bubalus bubalis, SNP, Reproduction, Milk, Candidate genes, GWAS
BackgroundAsian buffaloes are a livestock species with a high socio-economic importance and promising characteristics forproduction. The species is mostly found in developingcountries integrating production system by providingmeat and milk to local communities. Asian buffaloes arealso used as draught animals. In developed countries,such as Italy, the buffalo population is selected for dairyproduction, specially the production of mozzarellacheese, the most famous trademark product. Buffalomilk has high fat content and solids concentration andthese intrinsic characteristics are favourable for cheesemanufacturing.There are two species of domesticated buffaloes: river
or water buffalo (Bubalus bubalis, 2n = 50) and swamp
buffalo (Bubalus carabanesis, 2n = 48) [1] . The geneticdifference is marked by a fusion of chromosomes 4 and9 in swamp buffalo. The first cross between the two spe-cies produces fertile offspring, but fertility is reduced insubsequent crosses [2]. In comparison to cattle, buffalometacentric chromosomes (five) are a fusion of two cat-tle acrocentric chromosomes and the other chromo-somes conserve a high homology between species [3].There are two water buffalo genomes sequenced [4, 5].
Both of them have the sequences available at NCBI plat-form in scaffolds. However, the sequences are not dis-played in chromosomes and genes are not annotated(UMD_CASPUR_WB_2.0; http://www.ncbi.nlm.nih.gov/assembly/GCF_000471725.1/). In an effort to generate areference set to aid polymorphism discovery and geneannotation of the buffalo genome, RNA from 30 differ-ent tissues was extracted and sequenced [6]. The lack ofbuffalo genomic data means that researchers need torefer to a “next of kin” species: cattle.Cattle and buffalo species are in a close evolutionary
relationship and the cattle genome is far better
* Correspondence: [email protected]†Equal contributors1Universidade Estadual Paulista (Unesp), Faculdade de Ciências Agrárias eVeterinárias, Departamento de Zootecnia, Via de acesso Professor PauloDonato Castelane, Jaboticabal, SP 14884-900, BrazilFull list of author information is available at the end of the article
© 2015 de Camargo et al. Open Access This article is distributed under the terms of the Creative Commons Attribution 4.0International License (http://creativecommons.org/licenses/by/4.0/), which permits unrestricted use, distribution, andreproduction in any medium, provided you give appropriate credit to the original author(s) and the source, provide a link tothe Creative Commons license, and indicate if changes were made. The Creative Commons Public Domain Dedication waiver(http://creativecommons.org/publicdomain/zero/1.0/) applies to the data made available in this article, unless otherwise stated.
de Camargo et al. BMC Genomics (2015) 16:872 DOI 10.1186/s12864-015-1986-2
characterised than buffalo. An initial genome maps forbuffaloes using cattle-derived markers and possible rear-rangements were identified between species [7]. Pos-itional candidate genes and physical mapping weregenerated giving a better understanding of buffalo gen-ome structure.More recently, a cattle SNP chip was applied to
characterize buffalo genome. Genotyping 10 buffaloes witha 54 k cattle SNP chip (Illumina) and found that ~80 % ofthe SNPs were successfully genotyped, but only ~2 %(1,159) were segregating in the population [8]. This resultindicates that genome sequences are conserved betweenthe species but not necessarily the polymorphisms. The au-thors also identified that the SNPs genotyped are notequally distributed in the buffalo genome. There are someSNP-rich and some regions with poor SNP coverage, andtherefore the cattle SNP chip does not offer an optimalcoverage of buffalo genome. Genotyping 384 buffaloesusing 777 k cattle SNP chip (Illumina) and showed that~88 % of the SNPs were genotyped in buffaloes, but alsoonly ~2 % (16,580) of the SNPs were segregating [9]. In alinkage disequilibrium study, these authors reported a meanvalue of r2 equal to 0.28 indicating that these SNP could beused for genomic selection and SNP association analyses.Studies that used cattle SNP chips did identify SNP associ-ated with production and reproductive traits in buffaloes;using the 54 k cattle SNP chip [10] and a 777 k cattle SNPchip [11]. However, given that only ~2 % of the SNP inthese cattle chips was segregating in buffaloes, a speciesspecific SNP chip would be more informative. Importantly,SNPs present in the cattle chips that segregate in buffaloesare probably “old” polymorphisms, existent before the spe-ciation event that separated cattle from buffaloes. Old poly-morphisms might not be appropriate to study the result ofartificial selection in dairy buffaloes. Based on this marketnecessity, a commercial buffalo SNP chip array was recentlyreleased (Axiom ® Buffalo Genotyping Array 90 K Affyme-trix). The selection of SNP included in the chip array isbased on buffalo sequencing data (Affymetrix), but SNPposition and annotation to genes used the cattle genome asa reference (UMD3.1 assembly). Due to the fact that this isthe most appropriate tool available, it was used in thepresent study.The aim of the study was to identify SNPs, genomic
regions and genes that affect production and reproduct-ive traits. To this aim genome-wide association analysesand gene network predictions were carried. Gene net-work analyses aid the identification of genes that havepleiotropic effects and/or regulatory roles [12]. Thegenes identified might be candidates for future fine-mapping studies in search of causative mutations. Theinterpretation of results herein might also trigger gen-ome structure, metabolism and physiology comparisonsbetween species, supporting evolutionary studies.
MethodsAnimal ethics committee approval was not required forthe present study. The data and samples used here wereobtained from an existent databank of the Animal ScienceDepartment from São Paulo State University (Unesp),Jaboticabal-SP, Brazil. The department is responsible forthe Milk-Recording Buffalo Program. The farmers gentlycontribute with phenotypes, pedigree information andsamples of the animals.
Data structureSix production traits and four reproductive traits were tar-geted. The production traits were: milk production (MP),fat production (FP), protein production (PP), fat percentage(%F), protein percentage (%P) and somatic cell score (SCS).The reproductive traits were: age at first calving (AFC),calving interval (CI), open days (OD) and number of ser-vices per conception (NSC). The data analyzed was basedon 11,530 lactations of 3,431 buffaloes, monthly recordedfrom 1995 to 2013. Murrah buffaloes were from 12 farmswith 186 sires with registered daughters. The final pedigreearchive had 14,346 animals. The structure of the data ispresented in Table 1. The SCS doesn’t have normal distri-bution and it was transformed to the log scale, using thefunction: SCS = (log2(CCS/100.000)) + 3 [13].Records were obtained apart from the fifth production
day in milk. First five day of colostrum production werenot considered. Only lactations longer than 90 days wereused in the analyses. The cumulative milk productionover 305 days (MP), fat production (FP) and protein pro-duction (PP) were calculated apart from the productionin the milk-recording day. The %F, %P and SCS were themonthly record means per lactation. The age at firstcalving (AFC) was defined as the difference, in months,
Table 1 Structure of the data and descriptive statistics for milk(MP), fat (FP) and protein production (PP), fat (%F) and proteinpercentage (%P), somatic cell score (SCS), age at first calving(AFC), calving interval (CI), number of services per conception(NSC) and open days (OD).
Trait Numbers Mean SD CG
MP (kg) 11530 1864.14 448.67 298
FP (kg) 2890 110.34 35.41 96
PP (kg) 2890 84.73 22.89 96
%F 2890 7.02 1.09 96
%P 2890 4.24 0.72 96
SCS 2890 5.82 0.92 96
AFC(days) 3431 897.13 128.16 134
CI (days) 4729 407.54 32.33 106
NSC 4978 2a - 186
OD (days) 6894 138.84 21.78 184
SD standard deviation, CG contemporary groupaMode
de Camargo et al. BMC Genomics (2015) 16:872 Page 2 of 14
between the first calving and the birth of the buffalo.The calving interval (CI) was defined as the difference,in months, between consecutive calving events. Thenumber of services per conception (NSC) is the numberof artificial inseminations per conception for each buf-falo. The open day (OD) is the difference, in days, be-tween the calving and the subsequent conception. Thecontemporary group (CG) was formed by herd, year andcalving season (October-March and April-September)for all the traits, except CI and by herd, year and birthseason for CI. Each CG had at least four animals andtrait records between ±3.5 standard-deviations of thegroup mean.
Breeding value predictionA repeatability animal model was used for the geneticanalyses of all traits except AFC. For AFC, an animalmodel without repetition was used, because this traitcan only be measured once. Variance components wereestimated by Restricted Maximum Likelihood method(REML) using the Wombat software [14]. The model in-cluded the fixed effect of CG, age fitted as a co-variable(age of buffalo at calving, linear and quadratic) (exceptfor AFC) and the random effects of additive geneticvalue, permanent environment (except for AFC) and re-sidual. Fitted model scan be represented in matrixnotation:
y ¼ Xβþ ZaþWpþ e
or
y ¼ Xβþ Zaþ e for AFCð Þ
Where β, a, p and e are the vectors of fixed effects, addi-tive genetic value, permanent environment and residual,respectively; X , Z and W are the incidence matrix of fixedeffects, additive genetic value and permanent environ-ment. A brief report of the parameter estimates (heritabil-ity, genetic and phenotypic correlations) was included(Tables 2 and 3). The genetic values and their accuracieswere obtained (Table 4), de-regressed as was proposed by[15] and used as pseudo-phenotypes for GWAS.
Genotyping and quality controlA total of 452 buffaloes (57 sires and 395 dams) were ge-notyped using the 90 K Axiom ® Buffalo Genotyping(Affymetrix). The animals genotyped were the ones withthe best accuracies. The sires have at least 40 progeniesand the dams at least three calvings and many of thedams are mothers of sires used in the herds. Initially, theSNP chip contained 92,826 markers. Sample quality con-trol observed the call rate of 0.95 and above, and a het-erozygozity of ± 3 standard-deviation of the mean. ForSNPs quality control, thresholds were set for call rate
(superior to 0.98), Hardy-Weinberg equilibrium (P-valuetest less than 10−6), and correlation between markers (ifhigher than 0.998 one SNP of the correlated pair was ex-cluded). Also, coincident SNPs were eliminated. Minorallelic frequency was not used to discard markers. SomeSNPs were genotyped twice when there was a probe ineach strand for the same SNP. In the case of coincidentSNP, the probe with the most animals genotyped wasused. Markers present in Y chromosome and mitochon-drial DNA were discarded. Markers in X chromosomewere considered. The males have only one X chromo-some, so they are always homozygous for the markers (0or 2), females have two, so they were codified like theautosomes (0, 1 or 2). After the quality control, thenumber of SNPs retained for association analysis was61,145.
Genome-wide association studyIn order to associate SNPs with the de-regressed breed-ing values (DEBV) of the studied traits, a mixed linearmodel was implemented using R software and GenABELpackage [16]. The DEBV have information of the recordof the animal genotyped as well as from their relatives.The reliability (source of information) varies among theanimals, so the DEBV have heterogeneous variancescorrected by the residual weights as proposed by [15].The model implemented was:
y ¼ Xβþ μþ ε
Where y is the vector of the DEBVs, X is the vector ofthe genotypes in the locus being tested, β is the fixedadditive genetic value attributed to the locus, μ is thevector of the polygenic with normal distribution
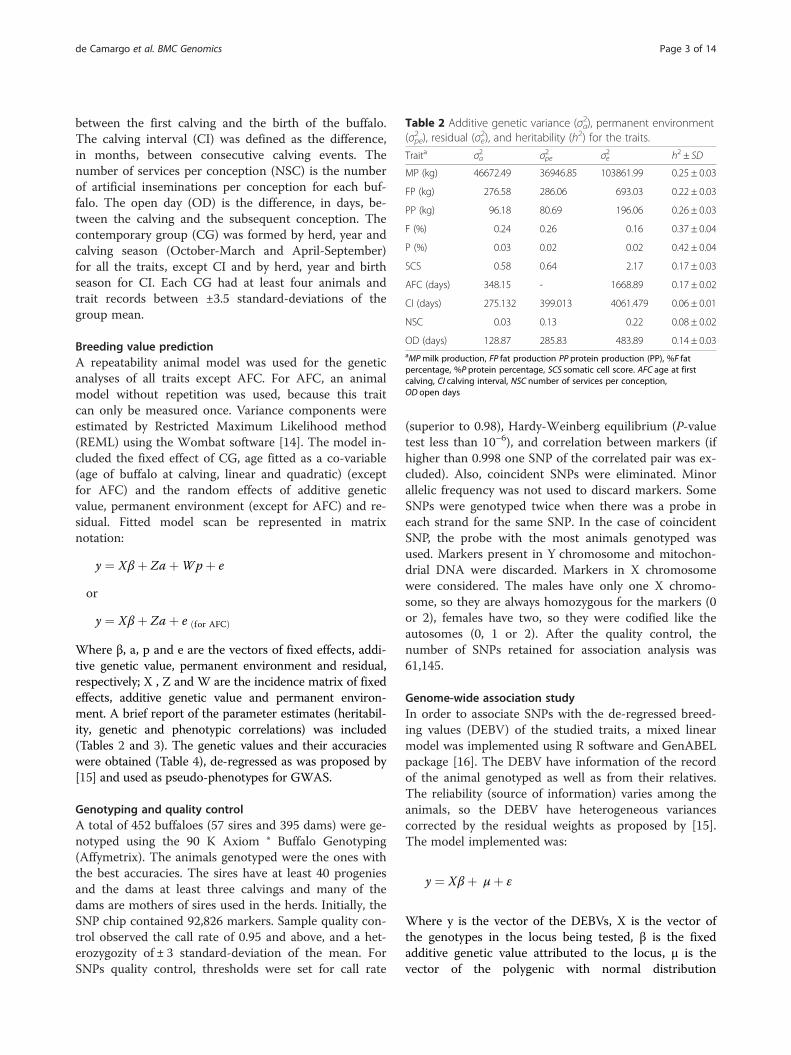
Table 2 Additive genetic variance (σa2), permanent environment(σpe2 ), residual (σe2), and heritability (h2) for the traits.
Traita σa2 σpe
2 σe2 h2 ± SD
MP (kg) 46672.49 36946.85 103861.99 0.25 ± 0.03
FP (kg) 276.58 286.06 693.03 0.22 ± 0.03
PP (kg) 96.18 80.69 196.06 0.26 ± 0.03
F (%) 0.24 0.26 0.16 0.37 ± 0.04
P (%) 0.03 0.02 0.02 0.42 ± 0.04
SCS 0.58 0.64 2.17 0.17 ± 0.03
AFC (days) 348.15 - 1668.89 0.17 ± 0.02
CI (days) 275.132 399.013 4061.479 0.06 ± 0.01
NSC 0.03 0.13 0.22 0.08 ± 0.02
OD (days) 128.87 285.83 483.89 0.14 ± 0.03aMPmilk production, FP fat production PP protein production (PP), %F fatpercentage, %P protein percentage, SCS somatic cell score. AFC age at firstcalving, CI calving interval, NSC number of services per conception,OD open days
de Camargo et al. BMC Genomics (2015) 16:872 Page 3 of 14
μ ~ N(0,Gσu2) and ε is the vector of the residual error
with normal distribution ε ~N(0, Iσe2).
The pedigree relationship matrix based on pedigree,G, describes the relation of the whole genome amongthe individuals, since it is estimated based on allelesidentical by state (IBS) of the markers. The parametersσu2 and σe
2 were estimated using Restricted MaximumLikelihood (REML) method for each SNP. The general-ized least square (GLS) was used to estimate the β ef-fects using the F test for the null hypothesis H0 : β = 0.
y ¼ xβþ zμþ e
Where y is the vector of the DEBVs, x is the designmatrix, β is the vector of coefficients of the regression
on recoded SNP genotypes; z is the incidence matrix foranimal effects; μ ~N(0, Aσa
2) is a vector of the polygenicanimal effects and e ~ (0, Iσe
2) is the vector of residuals,in which A is an additive genetic relationship matrix ofanimals and I is an identity matrix, and σa
2 and σe2 are the
animal’s additive polygenic variance and residual errorvariance, respectively. SNP allele substitution fixed ef-fects (β) and random background polygenic effects wereevaluated in this model. Values in the design matrix, x,were coded as 0, 1, 2 for the SNP genotypes, represent-ing the number of copies of the minor allele carried bythe individual. The parameters and were estimated usingRestricted Maximum Likelihood (REML) method for allSNP. The generalized least square (GLS) was used to es-timate the β effects using the F test for the null hypoth-esis H0 : β = 0.Subsequently, a Wald chi-square statistics was used to
determine if the SNP was associated with the traits stud-ied [17].The percentage of the phenotypic variance (Vp) ex-
plained by each SNP was estimated according to theequation:
%Vp ¼ 1002p 1−pð Þa;′ 2
σ2p
!
Where:
α = allelic substitution effectp = allelic frequency for ith observed SNP in thepopulationσp2 = Phenotypic variance estimate of the trait
Multi-trait analysis, pleiotropic effects and gene networkpredictionThe association weight matrix (AWM) methodology[12] was adapted and used to build a gene network from
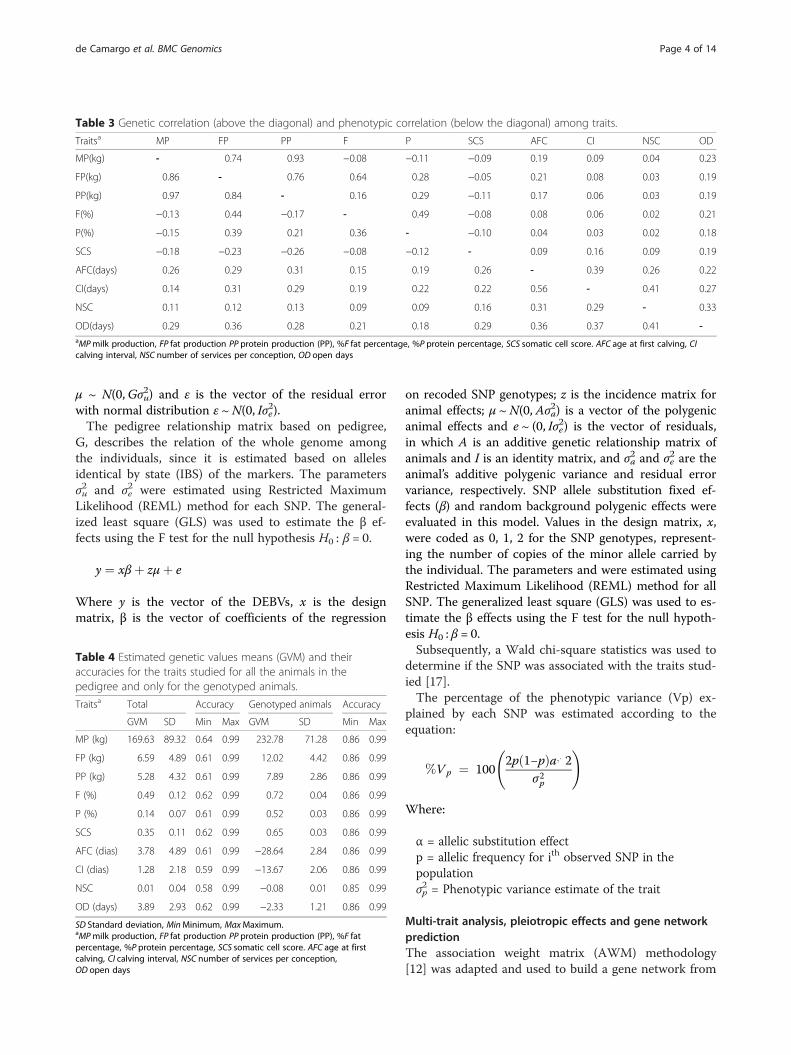
Table 3 Genetic correlation (above the diagonal) and phenotypic correlation (below the diagonal) among traits.
Traitsa MP FP PP F P SCS AFC CI NSC OD
MP(kg) - 0.74 0.93 −0.08 −0.11 −0.09 0.19 0.09 0.04 0.23
FP(kg) 0.86 - 0.76 0.64 0.28 −0.05 0.21 0.08 0.03 0.19
PP(kg) 0.97 0.84 - 0.16 0.29 −0.11 0.17 0.06 0.03 0.19
F(%) −0.13 0.44 −0.17 - 0.49 −0.08 0.08 0.06 0.02 0.21
P(%) −0.15 0.39 0.21 0.36 - −0.10 0.04 0.03 0.02 0.18
SCS −0.18 −0.23 −0.26 −0.08 −0.12 - 0.09 0.16 0.09 0.19
AFC(days) 0.26 0.29 0.31 0.15 0.19 0.26 - 0.39 0.26 0.22
CI(days) 0.14 0.31 0.29 0.19 0.22 0.22 0.56 - 0.41 0.27
NSC 0.11 0.12 0.13 0.09 0.09 0.16 0.31 0.29 - 0.33
OD(days) 0.29 0.36 0.28 0.21 0.18 0.29 0.36 0.37 0.41 -aMPmilk production, FP fat production PP protein production (PP), %F fat percentage, %P protein percentage, SCS somatic cell score. AFC age at first calving, CIcalving interval, NSC number of services per conception, OD open days
Table 4 Estimated genetic values means (GVM) and theiraccuracies for the traits studied for all the animals in thepedigree and only for the genotyped animals.
Traitsa Total Accuracy Genotyped animals Accuracy
GVM SD Min Max GVM SD Min Max
MP (kg) 169.63 89.32 0.64 0.99 232.78 71.28 0.86 0.99
FP (kg) 6.59 4.89 0.61 0.99 12.02 4.42 0.86 0.99
PP (kg) 5.28 4.32 0.61 0.99 7.89 2.86 0.86 0.99
F (%) 0.49 0.12 0.62 0.99 0.72 0.04 0.86 0.99
P (%) 0.14 0.07 0.61 0.99 0.52 0.03 0.86 0.99
SCS 0.35 0.11 0.62 0.99 0.65 0.03 0.86 0.99
AFC (dias) 3.78 4.89 0.61 0.99 −28.64 2.84 0.86 0.99
CI (dias) 1.28 2.18 0.59 0.99 −13.67 2.06 0.86 0.99
NSC 0.01 0.04 0.58 0.99 −0.08 0.01 0.85 0.99
OD (days) 3.89 2.93 0.62 0.99 −2.33 1.21 0.86 0.99
SD Standard deviation, MinMinimum, MaxMaximum.aMPmilk production, FP fat production PP protein production (PP), %F fatpercentage, %P protein percentage, SCS somatic cell score. AFC age at firstcalving, CI calving interval, NSC number of services per conception,OD open days
de Camargo et al. BMC Genomics (2015) 16:872 Page 4 of 14
GWAS output data. In the original description of AWMa key trait is selected to weight network predictions. Inthis study, the main idea was to identify genes thatequally contribute to the variation observed in all tentraits studied, as these pleiotropic SNPs might be moreuseful for genetic evaluation in buffaloes. In this context,it was used the methodology described by [18]: insteadof using SNPs P-values, t-values calculated served toground gene network predictions, (t ≥ 2.80 ≈ p ≤ 0.05).These statistics determine the importance of the SNPsacross the traits and are interpreted as a measure ofpleiotropic effect. All the SNPs were used in the analysisregardless of their location. Normally in AWM, SNP-to-gene distances are considered prior to construction ofgene networks. However, in this study, inclusion of allSNPs was preferred since genotyped SNPs were buffalovariants with locations annotated in the cattle genome(precise SNP-to-gene distances are actually unknown).To identify significant SNP-SNP interactions we used
the partial correlation and information theory (PCIT) al-gorithm [19]. Pairwise correlations across matrixrowswere used to predict SNP-SNP interactions and hencebuild a genenetwork [12]. The SNP pairs significantlyco-associated and with correlation higher than 0.85 hadan edge (connection) established in the gene network,which was visualized using the Cytoscape software [20]and MCode App [21]. In the network, every SNP was anode and every significant interaction was an edge con-necting two nodes. When a SNP was next to a gene(Variant Effect Predictor default), the gene ID was in-cluded in the network.
Identification of SNP location and gene enrichmentVariant Effect Predictor (VEP) from Ensembl websitewas used to verify if the significant SNP was near a geneand determine the distance. Analyses were done usingthe cattle genome.Gene ontology (GO) enrichment analyses were carried
using Gorilla tool (http://cbl-gorilla.cs.technion.ac.il/) toaid interpretation of GWAS results. The top genes asso-ciated with the traits were compared to a genome-widebackground gene list. Top genes were defined as geneswith a SNP whose P < 0.001 (distance of the SNP to gene
determined by VEP default). These GO enrichment ana-lysis were carried for each trait separately.
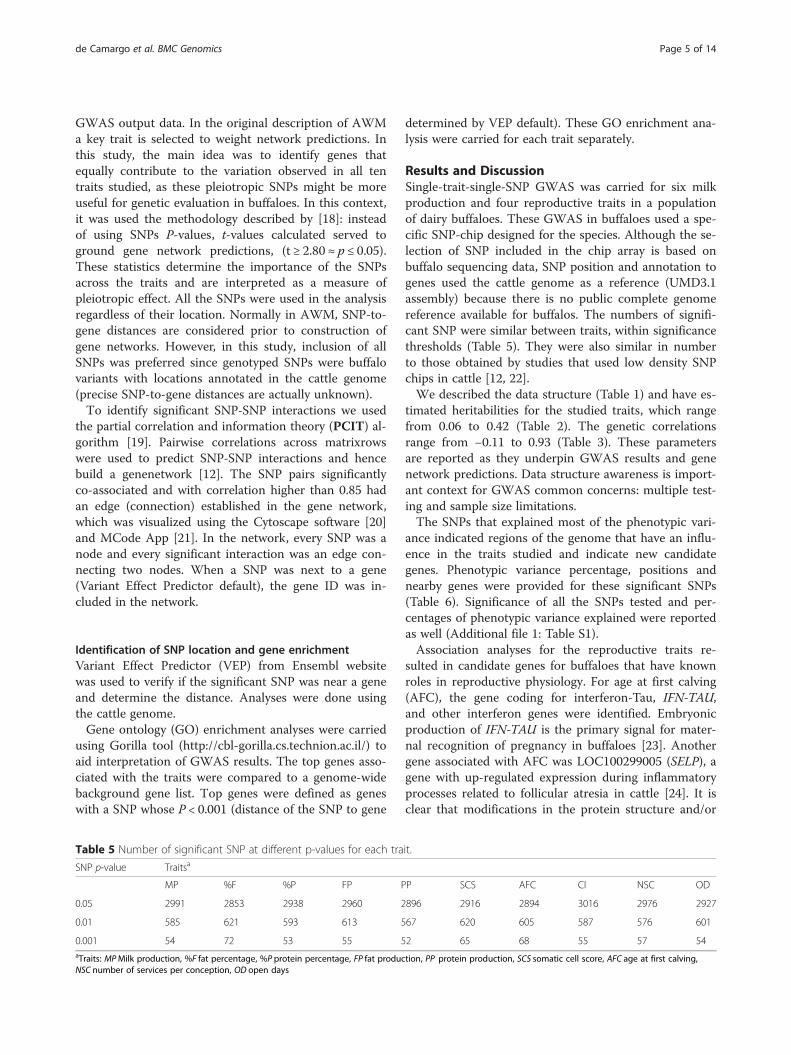
Results and DiscussionSingle-trait-single-SNP GWAS was carried for six milkproduction and four reproductive traits in a populationof dairy buffaloes. These GWAS in buffaloes used a spe-cific SNP-chip designed for the species. Although the se-lection of SNP included in the chip array is based onbuffalo sequencing data, SNP position and annotation togenes used the cattle genome as a reference (UMD3.1assembly) because there is no public complete genomereference available for buffalos. The numbers of signifi-cant SNP were similar between traits, within significancethresholds (Table 5). They were also similar in numberto those obtained by studies that used low density SNPchips in cattle [12, 22].We described the data structure (Table 1) and have es-
timated heritabilities for the studied traits, which rangefrom 0.06 to 0.42 (Table 2). The genetic correlationsrange from −0.11 to 0.93 (Table 3). These parametersare reported as they underpin GWAS results and genenetwork predictions. Data structure awareness is import-ant context for GWAS common concerns: multiple test-ing and sample size limitations.The SNPs that explained most of the phenotypic vari-
ance indicated regions of the genome that have an influ-ence in the traits studied and indicate new candidategenes. Phenotypic variance percentage, positions andnearby genes were provided for these significant SNPs(Table 6). Significance of all the SNPs tested and per-centages of phenotypic variance explained were reportedas well (Additional file 1: Table S1).Association analyses for the reproductive traits re-
sulted in candidate genes for buffaloes that have knownroles in reproductive physiology. For age at first calving(AFC), the gene coding for interferon-Tau, IFN-TAU,and other interferon genes were identified. Embryonicproduction of IFN-TAU is the primary signal for mater-nal recognition of pregnancy in buffaloes [23]. Anothergene associated with AFC was LOC100299005 (SELP), agene with up-regulated expression during inflammatoryprocesses related to follicular atresia in cattle [24]. It isclear that modifications in the protein structure and/or
Table 5 Number of significant SNP at different p-values for each trait.
SNP p-value Traitsa
MP %F %P FP PP SCS AFC CI NSC OD
0.05 2991 2853 2938 2960 2896 2916 2894 3016 2976 2927
0.01 585 621 593 613 567 620 605 587 576 601
0.001 54 72 53 55 52 65 68 55 57 54aTraits: MPMilk production, %F fat percentage, %P protein percentage, FP fat production, PP protein production, SCS somatic cell score, AFC age at first calving,NSC number of services per conception, OD open days
de Camargo et al. BMC Genomics (2015) 16:872 Page 5 of 14
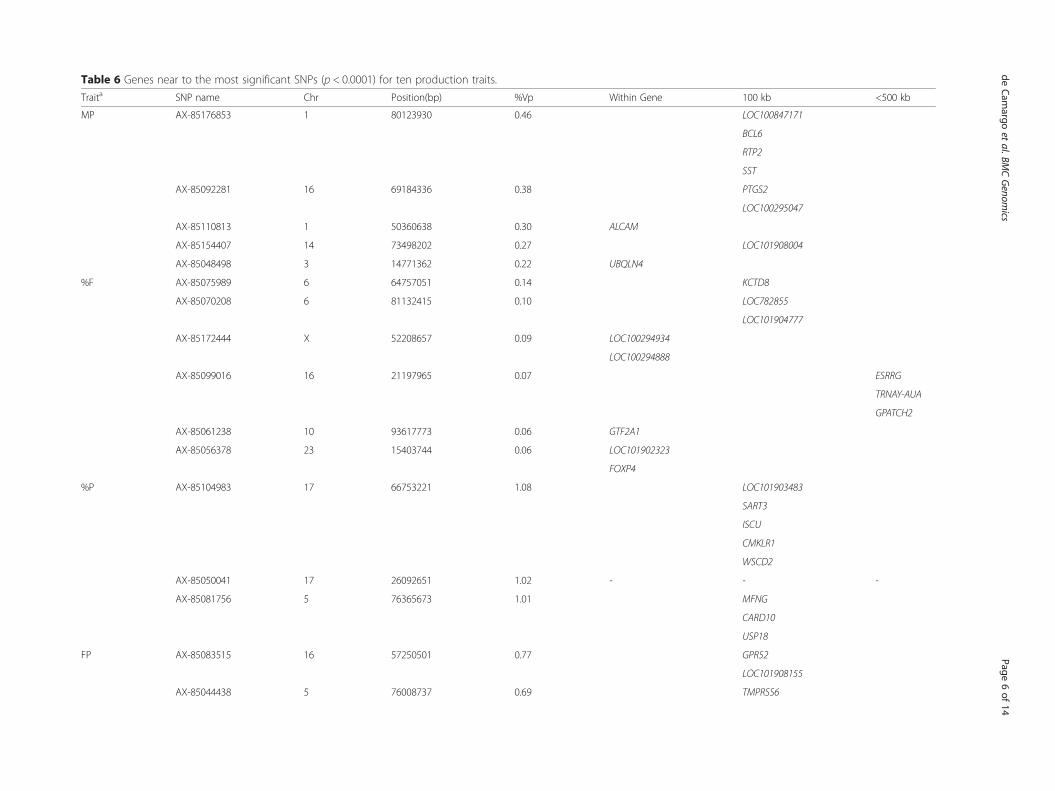
Table 6 Genes near to the most significant SNPs (p < 0.0001) for ten production traits.
Traita SNP name Chr Position(bp) %Vp Within Gene 100 kb <500 kb
MP AX-85176853 1 80123930 0.46 LOC100847171
BCL6
RTP2
SST
AX-85092281 16 69184336 0.38 PTGS2
LOC100295047
AX-85110813 1 50360638 0.30 ALCAM
AX-85154407 14 73498202 0.27 LOC101908004
AX-85048498 3 14771362 0.22 UBQLN4
%F AX-85075989 6 64757051 0.14 KCTD8
AX-85070208 6 81132415 0.10 LOC782855
LOC101904777
AX-85172444 X 52208657 0.09 LOC100294934
LOC100294888
AX-85099016 16 21197965 0.07 ESRRG
TRNAY-AUA
GPATCH2
AX-85061238 10 93617773 0.06 GTF2A1
AX-85056378 23 15403744 0.06 LOC101902323
FOXP4
%P AX-85104983 17 66753221 1.08 LOC101903483
SART3
ISCU
CMKLR1
WSCD2
AX-85050041 17 26092651 1.02 - - -
AX-85081756 5 76365673 1.01 MFNG
CARD10
USP18
FP AX-85083515 16 57250501 0.77 GPR52
LOC101908155
AX-85044438 5 76008737 0.69 TMPRSS6
deCam
argoet
al.BMCGenom
ics (2015) 16:872
Page6of
14

Table 6 Genes near to the most significant SNPs (p < 0.0001) for ten production traits. (Continued)
LOC510185
C1QTNF6
SSTR3
LOC101906944
RAC2
MIR1835
CYTH4
AX-85139912 23 50686128 0.61 SERPINB6
SERPINB9
SERPINB1
WRNIP1
LOC101904132
MYLK4
AX-85061966 9 15900553 0.59 IMPG1
AX-85105219 27 39157445 0.47 LRRC3B
PP AX-85174902 22 60177121 0.72 LOC101905145
AX-85051961 23 15787091 0.57 CCND3
AX-85110855 10 98773695 0.55 FLRT2
TRNAC-ACA
LOC101906220
LOC785091
SCS AX-85164456 16 71885776 0.004 PROX1
LOC100139281
TRNAG-CCC
RPS6KC1
AX-85093628 26 18748400 0.003 HOGA1
MORN4
PI4K2A
AVPI1
MARVELD1
ZFYVE27
SFRP5
deCam
argoet
al.BMCGenom
ics (2015) 16:872
Page7of
14
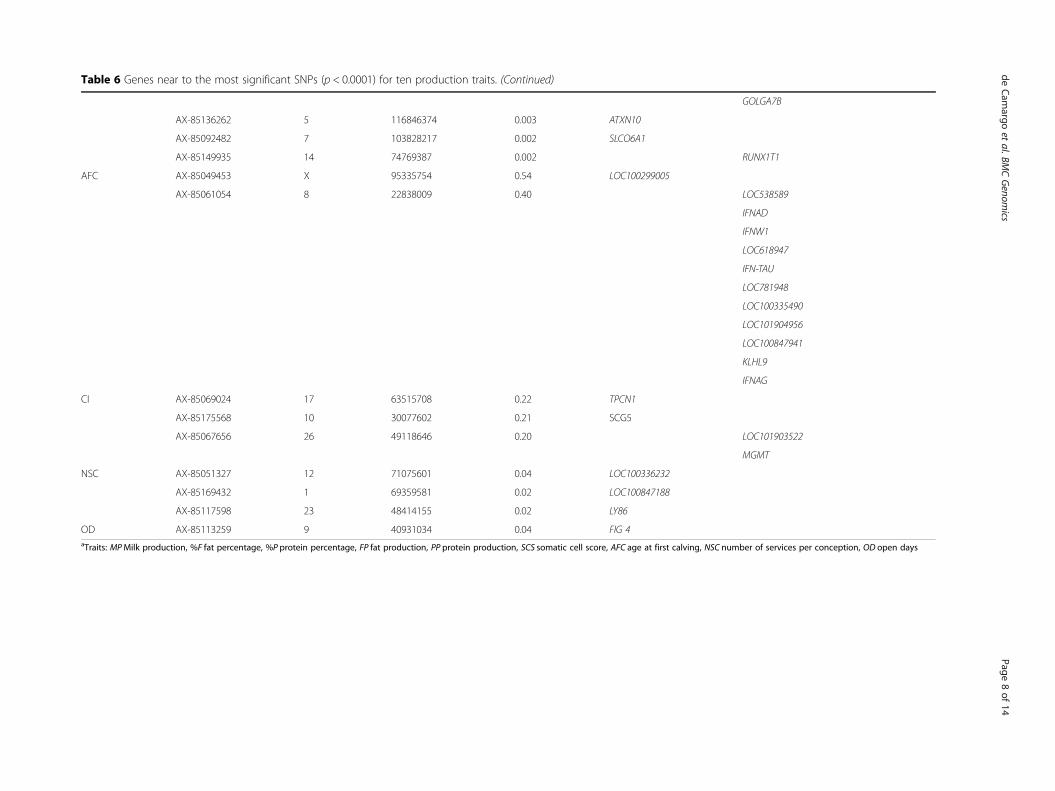
Table 6 Genes near to the most significant SNPs (p < 0.0001) for ten production traits. (Continued)
GOLGA7B
AX-85136262 5 116846374 0.003 ATXN10
AX-85092482 7 103828217 0.002 SLCO6A1
AX-85149935 14 74769387 0.002 RUNX1T1
AFC AX-85049453 X 95335754 0.54 LOC100299005
AX-85061054 8 22838009 0.40 LOC538589
IFNAD
IFNW1
LOC618947
IFN-TAU
LOC781948
LOC100335490
LOC101904956
LOC100847941
KLHL9
IFNAG
CI AX-85069024 17 63515708 0.22 TPCN1
AX-85175568 10 30077602 0.21 SCG5
AX-85067656 26 49118646 0.20 LOC101903522
MGMT
NSC AX-85051327 12 71075601 0.04 LOC100336232
AX-85169432 1 69359581 0.02 LOC100847188
AX-85117598 23 48414155 0.02 LY86
OD AX-85113259 9 40931034 0.04 FIG 4aTraits: MPMilk production, %F fat percentage, %P protein percentage, FP fat production, PP protein production, SCS somatic cell score, AFC age at first calving, NSC number of services per conception, OD open days
deCam
argoet
al.BMCGenom
ics (2015) 16:872
Page8of
14
in the expression levels of these genes could affect con-ception outcome and therefore impact on AFC [25, 26].SELP gene, mapped to chromosome X, had the most sig-nificant SNP associated to AFC. The sexual chromo-somes influence reproductive and andrological traits incattle [27–29], among others traits, such as SCS andmilk content in dairy cattle [30–33]. The results pre-sented here add to this list and encourage the inclusionof sexual chromosomes in GWAS to avoid missing im-portant information.For calving interval (CI), a gene involved in spermato-
zoa acrosome reaction in humans was identified: TPCN1[34]. Spermatozoa acrosome reaction is necessary forfertilization and tends to be studied in the context ofmale fertility. The association of TPCNI with CI suggestsan interesting thought: a gene related to male fertilitymight be more relevant to herd performance (in termsof CI) than genes related to female fertility. Increasedconception rates after calving, and, as consequence, de-creased CI may also reflect fertilization ability of bulls inthe studied population. As a complex trait, CI may beinfluenced by several component traits linked to bothmale and female fertility, including spermatozoa qualityandrological parameters [34].For number of services per conception (NSC), the top
gene found was LOC100336232 (ABCC4). This gene hasits expression increased in the endometrium of pregnantcows [36] and pigs [37] and seems to be important tosupport pregnancy since it acts on prostaglandin effluxfrom cells [36]. Prostaglandin has a variety of roles inreproduction being responsible for maternal recognitionof the pregnancy and conceptus implantation, processesthat closely related to NSC. Moreover, in a whole gen-ome re-sequencing of Hanwoo cattle, ABCC4 was iden-tified as the gene with the biggest number of non-synonymous SNPs, splice-site variants, and coding indels[37]. ABCC4 may be a useful source of variation to bestudied in buffaloes and cattle. In Angus cattle, theABCC4 expression was significantly correlated with re-sidual feed intake (RFI) [39], being up-regulated in highRFI animals. In Nelore cattle, a CNV within intron 22 ofABCC4 was correlated with marbling score [40]. Theemerging hypothesis is that ABCC4 acts in basic meta-bolic pathways and is highly polymorphic with potentialeffect in a variety of phenotypes (i.e. reproduction, meatquality, etc.).Gene ontology enrichment analyses were also per-
formed using GOrilla to compare the top genes associ-ated with the traits (P < 0.001) with a genome-widebackground gene list. For AFC and CI, many processesinvolving neural development and activity were listed(GO terms: GO:0048814 and GO:0021836 for AFC andGO:0050807, GO:0045666, GO:00501962, GO:0050769,GO:0051960, GO:0031290, GO:0051960, GO:0031290,
GO:0021819 for CI). There were other genes expressedin the central nervous system that were associated topuberty in female cattle [12, 22, 41]. The role of thesegenes in reproduction may be due to the neuronal activ-ity in the hypothalamus-pituitary axis, responsible forinitiating the hormone cascade that is a trigger for pu-berty followed by the initiation of the estrous cycle in fe-males [42]. It is reasonable to assume that genesinvolved with pubertal development and maintenance ofestrous cycle could be associated with AFC and CI.Regarding %F and FP, four genes related to the carbohy-
drate metabolism (KCTD8, FOXO4, SSTR3, LOC782855)and one gene related to lipid metabolism (ESRRG) wereidentified. The KCTD8 gene interacts with genes that actin the insulin secretion and glucagon liberation pathways,participating in the glucose absorption [43]. FOXO4 genedown-regulates gluconeogenesis and up-regulates glycoly-sis [44]. SSTR3 inhibits the activity of Glucose-dependentinsulinotropic polypeptide’s function in intestine, promot-ing the accumulation of glucose and fat [45]. LOC782855(RPS26) was related to diabetes in humans [46]. The asso-ciation of ESRRG to fat production in the present GWAScould be expected, since this gene regulates other adipo-genic genes [47]. In cattle, ESRRG was also considered akey regulator of puberty in a multi-trait analyses that in-cluded fat deposition traits [12]. Most of the top genes as-sociated with fat percentage and fat production integratethe carbohydrate metabolism and not the lipid metabol-ism as in cattle [48, 49]. This fact could suggest some dif-ferences between buffalo and cattle fat production in milk.On average, buffaloes have higher contents of milk fatthan cattle. In buffaloes the percentage of milk fat rangesfrom 6.7 % to 12.0 % [11, 50–52], while in cattle it rangesfrom 3.1 % to 4.5 % [53, 54]. The difference in milk fatmight be explained by a more efficient acetate metabolismto produce lipids in buffaloes, as the results suggest. Incomparison to cattle and under same high fibber diet,buffaloes have a higher average daily gain [55]. It meansthat buffaloes have a better capacity to digest fibbercontent in rumen. Fibber fermentation generates acetate,a fat precursor [56]. This characteristic might generate abigger contribution of genes related to acetic acidmetabolism in the fat production traits in buffaloes,differentiating considerably cattle and buffalo metabolismfor fat milk content [56].SNP associations with milk protein production sug-
gested CCND3 as a candidate gene in buffaloes. Thisgene has a role in alveolar development in the mammarygland, in cooperation with prolactin [57]. Variances inthe biological activity of protein coded by CCND3 mayaffect the structure and/or physiology of the alveolus.Milk production is a function of blood circulation in themammary alveolus. Other genes, whose physiological ac-tivity is within the alveolus, were already correlated with
de Camargo et al. BMC Genomics (2015) 16:872 Page 9 of 14
milk content in buffaloes [58]. Now, CCND3 has beenadded to the list with specific implications for milk pro-tein content.Gene ontology enrichment analyses were also carried
for production traits. For the somatic cells score (SCS),the biological process of regulation of lymphocyte migra-tion was significant (GO:2000401). This immunologicalmetabolic process is correlated with SCS because thistrait is used as an indirect measure of mastitis which se-verely diminishes milk production. Buffaloes with amore efficient immune system (better variants for genesthat regulate lymphocyte migration) might do better inavoiding the disease.Buffalo and cattle chromosomes have an extensive
similarity and 84 % of cattle markers were successfullyused in buffaloes [7]. However, despite good examples ofputative candidate genes reported herein (mainly ob-tained due to the similarities), many genes that were as-sociated to milk production traits have no known role inmilk production. Some of these genes are described ashaving a role in basic metabolism and many are notcharacterized at all. The associations presented hereopen the door to study these genes in the context ofmilk production. It also reinforces that basic research tocharacterize and identify the function of the genes is stillnecessary, especially in buffaloes. According to [59],there are only 493 annotated genes in buffalo. The regu-lar number of genes in mammalian genomes is around20,000, so the discrepancy is evident. Moreover, rear-rangements and inversions in the cattle homologuechromosomes complicate the annotation of buffalogenes [60]. A species specific genome reference for buf-falo is needed.The identification of genes with pleiotropic effects
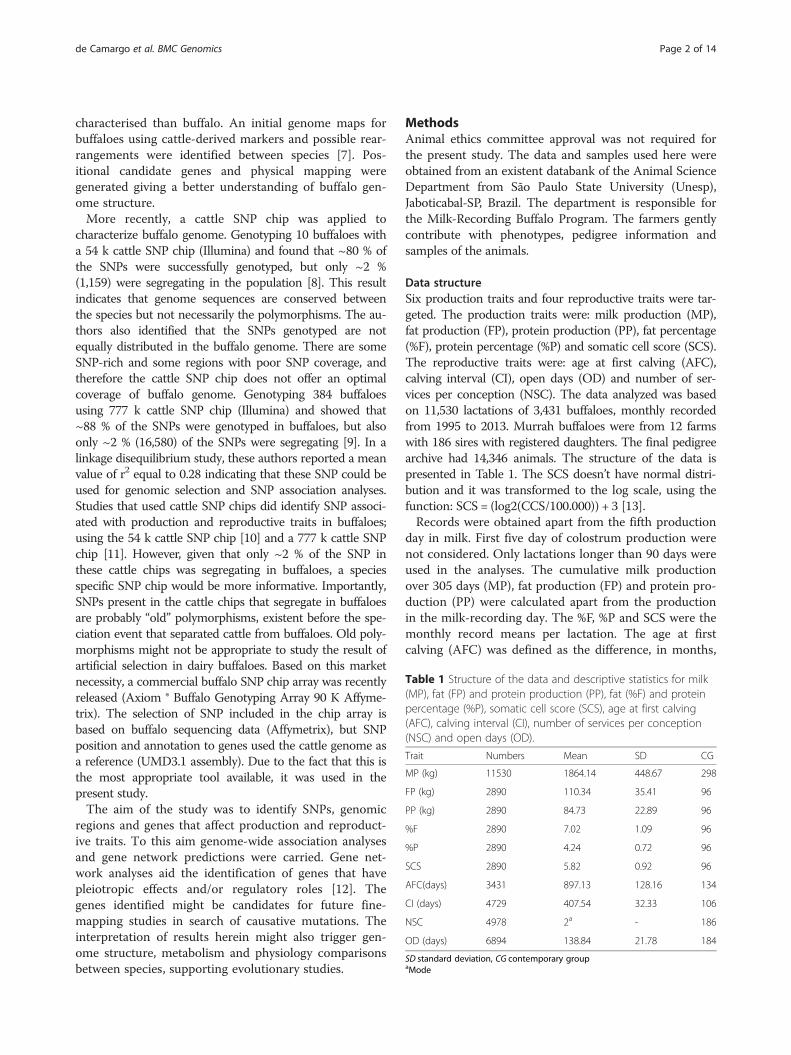
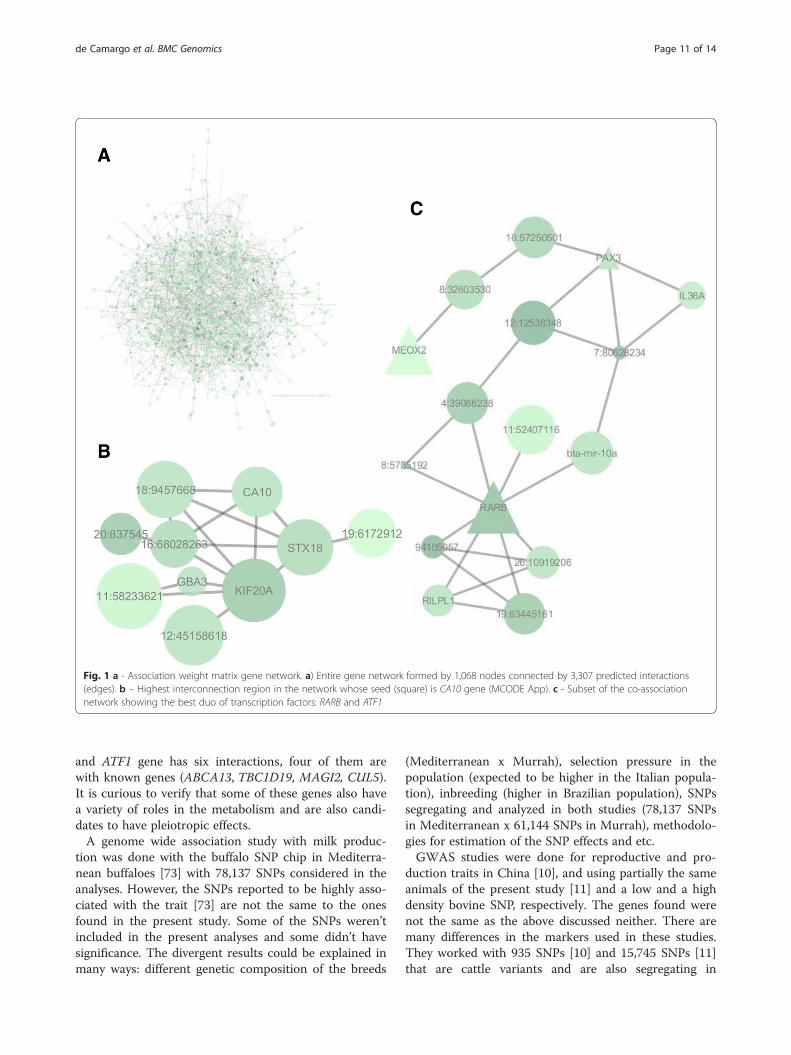
could contribute to the genetic evaluation of many traits.An example of a gene with important pleiotropic effectsis PLAG1 in cattle [61]. To identify genes with a pleio-tropic effect and regulatory role in buffaloes, we pre-dicted a gene network from the ten studied traits. Thegene network was visualized using Cytoscape software.Data from 1,723 SNPs were used in network predictions,selected SNP were associated with the majority of traits.Of these, a total of 608 SNPs were identified to be closeor within a gene or a known transcript. The SNPs, thatdidn’t have a gene close to them, remained on the net-work as nodes named after their chromosome position.The final gene network had 1068 nodes and 3307 edges.The nodes interactions varied from 23 to 1 with an aver-age of 3.9 interactions per node (Fig. 1a).A SNP located in C14H8orf34 gene was a central node
of the network, having 23 predicted interactions. Infor-mation about this gene is scarce; however some indica-tions of its function and pleiotropic effect might bediscussed. SNPs in this gene were associated, in humans,
with “fasting serum aspartate aminotransferase” and“urinary free epinephrine excretion per day” [62]. Someconsiderations might be done concerning these pheno-types. Aspartate aminotransferase is a test carried tocheck for liver damage [63]. The liver has more than 400functions and participates in the general metabolism. Agene with a liver function would be a logical candidatefor pleiotropic or regulatory roles. The association ofC14H8orf34 with epinephrine production may also sup-port a pleiotropy claim. Epinephrine is a hormone and aneurotransmitter synthesized in the adrenal glands thatacts via many pathways to accelerate metabolism understress situations [64].With the aim to find high interconnected regions,
termed clusters, further analyses were carried usingMCode App (Cystoscape). The first cluster had CA10 asits seed (Fig. 1b). The function of CA10 is the inter-conversion between carbon dioxide and bicarbonate,with essential physiological function in many tissues[65]. In humans, SNPs in CA10 were related to menar-che, weight and body mass index [66, 67]. The associ-ation of this gene with growth and reproductive traitsreinforces the wide effect and supports the findingsherein. In this context, CA10 might be a regulator of fatmetabolism and reproductive development in buffaloes.Transcription factor (TF) genes, a total of 28 in the
network, also had their clusters mined for regulatory in-formation. Genes that work as TF are important interms of pleiotropy effect since they can guide transcrip-tion and interact with many other genes. The TF withhighest number of predicted interactions was RARB, aretinoic acid receptor important for cell growth and dif-ferentiation [68]. RARB is expressed in many tissuesfrom liver and intestine [69] to sperm [70] in cattle. Thegene seems also to be a very important for bovine mam-mary gland cell viability [68]. Studies of cell cycle andapoptotic events in mammary glands [68] suggests thatthe role RARB in its development is expressive. Consid-ering the traits herein analysed, six out of ten traits ana-lysed are related to the udder and its physiology, so thefinding of a TF that has a crucial role in its developmentas a central regulator in the network is plausible (Fig. 1c).The TF gene with the second largest number of con-
nections in the network was ATF1. This gene regulatesother genes involved in growth and survival and was as-sociated with angiogenesis in the mammary gland [71].Milk is derived from blood due to difference of pressurein the alveolus. A suitable explanation is that the bettervascularised the alveolus are, the bigger is the milk andcontents production, resulting in a suitable explanation.This gene was also indicated as a key TF for meat quality[72] (Fig. 1c).The RARB gene has eight interactions, three of them
are with known genes (RILPL1, bta-mir-10a, PRKCA)
de Camargo et al. BMC Genomics (2015) 16:872 Page 10 of 14
and ATF1 gene has six interactions, four of them arewith known genes (ABCA13, TBC1D19, MAGI2, CUL5).It is curious to verify that some of these genes also havea variety of roles in the metabolism and are also candi-dates to have pleiotropic effects.A genome wide association study with milk produc-
tion was done with the buffalo SNP chip in Mediterra-nean buffaloes [73] with 78,137 SNPs considered in theanalyses. However, the SNPs reported to be highly asso-ciated with the trait [73] are not the same to the onesfound in the present study. Some of the SNPs weren’tincluded in the present analyses and some didn’t havesignificance. The divergent results could be explained inmany ways: different genetic composition of the breeds
(Mediterranean x Murrah), selection pressure in thepopulation (expected to be higher in the Italian popula-tion), inbreeding (higher in Brazilian population), SNPssegregating and analyzed in both studies (78,137 SNPsin Mediterranean x 61,144 SNPs in Murrah), methodolo-gies for estimation of the SNP effects and etc.GWAS studies were done for reproductive and pro-
duction traits in China [10], and using partially the sameanimals of the present study [11] and a low and a highdensity bovine SNP, respectively. The genes found werenot the same as the above discussed neither. There aremany differences in the markers used in these studies.They worked with 935 SNPs [10] and 15,745 SNPs [11]that are cattle variants and are also segregating in
Fig. 1 a - Association weight matrix gene network. a) Entire gene network formed by 1,068 nodes connected by 3,307 predicted interactions(edges). b – Highest interconnection region in the network whose seed (square) is CA10 gene (MCODE App). c - Subset of the co-associationnetwork showing the best duo of transcription factors: RARB and ATF1
de Camargo et al. BMC Genomics (2015) 16:872 Page 11 of 14
buffaloes. These markers should exist before the differ-entiation of the species. In the present work, the densityof the SNPs is much higher (61,144 markers) and the se-lection of them based on buffaloes data. Differences inSNPs used may explain the contrasting results. The bo-vine SNP chip does not cover the buffalo genome withthe same efficiency, even if the species are close in evo-lution terms. The use of cross-species SNP chips mightnot be as informative as initially proposed [59]. Even ifthe DNA sequences are similar, the functional variantsmay not be, as suggested before [8] and [10]. The inter-esting candidate genes discussed herein resulted fromsignificant SNP and are largely supported by the litera-ture in terms of its biological function. These promisingGWAS results emphasize the importance of selectingSNP that are species specific.Dairy cattle GWAS of varying breeds and traits were
further evidence for species differences when comparedto results herein [30, 32, 33, 49, 74–79]. Only one SNP(rs41610147) was associated with three fertility traits inDanish Holstein cattle (female fertility index, intervalfrom calving to first insemination, days from first to lastinsemination in heifers) [76] and was located in an asso-ciation region in buffaloes. The SNP (rs41610147) in cat-tle is 398 bp far from the second most significant SNPassociated with NSC in buffaloes. These SNPs may beindicating the same causative mutation or major geneassociated to reproductive physiology in both species. Itis possible to conclude that despite high genome hom-ology between buffalo and cattle, the contribution andinfluence of genes and variants to studied traits is mostlydifferent. Candidate genes that might be buffalo-specificcould be explained by the presence of underpinningcausative mutations that are not found in cattle. Someexamples of divergent time of genes between the specieswere discussed before [59].Comparing different breeds of the same species
already results in differences regarding associated genesand the proportion of phenotypic variance that they ex-plain [80, 81]. These differences might be explained byepistatic effects, selection pressure, different environ-ment, recombination rate, effective population size, al-lelic frequencies differences, genome coverage by theSNP chip etc. Logically, if differences are found betweenbreeds of the same species, comparing different speciescan only result in stronger contrast.Species-specific technologies are important and needs
to be further developed. Particularly, for the buffalo spe-cies, the lack of a publicly available complete and anno-tated genome complicates the advance and developmentof new methodologies for genetic evaluation for thespecie.The genes identified in this study are candidates for
fine-mapping with the aim to find putative causative
mutations. The incorporation of this information in alow density SNP chip is informative and auxiliary to gen-etic evaluation, with cost-benefit for producers. Theidentification of causative mutations reduces the needfor tag SNP (in linkage disequilibrium with causativemutations), promotes higher accuracy for genomicbreeding values, which can persist over generations andpermits a higher transferability across breeds [82]. Theresults presented expand our knowledge and indicate re-gions for possible genes not yet annotated in buffaloes,but potentially important. It also serves as basis for fur-ther functional genes studies.
ConclusionThe present article is a genome wide association andgene network analyses in buffaloes using a SNP chipspecifically developed for the species. Putative genes forproduction and reproductive traits were found and theseare candidates for searching causative mutations. Com-parative analyses between cattle and buffaloes supportthat although the genome sequence is similar, the vari-ants between them are different. Evidence that species-specific technology should be developed for buffaloeswas presented discussed herein.
Additional file
Additional file 1: Table S1. P-values, allelic substitution effect andpercentage of phenotypic genetic variance of the SNPs used in theGWAS for the ten traits in dairy buffaloes. (XLSX 30.7 mb)
Abbreviations%F: Fat percentage; %P: Protein percentage; AFC: Age at first calving;AWM: Association weight matrix; CG: Contemporary group; CI: Calvinginterval; CNV: Copy number variation; DEBV: De-regressed breeding values;FP: Fat production; GLS: Generalized least square; GO: Gene ontology;GWAS: Genome-wide association study; MP: Milk production; NCBI: NationalCenter for Biotechnology Information; NSC: Number of services perconception; OD: Open days; PCIT: Partial correlation and information theory;PP: Protein production; REML: Restricted Maximum Likelihood method;RFI: Residual feed intake; SCS: Somatic cell score; SNP: Single nucleotidepolymorphism; TF: Transcription factor; VEP: Variant Effect Predictor;Vp: Phenotypic variance.
Competing interestsThe authors declare that they have no competing interests.
Author’s contributionsHT, RRAB, GMFC, MRSF and LRPN conceived the study and structured theanalyses. RRAB and DJAS did the genomewide association analyses. MRSFand LRPN did the meta-analyses and genenetwork analyses. GMFC wrote themanuscript and participated in the analyses. DFC, SAL, AR and SSM participatedin the analyses and contributed to the discussion. All the authors have read andapproved the manuscript.
AcknowledgmentsThe work was supported by Fundação de Amparo à Pesquisa do Estado deSão Paulo (Fapesp), grant 2010/20887-1 and for the scholarship of the firstauthor 2013/12851-5. We thank the farmers for allowing sampling theanimals.
de Camargo et al. BMC Genomics (2015) 16:872 Page 12 of 14
Author details1Universidade Estadual Paulista (Unesp), Faculdade de Ciências Agrárias eVeterinárias, Departamento de Zootecnia, Via de acesso Professor PauloDonato Castelane, Jaboticabal, SP 14884-900, Brazil. 2School of Chemistry andMolecular Bioscience, The University of Queensland, St Lucia, Brisbane, QLD4072, Australia. 3Commonwealth Scientific and Industrial ResearchOrganization, Agriculture Flagship, St Lucia, Brisbane, QLD 4072, Australia.4Queensland Alliance for Agriculture and Food Innovation, Centre for AnimalScience, The University of Queensland, Brisbane, QLD 4067, Australia.
Received: 11 March 2015 Accepted: 6 October 2015
References1. Gallagher Jr DS, Womack JE. Chromosome conservation in the Bovidae.
J Hered. 1992;83(4):287–98.2. Harisah M, Azmi TI, Hilmi M, Vidyadaran MK, Bongso TA, Nava ZM, et al.
Identification Of Crossbred Buffalo Genotypes And Their ChromosomeSegregation Patterns. Genome. 1989;32(6):999–1002.
3. Iannuzzi L, Di Meo GP, Perucatti A, Schibler L, Incarnato D, Gallagher D, et al.The river buffalo (Bubalus bubalis, 2n = 50) cytogenetic map: assignment of64 loci by fluorescence in situ hybridization and R-banding. CytogenetGenome Res. 2003;102(1–4):65–75.
4. Tantia MS, Vijh RK, Bhasin V, Sikka P, Vij PK, Kataria RS, et al. Whole-genomesequence assembly of the water buffalo (Bubalus bubalis). Indian J AnimSci. 2011;81(5):465–73.
5. Zimin AMG, Ferre F, Biagini T, Shroeder S. The Buffalo Reference GenomeAssembly. San Diego: XXI Plant and Animal Genome; 2013.
6. Strozzi FPM, Iamartino D, Ferre F, Chillemi G, Zimin A, Williams J. The BuffaloTranscriptome. San Diego: XXI Plant and Animal Genome; 2013.
7. Amaral MEJ, Grant JR, Riggs PK, Stafuzza NB, Rodrigues Filho EA,Goldammer T, et al. A first generation whole genome RH map of the riverbuffalo with comparison to domestic cattle. BMC Genomics. 2008;9:631.
8. Michelizzi VN, Dodson MV, Pan Z, Amaral MEJ, Michal JJ, McLean DJ, et al.Water Buffalo Genome Science Comes of Age. Int J Biol Sci. 2010;6(4):333–49.
9. Borquis RRA, Baldi F, de Camargo GMF, Cardoso DF, Santos DJA, Lugo NH,et al. Water buffalo genome characterization by the Illumina BovineHDBeadChip. Genet Mol Res. 2014;13(2):4202–15.
10. Wu JJ, Song LJ, Wu FJ, Liang XW, Yang BZ, Wathes DC, et al. Investigationof transferability of BovineSNP50 BeadChip from cattle to water buffalo forgenome wide association study. Mol Biol Rep. 2013;40(2):743–50.
11. Venturini GC, Cardoso DF, Baldi F, Freitas AC, Aspilcueta-Borquis RR, SantosDJA, et al. Association between single-nucleotide polymorphisms and milkproduction traits in buffalo. Genet Mol Res. 2014;13(4):10256–68.
12. Fortes MRS, Reverter A, Zhang Y, Collis E, Nagaraj SH, Jonsson NN, et al.Association weight matrix for the genetic dissection of puberty in beefcattle. Proc Natl Acad Sci U S A. 2010;107(31):13642–7.
13. Dabdoub SM, Shook GE. Phenotypic relations among milk yield, somaticcount cells, and mastitis. J Dairy Sci. 1984;67:163–4.
14. Karin M. WOMBAT - A tool for mixed model analyses in quantitativegenetics by restricted maximum likelihood (REML). J Zhejiang Univ Sci B.2007;8(11):815–21.
15. Garrick DJ, Taylor JF, Fernando RL. Deregressing estimated breeding valuesand weighting information for genomic regression analyses. Genet Sel Evol.2009;41:55.
16. Aulchenko YS, Ripke S, Isaacs A, Van Duijn CM. GenABEL: an R library forgenorne-wide association analysis. Bioinformatics. 2007;23(10):1294–6.
17. Wald A. Tests f statistical hypotheses concerning several parameters whenthe number of observations is large. Trans Am Math Soc. 1943;54:426–82.
18. Bolormaa S, Pryce JE, Reverter A, Zhang Y, Barendse W, Kemper K, et al.A Multi-Trait, Meta-analysis for Detecting Pleiotropic Polymorphisms forStature, Fatness and Reproduction in Beef Cattle. Plos Genetics. 2014;10:3.
19. Reverter A, Chan EKF. Combining partial correlation and an informationtheory approach to the reversed engineering of gene co-expressionnetworks. Bioinformatics. 2008;24(21):2491–7.
20. Shannon P, Markiel A, Ozier O, Baliga NS, Wang JT, Ramage D, et al.Cytoscape: A software environment for integrated models of biomolecularinteraction networks. Genome Res. 2003;13(11):2498–504.
21. Bader GD, Hogue CW. An automated method for finding molecularcomplexes in large protein interaction networks. BMC Bioinformatics.2003;4:27.
22. Hawken RJ, Zhang YD, Fortes MRS, Collis E, Barris WC, Corbet NJ, et al.Genome-wide association studies of female reproduction in tropicallyadapted beef cattle. J Anim Sci. 2012;90(5):1398–410.
23. Chethan SG, Singh SK, Nongsiej J, Rakesh HB, Singh RP, Kumar N, et al.IFN-tau Acts in a Dose-Dependent Manner on Prostaglandin Production byBuffalo Endometrial Stromal Cells Cultured in vitro. Reprod Domest Anim.2014;49(3):403–8.
24. Hayashi K-G, Ushizawa K, Hosoe M, Takahashi T. Differential genome-widegene expression profiling of bovine largest and second-largest follicles:identification of genes associated with growth of dominant follicles. ReprodBiol Endocrinol. 2010;8:11.
25. de Camargo GMF, Costa RB, de Albuquerque LG, Regitano LCD, Baldi F,Tonhati H. Association between JY-1 gene polymorphisms and reproductivetraits in beef cattle. Gene. 2014;533(2):477–80.
26. Killeen AP, Morris DG, Kenny DA, Mullen MP, Diskin MG, Waters SM. Globalgene expression in endometrium of high and low fertility heifers during themid-luteal phase of the estrous cycle. BMC Genomics. 2014;15.
27. Fortes MRS, Lehnert SA, Bolormaa S, Reich C, Fordyce G, Corbet NJ, et al.Finding genes for economically important traits: Brahman cattle puberty.Anim Prod Sci. 2012;52(2–3):143–50.
28. McDaneld TG, Kuehn LA, Thomas MG, Snelling WM, Smith TPL, Pollak EJ,et al. Genomewide association study of reproductive efficiency in femalecattle. J Anim Sci. 2014;92(5):1945–57.
29. de Camargo GMF, Porto-Neto LR, Kelly MJ, Bunch RJ, McWilliam SM, Tonhati H,et al. Non-synonymous mutations mapped to chromosome X associated withandrological and growth traits in beef cattle. BMC Genomics. 2015;384:384.
30. Abdel-Shafy H, Bortfeldt RH, Tetens J, Brockmann GA. Single nucleotidepolymorphism and haplotype effects associated with somatic cell score inGerman Holstein cattle. Genet Sel Evol. 2014;46:35.
31. Bouwman AC, Visker MHPW, van Arendonk JAM, Bovenhuis H. Genomicregions associated with bovine milk fatty acids in both summer and wintermilk samples. BMC Genet. 2012;13:1–13.
32. Strucken EM, Bortfeldt RH, de Koning DJ, Brockmann GA. Genome-wideassociations for investigating time-dependent genetic effects for milkproduction traits in dairy cattle. Anim Genet. 2012;43(4):375–82.
33. Jiang L, Liu J, Sun D, Ma P, Ding X, Yu Y, et al. Genome Wide Association Studiesfor Milk Production Traits in Chinese Holstein Population. PLoS One. 2010;5:10.
34. Arndt L, Castonguay J, Arlt E, Meyer D, Hassan S, Borth H, et al. NAADP andthe two-pore channel protein 1 participate in the acrosome reaction inmammalian spermatozoa. Mol Biol Cell. 2014;25(6):948–64.
35. Kennedy CE, Krieger KB, Sutovsky M, Xu W, Vargovic P, Didion BA, et al.Protein Expression Pattern of PAWP in Bull Spermatozoa Is Associated WithSpermQuality and Fertility Following Artificial Insemination. Mol ReprodDev. 2014;81(5):436–49.
36. Spencer TE, Forde N, Dorniak P, Hansen TR, Romero JJ, Lonergan P.Conceptus-derived prostaglandins regulate gene expression in theendometrium prior to pregnancy recognition in ruminants. Reproduction.2013;146(4):377–87.
37. Seo H, Choi Y, Shim J, Yoo I, Ka H. Prostaglandin Transporters ABCC4 andSLCO2A1 in the Uterine Endometrium and Conceptus During Pregnancy inPigs. Biol Reprod. 2014;90:5.
38. Lee K-T, Chung W-H, Lee S-Y, Choi J-W, Kim J, Lim D, et al. Whole-genomeresequencing of Hanwoo (Korean cattle) and insight into regions ofhomozygosity. BMC Genomics. 2013;14:519.
39. Chen Y, Arthur PF, Barchia IM, Quinn K, Parnell PF, Herd RM. Using geneexpression information obtained by quantitative real-time PCR to evaluateAngus bulls divergently selected for feed efficiency. Anim Prod Sci.2012;52(11):1058–67.
40. Feitosa FLB, Pereira ASC, Venturini GC, Tonussi RL, Espigolan R, Gordo DM,et al. Genome wide association study between copy number variationregions with marbling score in Nelore cattle. In: Proceedings, 10th WorldCongress of Genetics Applied to Livestock Production. Vancouver. 2014.
41. Fortes MRS, Snelling WM, Reverter A, Nagaraj SH, Lehnert SA, Hawken RJ,et al. Gene network analyses of first service conception in Brangus heifers:Use of genome and trait associations, hypothalamic-transcriptomeinformation, and transcription factors. J Anim Sci. 2012;90(9):2894–906.
42. Bliss SP, Navratil AM, Xie J, Roberson MS. GnRH signaling, the gonadotropeand endocrine control of fertility. Front Neuroendocrinol. 2010;31(3):322–40.
43. Al Safar HS, Cordell HJ, Jafer O, Anderson D, Jamieson SE, Fakiola M, et al.A Genome-Wide Search for Type 2 Diabetes Susceptibility Genes in anExtended Arab Family. Ann Hum Genet. 2013;77:488–503.
de Camargo et al. BMC Genomics (2015) 16:872 Page 13 of 14
44. Xiong X, Tao R, DePinho RA, Dong XC. Deletion of Hepatic FoxO1/3/4Genes in Mice Significantly Impacts on Glucose Metabolism throughDownregulation of Gluconeogenesis and Upregulation of Glycolysis. PLoSOne. 2013;8:8.
45. Moss CE, Marsh WJ, Parker HE, Ogunnowo-Bada E, Riches CH, Habib AM,et al. Somatostatin receptor 5 and cannabinoid receptor 1 activation inhibitsecretion of glucose-dependent insulinotropic polypeptide from intestinal Kcells in rodents. Diabetologia. 2012;55(11):3094–103.
46. Plagnol V, Smyth DJ, Todd JA, Clayton DG. Statistical independence of thecolocalized association signals for type 1 diabetes and RPS26 geneexpression on chromosome 12q13. Biostatistics. 2009;10(2):327–34.
47. Kubo M, Ijichi N, Ikeda K, Horie-Inoue K, Takeda S, Inoue S. Modulation ofadipogenesis-related gene expression by estrogen-related receptor gammaduring adipocytic differentiation. Biochimica Et Biophysica Acta-GeneRegulatory Mechanisms. 2009;1789(2):71–7.
48. Wang X, Wurmser C, Pausch H, Jung S, Reinhardt F, Tetens J, et al.Identification and Dissection of Four Major QTL Affecting Milk Fat Contentin the German Holstein-Friesian Population. PLoS One. 2012;7:7.
49. Raven L-A, Cocks BG, Hayes BJ. Multibreed genome wide association canimprove precision of mapping causative variants underlying milkproduction in dairy cattle. BMC Genomics. 2014;15:62.
50. Pirlo G, Terzano G, Pacelli C, Abeni F, Care S. Carbon footprint of milkproduced at Italian buffalo farms. Livest Sci. 2014;161:176–84.
51. Mihaiu M, Lapusan A, Bele C, Mihaiu R, Dan S, Taulescu CM. CompositionalParticularities of the Murrah Hybrid Buffalo Milk and its Suitability forProcessing in the Traditional System of Romania. Bull UASVM Vet Med.2011;2:68.
52. Aspilcueta-Borquis RR, Di Palo R, Araujo Neto FR, Baldi F, de Camargo GMF,de Albuquerque LG, et al. Genetic parameter estimates for buffalo milkyield, milk quality and mozzarella production and Bayesian inferenceanalysis of their relationships. Genet Mol Res. 2010;9(3):1636–44.
53. Cui X, Hou Y, Yang S, Xie Y, Zhang S, Zhang Y, et al. Transcriptional profilingof mammary gland in Holstein cows with extremely different milk proteinand fat percentage using RNA sequencing. BMC Genomics. 2014;15:226.
54. Bernabucci U, Biffani S, Buggiotti L, Vitali A, Lacetera N, Nardone A. Theeffects of heat stress in Italian Holstein dairy cattle. J Dairy Sci.2014;97(1):471–86.
55. Lapitan RM, Del Barrio AN, Katsube O, Ban-Tokuda T, Orden EA, Robles AY,et al. Comparison of fattening performance in Brahman grade cattle(Bos indicus) and crossbred water buffalo (Bubalus bubalis) fed on highroughage diet. Anim Sci J. 2008;79(1):76–82.
56. Li X, Chen H, Guan Y, Li X, Lei L, Liu J, et al. Acetic Acid Activates theAMP-Activated Protein Kinase Signaling Pathway to Regulate LipidMetabolism in Bovine Hepatocytes. PLoS One. 2013;8:7.
57. Asher JM, O'Leary KA, Rugowski DE, Arendt LM, Schuler LA. ProlactinPromotes Mammary Pathogenesis Independently from Cyclin D1. Am JPathol. 2012;181(1):294–302.
58. Araujo DN, de Camargo GM F, da Silva Fonseca PD, Cardoso DF,Hurtado-Lugo NA, Aspilcueta-Borquis RR, et al. Polymorphisms in Oxytocinand alpha(1a) Adrenergic Receptor Genes and Their Effects on ProductionTraits in Dairy Buffaloes. Anim Biotechnol. 2015;26(3):165–8.
59. Moaeen-ud-Din M, Bilal G. Sequence diversity and molecular evolutionaryrates between buffalo and cattle. J Anim Breed Genet. 2015;132(1):74–84.
60. El Nahas SM, Abou Mossallam AA, Mahfouz ER, Bibars MA, Sabry N, SeifEl-Din S, et al. Radiation hybrid map of buffalo chromosome 7 detects atelomeric inversion compared to cattle chromosome 6. Anim Genet.2014;45(5):762–3.
61. Fortes MRS, Kemper K, Sasazaki S, Reverter A, Pryce JE, Barendse W, et al.Evidence for pleiotropism and recent selection in the PLAG1 region inAustralian Beef cattle. Anim Genet. 2013;44(6):636–47.
62. Comuzzie AG, Cole SA, Laston SL, Voruganti VS, Haack K, Gibbs RA, et al.Novel Genetic Loci Identified for the Pathophysiology of Childhood Obesityin the Hispanic Population. PLoS One. 2012;7:12.
63. Zheng X-N, Wang X-W, Li L-Y, Xu Z-W, Huang H-Y, Zhao J-S, et al. Pu-erhTea Powder Preventive Effects on Cisplatin-Induced Liver Oxidative Damagein Wistar Rats. Asian Pac J Cancer Prev. 2014;15(17):7389–94.
64. Straub RH, Cutolo M. Involvement of the hypothalamic-pituitary-adrenal/gonadal axis and the peripheral nervous system in rheumatoid arthritis -Viewpoint based on a systemic pathogenetic role. Arthritis Rheum.2001;44(3):493–507.
65. Pastorekova S, Parkkila S, Pastorek J, Supuran CT. Carbonic anhydrases:Current state of the art, therapeutic applications and future prospects.J Enzyme Inhib Med Chem. 2004;19(3):199–229.
66. Tu W, Wagner EK, Eckert GJ, Yu Z, Hannon T, Pratt JH, et al. AssociationsBetween Menarche-Related Genetic Variants and Pubertal Growth in Maleand Female Adolescents. J Adolesc Health. 2015;56(1):66–72.
67. Tanikawa C, Okada Y, Takahashi A, Oda K, Kamatani N, Kubo M, et al.Genome Wide Association Study of Age at Menarche in the JapanesePopulation. PLoS One. 2013;8:5.
68. Wang Y, Baumrucker CR. Retinoids, retinoid analogs, and lactoferrin interactand differentially affect cell viability of 2 bovine mammary cell types invitro. Domest Anim Endocrinol. 2010;39(1):10–20.
69. Kruger KA, Blum JW, Greger DL. Expression of nuclear receptor and targetgenes in liver and intestine of neonatal calves fed colostrum and vitamin A.J Dairy Sci. 2005;88(11):3971–81.
70. Kasimanickam VR, Kasimanickam RK, Rogers HA. Immunolocalization ofretinoic acid receptor-alpha, −beta, and -gamma, in bovine and caninesperm. Theriogenology. 2013;79(6):1010–8.
71. Jones DT, Lechertier T, Mitter R, Herbert JMJ, Bicknell R, Jones JL, et al. GeneExpression Analysis in Human Breast Cancer Associated Blood Vessels. PLoSOne. 2012;7:10.
72. Ramayo-Caldas Y, Fortes MRS, Hudson NJ, Porto-Neto LR, Bolormaa S,Barendse W, et al. A marker-derived gene network reveals the regulatoryrole of PPARGC1A, HNF4G, and FOXP3 in intramuscular fat deposition ofbeef cattle. J Anim Sci. 2014;92(7):2832–45.
73. Iamartino D, Williams JL, Sonstegard T, Reecy J, Van Tassell C, Nicolazzi EL,et al. The Buffalo Genome and the Application of Genomics in AnimalManagement and Improvement. Buffalo Bull. 2013;32:151–8.
74. Meredith BK, Berry DP, Kearney F, Finlay EK, Fahey AG, Bradley DG, et al. Agenome-wide association study for somatic cell score using the Illuminahigh-density bovine beadchip identifies several novel QTL potentiallyrelated to mastitis susceptibility. Front Genet. 2013;4:229. Article No.: 229.
75. Strillacci MG, Frigo E, Schiavini F, Samore AB, Canavesi F, Vevey M, et al.Genome-wide association study for somatic cell score in Valdostana RedPied cattle breed using pooled DNA. BMC Genet. 2014;15:106.
76. Hoglund JK, Sahana G, Guldbrandtsen B, Lund MS. Validation of associationsfor female fertility traits in Nordic Holstein, Nordic Red and Jersey dairycattle. BMC Genet. 2014;15:8.
77. Guo J, Jorjani H, Carlborg O. A genome-wide association study usinginternational breeding-evaluation data identifies major loci affectingproduction traits and stature in the Brown Swiss cattle breed. BMC Genet.2012;13:82.
78. Hoglund JK, Guldbrandtsen B, Lund MS, Sahana G. Analyzes of genome-wide association follow-up study for calving traits in dairy cattle. BMCGenet. 2012;13:71.
79. Pryce JE, Bolormaa S, Chamberlain AJ, Bowman PJ, Savin K, Goddard ME,et al. A validated genome-wide association study in 2 dairy cattle breeds formilk production and fertility traits using variable length haplotypes. J DairySci. 2010;93(7):3331–45.
80. Allais S, Leveziel H, Hocquette JF, Rousset S, Denoyelle C, Journaux L, et al.Fine mapping of quantitative trait loci underlying sensory meat quality traitsin three French beef cattle breeds. J Anim Sci. 2014;92(10):4329–41.
81. Saatchi M, Schnabel RD, Taylor JF, Garrick DJ. Large-effect pleiotropic orclosely linked QTL segregate within and across ten US cattle breeds. BMCGenomics. 2014;15:442.
82. Hayes BJ, MacLeod IM, Daetwyler HD, Bowman PJ, Chamberlain AJ, VanderJagt CJ, et al. Genomic Prediction from Whole Genome Sequence inLivestock: the 1000 Bull Genomes Project. In: Proceedings, 10th WorldCongress of Genetics Applied to Livestock Production. Vancouver. 2014.
de Camargo et al. BMC Genomics (2015) 16:872 Page 14 of 14