Embed Size (px)
Citation preview

© 2018 IAU, Arak Branch. All rights reserved.
Journal of Solid Mechanics Vol. 10, No. 2 (2018) pp. 338-353
Fatigue Life of Graphite Powder Mixing Electrical Discharge Machining AISI D2 Tool Steel
A. Al-Khazraji 1, S.A. Amin
1, S.M. Ali
2,*
1Mechanical Engineering Department, University of Technology, Baghdad, Iraq
2Biomedical Engineering Department, University of Technology, Baghdad, Iraq
Received 3 March 2018; accepted 27 April 2018
ABSTRACT
The present paper deals with the design of experimental work matrices for
two groups of experiments by using Response surface methodology
(RSM). The first EDM group was dealt with the use of kerosene dielectric
alone, while the second was treated by adding the graphite micro powders
mixing to dielectric fluid (PMEDM). The total heat flux generated and
fatigue lives after EDM and PMEDM models were developed by FEM
using ANSYS 15.0 software. The graphite electrodes gave a total heat flux
higher than copper electrodes by (82.4 %). The use of graphite powder and
both electrodes yielded more heat flux by (270.1 %) and (102.9 %) than the
copper and graphite electrodes, respectively with use of kerosene dielectric
alone. Using graphite electrodes and kerosene dielectric alone improved
the WLT by (40.0 %) when compared with the use of copper electrodes.
Whereas, using copper electrodes and the graphite powder improved the
WLT by (66.7 %) compared with the use of graphite electrodes under the
same machining conditions. Copper electrodes with graphite powder gave
experimental fatigue safety factor higher by (30.38 %) when compared
with using graphite electrodes and higher by (15.73%) and (19.77%) when
compared with using the copper and graphite electrodes and kerosene
dielectric alone, respectively.
© 2018 IAU, Arak Branch. All rights reserved.
Keywords: EDM; PMEDM; Graphite powder; RSM; ANOVA; FEM;
AISI D2 Die Steel; WLT; Total heat flux; Fatigue life; Fatigue safety
factors.
1 INTRODUCTION
HE characteristics and the white layer thickness (WLT) are closely related to the phase transformation which
takes place during the solidification process. This in turn is dependent on the chemical composition of the
original work piece, the heat treatment conditions applied prior to machining, and the EDM machining parameters
most notably the pulse current and the pulse-on duration. The depth and size of the cracks formed on the recast layer
increase as the heat energy per spark increases [1-2]. It consists of micro-cracks and high tensile residual stresses on
the EDMed surface caused by the high temperature gradient [3]. The adverse effect of discharge energy also
provided some insights on the fatigue strength of the work piece, which propagates from the multiple surface
imperfections within the recast layer [4]. The mixing powder into the dielectric fluid is called powder mixed EDM
______ *Corresponding author. Tel.: +96 47803700877.
E-mail address: [email protected] (S.M.Ali).
T

339 Al-Khazraji et al.
© 2018 IAU, Arak Branch
(PMEDM) which reduces its insulating strength and increases the spark gap distance between the tool and work
piece to spread the electric discharge uniformly in all directions. As a result; the process becomes more stable,
thereby improving the material removal rate (MRR) and surface finish [5-6]. Many researchers have proposed
improving the fatigue life of EDM component by using a post-machining operation to remove the recast layer or to
coat the machined surface with a metallic layer. However, both methods inevitably extend the manufacturing time
and increase the manufacturing cost. The current study conducts an experimental investigation of two methods (the
powder mixing that does not need post-treatment processing, and the economic and quick shot blast peening
process) to identify the optimal EDM machining parameters which suppress the formation of cracks in the recast
layer for longest lives under different fatigue loads.
The objective of this study deals with the developing numerical models and verifying the experimental results by
using the response surface methodology (RSM) and the finite element method (FEM) with ANSYS 15.0 software
for study the effects of graphite powder mixing (PMEDM) parameters on the total heat flux generated, white layer
thickness (WLT) and fatigue life properties of the selected AISI die steel workpiece.
2 EXPERIMENTAL WORK
Two types of electrodes materials were selected (Copper and Graphite) with dimensions of 30 24 24 mm. The
copper electrode material was examined for chemical composition properties using the X-Met 3000TX Horizontal
metal analyzer. The average grain size for graphite powder is (44,866 µm).
The EDM parameters are; the gap voltage VP (140V), the pulse on time duration period Ton (40 and 120 µs), the pulse off time duration period Toff (14 and 40 µs), the pulse current IP (8 and 22 A), the duty factor (ƞ = 75%), two
sides flashing pressure = 0.73 bar (10.3 psi.) and the graphite powder mixing concentration = (0 and 5gm/lit). The
work piece material was prepared for chemical composition, mechanical properties tests and Rockwell hardness
tests on the bases of ASTM-77 steel standard for mechanical testing of steel products [7]. The work piece specimens
were prepared with dimensions 89.9 30 4.25 mm, according to requirement of the Avery type 7305 plain bending
fatigue testing machine shown in Fig. 1.
The average values of chemical composition of the selected work piece material and the equivalent values given
according to ASTM A 681-76 standard specification for alloy and die steels [8] are listed in Table 1. The results of
tensile test and Rockwell hardness tests are given in Table 2. The chemical composition of the copper electrodes is
listed in Table 3. The used kerosene dielectric was tested according to the ASTM (D 3699-90) industry standard
specifications for kerosene. The chemical composition of the graphite powder was tested for compositions by using
the X-Ray diffraction tester. A stainless steel container was fabricated for the purpose of powder mixing with the
dielectric fluid (PMEDM). The CNC ACRA type EDM machine with all the fabricated accessories is shown in Fig.
2. In this work, two groups were planned, each containing (22) experiments using a new set of work piece and
electrode in each experiment. The first (11) experiments in each group were machined by using the copper
electrodes, while the last (11) experiments were done by using the graphite electrodes. The work pieces after EDM
machining with the used copper and graphite electrodes for both groups are shown in Fig. 3.
Table 1
The chemical compositions of workpiece material.
SAMPLE C % Si % Mn% P % S % Cr % Mo % Ni % Co % Cu % V % Fe %
Tested
(Average)
1.51 0.174 0.264 0.014 0.003 12.71 0.555 0.158 0.0137 0.099 0.306 Bal.
Standard
AISI D2
1.40
to
1.60
0.60
max.
0.60
max.
0.03
max.
0.03
max.
11.00
to
3.00
0.70
to
1.20
-
1.00
Max.
-
1.10
Max.
Bal.
Table 2
The mechanical properties of the selected materials.
Sample Ultimate tensile stress N/mm² Yield strength N/mm² Elongation % Hardness HRB
Average 704.25 415.25 18.125 90.75
Table 3 The chemical compositions of copper electrodes material.
Zn% Pb% Si% Mn% P% S% Sn% Al% Ni% Sb% Fe% Cu%
0.006 0.001 0.011 0.0002 0.005 0.002 0.0005 0.007 0.004 0.005 0.007 99.96

Fatigue Life of Graphite Powder Mixing Electrical … 340
© 2018 IAU, Arak Branch
Fig.1
The Avery Denison plain bending fatigue testing machine
type 7305, England.
Fig.2
The (CNC) EDM machine with all the fabricated accessories.
1
2
Fig.3
The specimens and the used copper and graphite electrodes for groups (1 and 2) experiments after EDM and PMEDM
machining.
3 MODELING AND SIMULATION THE HEAT FLUX USING FEM
The Gaussian distribution of heat applied at the axis of a spark for a single discharge has a maximum radius (R), and
then the heat flux (Qw) at radius (r) of the system is given by the following relation [9]:
2
24.5
2
4.57* * * *( )
.
r
RRw Vb Ip Kn
Qw r eR
(1)
The rate of energy incident on the work piece is equal to the rate of energy supplied which is equal to Rw*VP*IP.
Where, Rw is the energy percentage fraction of heat input to the work piece, Vb is the breakdown voltage (different
from the applied voltage), R is the spark radius in µm, and IP is the discharge current. The breakdown voltage value
(Vb) was taken as (20 V), while for PMEDM it was about 20% – 30% lower than that for EDM, i.e., Vb =15 V. The
spark radius (R) was taken as (15 µm), and the heat flux for AISI D2 die steel is ( ( )Qw r = 680 MW/m²K) for various
values of discharge current. The spark radii for PMEDM processes was taken to be 40% larger than traditional
EDM.

341 Al-Khazraji et al.
© 2018 IAU, Arak Branch
The (Rw) is the value that has been determined by Yadav et al. [10] and Patel et al. [11] who have suggested that
a constant fraction of total power is transferred to the electrodes. They have used the value of (Rw) as 8% as the
percentage of heat input absorbed by the work piece for their theoretical work of conventional EDM and the same
value was used in this work. The Rw values during PMEDM in the present model have been assumed to be 9% of
the total heat lost in the work piece. Shankar et al. [12] have calculated that about 18% is absorbed by cathode and
the rest is discharged to the dielectric fluid.
The new parameter (Kn) which takes into account the effect of suspended powder particles on the spark
frequency and breakdown voltage was also calculated. The value of (Kn) depends upon the type of powder, the
powder properties, such as shape, size, concentration, etc. The values of (Kn) factor were experimentally estimated
for EDM and PMEDM machining groups as given in Table 4. using the results of material removal rates which were
experimentally determined. Marafona et al. [13] suggested an equation called the equivalent heat input radius R(t) or
the radius of plasma channel (µm), which is dependent on the current intensity (IP) and pulse on duration (Ton), there
by:
2.04*0.43 *0.44P onR t I T (2)
This assumption is important to determine the radius of the discharge channel (spark) for each input current
intensity case. The total heat flux generated and absorbed by the work piece, electrode and dielectric can be
calculated assuming that the machining area is about 500 mm² and the effective geometric machining area is about
0.75% of the total machining area and about 10% of the total numbers of discharge sparks generated
instantaneously during one pulse on period of time, then:
The total number of discharge sparks (SN) = Total machining area x 20% x 0.75 / Area of one
discharge spark.
(3)
The total heat fluxes entering the work piece, the electrode and the dielectric fluid during the on-time for all
EDM experiments were calculated using Eq.(1), but this equation needs to be modified as:
2
24.5
2
4.57* * * *( ) X SN / Machining area of the work piece
.
r
RRw Vb Ip Kn
Qw r eR
(4)
Eq. (4) can be calculated for each EDM parameter taking into account all the above factors of modifications and
for (r =R) at the end of pulse on duration time, and then the results for the total heat fluxes entering the work piece,
the electrode and the dielectric fluid during the on-time for all PMEDM experiments are given in Table 5. The
theoretical and numerical total heat flux generated by the using copper and graphite electrodes and FEM and
ANSYS solutions for experimental group (2) is given in Table 6. The percentage increase in the value of the
experimental total heat flux using SiC mixed powder (group 2) compared with (group 1) using kerosene dielectric
alone are given in Table 7.
Table 4
The average values of material removal rate (MRR) and the experimentally estimated values of (Kn) factor for all EDM and
PMEDM machining groups.
Average values of Kn
coefficient
Material removal rate-average
values (MRR)
mm³/min
Pulse
current
(A)
Pulse off
time
Toff (µs)
Pulse on
time
Ton (µs)
Type of
electrode
Exp.
No.
Group 2
Group 1 Group 2
Av.
Group 1
Av.
3.53 1.00 12.7007 8.6789 8 40 120 Copper 1.
4.74 1.00 56.3795 27.2888 22 40 120 Copper 2.
2.98 1.00 8.7665 7.6445 8 14 40 Copper 3.
4.37 1.00 29.9636 16.4341 22 14 40 Copper 4.
3.07 0.75 8.9378 7.0185 8 40 120 Graphite 5.
4.84 1.40 77.0086 34.4913 22 40 120 Graphite 6.
2.21 1.24 8.0047 9.7517 8 14 40 Graphite 7.
2.77 1.82 34.3113 24.7480 22 14 40 Graphite 8.

Fatigue Life of Graphite Powder Mixing Electrical … 342
© 2018 IAU, Arak Branch
Table 5
The total heat flux fraction values absorbed by the workpieces, the electrodes and kerosene dielectric for group (2).
Heat flux percentage fraction absorbed by the :
[MW/m²]
Pulse current
(A)
Pulse off
duration
Toff (µs)
Pulse on
duration
Ton (µs)
Type of
electrode
Exp.
No.
Kerosene dielectric Electrode Work piece
1004.57 237.57 110.03 8 40 120 Copper 1.
1554.11 383.00 170.22 22 40 120 Copper 2.
2238.40 551.63 245.17 8 14 40 Copper 3.
3761.01 926.865 411.94 22 14 40 Copper 4.
655.26 161.48 71.77 8 40 120 Graphite 5.
2743.84 676.19 300.53 22 40 120 Graphite 6.
2058.54 507.31 225.47 8 14 40 Graphite 7.
4338.94 1069.29 475.24 22 14 40 Graphite 8.
Table 6
The experimental and numerical total heat flux (power) generated by PMEDM processes using kerosene dielectric with graphite
mixed powder.
Error in
numerical
mode %
Numerical total
heat flux
[MW/m²]
Experimental
total heat
flux
[MW/m²]
Pulse
current
(A)
Pulse off time
Toff (µs)
Pulse on time
Ton (µs)
Type of
electrode
Exp.
No.
+3.2 1367.20 1325.17 8 40 120 Copper 1.
+4.0 2192.20 2107.33 22 40 120 Copper 2.
+4.1 3160.40 3035.20 8 14 40 Copper 3.
+4.2 5314.90 5099.81 22 14 40 Copper 4.
-7.4 822.75 888.51 8 40 120 Graphite 5.
-9.3 3374.10 3720.56 22 40 120 Graphite 6.
-9.1 2537.00 2791.32 8 14 40 Graphite 7.
-9.5 5322.70 5883.47 22 14 40 Graphite 8.
Table 7
The experimental heat flux (power) generated by EDM (group 1) and PMEDM (group 2) processes.
Percentage
increase in total
heat flux (%)
Experimental total heat flux
[MW/m²] Pulse
current (A)
Pulse off time
Toff (µs)
Pulse on time
Ton (µs)
Type of
electrode
Exp.
No.
Group (2) Group (1)
+204.9 1325.17 434.62 8 40 120 Copper 1.
+296.2 2107.33 531.88 22 40 120 Copper 2.
+149.1 3035.20 1218.50 8 14 40 Copper 3.
+265.3 5099.81 1396.12 22 14 40 Copper 4.
+156.6 888.51 346.26 8 40 120 Graphite 5.
+304.6 3720.56 919.62 22 40 120 Graphite 6.
+84.7 2791.32 1511.00 8 14 40 Graphite 7.
+131.5 5883.47 2541.00 22 14 40 Graphite 8.
The maximum total heat flux generated by the discharge processes and obtained by the FEM and ANSYS
solutions and simulations after EDM machining using the copper and graphite electrodes for group (2) are given in
Fig. 4. This figure shows two simulations models for maximum values of input EDM parameters using copper and
graphite electrodes, respectively. The right figures represent the total heat flux generated form of the electrode, the
work piece and the kerosene dielectric. The figures in the left show the thermal model of the electrode and work
piece with the values of maximum heat flux generated and the input EDM and PMEDM processes parameters and
also the verified percentage errors between the experimental thermal models compared with the theoretical
calculations.
Three levels factorial response surface methodology (RSM) and the design expert 9.0 software were used to
analyze the obtained total heat flux for each parametric subgroup, the analysis results for both experimental groups
using the copper and graphite electrodes are shown in Fig. 5 and 6.

343 Al-Khazraji et al.
© 2018 IAU, Arak Branch
The predicted equation of the total heat flux generated for PMEDM experimental group (2), using copper
electrodes and kerosene dielectric with graphite powder mixing, is:
Total heat power = +2741.80196+156.15304* Pulse current-27.31834 * Pulse on time (Ton) (5)
And, using graphite electrodes is:
Total heat power =+3164.28946+156.15304*Pulse current-27.31834 * Pulse on time (Ton) (6)
The total heat flux generated for experimental group (2), using the copper electrodes and graphite mixing
powder, the total heat flux values reached the maximum value as (5.315E +009 W/m²). While, when using the
graphite electrodes, the total heat flux values reached the maximum value as (5.323E+009 W/m²) at the same input
current and time on period.
This means that the use of graphite electrodes and the kerosene dielectric with graphite mixed powder yields the
same total heat flux values when compared with the use of copper electrodes. These values give more heat flux
generated when using the copper electrode and dielectric alone by (270.1 %) and more than when using the graphite
electrodes and the kerosene dielectric alone by (102.9 %).
The high total heat flux levels are obtained when using the graphite or copper electrodes and the graphite mixed
powder because of the abrasive graphite powder which works on enlarging the electrodes gaps and more
arrangement of the discharge plasma channels.
The total heat flux
W/m² Pulse Current
(A)
Pulse on
duration Ton (µs)
Type of electrode Exp.
No.
22 40 Copper 4.
Total heat flux = 5.315E+009 W/m² (+4.2%)
22 40 Graphite 8.
Total heat flux = 5.323E+009 W/m² (-9.5%)
Fig. 4
The total modeled heat flux generated by the PMEDM experiments using the graphite powder, the pulse current (22 A) and the
pulse on time (40 µs).
Fatigue Life of Graphite Powder Mixing Electrical … 344
© 2018 IAU, Arak Branch
Design-Expert® SoftwareFactor Coding: ActualTotal heat power (MW/m²)
Design Points5884.08
888.51
X1 = A: Pulse current X2 = B: Pulse on time Ton
Actual FactorC: Type of electrode = Copper
8 10 12 14 16 18 20 22
40
60
80
100
120
Total heat power (MW/m²)
A: Pulse current (A)
B:
Pu
lse
on
tim
e T
on
(µ
s)
2000
3000
4000
5000
Design-Expert® SoftwareFactor Coding: ActualTotal heat power (MW/m²)
Design Points5884.08
888.51
X1 = A: Pulse current X2 = B: Pulse on time Ton
Actual FactorC: Type of electrode = Graphite
8 10 12 14 16 18 20 22
40
60
80
100
120
Total heat power (MW/m²)
A: Pulse current (A)
B:
Pu
lse
on
tim
e T
on
(µ
s)
2000
3000
4000
5000
Design-Expert® SoftwareFactor Coding: ActualTotal heat power (MW/m²)
Design Points5884.08
888.51
X1 = A: Pulse current X2 = B: Pulse on time Ton
Actual FactorC: Type of electrode = Copper
8 10 12 14 16 18 20 22
40
60
80
100
120
Total heat power (MW/m²)
A: Pulse current (A)
B:
Pu
lse
on
tim
e T
on
(µ
s)
2000
3000
4000
5000
Group (2) / EDM + Kerosene dielectric + Graphite powder mixing
Fig.5
The total heat flux (power) generated by the EDM machining using copper electrodes and graphite powder mixing.
Design-Expert® SoftwareFactor Coding: ActualTotal heat power (MW/m²)
Design Points5884.08
888.51
X1 = A: Pulse current X2 = B: Pulse on time Ton
Actual FactorC: Type of electrode = Graphite
8 10 12 14 16 18 20 22
40
60
80
100
120
Total heat power (MW/m²)
A: Pulse current (A)
B:
Pu
lse
on
tim
e T
on
(µ
s)
2000
3000
4000
5000
Group (2) / EDM + Kerosene dielectric +Graphite powder mixing.
Fig.6
The total heat flux (power) generated by the EDM using graphite electrodes and graphite powder mixing.
4 CALCULATION THE WHITE LAYER THICKNESS (WLT)
The average of three values of work pieces WLT measurements after EDM machining for both experiments using
the two groups is given in Table 8. The predicted equation of WLT for EDM machining, using copper electrodes
and graphite mixed powder obtained from the using three levels factorial response surface methodology (RSM) and
the design expert 9.0 software, is:
WLT =+8.25589-0.18089* Pulse current+0.18441* Pulse on time (Ton) (7)
And, for graphite electrodes is:
WLT=+12.42339-0.18089* Pulse current+0.18441 * Pulse on time (Ton) (8)
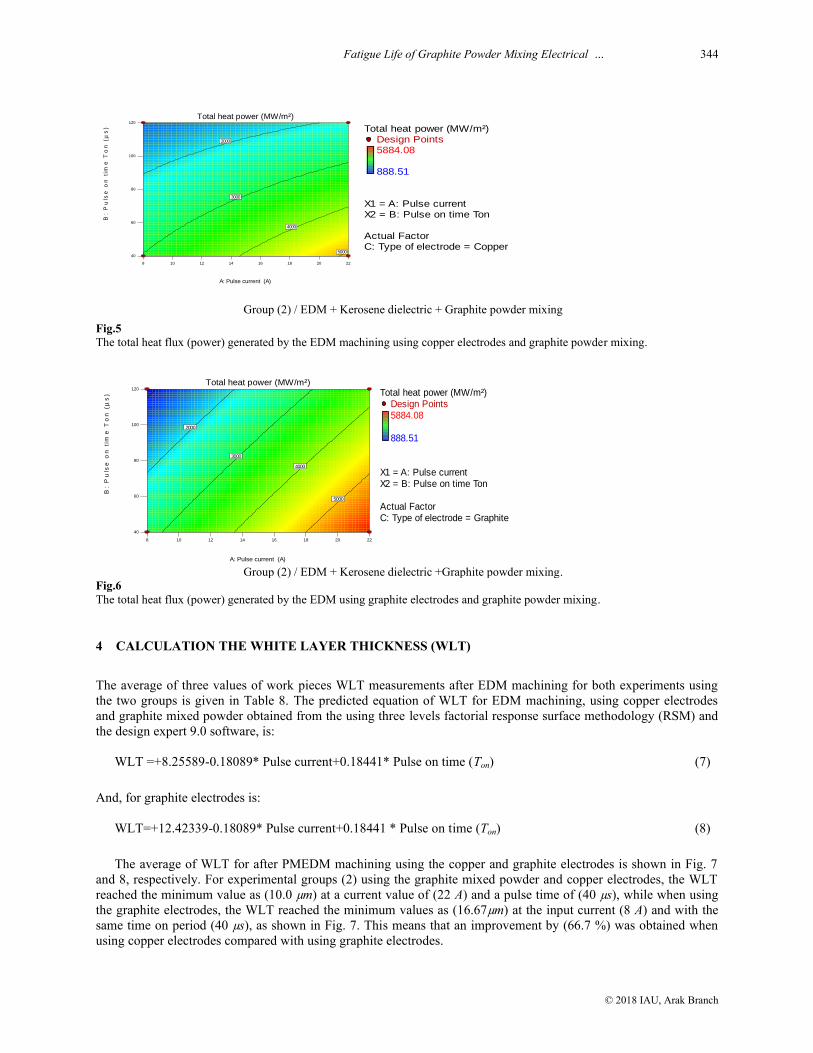
The average of WLT for after PMEDM machining using the copper and graphite electrodes is shown in Fig. 7
and 8, respectively. For experimental groups (2) using the graphite mixed powder and copper electrodes, the WLT
reached the minimum value as (10.0 µm) at a current value of (22 A) and a pulse time of (40 µs), while when using
the graphite electrodes, the WLT reached the minimum values as (16.67µm) at the input current (8 A) and with the
same time on period (40 µs), as shown in Fig. 7. This means that an improvement by (66.7 %) was obtained when
using copper electrodes compared with using graphite electrodes.

345 Al-Khazraji et al.
© 2018 IAU, Arak Branch
The lower levels of the obtained WLT when using the copper electrodes and the abrasive graphite work on
removal of the melted white layer at moderate rates by micro shot peening process in a short period of time together
with a high spark discharge heat power produced due to the good arrangements of the plasma discharge channels
that enlarge the gap between the electrodes by about three times which works on increasing the discharge power too,
with the use of dielectric flushing from both sides of the cutting zone.
The figures in Table 9, show the macro graphic and microstructure of the heat affected zones (HAZ) for the work
pieces surfaces for each subgroups input parameters after PMEDM processes using copper and graphite electrodes.
These figures show that the craters sizes increased with increasing the pulse current and the time on duration and
they reached their minimum sizes, especially when using the graphite electrodes, where higher plasma discharge
heat power was generated. The construction of these microscopic layers and HAZ for experimental group (2)
indicates that lower layer thicknesses and defects exist due to the moderate abrasive and micro shot peening
properties of the graphite powder and the plasma discharge pressure of the process as well as the high role of the
dielectric flushing of the formed craters from both sides of the cutting areas. With high pulse current value and time
on duration, the defect sizes increase in these layers, especially when using the copper electrodes due to the high
thermal energy generated.
Table 8
Calculation the average values of the white layer thickness (WLT) after EDM and PMEDM machining.
Average WLT
Group (2)(µm)
Average WLT
Group (1) (µm) Pulse current
(A)
Pulse off
Toff (µs)
Pulse on
Ton (µs) Type of electrode Exp. No.
31.17 33.34 8 40 120 Copper 1.
24.44 26.67 22 40 120 Copper 2.
15.57 13.34 8 14 40 Copper 3.
10.00 11.67 22 14 40 Copper 4.
31.17 20.00 8 40 120 Graphite 5.
32.24 8.34 22 40 120 Graphite 6.
16.67 15.00 8 14 40 Graphite 7.
17.77 15.00 22 14 40 Graphite 8.
Table 9
The WLT and HAZ microstructures for PMEDM group (2) using kerosene dielectric and graphite mixed powder. The white layer microstructure
(optical microscope X300)
Pulse Current (A) Pulse on duration
Ton (µs)
Type of
electrode
Exp. No.
8 120 Copper 1.
X40
X1.5
22 120 Copper 2.
X40
X1.5
8 40 Copper 3.
X40
X1.5

Fatigue Life of Graphite Powder Mixing Electrical … 346
© 2018 IAU, Arak Branch
22 40 Copper 4.
X40
X1.5
8 120 Graphite 5.
X40
X1.5
22 120 Graphite 6
X40
X1.5
8 40 Graphite 7.
X40
X1.5
22 40 Graphite 8.
X40
X1.5
Design-Expert® SoftwareFactor Coding: ActualWLT (µm)
Design Points32.24
10
X1 = A: Pulse current X2 = B: Pulse on time Ton
Actual FactorC: Type of electrode = Copper
8 10 12 14 16 18 20 22
40
60
80
100
120
WLT (µm)
A: Pulse current (A)
B:
Pu
lse
on
tim
e T
on
(µ
s)
15
20
25
30
Group (2) / EDM + Kerosene dielectric +Graphite powder mixing.
Fig.7
The WLT for experimental group (2) after PMEDM using copper electrodes.
Design-Expert® SoftwareFactor Coding: ActualWLT (µm)
Design Points32.24
10
X1 = A: Pulse current X2 = B: Pulse on time Ton
Actual FactorC: Type of electrode = Copper
8 10 12 14 16 18 20 22
40
60
80
100
120
WLT (µm)
A: Pulse current (A)
B:
Pu
lse
on
tim
e T
on
(µ
s)
15
20
25
347 Al-Khazraji et al.
© 2018 IAU, Arak Branch
Design-Expert® SoftwareFactor Coding: ActualWLT (µm)
Design Points32.24
10
X1 = A: Pulse current X2 = B: Pulse on time Ton
Actual FactorC: Type of electrode = Graphite
8 10 12 14 16 18 20 22
40
60
80
100
120
WLT (µm)
A: Pulse current (A)
B:
Pu
lse
on
tim
e T
on
(µ
s)
20
25
30
Group (2) / EDM + Kerosene dielectric +Graphite powder mixing.
Fig.8
The WLT for experimental group (2) after PMEDM using graphite electrodes.
5 MODELING AND SIMULATION THE FATIGUE LIFE USING FEM
In the present work, the high-cycle fatigue three-dimensional analysis and modeling for EDM of AISI D2 die steel
was studied. The damage model was developed to study the influence of different parameters on the work piece
fatigue life. This study used the stress life fatigue modeling analysis by using the ANSYS software 15.0. The cyclic
fatigue of a material was obtained from completely reversed, constant amplitude tests with a load ratio of (-1) at
room temperature. The Goodman mean stress correction theory is a good choice for brittle materials. The flat
bending work pieces were used for the fatigue test. The test frequency of the machine was maintained constant at 60
Hz. The entire fatigue limit was defined at the stress level of (106) loading cycles. The Von-Mises stress theory
which takes the sign of the largest absolute principal stress will be used to compare against the experimental stress
value.
The Multiphysics, static structural models domain loads, include the environment temperature, the fixing
supported and the loading force. The fatigue strength concentration factor (Kf), which is equal to (1) and (0.72) for
flat as received specimens and for PMEDM machining work pieces [14], respectively was set. The experimental
fatigue results after EDM and PMEDM machining are given in Table 10.
The experimental average values of fatigue stress at (106 cycles) and the experimental and numerical fatigue
safety factor values for group (2) are given in Table 11., where the fatigue safety factor values were calculated as the
ratio of fatigue stress at (106 cycles) of the experimental result respect to the fatigue stress at (10
6 cycles) of the as-
received material which is equal to (270 MPa). The percentage enhancement in the value of experimental fatigue
stresses at (106
cycles) using SiC mixed powder (group 2) compared with (group 1) using kerosene dielectric alone
are given in Table 12.
The maximum fatigue life and safety factor obtained by the FEM and PMEDM with ANSYS solutions and
simulations using the copper and graphite electrodes using the pulse current (8 A) and pulse on time (120 µs) are
given in Fig. 9. Each simulation model in this figure shows two models for each of input parameters of PMEDM
sub-group. The right figures represent the numerical modeled fatigue safety factor. The figures in the left shows the
fatigue life models simulations with the values of fatigue stresses at (106
cycles) obtained from the S/N curves of
each experimental sub-group, the input EDM process parameters and the model loading force.
The S/N fatigue stress at (106 cycles) curves for both groups after EDM and PMEDM machining, are shown in
Fig. 10 and 11 using pulse current (8 A) and (22 A), respectively. These figures show that, fatigue life increasing
with decreasing the pulse current and increasing the pulse on duration time, and copper electrodes gave fatigue life
values higher than graphite electrodes, after EDM experimental group (1). Whereas, copper electrodes gave fatigue
life values higher than graphite electrodes after PMEDM experimental group (2) and fatigue life increases with the
decrease in pulse current values and pulse on duration time. These figures shows that the use of copper electrodes
with graphite powder mixing improved the fatigue life and it is not recommended to adding the graphite powder
when using the graphite electrodes as it is produces the lowest fatigue lives.
Design-Expert® SoftwareFactor Coding: ActualWLT (µm)
Design Points32.24
10
X1 = A: Pulse current X2 = B: Pulse on time Ton
Actual FactorC: Type of electrode = Graphite
8 10 12 14 16 18 20 22
40
60
80
100
120
WLT (µm)
A: Pulse current (A)
B:
Pu
lse
on
tim
e T
on
(µ
s)
20
25
30

Fatigue Life of Graphite Powder Mixing Electrical … 348
© 2018 IAU, Arak Branch
Table 10
The experimental fatigue life results for group (1) after EDM machining.
For group (2) For group (1) Pulse off
time
Toff (µs)
Pulse
current
(A)
Pulse on
time
Ton (µs)
Type of
electrode
Exp.
No. No. of
cycles to
failure
(X1000)
Applied stress (σ)
(MPa)
No. of cycles
to failure
(X1000)
Applied stress (σ)
(MPa)
123.250 350.00 100.250 350.00 40 8 120 Copper 1.
271.500 300.00 239.750 300.00 40 8 120 Copper 2.
1051.750 250.00 1260.500 230.00 40 8 120 Copper 3.
133.000 350.00 61.000 350.00 40 22 120 Copper 4.
341.750 300.00 133.500 300.00 40 22 120 Copper 5.
1215.250 250.00 1273.250 215.00 40 22 120 Copper 6.
188.500 350.00 84.250 350.00 14 8 40 Copper 7.
481.000 300.00 199.750 300.00 14 8 40 Copper 8.
1371.000 270.00 1157.500 220.00 14 8 40 Copper 9.
94.750 350.00 56.250 350.00 14 22 40 Copper 10.
1176.250 240.00 1212.500 210.00 14 22 40 Copper 11.
63.500 350.00 94.500 350.00 40 8 120 Graphite 12.
134.250 300.00 214.750 300.00 40 8 120 Graphite 13.
1268.000 210.00 1319.000 220.00 40 8 120 Graphite 14.
41.000 350.00 45.250 350.00 4 22 120 Graphite 15.
81.000 300.00 87.250 300.00 40 22 120 Graphite 16.
1113.750 210.00 1063.750 200.00 40 22 120 Graphite 17.
51.750 350.00 70.250 350.00 14 8 40 Graphite 18.
1063.000 200.00 164.750 300.00 14 8 40 Graphite 19.
- - 1201.500 215.00 14 8 40 Graphite 20.
34.750 350.00 51.250 350.00 14 22 40 Graphite 21.
1054.000 200.00 1188.500 200.00 14 22 40 Graphite 22.
Table 11
The experimental average values of fatigue stress at (106 cycles) and fatigue safety factor for group (2) PMEDM machining with
graphite powder mixing.
Error
in
numeric
mode%
Fatigue
safety
factor
numeric
Fatigue
Safety
factor
experiment
Fatigue stress
at 106
Cycles
(MPa)
Pulse
current
(A)
Pulse off
time Toff
(µs)
Pulse on
time Ton (µs)
Type of
electrode
Exp.
No.
+2.1 0.96 0.94 254 8 40 120 Copper 1.
+3.2 0.98 0.95 257 22 40 120 Copper 2.
+10.8 1.13 1.03 278 8 14 40 Copper 3.
-2.2 0.90 0.92 247 22 14 40 Copper 4.
-12.2 0.72 0.82 220 8 40 120 Graphite 5.
-5.1 0.75 0.79 214 22 40 120 Graphite 6.
-12.0 0.66 0.75 203 8 14 40 Graphite 7.
-13.3 0.65 0.75 202 22 14 40 Graphite 8.
Table 12
The experimental values of fatigue stress at (106 cycles) for EDM group (1) and PMEDM group (2).
Percentage
enhancement in
fatigue stress (%)
Experimental fatigue stress at
106 Cycles
(MPa) Pulse
current (A)
Pulse off time
Toff (µs)
Pulse on time
Ton (µs)
Type of
electrode
Exp.
No.
Group (2) Group (1)
+5.8 254 240 8 40 120 Copper 1.
+14.2 257 225 22 40 120 Copper 2.
+22.5 278 227 8 14 40 Copper 3.
+14.9 247 215 22 14 40 Copper 4.
-5.2 220 232 8 40 120 Graphite 5.
+5.4 214 203 22 40 120 Graphite 6.
-9.0 203 223 8 14 40 Graphite 7.
-2.4 202 207 22 14 40 Graphite 8.

349 Al-Khazraji et al.
© 2018 IAU, Arak Branch
Fatigue Safety Factor Pulse Current (A) Pulse on duration
Ton (µs)
Type of
electrode
Exp. No.
Fatigue Safety Factor = 1.13
8 40 Copper 3.
Fatigue life=1.37E+6Cycles / σb=278MPa / F=147N
Fatigue Safety Factor=0.72
8 120 Graphite 5.
Fatigue life=1.27E+6Cycles / σb=220MPa / F=179N
Fig. 9
The FEM fatigue life and safety factor Models for PMEDM machining of group (2) with graphite powder mixing.
Fig. 10
The S/N curves of experimental groups (1) and (2) after
EDM and PMEDM using the graphite powder mixing and
pulse current (8 A).

Fatigue Life of Graphite Powder Mixing Electrical … 350
© 2018 IAU, Arak Branch
Fig. 11
The S/N curves for experimental groups (1) and (2) after
EDM and PMEDM using the graphite powder mixing and
pulse current (22 A).
The three levels factorial response surface methodology (RSM) and the design expert 9.0 software were used to
analyze the obtained fatigue safety factor for each parametric subgroup.
The predicted equation of the fatigue safety factor for PMEDM experimental group (2), using kerosene dielectric
with graphite mixing powder and copper electrodes, is:
Fatigue Safety Factor=+1.02589-3.39286E-003*Pulse current+ 2.18750E -004* Pulse on time (Ton) (9)
And, using graphite electrodes is:
Fatigue Safety Factor=+0.72839-3.39286E-003*Pulse current+2.18750E -004* Pulse on time (Ton) (10)
The predicted equation of the fatigue stress at (106 cycles) obtained by using copper electrodes is:
Fatigue stress at 106 cycles = +264.62500-0.62500 * Pulse current time +0.046875* Pulse on time (Ton) (11)
And, using graphite electrodes is:
Fatigue stress at 106 cycles = +215.37500-0.62500* Pulse current time +0.046875* Pulse on time (Ton) (12)
The results of analysis for fatigue safety factor for all experiments using the copper and graphite electrodes are
shown in Fig. 12 and 13, respectively. While, the fatigue stresses at (106 cycles) for all experimental groups using
the copper and graphite electrodes are shown in Fig. 14 and 15, respectively. The fatigue safety factor using the
copper electrodes for experimental group (2) increases with the decrease in pulse current values and pulse on
duration time, reaching the maximum value as (1.13), experimentally (1.03) at a current value of (8 A), a pulse time
of (40 µs). While, when using the graphite electrodes, the fatigue safety factor values reached their maximum value
as (0.75), experimentally (0.79) at high input current (22 A) and pulse on time period (120 µs), as shown in Fig. 13.
This means that the use of copper electrodes and the kerosene dielectric with graphite mixed powder gives higher
experimental fatigue safety factor values by (30.38 %) when compared with the using of graphite electrodes and
higher by (15.73%) and (19.77%) when compared with the results of group (1) using the copper and graphite
electrodes, respectively. The fatigue stresses at (106 cycles) after PMEDM experimental group (2) using the copper
electrodes are increasing with the decrease in pulse current and the pulse on duration time, reaching the maximum
value as (278 MPa) at a current value of (8 A), pulse on time (40 µs).
While, when using the graphite electrodes, these fatigue stress values reached the maximum value as (220 MPa)
at the same input current and higher pulse on period time (120 µs), as shown in Fig. 14 and 15. This means that the
use of copper electrodes and the kerosene dielectric with graphite powder mixing yields fatigue stresses at (106
cycles) values higher by (26.36 %) when compared with using graphite electrodes and gives a higher fatigue life
than the situation when working without mixed powder by (15.83 %) and (19.83 %) using the copper and graphite
electrodes, respectively.

351 Al-Khazraji et al.
© 2018 IAU, Arak Branch
Design-Expert® SoftwareFactor Coding: ActualFatigue Safety Factor
Design Points1.13
0.65
X1 = A: Pulse current X2 = B: Pulse on time Ton
Actual FactorC: Type of electrode = Copper
8 10 12 14 16 18 20 22
40
60
80
100
120
Fatigue Safety Factor
A: Pulse current (A)B
: P
uls
e o
n t
ime
To
n (
µs
)
0.95
1
1.05
1.1
Design-Expert® SoftwareFactor Coding: ActualFatigue Safety Factor
Design Points1.13
0.65
X1 = A: Pulse current X2 = B: Pulse on time Ton
Actual FactorC: Type of electrode = Graphite
8 10 12 14 16 18 20 22
40
60
80
100
120
Fatigue Safety Factor
A: Pulse current (A)
B:
Pu
lse
on
tim
e T
on
(µ
s)
0.66
0.68
0.7
0.72
0.74
Design-Expert® SoftwareFactor Coding: ActualFatigue stress at 10E6 cycles
Design Points278
202
X1 = A: Pulse current X2 = B: Pulse on time Ton
Actual FactorC: Type of electrode = Copper
8 10 12 14 16 18 20 22
40
60
80
100
120
Fatigue stress at 10E6 cycles
A: Pulse current (A)
B:
Pu
lse
on
tim
e T
on
(µ
s)
250
260
270
The stress values are equal to the ratios (1.03) and (0.77) for copper and graphite electrodes, respectively
compared with the fatigue stresses at (106 cycles) for the as-received material. These stress values are very close to
those of fatigue safety factors for the same input parameters of the process for this experimental group as well as all
the other experimental groups, which have just discussed, and this proves the accuracy of all EDM and PMEDM
models developed by ANSYS.
The abrasive characteristics of graphite powder , which are working on micro shot peening of the machining
surfaces, produce a lower brittle carbides formation, fewer defects and lower white layer thickness, and all these
factors strengthen the work piece against fatigue failure and then longer lives are obtained. While, the graphite
electrodes with graphite powder mixing work on increasing the carbide formation by the migration of the carbon
particles from the electrode to the work piece, and consequentially weak surfaces are obtained with lower values of
fatigue safety factors.
Design-Expert® SoftwareFactor Coding: ActualFatigue Safety Factor
Design Points1.13
0.65
X1 = A: Pulse current X2 = B: Pulse on time Ton
Actual FactorC: Type of electrode = Copper
8 10 12 14 16 18 20 22
40
60
80
100
120
Fatigue Safety Factor
A: Pulse current (A)
B:
Pu
lse
on
tim
e T
on
(µ
s)
0.95
1
1.05
1.1
Fig. 12
The fatigue safety factor after PMEDM using copper electrodes and graphite mixed powder.
Design-Expert® SoftwareFactor Coding: ActualFatigue Safety Factor
Design Points1.13
0.65
X1 = A: Pulse current X2 = B: Pulse on time Ton
Actual FactorC: Type of electrode = Graphite
8 10 12 14 16 18 20 22
40
60
80
100
120
Fatigue Safety Factor
A: Pulse current (A)
B:
Pu
lse
on
tim
e T
on
(µ
s)
0.66
0.68
0.7
0.72
0.74
Fig. 13
The fatigue safety factor after PMEDM using graphite electrodes and graphite mixed powder.
Design-Expert® SoftwareFactor Coding: ActualFatigue stress at 10E6 cycles
Design Points278
202
X1 = A: Pulse current X2 = B: Pulse on time Ton
Actual FactorC: Type of electrode = Copper
8 10 12 14 16 18 20 22
40
60
80
100
120
Fatigue stress at 10E6 cycles
A: Pulse current (A)
B:
Pu
lse
on
tim
e T
on
(µ
s)
250
260
270
Fig. 14
The fatigue stresses at (106cycles) after PMEDM using copper electrodes and graphite mixed powder.

Fatigue Life of Graphite Powder Mixing Electrical … 352
© 2018 IAU, Arak Branch
Design-Expert® SoftwareFactor Coding: ActualFatigue stress at 10E6 cycles
Design Points278
202
X1 = A: Pulse current X2 = B: Pulse on time Ton
Actual FactorC: Type of electrode = Graphite
8 10 12 14 16 18 20 22
40
60
80
100
120
Fatigue stress at 10E6 cycles
A: Pulse current (A)
B:
Pu
lse
on
tim
e T
on
(µ
s)
205
210
215
Fig. 15
The fatigue stresses at (106cycles) after PMEDM using graphite electrodes and graphite mixed powder.
6 CONCLUSIONS
1. The total heat power values are increasing with the increase of pulse current values up to (22 A) and the
decrease of pulse on duration time to (40 µs).
2. The use of graphite powder and both electrodes gave more heat power by (270.1 %) and (102.9 %) than the
copper and graphite electrodes, respectively with using the kerosene dielectric alone.
3. The WLT reached its minimum value of (8.34 µm) using the kerosene dielectric alone and graphite
electrodes at higher values of pulse current and pulse on time. This means an improvement by (40.0 %)
when compared with the use of copper electrodes.
4. The WLT reached its minimum value of (10.0 µm) at high current and low pulse on time using the copper
electrodes and the graphite powder. This means that an improvement by (66.7 %) was obtained when
compared with the use of graphite electrodes under the same machining conditions.
5. Copper electrodes with graphite powder yielded experimental fatigue safety factor values of (1.03), which
is higher by (30.38 %) when compared with using graphite electrodes and higher by (15.73%) and
(19.77%) when compared with results of group (1) using the kerosene dielectric alone and copper and
graphite electrodes, respectively.
6. Copper with graphite powder gives fatigue stresses of (278 MPa), which is higher by (26.36 %) when
compared with the use of graphite electrodes and yielded a higher fatigue life than the situation when
working without mixing powder by (15.83 %) and (19.83 %) using the copper and graphite electrodes,
respectively.
REFERENCES
[1] Lee L.C., Lim L.C., Wong Y.S., Lu H.H., 1990, Towards a better understanding of the surface features of electro-
discharge machined tool steels, The Journal of Materials Processing Technology 24: 513-523.
[2] Lim L.C., Lee L.C., Wong Y.S., Lu H.H. 1991, Solidification microstructure of electro discharge machined surfaces of
tool steels, Journal of Materials Science and Technology 7: 239-248.
[3] Lin Y.C., Yan B.H., Huang F.Y., 2001, Surface improvement using a combination of electrical discharge machining
with ball burnish machining based on the Taguchi method, The International Journal of Advanced Manufacturing
Technology 18(9): 673-682.
[4] Abu Zeid O.A., Ho K.H., Newman S.T., 2003, On the effect of electro-discharge machining, International Journal of
Machine Tools & Manufacture 43: 1287-1300.
[5] Khundrakpam N.S., Singh H., Kumar S., Brar G.S., 2014, Investigation and modeling of silicon powder mixed EDM
using response surface method, International Journal of Current Engineering and Technology 4(2): 1022-1026.
[6] Reddy B., Kumar G.N., Chandrashekar K., 2014, Experimental investigation on process performance of powder mixed
electric discharge machining of AISI D3 steel and EN-31 steel, International Journal of Current Engineering and
Technology 4(3): 1218-1222.
[7] ASTM A370, Standard Test Method and Definitions for Mechanical Testing of Steel Products, American Society for
Testing and Materials, Washington.
[8] ASTM A681, Standard Specification for Tool Steels Alloy, American Society for Testing and Materials, Washington.

353 Al-Khazraji et al.
© 2018 IAU, Arak Branch
[9] Bhattacharya R., Jain V.K., Ghoshdastidar P.S., 1996, Numerical simulation of thermal erosion in EDM process,
Journal of the Institution of Engineers Part PR, Production Engineering Division 77: 13-19.
[10] Yadav V., Jain V.K., Dixit P.M., 2002, Thermal stresses due to electrical discharge machining, International Journal of
Machine Tools and Manufacture 42: 877-888.
[11] Patel B.B., Rathod K.B., 2012, Multi-parameter analysis and modeling of surface roughness in electro cischarge
machining of AISI D2 steel, International Journal of Scientific & Engineering Research 3(6): 1-6.
[12] Shankar P., Jain V.K., Sundarajan T., 1997, Analysis of spark profiles during EDM process, Machining Science
Technology 1(2): 195-217.
[13] Marafona J., Chousal J.A., 2006, A finite element model of EDM based on the Joule effect, International Journal of
Machine Tools and Manufacture 46: 595-602.
[14] Shigley J.E., Mischke C.R., 2006, Mechanical Engineering Design, McGraw-Hill Inc.
![Degenerated graphite nodules influence on fatigue crack …The most common metallurgical defects in DCIs can be classified as follows [3]: Exploded graphite, mainly due to an excess](https://img.pdfslide.us/doc/110x75/613cac3b4c23507cb63588d6/degenerated-graphite-nodules-influence-on-fatigue-crack-the-most-common-metallurgical.jpg)