Embed Size (px)
Citation preview
Farming Systems in the Pastoral Zone of NSW: An
Economic Analysis
Salahadin A. Khairo John D. Mullen
Ronald B. Hacker Dean A. Patton
Economic Research Report No. 31
ii
Farming Systems in the Pastoral Zone of NSW: An Economic Analysis
Salahadin Khairo Economist, Pastures and Rangelands
NSW DPI, Trangie
John Mullen Research Leader, Economics Research
NSW DPI, Orange
Ron Hacker Research Leader, Pastures and Rangelands
NSW DPI, Trangie
Dean Patton Manager
Condobolin Agricultural Research Centre
March 2008 Economic Research Report No. 31
© NSW DPI 2008 This publication is copyright. Except as permitted under the Copyright Act 1968, no part of this publication may be reproduced by any process, electronic or otherwise, without the specific written permission of the copyright owner. Neither may information be stored electronically in any way whatever without such permission. ABSTRACT A ‘broad brush’ picture of farming in the pastoral zone of NSW is presented in this report. The pastoral zone of NSW is characterised by wide variations in climatic conditions, soil type and vegetation species. Hence representative faming system analysis was conducted for three sub-regions - the Upper Darling, the Murray-Darling and Far West. The regions were defined and described in terms of their resources, climate and the nature of agriculture. The main enterprises that farmers choose between were described and whole farm budgets and statements of assets and liabilities for the representative farms were developed. The representative farm models were used to compare traditional Merino based sheep enterprises with alternative sheep enterprises where meat was an important source of income. We found that the farming systems that have evolved in these areas are well suited to their respective environments and that the economic incentives to switch to more meat focussed sheep enterprises were not strong. JEL Classification Q160 ISSN 1442-9764 ISBN 978 0 7347 1881 5 Senior Author Contact Details Salahadin Khairo, NSW Department of Primary Industries, Trangie Agricultural Research Centre, PMB 19, Trangie, NSW, 2823. Telephone (02) 6880 8023; Facsimile (02) 6880 7201 Email: [email protected] Citation Khairo, S.A., Mullen, J.D., Hacker, R.B. & Patton, D.P (2008), Farming Systems in the Pastoral Zone of NSW: An Economic Analysis, Economic Research Report No.31, NSW DPI, Trangie, NSW. Available also at http://www.dpi.nsw.gov.au/research/areas/health-science/economics-research/reports
i
Table of Contents Page
List of Tables iii List of Figures iii Appendices iii Acknowledgments iv Acronyms and Abbreviations Used in this Report iv Executive summary v 1. Introduction 1 2. Uses of representative farm analysis 1 3. An Overview of the Pastoral Zone of NSW 2 4. Agricultural Production in the Pastoral Zone 4 4.1. Sheep enterprises 4 4.2. Cattle enterprises 6 4.3. Goat enterprises 6 4.4. Cropping enterprises 7 4.5. Recent changes in enterprise mix 7 5. Key Management Issues 8 5.1. Land degradation 8 5.2. Total grazing pressure 9 5.3. Woody shrubs 10 5.4. Loss of biodiversity 10 5.5. Rainfall variability 10 5.6. Labour utilisation 11 5.7. Government policy 11 6. Farming systems in the pastoral zone of NSW 12 6.1. The Upper Darling region farming system 12 6.2. The Murray-Darling region farming system 12 6.3. The Far West region farming system 14 7. Statistical Information 14 7.1. Trends in farm income, profit and debt 17 8. Whole farm budgets for representative farms 18 8.1. The Upper Darling region representative farm model 19 8.2. The Murray-Darling region representative farm model 21 8.3. The Far West region representative farm model 23 9. The profitability of alternative sheep enterprises 25 9.1. The SR Dorper and Damara 25 9.2. The SR Merino ewe enterprise with terminal sire enterprise 26 9.3. Comparing the various enterprises 27 10. Discussion and Conclusion 31
ii
List of Tables Table 4. 1 Calendar of operations for winter and spring lambing.............................................. 6 Table 4. 2 Recent changes in enterprise mix in the pastoral zone of NSW ............................... 7 Table 4. 3 Changes in sources of average income for individual producers.............................. 8 Table 7. 1 The average physical characteristics of producers in the pastoral zone of NSW
(1996 -2006). .................................................................................................................... 15 Table 7. 2 The average financial characteristics of producers in the pastoral zone of NSW
(1996 -2006). .................................................................................................................... 16 Table 7. 3 The average financial performace indicators of producers in the pastoral zone of
NSW (1996 -2006). .......................................................................................................... 17 Table 8. 1 Statements of assets and liabilities for the UD region representative farm ............ 20 Table 8. 2 Annual operating budgets for the UD region representative farm.......................... 21 Table 8. 3 Statements of assets and liabilities for the M-D region representative farm .......... 22 Table 8. 4 Annual operating budgets for the M-D region representative farm........................ 23 Table 8. 5 Statements of assets and liabilities for the FW region representative farm ............ 24 Table 8. 6 Annual operating budgets for the FW region representative farm.......................... 24 Table 9. 1 Profitability of alternative enterprises in the UD region representative farm......... 28 Table 9. 2 Profitability of alternative enterprise in the M-D region representative farm ........ 29 Table 9. 3 Profitability of alternative enterprise in the FW region farm.................................. 30
List of Figures Figure 3. 1 The Pastoral Zone of NSW...................................................................................... 2 Figure 3. 2 The long-term median monthly rainfall for Broken Hill, Bourke and Wentworth in
mm...................................................................................................................................... 3 Figure 4. 1 The average sheep numbers in the UD, the M-D and FW regions (‘000)............... 5 Figure 6. 1The agricultural production system in the extensive grazing land ......................... 13 Figure 7. 1 Farm cash income and business profit (1996-2006).............................................. 17 Figure 7. 2 Business debt and equity ratio (1996-2006) .......................................................... 18 Figure 9: 1 Rates of return on equity for alternative enterprises.............................................. 31
Appendices Appendix 1 Commodity price assumptions used in the whole-farm budgets.......................... 36 Appendix 2 GM budget for Wheat crop in the M-D region representative farm (McIntosh,
2004b)............................................................................................................................... 36 Appendix 3 Merino – Terminal Sire Flock Model Result (UD) .............................................. 37 Appendix 4 Merino – Terminal Sire Flock Model Result (M-D) ............................................ 38 Appendix 5 Merino – Terminal Sire Flock Model (FW) ......................................................... 39 Appendix 6 GM for Merino ewes enterprise (UD) .................................................................. 40 Appendix 7 GM for Terminal Sire enterprise (UD)................................................................. 41 Appendix 8 GM for Merino wether enterprise (UD) ............................................................... 42 Appendix 9 GM for the Dorper enterprise (UD)...................................................................... 43 Appendix 10 GM for the Damara enterprise (UD) .................................................................. 44 Appendix 11 Assumption used in calculating GM for alternative sheep enterprises .............. 45
iii
Acknowledgments The authors acknowledge the contributions of graziers, financial advisors and NSW DPI staff who supplied information and made comments on the draft of this economic research report. We particularly acknowledge the contribution of the Bestprac groups in Wilcannia, Trudie Atkinson, Alison Rowlands, Peter Jessop, Graeme McIntosh, Geoff Casburn, Alan Palmer and Alex Russell.
Acronyms and Abbreviations Used in this Report ABARE Australian Bureau of Agricultural and Resource Economics ABS Australian Bureau of Statistics ASC Australian Standard Classification BG Bestprac Group CFA Cull For Age CMA Catchment Management Authority
CSIRO Commonwealth Scientific and Industrial Research Organisation DLWC Department of Land and Water Conservation DSE Dry Sheep Equivalent FW Far West GM Gross Margin LBG Louth Bestprac Group LMDCMA Lower Murray-Darling Catchment Management Authority LMDCMB Lower Murray-Darling Catchment Management Board M-D Murray-Darling NIEIR National Institute of Economic and Industry Research PZ Pastoral Zone RLPB Rural Land Protection Board RP Representative Farm SAMM South African Meat Merino SLA Statistical Local Area SOI Southern Oscillation Index SR Self Replacing SSD Statistical Sub-Division TS Terminal Sire UD Upper Darling WCMA Western Catchment Management Authority WCMB Western Catchment Management Board WPF Wheat Pasture Fallow
iv
Executive summary The objectives of this report were to describe important farming systems in the pastoral zone of NSW in terms of their resources and constraints; and to develop representative farm models consisting of whole farm budgets and statements of assets and liabilities, allowing some indication to be gained of the financial performance of agriculture in the region. The representative farm models were also used to compare the profitability of traditional sheep breeding enterprises such as self-replacing Merino ewes and Merino wethers, with alternative breeds more directed to meat production using either terminal sires, or the Dorper or the Damara sheep breeds. Representative farm modelling and analysis are useful tools for describing and understanding the nature and financial characterises of important farming systems in a particular region. The models consist of a description of the physical and financial resources of the representative farm, and estimates of financial performance such as farm business profit, farm cash income and expenses, and business return on equity. The representative farm models can be used to give an indication not only of current performance but also of how farm income might be altered by a change in relative product prices, the introduction of a new technology, or a change in management, towards meat sheep for example. This report presents some examples of their application but importantly it provides a template for the development of additional whole-farm budgets for particular farms or for alternative farming systems in this and other regions. Because farming systems vary considerably across the pastoral zone we have identified three sub-regional farming systems, the Upper Darling (UD), the Murray-Darling (M-D) and the Far West (FW), and developed whole farm models to represent these three systems. The UD region includes the shires of Bourke, Brewarrina, Cobar and part of Walgett and is characterised by summer dominant rainfall averaging about 380mm. Agricultural production in the area is based primarily on sheep and cattle with limited dryland, irrigated and opportunistic cropping. The representative farm in the region has a total land area of about 24,000 hectares used for running about 9,000 dry sheep equivalents with total capital investment of about $1.5 million with an equity ratio of 85%. The representative farm makes about $85,185 farm business profit in a normal year giving business return on equity of 6.7%.
The M-D region covers the shires of Balranald and Wentworth and the surrounding areas with dominant winter rainfall averaging 225mm per annum. Agricultural production in the area is based on the integration of both livestock and cropping contributing about 62 and 38% to the total farm income, respectively. The representative farm in the region has about 25,000 hectares used for running about 8,800 dry sheep equivalents with some cropping and some land set aside as natural reserve. This region was used as a trial location for a land set aside project conducted in the 1990’s by the NSW State Government where landholders were able to “lock up” land that was highly valuable from a nature conservation perspective and develop other land on their farms that was suited for cropping The total capital assets of the representative farm amount to about $1.4 million with an equity ratio of 84%. In a normal year the representative farm earns about $160,605 farm business profit giving a 13.3% business return on equity.
v
vi
The FW region consists of the shires of Broken Hill, Central Darling and Unincorporated West regions of the pastoral zone of NSW with low and highly variable seasonal rainfall averaging 175mm per annum. In this system, sheep breeding for wool and meat dominates agricultural production contributing over 98% of the total farm income of individual producers. The representative farm in the region has a total land area of about 35,000 hectares running 7,000 dry sheep equivalents. Its total capital asset value is about $0.883 million with an equity ratio of about 80%. The business return on equity for the representative farm is about 14% from farm business profit of about $98,312 in a normal year.
The key management issues relevant to producers are the structure of livestock enterprises in the pastoral zones given the volatility of wool price since the demise of the reserve price scheme in 1989, the difficulty of finding labour and shearers and the availability of meat only breeds such as Dorper and Damara. The representative farm models were used to compare traditional Merino based sheep enterprises with alternative sheep enterprises where the sale of lamb was an important source of income. The alternatives included SR Merinos with a proportion of ewes mated to a terminal sire for prime lamb production, Merino wethers only, SR ewe Merinos only, and SR Dorper and Damara enterprises. We found that the farming systems that have evolved in these areas are well suited to their respective environments and that the economic incentives to switch to more meat focussed sheep enterprises were not strong unless the supply of labour for shearing becomes an intractable issue.
1. Introduction In this report, a ‘broad brush’ picture of farming in the pastoral zone of NSW is presented. The region is defined and described in terms of its resources, climate and the nature of agriculture. The main enterprises that farmers choose between are described and GM budgets for these enterprises are presented. The pastoral zone of NSW is characterised as an arid environment and spans various climatic zones from summer dominant rainfall in the north to winter dominant rainfall in the south, with wide variation in soil types and vegetation species. Livestock production from pasture is the main source of farm income although agricultural diversification has permitted limited production of other agricultural commodities. Diversification away from grazing activities has been limited by legislation. Much of the land used for agricultural production is leasehold land for the purpose of grazing and special permits are required for alternative uses. The choice of enterprises is influenced not only by their profitability as independent enterprises but also by their contribution to other enterprises in the farming system. The labour and capital resources of the farm also have an influence on the choice and size of enterprises These interrelationships mean that any changes within enterprises require examination in a whole-farm context. Hence an important part of this report is the presentation of “model” farms that represent common farming systems in the Pastoral Zone. These representative farms are described in terms of land, labour and machinery resources and enterprises and their rotation within the farms. That information, together with GM and overhead cost information, has been used to develop whole-farm budgets. This report is organised in four sections. The first section presents an overview of the pastoral zone of NSW in terms of its resources and constraints. The second part describes and presents representative farm models for the UD, the M-D and FW regions farming systems. The third part assesses the profitability of running alternative sheep enterprises and the final section presents a discussion and draws some conclusions. The enterprise and whole-farm budgets are all available as spreadsheet models which can be manipulated by someone with reasonable skills in Microsoft® EXCELTM 2. Uses of representative farm analysis This report presents a description of farming in the pastoral zone and an indication of its profitability. The whole-farm budget provides a ‘snapshot’ at a particular point in time of a farm with a particular set of resources. However while this report may give a broad indication of what is happening on many farms in the pastoral zone, it may be misleading for farms with markedly different soil type, climate and resources to those of the representative farm. The representative farm models and associated GM and whole-farm budgets can be used as a template allowing variations from the representative farms to be examined. Individual farmers may wish to adapt them for their own farms. They can also be used to give an indication of how farm income might be altered by some new technology, with respect to the type of sheep being run for example. However, it is only an indication as the particular circumstances of individual farms are likely to give them different outcomes. Additionally, while the whole-farm budget can be manipulated to indicate the change in farm income from a new technology or resource management strategy, we only get a view of
1
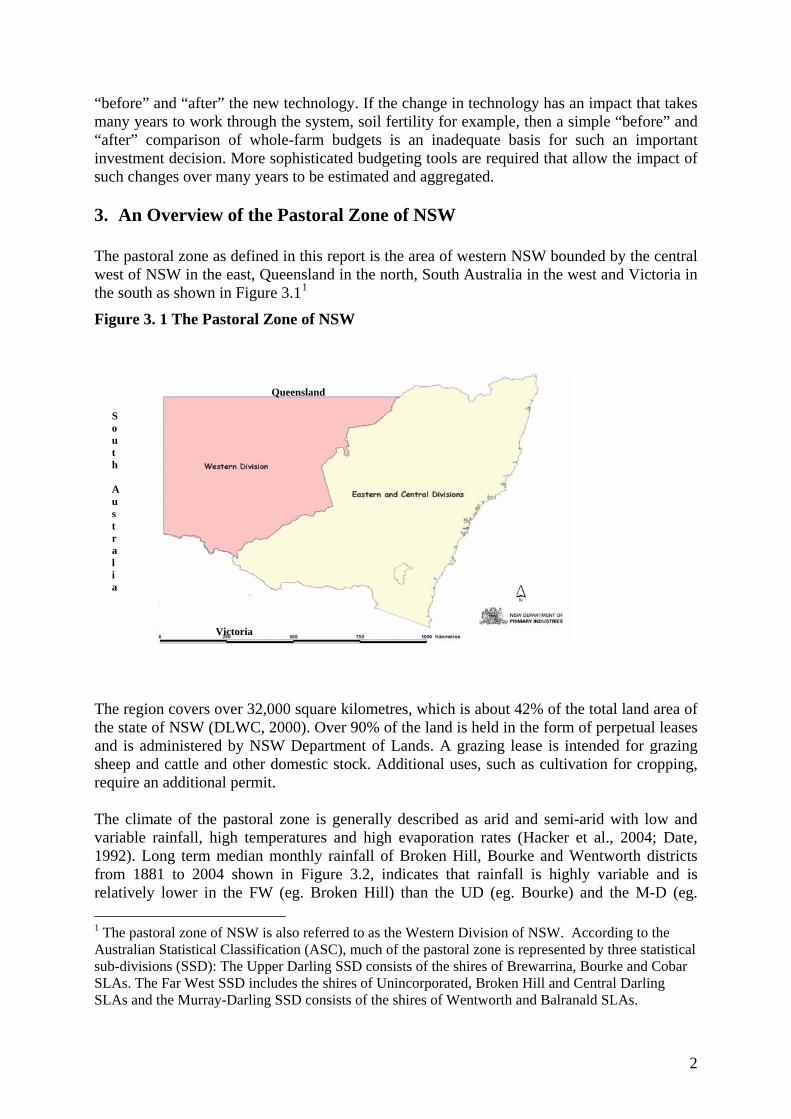
“before” and “after” the new technology. If the change in technology has an impact that takes many years to work through the system, soil fertility for example, then a simple “before” and “after” comparison of whole-farm budgets is an inadequate basis for such an important investment decision. More sophisticated budgeting tools are required that allow the impact of such changes over many years to be estimated and aggregated. 3. An Overview of the Pastoral Zone of NSW The pastoral zone as defined in this report is the area of western NSW bounded by the central west of NSW in the east, Queensland in the north, South Australia in the west and Victoria in the south as shown in Figure 3.11
Figure 3. 1 The Pastoral Zone of NSW
Queensland
The region covers over 32,000 square kilometres, which is about 42% of the total land area of the state of NSW (DLWC, 2000). Over 90% of the land is held in the form of perpetual leases and is administered by NSW Department of Lands. A grazing lease is intended for grazing sheep and cattle and other domestic stock. Additional uses, such as cultivation for cropping, require an additional permit. The climate of the pastoral zone is generally described as arid and semi-arid with low and variable rainfall, high temperatures and high evaporation rates (Hacker et al., 2004; Date, 1992). Long term median monthly rainfall of Broken Hill, Bourke and Wentworth districts from 1881 to 2004 shown in Figure 3.2, indicates that rainfall is highly variable and is relatively lower in the FW (eg. Broken Hill) than the UD (eg. Bourke) and the M-D (eg.
South Aus t ralia
Victoria
1 The pastoral zone of NSW is also referred to as the Western Division of NSW. According to the Australian Statistical Classification (ASC), much of the pastoral zone is represented by three statistical sub-divisions (SSD): The Upper Darling SSD consists of the shires of Brewarrina, Bourke and Cobar SLAs. The Far West SSD includes the shires of Unincorporated, Broken Hill and Central Darling SLAs and the Murray-Darling SSD consists of the shires of Wentworth and Balranald SLAs.
2
3
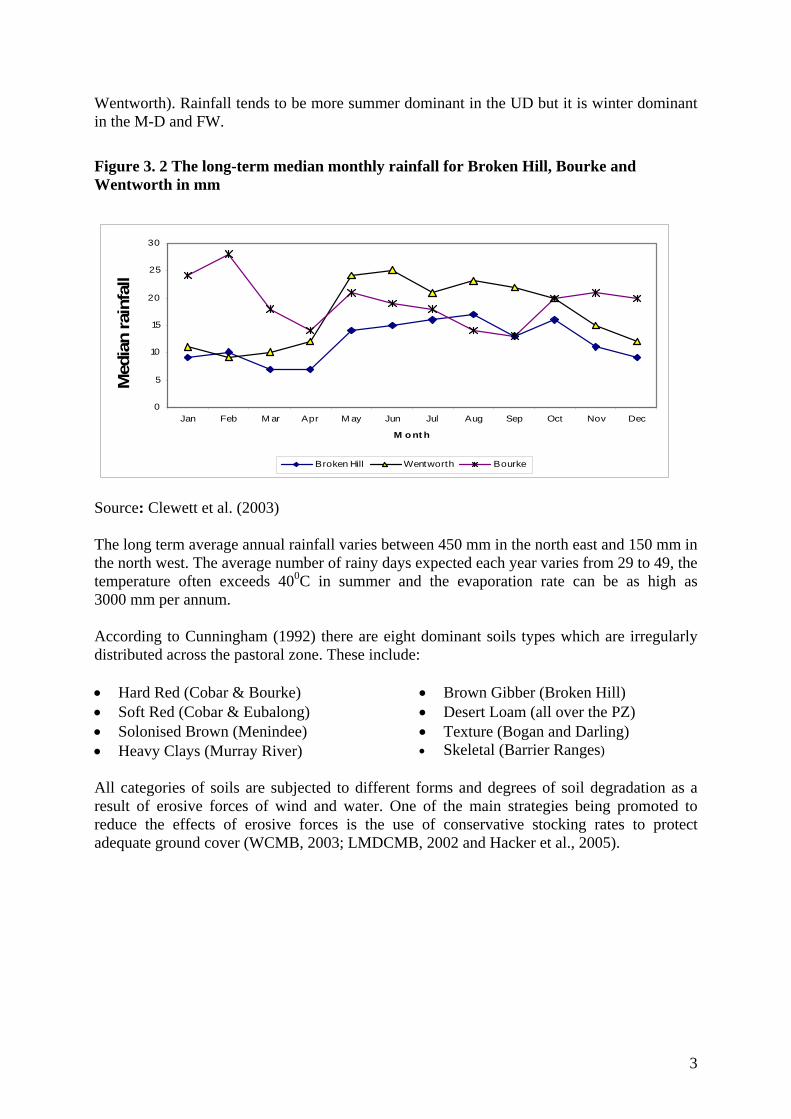
Wentworth). Rainfall tends to be more summer dominant in the UD but it is winter dominant in the M-D and FW.
Figure 3. 2 The long-term median monthly rainfall for Broken Hill, Bourke and Wentworth in mm
0
5
10
15
20
25
30
Jan Feb M ar Apr M ay Jun Jul Aug Sep Oct Nov Dec
M ont h
Med
ian
rain
fall
Broken Hill Wentworth Bourke
Source: Clewett et al. (2003) The long term average annual rainfall varies between 450 mm in the north east and 150 mm in the north west. The average number of rainy days expected each year varies from 29 to 49, the temperature often exceeds 400C in summer and the evaporation rate can be as high as 3000 mm per annum. According to Cunningham (1992) there are eight dominant soils types which are irregularly distributed across the pastoral zone. These include: • Hard Red (Cobar & Bourke) • Brown Gibber (Broken Hill) • Soft Red (Cobar & Eubalong) • Desert Loam (all over the PZ) • Solonised Brown (Menindee) • Texture (Bogan and Darling)
• Skeletal (Barrier Ranges) • Heavy Clays (Murray River) All categories of soils are subjected to different forms and degrees of soil degradation as a result of erosive forces of wind and water. One of the main strategies being promoted to reduce the effects of erosive forces is the use of conservative stocking rates to protect adequate ground cover (WCMB, 2003; LMDCMB, 2002 and Hacker et al., 2005).
The vegetation species also reflect the variability in rainfall and soil types (DLWC, 2000 & Hacker et al., 2005). The main vegetation species in the pastoral zone comprise:
• Belah and Blue bush; • Bimble box-pine; • Downs country; • Gidgee and Brigalow; • Mallee; • Mitchell grass plains;
• Mulga; • Northern Flood plains; • Saltbush plains; • Southern grass land; • Southern riverine woodlands;
Pasture for livestock production is derived from a wide range of annual and perennial grasses and forages growing in different environments. Many annual plant species are sources of pasture for livestock production; whereas perennial plant species provide stability to the rangeland system. In the northern regions where red soils and summer rainfall are dominant, a wide range of grasses and forages are the major sources of pasture. In the southern areas where brown soils and winter rainfall dominate, shrubs are an important source of forage for animal production (Brooke and McGarva, 1998). 4. Agricultural Production in the Pastoral Zone Agriculture in the pastoral zone of NSW began in the 1830s when the first European settlers arrived in the region with a large number of sheep and cattle and established a semi-nomadic pastoral system (Condon, 1999). Sheep enterprises dominated cattle enterprises as financial returns from cattle enterprises fluctuated more widely in response to changes in climate (Cunningham, 1992). In recent years there has been increasing interest in dryland and irrigated cropping on properties along the banks of rivers and on properties with cropping licences (DLWC, 2000). Legal restrictions on leaseholders in the pastoral zone have prevented more widespread crop production.
4.1. Sheep enterprises
The sheep industry is predominantly based on Merino breeding for wool and meat production with a small percentage of cross-breeding enterprises with a greater emphasis on meat production. Merinos are the dominant sheep type in the area because of their ability to produce wool hence income in what is typically a harsh production environment and the marketability of any class of animal at any time in the year. Other sheep breeds, with greater emphasis on meat production such as SAMM, dual purpose types and in some cases the no wool types such as the Dorpers, the Damaras, are being adopted as alternative sources of farm income.
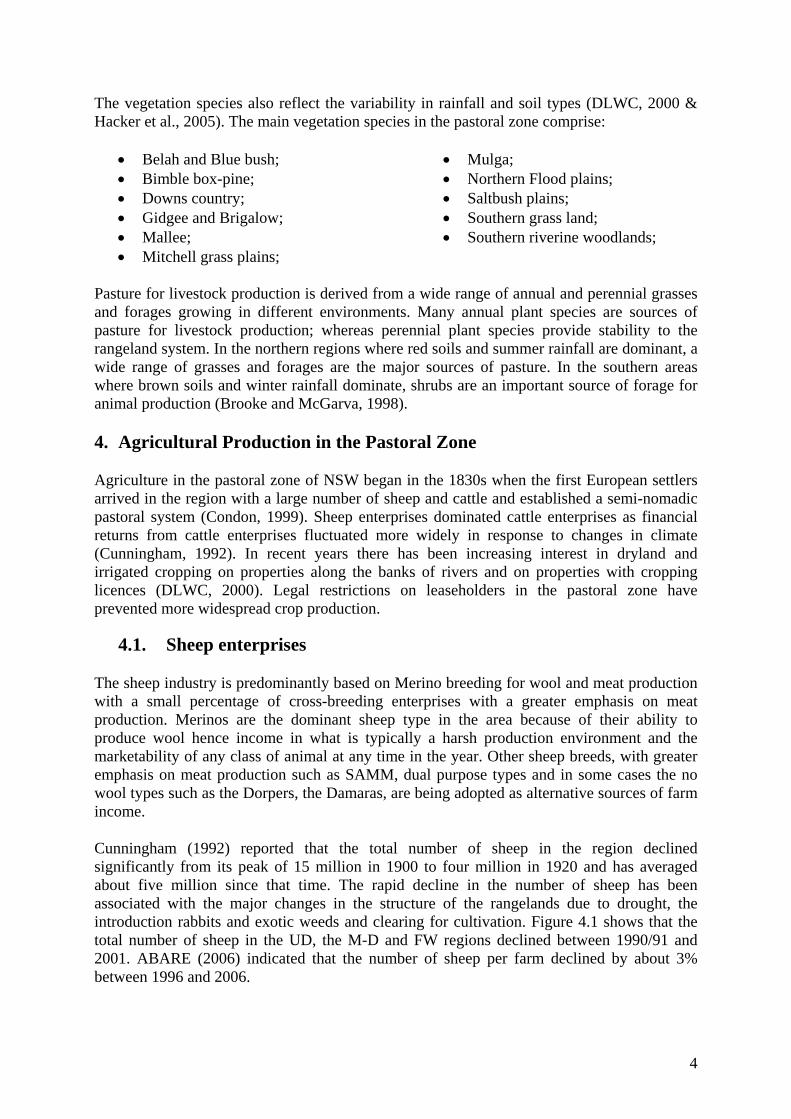
Cunningham (1992) reported that the total number of sheep in the region declined significantly from its peak of 15 million in 1900 to four million in 1920 and has averaged about five million since that time. The rapid decline in the number of sheep has been associated with the major changes in the structure of the rangelands due to drought, the introduction rabbits and exotic weeds and clearing for cultivation. Figure 4.1 shows that the total number of sheep in the UD, the M-D and FW regions declined between 1990/91 and 2001. ABARE (2006) indicated that the number of sheep per farm declined by about 3% between 1996 and 2006.
4
Figure 4. 1 The average sheep numbers in the UD, the M-D and FW regions ('000)
0
500
1000
1500
2000
2500
3000
3500
1990
/91
1991
/92
1992
/93
1993
/94
1994
/95
1995
/96
1997
2001
Year
Shee
p nu
mbe
r
Upper Darling Murray-Darling Far West
Source: ABS (1997 and 2001)
Although the number and profile of sheep run on individual properties vary with the resource characteristics of farms, self-replacing Merino ewes and Merino wether enterprises are the most common enterprises in the region. In the SR Merino enterprise, replacement breeding ewes are obtained from ewe hoggets produced in the system. The calendar of operations presented in Table 4.1, shows that ewes are joined with rams for up to eight weeks between December and March and lambing is either in winter or spring. Shearing, marking and mulesing operations are done at different times during the year. Marketing operations are also done throughout the year. In a self-replacing Merino enterprise, farm revenue is achieved through the sale of wool, ewes culled for age, surplus ewe hoggets, and wether weaners. In Merino wether enterprises, income is achieved through the sale of wool and wethers culled for age. Sheep are sold to local or export markets whereas wool is sold at Sydney and Adelaide wool marketing centres.
5
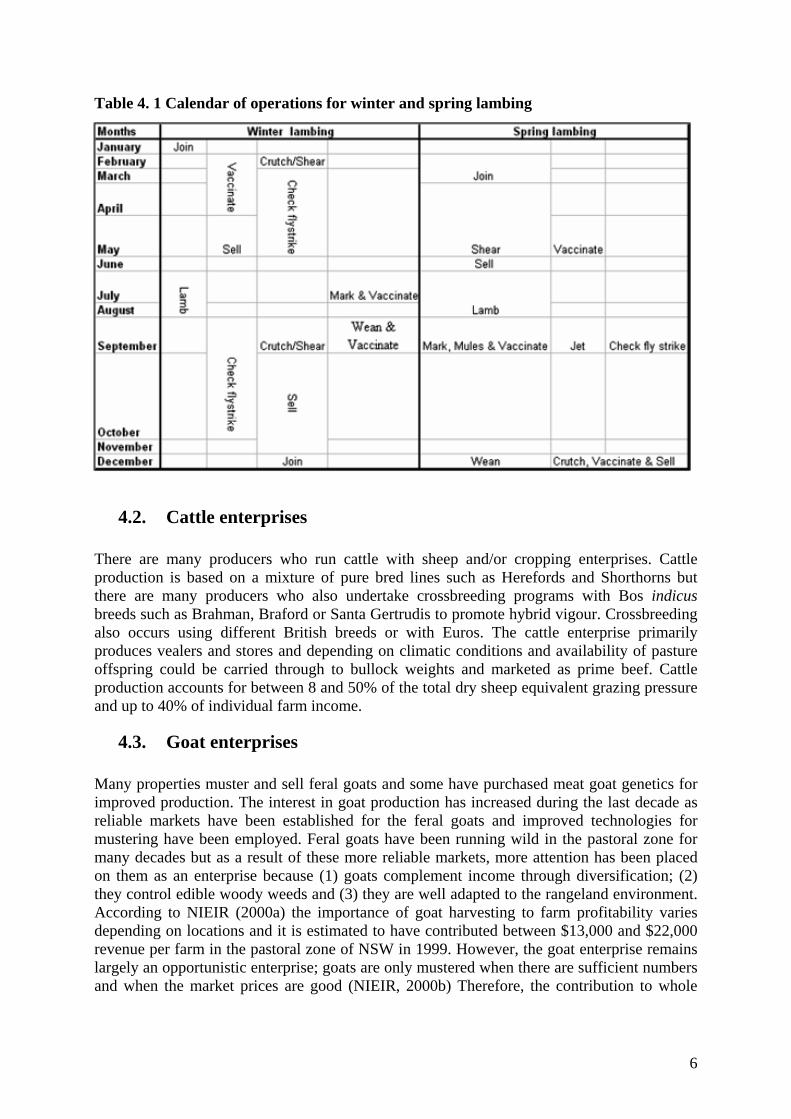
Table 4. 1 Calendar of operations for winter and spring lambing
4.2. Cattle enterprises There are many producers who run cattle with sheep and/or cropping enterprises. Cattle production is based on a mixture of pure bred lines such as Herefords and Shorthorns but there are many producers who also undertake crossbreeding programs with Bos indicus breeds such as Brahman, Braford or Santa Gertrudis to promote hybrid vigour. Crossbreeding also occurs using different British breeds or with Euros. The cattle enterprise primarily produces vealers and stores and depending on climatic conditions and availability of pasture offspring could be carried through to bullock weights and marketed as prime beef. Cattle production accounts for between 8 and 50% of the total dry sheep equivalent grazing pressure and up to 40% of individual farm income.
4.3. Goat enterprises Many properties muster and sell feral goats and some have purchased meat goat genetics for improved production. The interest in goat production has increased during the last decade as reliable markets have been established for the feral goats and improved technologies for mustering have been employed. Feral goats have been running wild in the pastoral zone for many decades but as a result of these more reliable markets, more attention has been placed on them as an enterprise because (1) goats complement income through diversification; (2) they control edible woody weeds and (3) they are well adapted to the rangeland environment. According to NIEIR (2000a) the importance of goat harvesting to farm profitability varies depending on locations and it is estimated to have contributed between $13,000 and $22,000 revenue per farm in the pastoral zone of NSW in 1999. However, the goat enterprise remains largely an opportunistic enterprise; goats are only mustered when there are sufficient numbers and when the market prices are good (NIEIR, 2000b) Therefore, the contribution to whole
6
farm profit is highly variable and for this reason we have not included it in our representative farm models.
4.4. Cropping enterprises Although cropping is regulated in the pastoral zone, more producers are undertaking dryland, lake-bed or flood plain and irrigated cropping. Annual cropping is restricted to the eastern and southern areas of the pastoral zone and is allowed on private properties and under permit only. Further west, cropping is undertaken on an opportunistic basis. The cropping industry produces a wide range of cereal and non-cereal crops. The cropping activities are dominated by wheat and barley production with small areas of maize, oats, cereal rye, sorghum and triticale (ABS, 2001). The dominant non-cereal crops produced are cotton and canola, though they tend to be grown only on irrigated land. The less common non-cereal crops are chickpeas and safflower.
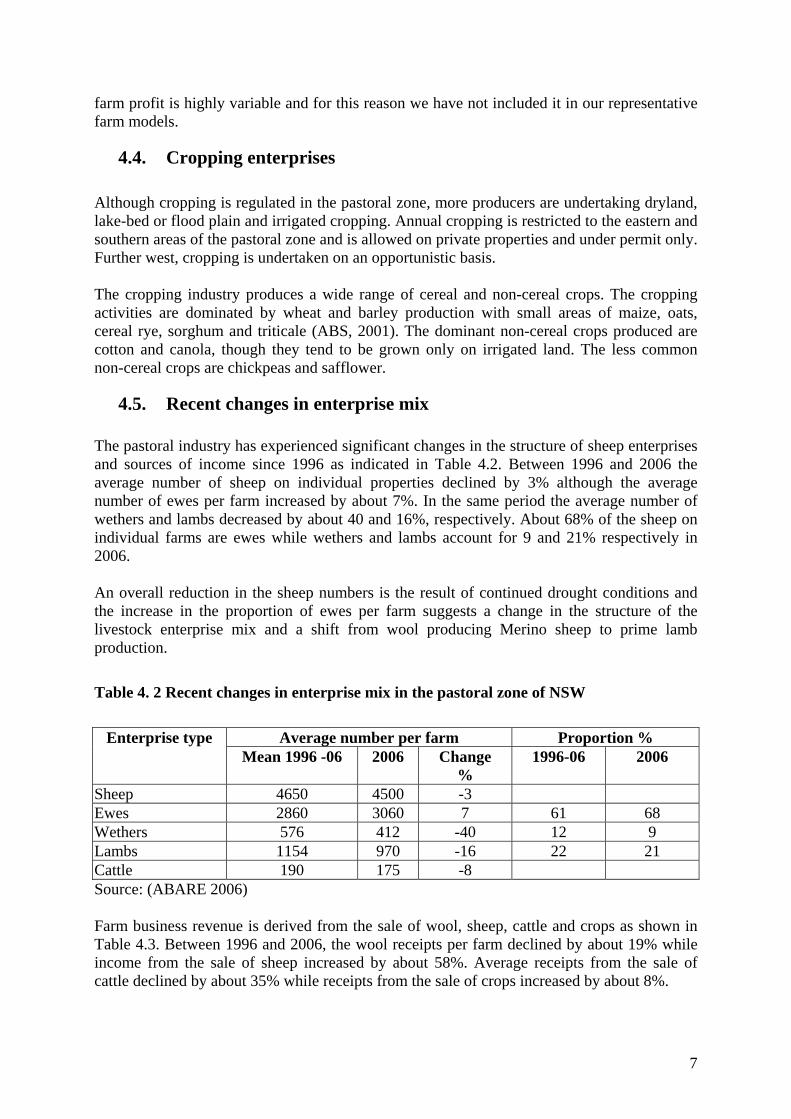
4.5. Recent changes in enterprise mix The pastoral industry has experienced significant changes in the structure of sheep enterprises and sources of income since 1996 as indicated in Table 4.2. Between 1996 and 2006 the average number of sheep on individual properties declined by 3% although the average number of ewes per farm increased by about 7%. In the same period the average number of wethers and lambs decreased by about 40 and 16%, respectively. About 68% of the sheep on individual farms are ewes while wethers and lambs account for 9 and 21% respectively in 2006. An overall reduction in the sheep numbers is the result of continued drought conditions and the increase in the proportion of ewes per farm suggests a change in the structure of the livestock enterprise mix and a shift from wool producing Merino sheep to prime lamb production.
Table 4. 2 Recent changes in enterprise mix in the pastoral zone of NSW
Average number per farm Proportion % Enterprise type
Mean 1996 -06 2006 Change %
1996-06 2006
Sheep 4650 4500 -3 Ewes 2860 3060 7 61 68 Wethers 576 412 -40 12 9 Lambs 1154 970 -16 22 21 Cattle 190 175 -8 Source: (ABARE 2006) Farm business revenue is derived from the sale of wool, sheep, cattle and crops as shown in Table 4.3. Between 1996 and 2006, the wool receipts per farm declined by about 19% while income from the sale of sheep increased by about 58%. Average receipts from the sale of cattle declined by about 35% while receipts from the sale of crops increased by about 8%.
7
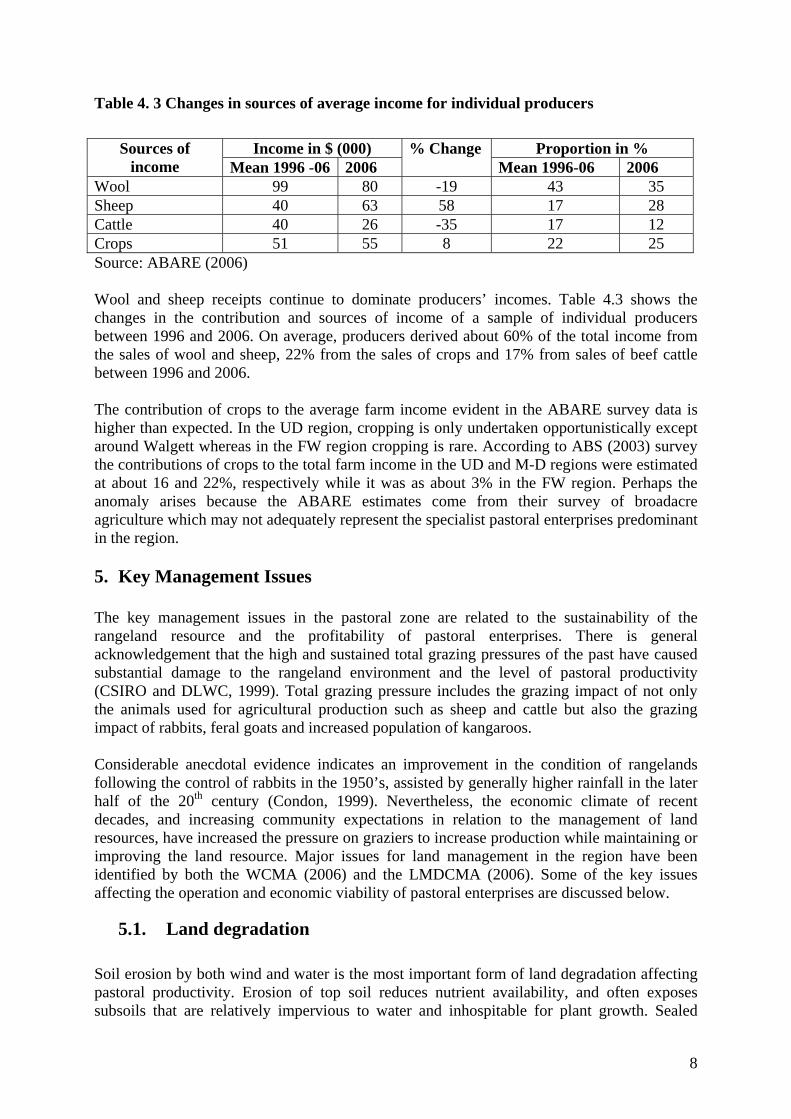
Table 4. 3 Changes in sources of average income for individual producers
Income in $ (000) Proportion in % Sources of income Mean 1996 -06 2006
% Change Mean 1996-06 2006
Wool 99 80 -19 43 35 Sheep 40 63 58 17 28 Cattle 40 26 -35 17 12 Crops 51 55 8 22 25 Source: ABARE (2006) Wool and sheep receipts continue to dominate producers’ incomes. Table 4.3 shows the changes in the contribution and sources of income of a sample of individual producers between 1996 and 2006. On average, producers derived about 60% of the total income from the sales of wool and sheep, 22% from the sales of crops and 17% from sales of beef cattle between 1996 and 2006. The contribution of crops to the average farm income evident in the ABARE survey data is higher than expected. In the UD region, cropping is only undertaken opportunistically except around Walgett whereas in the FW region cropping is rare. According to ABS (2003) survey the contributions of crops to the total farm income in the UD and M-D regions were estimated at about 16 and 22%, respectively while it was as about 3% in the FW region. Perhaps the anomaly arises because the ABARE estimates come from their survey of broadacre agriculture which may not adequately represent the specialist pastoral enterprises predominant in the region. 5. Key Management Issues
The key management issues in the pastoral zone are related to the sustainability of the rangeland resource and the profitability of pastoral enterprises. There is general acknowledgement that the high and sustained total grazing pressures of the past have caused substantial damage to the rangeland environment and the level of pastoral productivity (CSIRO and DLWC, 1999). Total grazing pressure includes the grazing impact of not only the animals used for agricultural production such as sheep and cattle but also the grazing impact of rabbits, feral goats and increased population of kangaroos. Considerable anecdotal evidence indicates an improvement in the condition of rangelands following the control of rabbits in the 1950’s, assisted by generally higher rainfall in the later half of the 20th century (Condon, 1999). Nevertheless, the economic climate of recent decades, and increasing community expectations in relation to the management of land resources, have increased the pressure on graziers to increase production while maintaining or improving the land resource. Major issues for land management in the region have been identified by both the WCMA (2006) and the LMDCMA (2006). Some of the key issues affecting the operation and economic viability of pastoral enterprises are discussed below.
5.1. Land degradation Soil erosion by both wind and water is the most important form of land degradation affecting pastoral productivity. Erosion of top soil reduces nutrient availability, and often exposes subsoils that are relatively impervious to water and inhospitable for plant growth. Sealed
8
surfaces produced by sheet erosion on gently sloping areas result in excessive run off and substantially reduce the capacity of the landscape to produce forage. However, the extent of erosion varies across land types and localities from minor to severe. It has been noted that restoration of eroded areas is often difficult and may require mechanical intervention, which is uneconomic, and require changes to grazing management that ensure retention of ground cover. Loss or reduction of perennial forage species is an almost ubiquitous form of land degradation with significant implications for pastoral production. Animal production is closely linked to the availability of green feed (Freudenberger et al., 1999) and continuity of the green feed supply can only be maximised, in a semi-arid environment, by the presence and relative abundance of perennial forage species. These include both grasses and shrubs, particularly chenopod shrubs. Reduction of the former is probably most severe in the poplar box, pine and mulga woodlands of the Cobar pediplain while the latter have been severely reduced in the ‘rosewood-belah’ country and over extensive areas of stony downs country in the Far West. While some improvements in rangeland condition have been noted since the 1950’s, the productivity of pastoral land is probably still well below its potential in many areas, particularly those where reduction of perennial grasses is associated with encroachment by woody species (see below). Management changes necessary to facilitate the restoration of perennial species include the adoption of tactical grazing management (e.g. Campbell and Hacker, 2000) that adjusts the level and timing of grazing in relation to the needs of the vegetation and the opportunities or threats imposed by climatic conditions.
5.2. Total grazing pressure Total grazing pressure is the demand for forage from all herbivores relative to the available supply. Non domestic herbivores, particularly rabbits, feral goats and kangaroos, can account for a substantial portion of the total forage demand. Hacker and McLeod (2003) estimated that the kangaroo population of the pastoral zone has in recent decades varied from about 45% to 60% of the livestock population on a DSE basis, or between 28-40% of the total animal population excluding rabbits and feral goats. When combined, the forage consumed by non-domestic herbivores can represent a significant level of competition for livestock. Under good seasonal conditions the demand by all species can be satisfied but when conditions deteriorate, the level of competition increases and pastoralists suffer increasing economic impact. Under low forage conditions, the effect of one kangaroo on wool growth or sheep live weight gain has been estimated to equal approximately 0.6 sheep of equivalent weight (Wilson, 1991). Competition between sheep and kangaroos is most likely when forage availability falls below about 300 kg/ha (Short, 1987). Rabbit populations have been substantially reduced since the release of the rabbit calicivirus in the late 1990s. Feral goat numbers have probably also declined since this time with the development of relatively stable markets, the more widespread use of self mustering or trapping facilities and the establishment of domesticated goat enterprises on some properties. Control of total grazing pressure is a fundamental requirement for management aimed at addressing the land degradation issues discussed above. Kangaroos remain, for graziers, the most serious source of concern in this respect although Hacker and McLeod 2003 suggested
9
some simple management practices that can help manage their impact especially when sheep are removed from an area to allow regeneration.
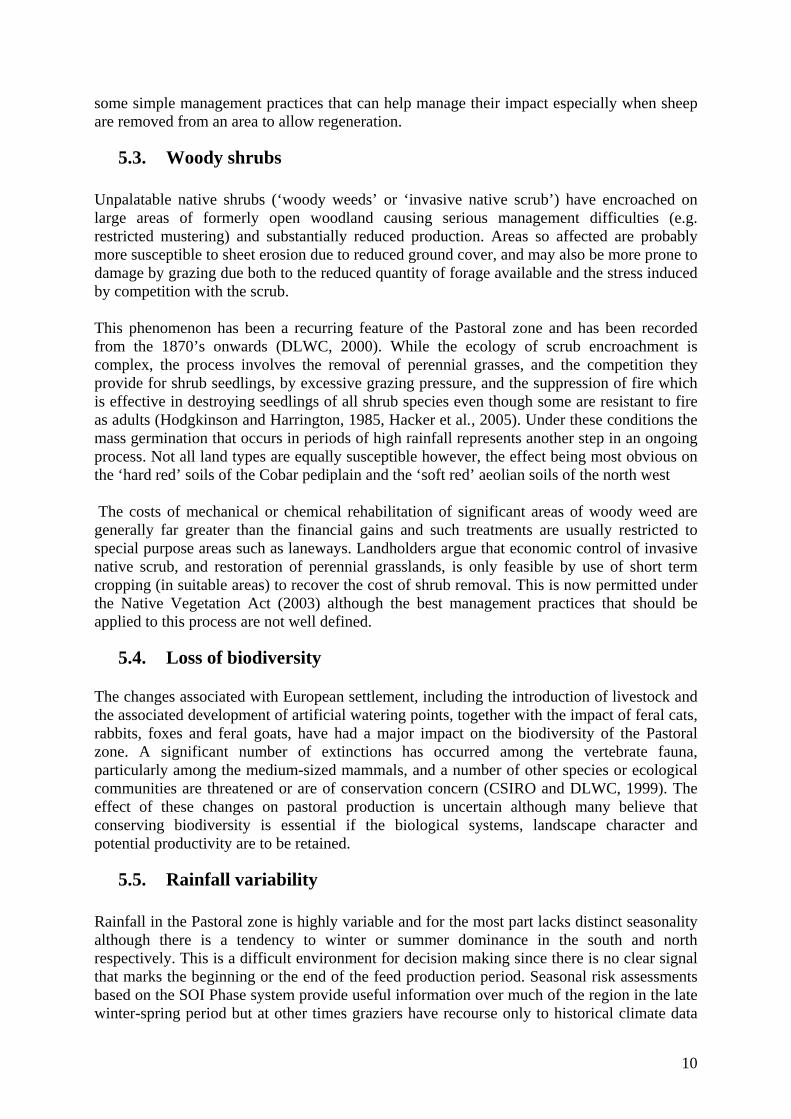
5.3. Woody shrubs Unpalatable native shrubs (‘woody weeds’ or ‘invasive native scrub’) have encroached on large areas of formerly open woodland causing serious management difficulties (e.g. restricted mustering) and substantially reduced production. Areas so affected are probably more susceptible to sheet erosion due to reduced ground cover, and may also be more prone to damage by grazing due both to the reduced quantity of forage available and the stress induced by competition with the scrub. This phenomenon has been a recurring feature of the Pastoral zone and has been recorded from the 1870’s onwards (DLWC, 2000). While the ecology of scrub encroachment is complex, the process involves the removal of perennial grasses, and the competition they provide for shrub seedlings, by excessive grazing pressure, and the suppression of fire which is effective in destroying seedlings of all shrub species even though some are resistant to fire as adults (Hodgkinson and Harrington, 1985, Hacker et al., 2005). Under these conditions the mass germination that occurs in periods of high rainfall represents another step in an ongoing process. Not all land types are equally susceptible however, the effect being most obvious on the ‘hard red’ soils of the Cobar pediplain and the ‘soft red’ aeolian soils of the north west The costs of mechanical or chemical rehabilitation of significant areas of woody weed are generally far greater than the financial gains and such treatments are usually restricted to special purpose areas such as laneways. Landholders argue that economic control of invasive native scrub, and restoration of perennial grasslands, is only feasible by use of short term cropping (in suitable areas) to recover the cost of shrub removal. This is now permitted under the Native Vegetation Act (2003) although the best management practices that should be applied to this process are not well defined.
5.4. Loss of biodiversity The changes associated with European settlement, including the introduction of livestock and the associated development of artificial watering points, together with the impact of feral cats, rabbits, foxes and feral goats, have had a major impact on the biodiversity of the Pastoral zone. A significant number of extinctions has occurred among the vertebrate fauna, particularly among the medium-sized mammals, and a number of other species or ecological communities are threatened or are of conservation concern (CSIRO and DLWC, 1999). The effect of these changes on pastoral production is uncertain although many believe that conserving biodiversity is essential if the biological systems, landscape character and potential productivity are to be retained.
5.5. Rainfall variability Rainfall in the Pastoral zone is highly variable and for the most part lacks distinct seasonality although there is a tendency to winter or summer dominance in the south and north respectively. This is a difficult environment for decision making since there is no clear signal that marks the beginning or the end of the feed production period. Seasonal risk assessments based on the SOI Phase system provide useful information over much of the region in the late winter-spring period but at other times graziers have recourse only to historical climate data
10
or to ‘trigger points’ for decision making based on historical pasture growth simulations (Hacker et al., 2006). If they expect rainfall to be low, graziers may adopt a number of alternative management strategies for minimising production risk. These strategies include production feeding, maintenance feeding1 and agistment. Production feeding is not common but maintenance feeding, not traditionally considered an option for Pastoral zone graziers, has been more widely practised in recent years (Mackay, 2002).
5.6. Labour utilisation The labour utilisation index measures hours worked by the residential labour force compared to available working hours. It is calculated as the total hours worked divided by the labour force and multiplied by 37.5 to provide the labour utilisation rate. The labour utilisation rate for the pastoral zone and Australia are 60 and 80%, respectively (NIEIR, 2000b). Walgett and Brewarrina particularly have a lower labour utilisation index of about 54% which is very low relative to other parts of the pastoral zone. A low rate means that there are many workers in part time and casual jobs representing underutilisation of labour and lower spending in the local economy. Consequently, there has been constant migration of labour from regional centres to cities creating labour shortages during peak seasons of pastoral operations and affecting their timeliness.
5.7. Government policy Recent and current policy initiatives in the region are concerned with both the viability of rangeland enterprises and natural resource management. The WEST 2000 and WEST 2000 Plus Regional Partnership Programs in the late 1990s and early 2000’s sought to address both of these issues through the provision of a wide range of assistance measures for property amalgamation, debt reconstruction, exit from the industry, infrastructure development, natural resource management and education and training. Some of these measures, particularly in relation to natural resource management, have effectively continued through the Catchment Action Plans of the Western and Lower Murray-Darling CMAs. Some of the strategies involve partnerships between community, industry and government organisations to communicate knowledge and new industry initiatives to reduce resource degradation and maintain viable income. Hacker (2004) argued that the current policy settings in relation to land administration, drought, taxation and other financial measures (eg Farm Management Deposits) did not provide an adequate framework for the management of environmental risk in the rangelands. In particular, policies are lacking that discourage short term profit taking and promote longer term environmental outcomes, which directly relate assistance to those outcomes, and actively encourage learning and adaptation by land managers. Incentive-based policies were argued to have the potential to redress these deficiencies. The Enterprise Based Conservation pilot project initiated by the WEST 2000 Plus program and currently administered by the Western Catchment Management Authority is an example of one such policy initiative (Shepherd, 2006). 2 Production or maintenance feeding involves providing supplementary feed to satisfy either the production or maintenance requirements of livestock until conditions improve.
11
6. Farming systems in the pastoral zone of NSW
A farming system is defined as a complex agricultural production process in which various combinations of inputs are managed by farmers and influenced by environmental, economic, institutional and social factors to produce income (Swift, 1994). In particular, the interaction of the various elements of climate and natural resources affect the quality and quantity of pasture available for livestock which pastoral producers manage within an economic environment to earn income and reduce risk.
The production system in the pastoral zone can be thought of as a series of linked subsystems as shown in Figure 6.1. The various combinations of climatic variables and natural resource conditions affect the types of farming systems adopted and the production risk associated with them. Because of variation in climate and natural resource endowments across the pastoral zone, we have identified three main farming systems: the Upper Darling, the Murray-Darling and the Far West regions farming systems.
6.1. The Upper Darling region farming system The Upper Darling region faming system is characterised by a mixed farming system of sheep and cattle enterprises but with limited cropping. The system covers much of the Upper Darling area including the shires of Bourke, Brewarrina, Cobar and south west of Walgett with dominant summer rainfall averaging about 380 mm per annum and with 36 rain events per year (Clewett et al., 2003).
Ewes are generally kept on the better part of the property whereas wethers are kept on the rest (Weilmoringle BG, 2001 & Louth BG, 2001). Although the cattle enterprise contributes up to 40 per cent to the total farm income, it receives less management attention because its financial returns fluctuate widely with changes in climate. Pasture is managed using continuous, rotational and deferred grazing systems and stocking rates vary depending on the quality and quantity of pastures. Dryland, irrigated and opportunistic cropping are undertaken on private properties and on leasehold properties with cropping licences. There are some producers who harvest feral goats out of hills and scrubby areas.
6.2. The Murray-Darling region farming system
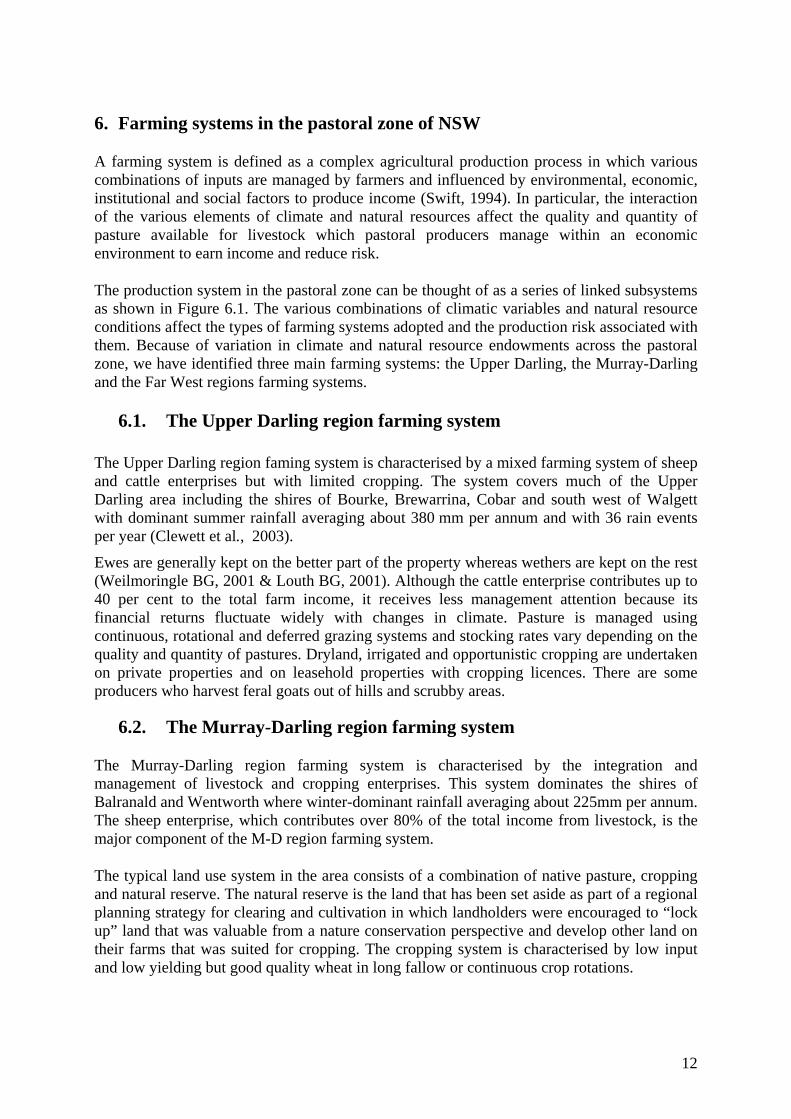
The Murray-Darling region farming system is characterised by the integration and management of livestock and cropping enterprises. This system dominates the shires of Balranald and Wentworth where winter-dominant rainfall averaging about 225mm per annum. The sheep enterprise, which contributes over 80% of the total income from livestock, is the major component of the M-D region farming system.
The typical land use system in the area consists of a combination of native pasture, cropping and natural reserve. The natural reserve is the land that has been set aside as part of a regional planning strategy for clearing and cultivation in which landholders were encouraged to “lock up” land that was valuable from a nature conservation perspective and develop other land on their farms that was suited for cropping. The cropping system is characterised by low input and low yielding but good quality wheat in long fallow or continuous crop rotations.
12
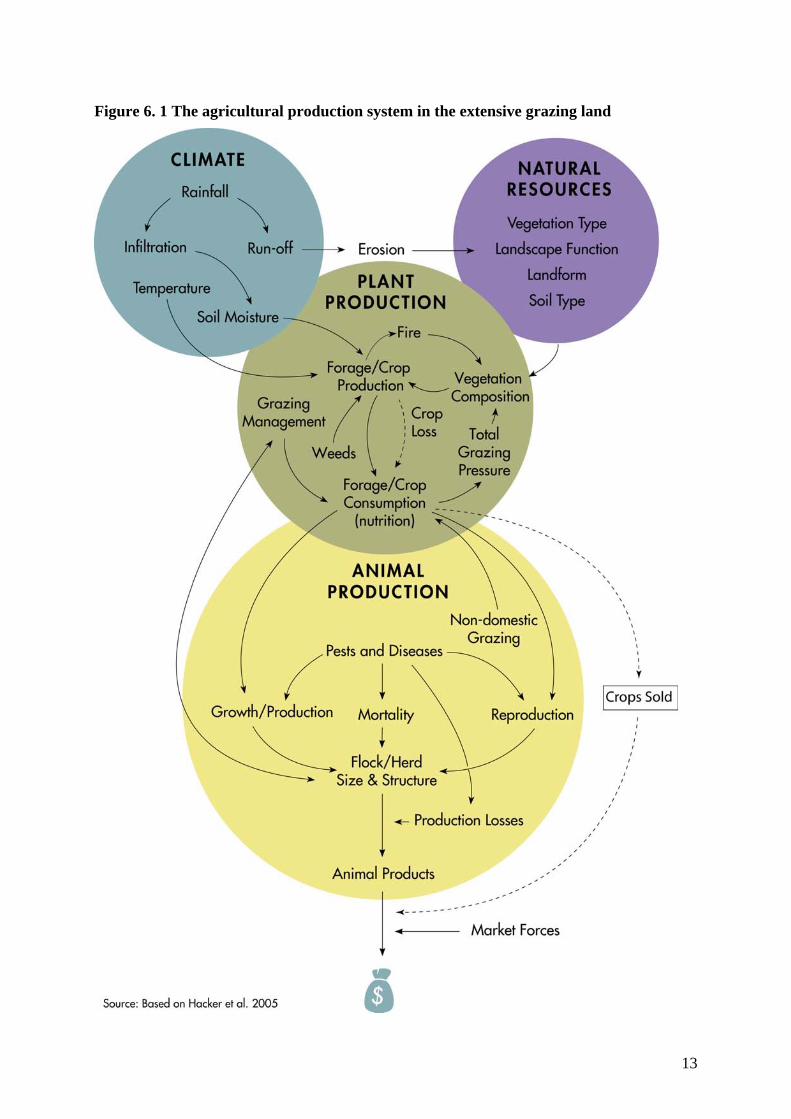
Figure 6. 1 The agricultural production system in the extensive grazing land
13
The important crop rotations are either three year rotations of wheat, volunteer pasture and fallow or intensive rotations such as wheat/fallow/wheat (WFW); or wheat, barley triticale, fallow (WBTF) (McIntosh, 2004a). The main outputs of this system include wool, sheep, cattle, wheat, and sometimes small amounts of barley, sunflower, and sorghum. In average seasons the yield of wheat ranges from 1.3 t/ha to 1.8 t/ha. In drier than average seasons, the yield of wheat falls to 1 t/ha but in wet seasons it can be as high as 2.4 t/ha..
6.3. The Far West region farming system The Far West region farming system is dominated by specialist sheep breeding enterprises for wool and meat. This farming system is predominately found in the shires of Broken Hill, and Central Darling and in the Unincorporated area of the Western Division. Rainfall is low and highly variable averaging 175mm per annum. Cropping occurs on a few properties with fertile soil and where run off from surface water accumulates (Wilcannia BG, 2000/1). According to ABARE (2003), wool and sheep revenue account for more than 90 per cent of the total farm income. There are a few producers who harvest feral goats but the extent of its economic contribution to individual farm income varies depending on location (NIEIR, 2000a). 7. Statistical Information The Australian Bureau of Agricultural and Resource Economics (ABARE) collects information on the physical and financial characteristics of agricultural production activities in the pastoral zone of NSW. Each year ABARE surveys a large number of individual producers to obtain both physical and financial information on individual farm businesses which it uses to estimate and report on average financial performance indicators such as the capital value of the average farm, farm cash income, farm business profit and rates of return at a particular point in time. The summaries of the average physical and financial characteristics of producers in the pastoral zone of NSW between 1996 and 2006 are presented in Table 7.1 and Table 7.2. The average size of pastoral properties in the region is 27,000 hectares with approximately 4,450 sheep and 190 cattle with minor crop production. The total value of assets of an average property was estimated at $1.9 million with an equity ratio of 87%. Farm revenues obtained from the sale of sheep and wool contribute about 60% to the total farm receipts whereas cattle and cropping enterprise contribute about 17 and 22%, respectively. It is estimated that the average farm earned about 2.9 per cent business return on equity (see Table 7.3).
14
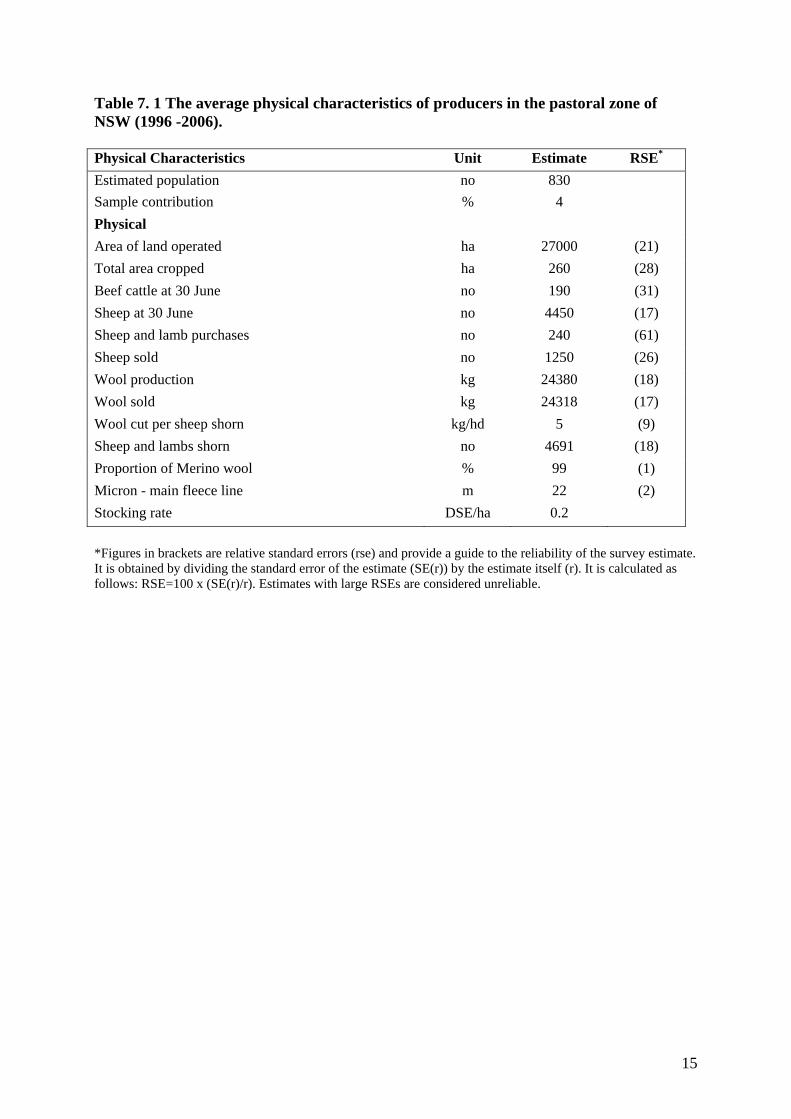
Table 7. 1 The average physical characteristics of producers in the pastoral zone of NSW (1996 -2006). Physical Characteristics Unit Estimate RSE*
Estimated population no 830 Sample contribution % 4 Physical Area of land operated ha 27000 (21) Total area cropped ha 260 (28) Beef cattle at 30 June no 190 (31) Sheep at 30 June no 4450 (17) Sheep and lamb purchases no 240 (61) Sheep sold no 1250 (26) Wool production kg 24380 (18) Wool sold kg 24318 (17) Wool cut per sheep shorn kg/hd 5 (9) Sheep and lambs shorn no 4691 (18) Proportion of Merino wool % 99 (1) Micron - main fleece line m 22 (2) Stocking rate DSE/ha 0.2
*Figures in brackets are relative standard errors (rse) and provide a guide to the reliability of the survey estimate. It is obtained by dividing the standard error of the estimate (SE(r)) by the estimate itself (r). It is calculated as follows: RSE=100 x (SE(r)/r). Estimates with large RSEs are considered unreliable.
15
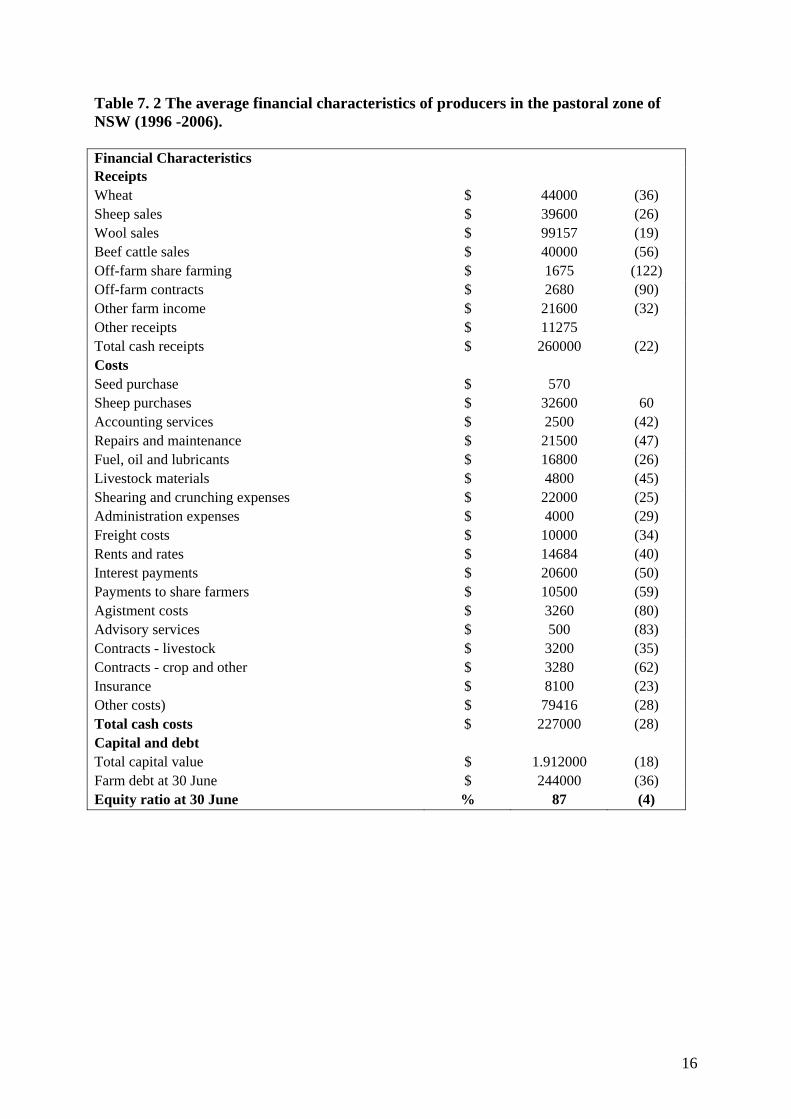
Table 7. 2 The average financial characteristics of producers in the pastoral zone of NSW (1996 -2006). Financial Characteristics Receipts Wheat $ 44000 (36) Sheep sales $ 39600 (26) Wool sales $ 99157 (19) Beef cattle sales $ 40000 (56) Off-farm share farming $ 1675 (122) Off-farm contracts $ 2680 (90) Other farm income $ 21600 (32) Other receipts $ 11275 Total cash receipts $ 260000 (22) Costs Seed purchase $ 570 Sheep purchases $ 32600 60 Accounting services $ 2500 (42) Repairs and maintenance $ 21500 (47) Fuel, oil and lubricants $ 16800 (26) Livestock materials $ 4800 (45) Shearing and crunching expenses $ 22000 (25) Administration expenses $ 4000 (29) Freight costs $ 10000 (34) Rents and rates $ 14684 (40) Interest payments $ 20600 (50) Payments to share farmers $ 10500 (59) Agistment costs $ 3260 (80) Advisory services $ 500 (83) Contracts - livestock $ 3200 (35) Contracts - crop and other $ 3280 (62) Insurance $ 8100 (23) Other costs) $ 79416 (28) Total cash costs $ 227000 (28) Capital and debt Total capital value $ 1.912000 (18) Farm debt at 30 June $ 244000 (36) Equity ratio at 30 June % 87 (4)
16
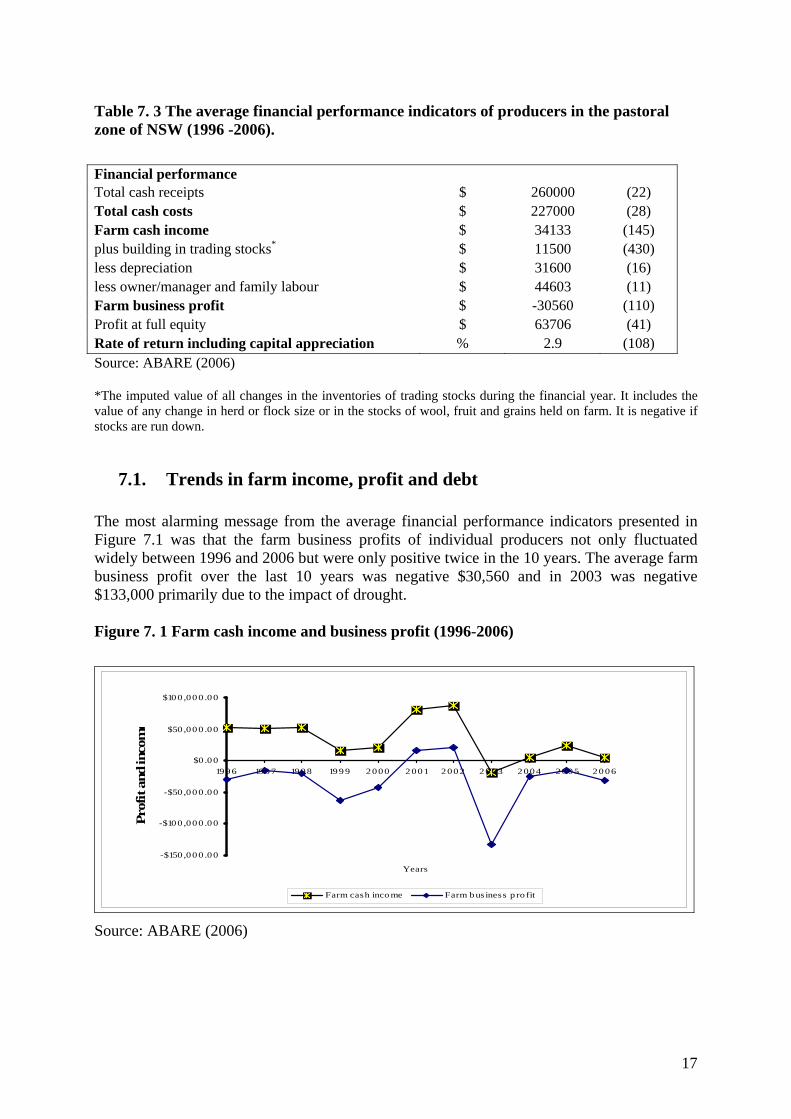
Table 7. 3 The average financial performance indicators of producers in the pastoral zone of NSW (1996 -2006). Financial performance Total cash receipts $ 260000 (22) Total cash costs $ 227000 (28) Farm cash income $ 34133 (145) plus building in trading stocks* $ 11500 (430) less depreciation $ 31600 (16) less owner/manager and family labour $ 44603 (11) Farm business profit $ -30560 (110) Profit at full equity $ 63706 (41) Rate of return including capital appreciation % 2.9 (108) Source: ABARE (2006) *The imputed value of all changes in the inventories of trading stocks during the financial year. It includes the value of any change in herd or flock size or in the stocks of wool, fruit and grains held on farm. It is negative if stocks are run down.
7.1. Trends in farm income, profit and debt The most alarming message from the average financial performance indicators presented in Figure 7.1 was that the farm business profits of individual producers not only fluctuated widely between 1996 and 2006 but were only positive twice in the 10 years. The average farm business profit over the last 10 years was negative $30,560 and in 2003 was negative $133,000 primarily due to the impact of drought. Figure 7. 1 Farm cash income and business profit (1996-2006)
-$150 ,00 0 .00
-$100 ,00 0 .00
-$50 ,00 0 .00
$0 .00
$50 ,00 0 .00
$100 ,00 0 .00
1996 1997 1998 199 9 2000 2001 2002 200 3 2004 200 5 20 06
Years
Prof
it an
d in
com
e
Farm cash inco me Farm bus iness p ro fit
Source: ABARE (2006)
17
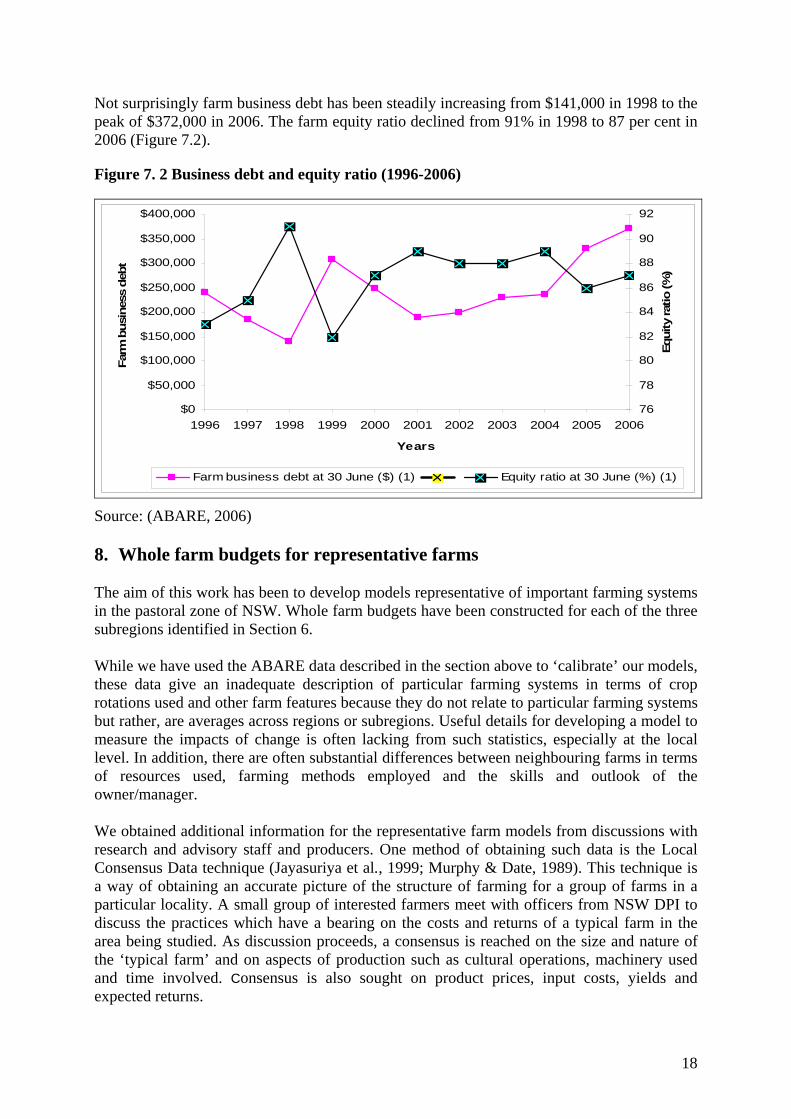
Not surprisingly farm business debt has been steadily increasing from $141,000 in 1998 to the peak of $372,000 in 2006. The farm equity ratio declined from 91% in 1998 to 87 per cent in 2006 (Figure 7.2).
Figure 7. 2 Business debt and equity ratio (1996-2006)
$0
$50,000
$100,000
$150,000
$200,000
$250,000
$300,000
$350,000
$400,000
1996 1997 1998 1999 2000 2001 2002 2003 2004 2005 2006
Years
Farm
bus
ines
s de
bt
76
78
80
82
84
86
88
90
92
Equi
ty ra
tio (%
)
Farm business debt at 30 June ($) (1) Equity ratio at 30 June (%) (1)
Source: (ABARE, 2006) 8. Whole farm budgets for representative farms The aim of this work has been to develop models representative of important farming systems in the pastoral zone of NSW. Whole farm budgets have been constructed for each of the three subregions identified in Section 6. While we have used the ABARE data described in the section above to ‘calibrate’ our models, these data give an inadequate description of particular farming systems in terms of crop rotations used and other farm features because they do not relate to particular farming systems but rather, are averages across regions or subregions. Useful details for developing a model to measure the impacts of change is often lacking from such statistics, especially at the local level. In addition, there are often substantial differences between neighbouring farms in terms of resources used, farming methods employed and the skills and outlook of the owner/manager. We obtained additional information for the representative farm models from discussions with research and advisory staff and producers. One method of obtaining such data is the Local Consensus Data technique (Jayasuriya et al., 1999; Murphy & Date, 1989). This technique is a way of obtaining an accurate picture of the structure of farming for a group of farms in a particular locality. A small group of interested farmers meet with officers from NSW DPI to discuss the practices which have a bearing on the costs and returns of a typical farm in the area being studied. As discussion proceeds, a consensus is reached on the size and nature of the ‘typical farm’ and on aspects of production such as cultural operations, machinery used and time involved. Consensus is also sought on product prices, input costs, yields and expected returns.
18
The aim is to develop comprehensive sets of data to adequately define the ‘model’ farms in the Upper Darling, the Murray-Darling and Far West regions to ensure that farm management analyses are relevant to existing conditions, and to provide suitable examples for extension advice. For each region, a representative farm is described in terms of typical size, and enterprise combinations and in terms of key financial parameters. In each case there are two tables presented – an assets and liabilities statement and an annual operating budget statement. The assets and liabilities statement shows land, livestock, plant and equipment and liabilities. The annual budget statement shows enterprise and total farm GM, overhead costs, farm cash income, operating costs and farm business profit and farm business return on owner’s equity. The commodity price assumptions used in preparing the whole farm budgets are given in Appendix 1. Overhead costs were estimated after some discussions with producers, rural financial counsellors and NSW DPI staff in the respective regions. Land values were estimated from published Valuer General Information for the relevant regions. It is expected that costs will vary considerably between farms since labour requirements, insurance, repairs and maintenance, fuel, and administration costs vary with family requirements, business structure and extra machinery and assets on hand. Similarly, income tax varies considerably with business structure and off-farm investments, so income tax estimates have not been included. The whole farm budget can be used to examine changes in enterprise combinations and changes in technology, that are likely to be of interest to farmers with similar farming systems in financial terms. The budgets show financial measures such as farm cash income and rate of return on equity and operator labour for a defined enterprise mix; but are not optimising models in that they do not choose the most profitable enterprise mix rather they are simulation models which can be used for evaluating ‘what-if’ questions. One of the drawbacks of this type of model is that it does not account for cash flows in the transition period from one rotation system to another. The estimates of financial performance below are substantially different from the financial estimates based on ABARE farm survey data presented above. There are several reasons for this. The financial estimates for the representative whole farm models do not include the imputed cost of family labour which would significantly reduce farm business profit and the return to equity. Moreover, they were estimated on the assumption that normal climatic and marketing conditions prevail rather than current drought conditions. The models are not based on statistical averages for broadacre agriculture in the region but more on the judgements of those who assisted in assembling the models.
8.1. The Upper Darling region representative farm model The statement of assets and liabilities and the whole farm budget for the Upper Darling region representative farm are presented in Table 8.1 and Table 8.2. The total land area of the representative farm is 24,000 hectares. The total carrying capacity of the land is about 9000 DSE at about 0.4 DSE per ha., of which about 75% is sheep (4030 sheep) and the remaining 25 per cent is cattle (144 head).
19
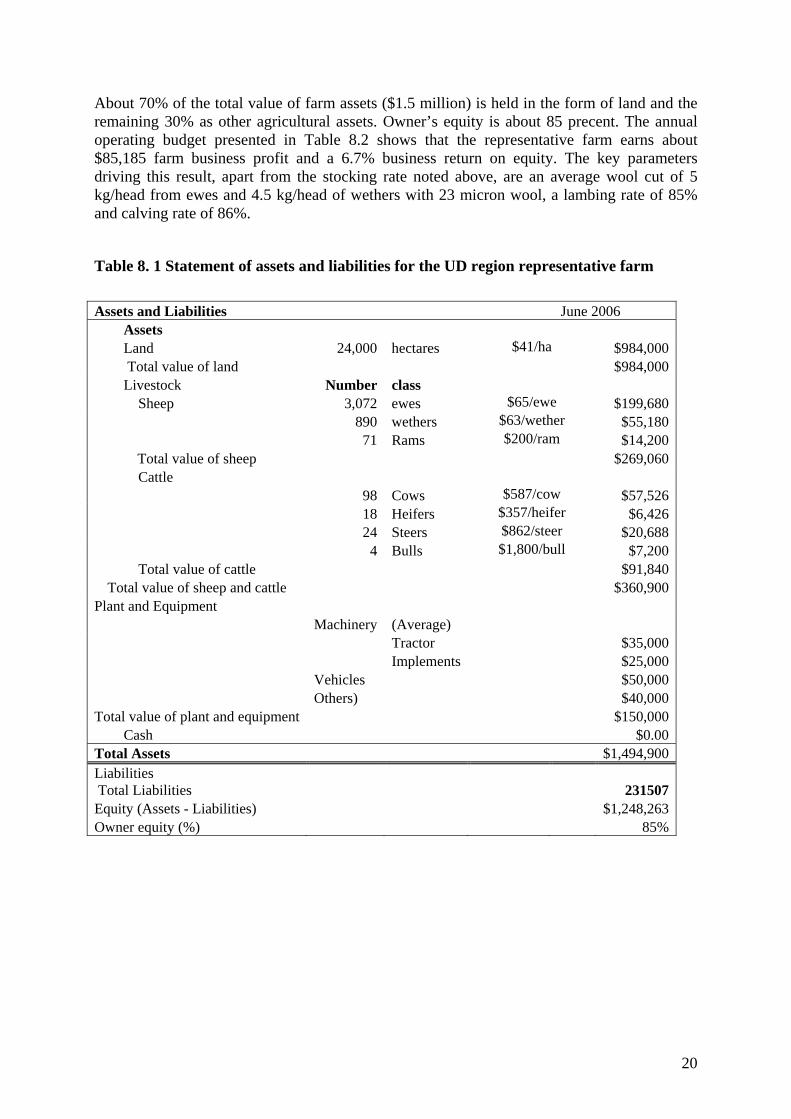
About 70% of the total value of farm assets ($1.5 million) is held in the form of land and the remaining 30% as other agricultural assets. Owner’s equity is about 85 precent. The annual operating budget presented in Table 8.2 shows that the representative farm earns about $85,185 farm business profit and a 6.7% business return on equity. The key parameters driving this result, apart from the stocking rate noted above, are an average wool cut of 5 kg/head from ewes and 4.5 kg/head of wethers with 23 micron wool, a lambing rate of 85% and calving rate of 86%.
Table 8. 1 Statement of assets and liabilities for the UD region representative farm Assets and Liabilities June 2006
Assets Land 24,000 hectares $41/ha $984,000 Total value of land $984,000Livestock Number class
Sheep 3,072 ewes $65/ewe $199,680 890 wethers $63/wether $55,180 71 Rams $200/ram $14,200
Total value of sheep $269,060Cattle
98 Cows $587/cow $57,526 18 Heifers $357/heifer $6,426 24 Steers $862/steer $20,688 4 Bulls $1,800/bull $7,200
Total value of cattle $91,840Total value of sheep and cattle $360,900
Plant and Equipment Machinery (Average) Tractor $35,000 Implements $25,000 Vehicles $50,000 Others) $40,000Total value of plant and equipment $150,000
Cash $0.00Total Assets $1,494,900Liabilities Total Liabilities 231507Equity (Assets - Liabilities) $1,248,263Owner equity (%) 85%
20
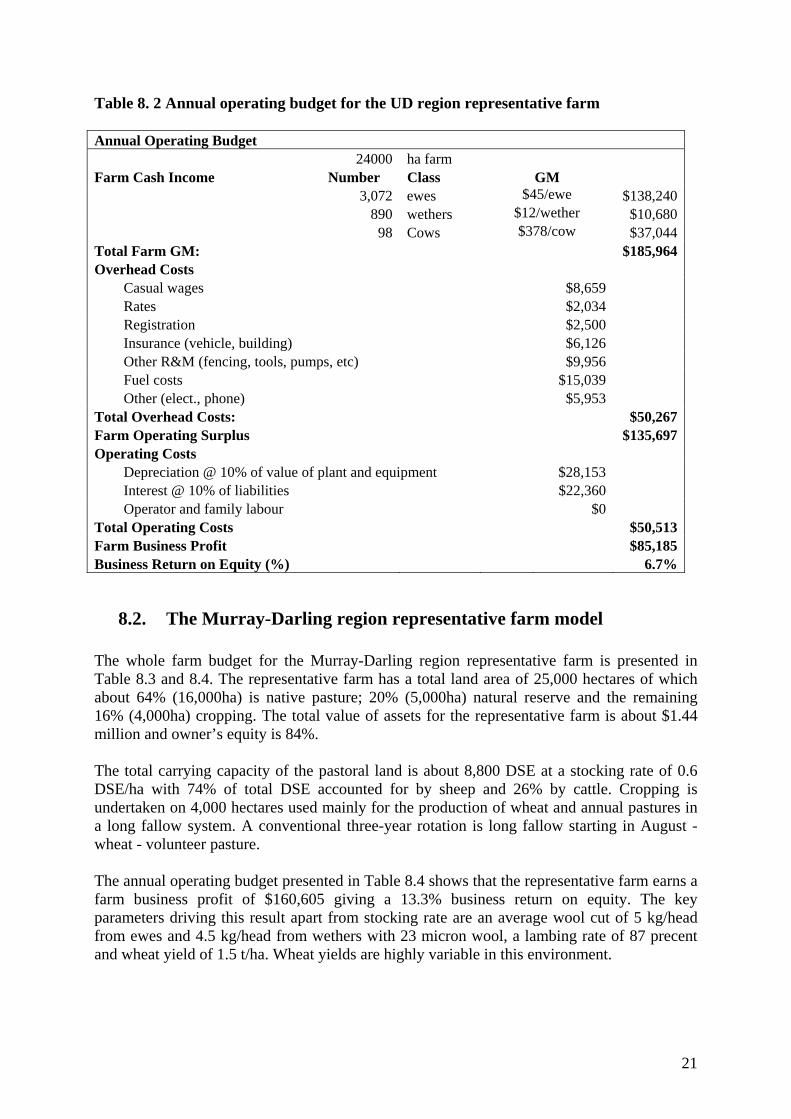
Table 8. 2 Annual operating budget for the UD region representative farm Annual Operating Budget
24000 ha farm Farm Cash Income Number Class GM
3,072 ewes $45/ewe $138,240890 wethers $12/wether $10,680
98 Cows $378/cow $37,044Total Farm GM: $185,964Overhead Costs
Casual wages $8,659 Rates $2,034 Registration $2,500 Insurance (vehicle, building) $6,126 Other R&M (fencing, tools, pumps, etc) $9,956 Fuel costs $15,039 Other (elect., phone) $5,953
Total Overhead Costs: $50,267Farm Operating Surplus $135,697Operating Costs
Depreciation @ 10% of value of plant and equipment $28,153 Interest @ 10% of liabilities $22,360 Operator and family labour $0
Total Operating Costs $50,513Farm Business Profit $85,185Business Return on Equity (%) 6.7%
8.2. The Murray-Darling region representative farm model The whole farm budget for the Murray-Darling region representative farm is presented in Table 8.3 and 8.4. The representative farm has a total land area of 25,000 hectares of which about 64% (16,000ha) is native pasture; 20% (5,000ha) natural reserve and the remaining 16% (4,000ha) cropping. The total value of assets for the representative farm is about $1.44 million and owner’s equity is 84%. The total carrying capacity of the pastoral land is about 8,800 DSE at a stocking rate of 0.6 DSE/ha with 74% of total DSE accounted for by sheep and 26% by cattle. Cropping is undertaken on 4,000 hectares used mainly for the production of wheat and annual pastures in a long fallow system. A conventional three-year rotation is long fallow starting in August - wheat - volunteer pasture. The annual operating budget presented in Table 8.4 shows that the representative farm earns a farm business profit of $160,605 giving a 13.3% business return on equity. The key parameters driving this result apart from stocking rate are an average wool cut of 5 kg/head from ewes and 4.5 kg/head from wethers with 23 micron wool, a lambing rate of 87 precent and wheat yield of 1.5 t/ha. Wheat yields are highly variable in this environment.
21
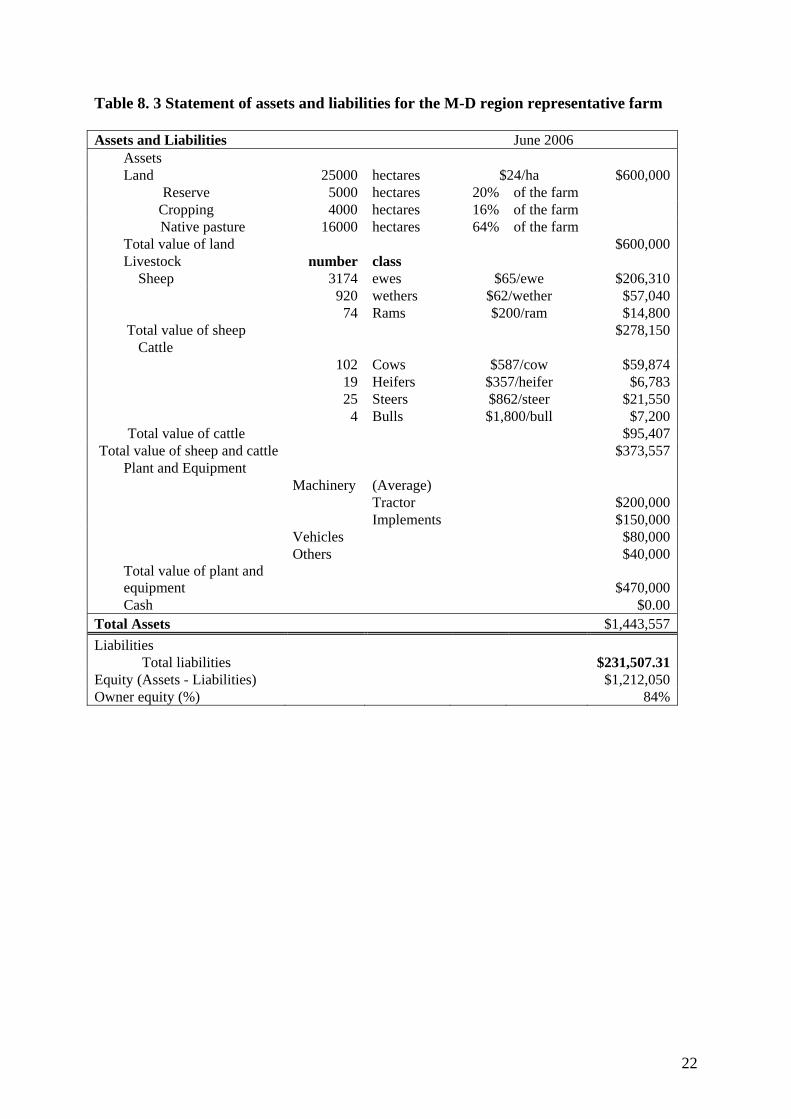
Table 8. 3 Statement of assets and liabilities for the M-D region representative farm Assets and Liabilities June 2006
Assets Land 25000 hectares $24/ha $600,000
Reserve 5000 hectares 20% of the farm Cropping 4000 hectares 16% of the farm
Native pasture 16000 hectares 64% of the farm Total value of land $600,000Livestock number class
Sheep 3174 ewes $65/ewe $206,310 920 wethers $62/wether $57,040 74 Rams $200/ram $14,800Total value of sheep $278,150
Cattle 102 Cows $587/cow $59,874 19 Heifers $357/heifer $6,783 25 Steers $862/steer $21,550 4 Bulls $1,800/bull $7,200
Total value of cattle $95,407Total value of sheep and cattle $373,557
Plant and Equipment Machinery (Average) Tractor $200,000 Implements $150,000 Vehicles $80,000 Others $40,000
Total value of plant and equipment $470,000Cash $0.00
Total Assets $1,443,557Liabilities Total liabilities $231,507.31Equity (Assets - Liabilities) $1,212,050Owner equity (%) 84%
22
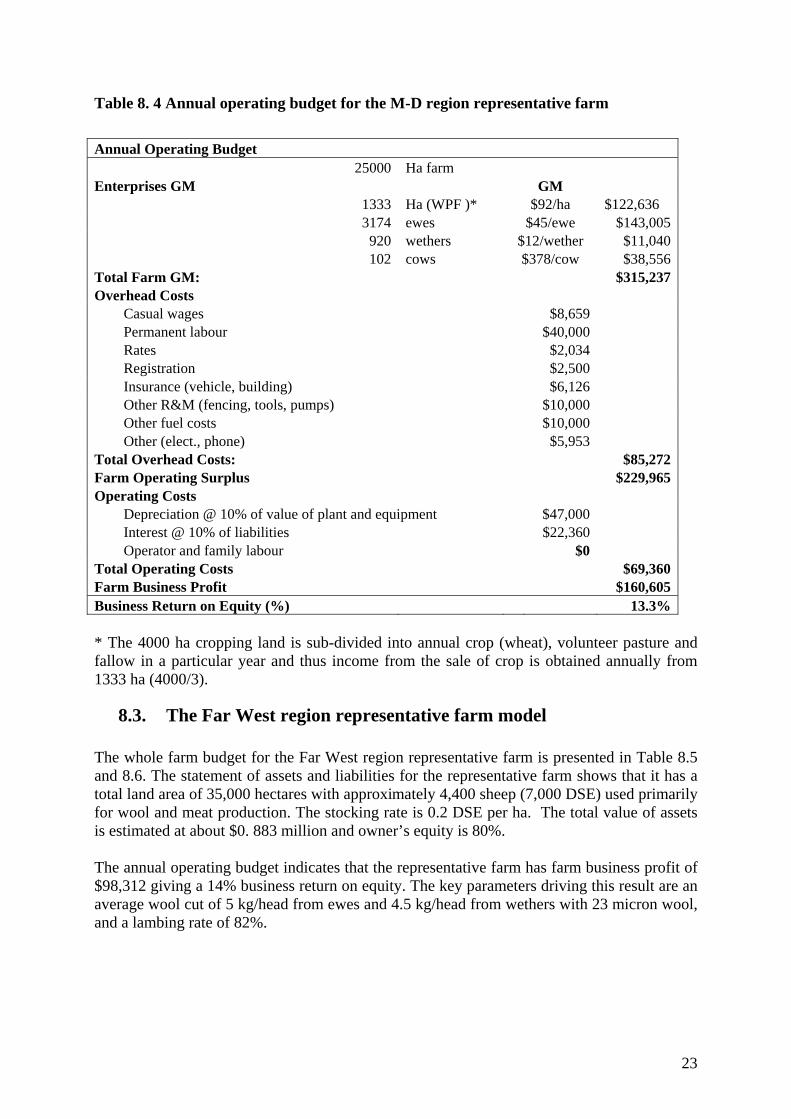
Table 8. 4 Annual operating budget for the M-D region representative farm Annual Operating Budget
25000 Ha farm Enterprises GM GM
1333 Ha (WPF )* $92/ha $122,636 3174 ewes $45/ewe $143,005
920 wethers $12/wether $11,040102 cows $378/cow $38,556
Total Farm GM: $315,237Overhead Costs
Casual wages $8,659 Permanent labour $40,000 Rates $2,034 Registration $2,500 Insurance (vehicle, building) $6,126 Other R&M (fencing, tools, pumps) $10,000 Other fuel costs $10,000 Other (elect., phone) $5,953
Total Overhead Costs: $85,272Farm Operating Surplus $229,965Operating Costs
Depreciation @ 10% of value of plant and equipment $47,000 Interest @ 10% of liabilities $22,360 Operator and family labour $0
Total Operating Costs $69,360Farm Business Profit $160,605Business Return on Equity (%) 13.3% * The 4000 ha cropping land is sub-divided into annual crop (wheat), volunteer pasture and fallow in a particular year and thus income from the sale of crop is obtained annually from 1333 ha (4000/3).
8.3. The Far West region representative farm model The whole farm budget for the Far West region representative farm is presented in Table 8.5 and 8.6. The statement of assets and liabilities for the representative farm shows that it has a total land area of 35,000 hectares with approximately 4,400 sheep (7,000 DSE) used primarily for wool and meat production. The stocking rate is 0.2 DSE per ha. The total value of assets is estimated at about $0. 883 million and owner’s equity is 80%. The annual operating budget indicates that the representative farm has farm business profit of $98,312 giving a 14% business return on equity. The key parameters driving this result are an average wool cut of 5 kg/head from ewes and 4.5 kg/head from wethers with 23 micron wool, and a lambing rate of 82%.
23
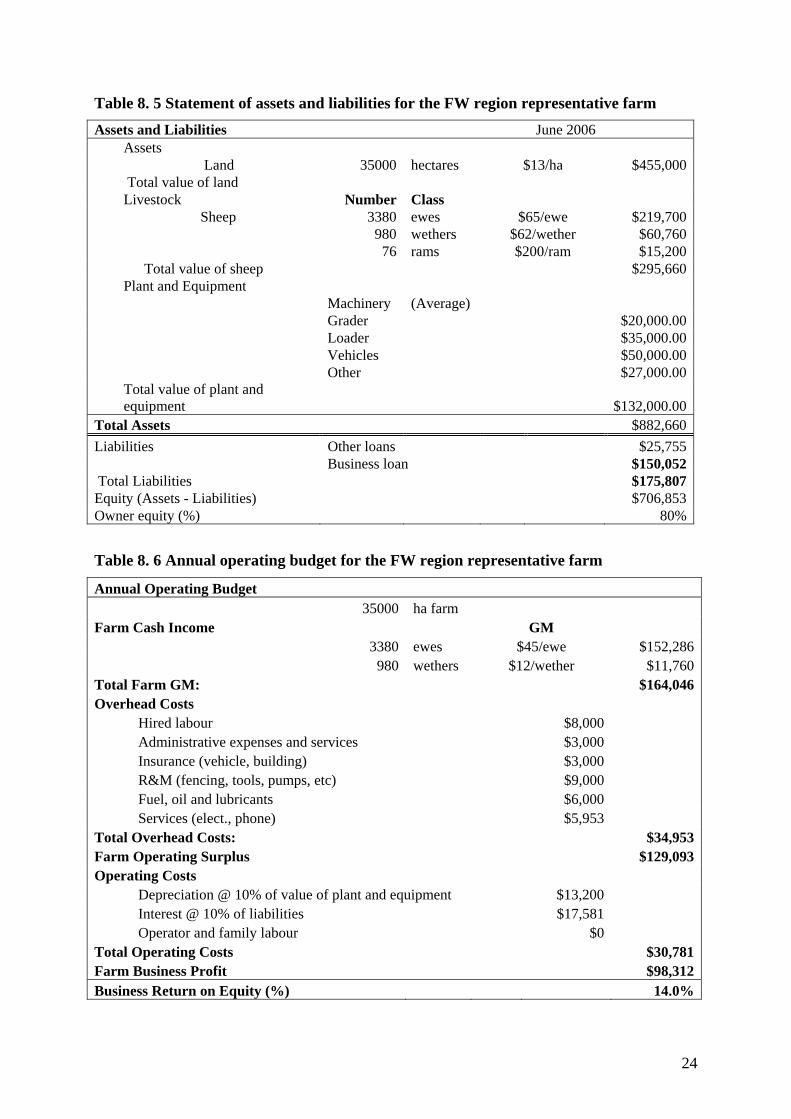
Table 8. 5 Statement of assets and liabilities for the FW region representative farm Assets and Liabilities June 2006
Assets Land 35000 hectares $13/ha $455,000 Total value of land Livestock Number Class
Sheep 3380 ewes $65/ewe $219,700 980 wethers $62/wether $60,760 76 rams $200/ram $15,200
Total value of sheep $295,660Plant and Equipment
Machinery (Average) Grader $20,000.00 Loader $35,000.00 Vehicles $50,000.00 Other $27,000.00
Total value of plant and equipment $132,000.00
Total Assets $882,660Liabilities Other loans $25,755 Business loan $150,052 Total Liabilities $175,807Equity (Assets - Liabilities) $706,853Owner equity (%) 80%
Table 8. 6 Annual operating budget for the FW region representative farm
Annual Operating Budget 35000 ha farm
Farm Cash Income GM 3380 ewes $45/ewe $152,286
980 wethers $12/wether $11,760Total Farm GM: $164,046Overhead Costs
Hired labour $8,000 Administrative expenses and services $3,000 Insurance (vehicle, building) $3,000 R&M (fencing, tools, pumps, etc) $9,000 Fuel, oil and lubricants $6,000 Services (elect., phone) $5,953
Total Overhead Costs: $34,953Farm Operating Surplus $129,093Operating Costs
Depreciation @ 10% of value of plant and equipment $13,200 Interest @ 10% of liabilities $17,581 Operator and family labour $0
Total Operating Costs $30,781Farm Business Profit $98,312Business Return on Equity (%) 14.0%
24
9. The profitability of alternative sheep enterprises
9.1. The SR Dorper and Damara
As noted in section 4, the primary focus of the livestock enterprises in the pastoral zone of NSW is the production of medium to broad micron Merino wool and sale of surplus sheep. Other agricultural crops are an additional source of farm cash income. As a result the production of prime lambs has not been important in the region until recently. Following depressed wool prices, particularly in the 1970s and 1990s, a prolonged drought, increasing demand for lamb and sheep meat and significant labour constraints, producers have been considering meat producing sheep as an important part of their enterprise mix. The main sheep breeds that have attracted attention have been Dorpers and Damaras. Initially, Dorper or Damara sires are joined to the existing Merino ewes and the progeny backcrossed for a minimum of 4 generations to achieve a pure meat breed flock. This is the most typical approach as there are insufficient numbers of purebred flocks available for purchase. Producers in the pastoral zone view the Dorper and Damara as an opportunity because they can easily adapt to the rangeland environment and require relatively low maintenance. It is reported that purebred Dorpers and Damaras do not require mulesing, crutching or shearing, are not susceptible to flystrike and in the case of Damaras, do not require the tail to be removed. All these characteristics reduce production costs (Young and Kilminster, 2004) and make these breeds more suited to the pastoral zone than other meat breeds, such as the Poll Dorset and the Suffolk, that have historically been used in Australia. It has been suggested that Dorpers and Damaras achieve lamb marking rates of up to 130% regularly in the pastoral zone because ewes produce three lambs in two years. In addition, because of their ability to browse during conditions that might cause lambing percentages in Merinos to drop, the lambing percentages of Dorpers and Damaras are expected to be more stable in the face of climatic variations. There is also the view that the lambing percentages of Merino ewes joined to either Dorper or Damara rams in a terminal sire enterprise could reach up to 138 and 131% respectively (Young and Kilminster, 2004). In addition to the superior production performance and suitability of Dorpers and Damaras in the rangeland environment, producers have also been attracted to them because the relative price of lamb and wool has been increasing as shown in Figure 9.1.
25
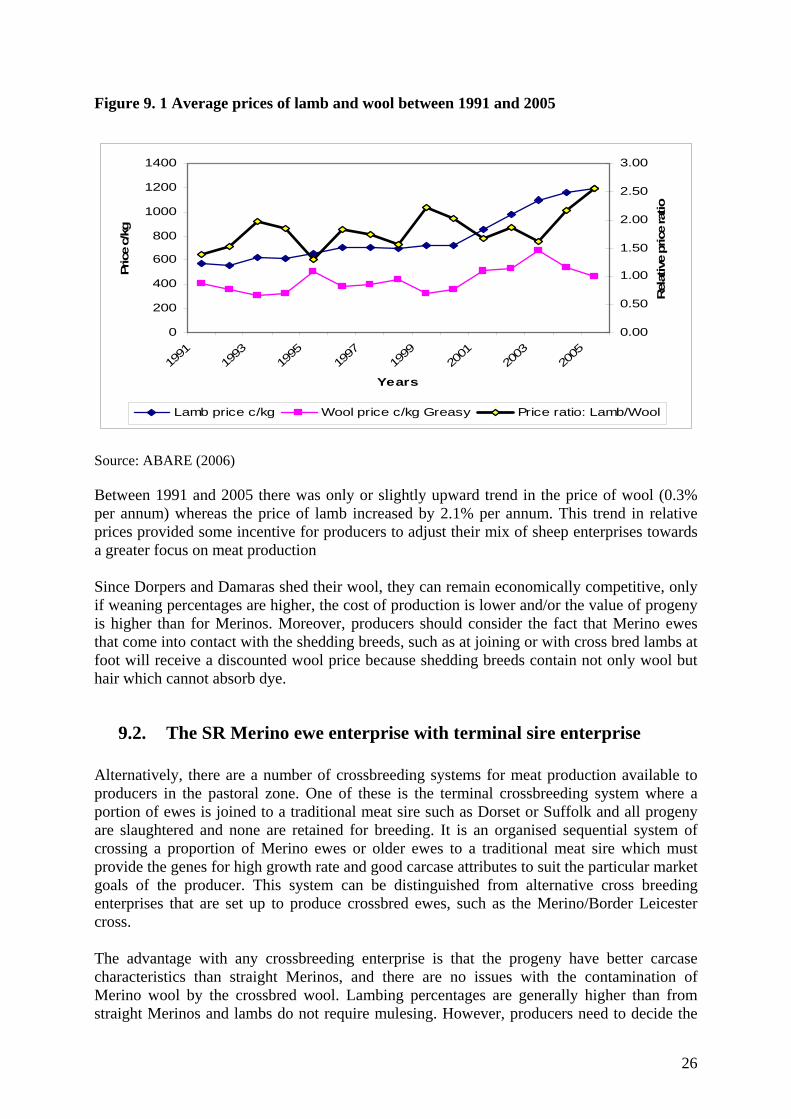
Figure 9. 1 Average prices of lamb and wool between 1991 and 2005
0
200
400
600
800
1000
1200
1400
1991
1993
1995
1997
1999
2001
2003
2005
Years
Pric
e c/
kg
0.00
0.50
1.00
1.50
2.00
2.50
3.00
Rel
ativ
e pr
ice
ratio
Lamb price c/kg Wool price c/kg Greasy Price ratio: Lamb/Wool
Source: ABARE (2006) Between 1991 and 2005 there was only or slightly upward trend in the price of wool (0.3% per annum) whereas the price of lamb increased by 2.1% per annum. This trend in relative prices provided some incentive for producers to adjust their mix of sheep enterprises towards a greater focus on meat production Since Dorpers and Damaras shed their wool, they can remain economically competitive, only if weaning percentages are higher, the cost of production is lower and/or the value of progeny is higher than for Merinos. Moreover, producers should consider the fact that Merino ewes that come into contact with the shedding breeds, such as at joining or with cross bred lambs at foot will receive a discounted wool price because shedding breeds contain not only wool but hair which cannot absorb dye.
9.2. The SR Merino ewe enterprise with terminal sire enterprise Alternatively, there are a number of crossbreeding systems for meat production available to producers in the pastoral zone. One of these is the terminal crossbreeding system where a portion of ewes is joined to a traditional meat sire such as Dorset or Suffolk and all progeny are slaughtered and none are retained for breeding. It is an organised sequential system of crossing a proportion of Merino ewes or older ewes to a traditional meat sire which must provide the genes for high growth rate and good carcase attributes to suit the particular market goals of the producer. This system can be distinguished from alternative cross breeding enterprises that are set up to produce crossbred ewes, such as the Merino/Border Leicester cross. The advantage with any crossbreeding enterprise is that the progeny have better carcase characteristics than straight Merinos, and there are no issues with the contamination of Merino wool by the crossbred wool. Lambing percentages are generally higher than from straight Merinos and lambs do not require mulesing. However, producers need to decide the
26
appropriate numbers of ewes to allocate to a self-replacing Merino enterprise if the aim is to maintain a sustainable SR Merino flock.
In our analysis the proportions of Merino ewes that should be joined to the Terminal Sire were obtained using the Merino versus Terminal Sire Flock Model (CSIRO Livestock Industries and Australian Sheep Industry CRC, 2004). The Terminal Sire Flock Model is a spread sheet model that estimates the proportion of Merino ewes that should be joined to terminal sires with the objective of maintaining the SR Merino enterprise provided that some of the key parameters such as the number of Merino sheep, stocking rate, lambing percentages, mortality rate, age at first joining and lambing percentage are given.
This model assumes that the percentage of the flock joined to a terminal sire is allocated equally across age groups rather than mating cast for age ewes or scanned dry ewes to a terminal sire, although this is a common practice. Ewes joined to the terminal sire are highly saleable either as breeding ewes with lambs at foot or lambs sold as suckers for later breeding. We assumed that about 47% of the Merino ewes were joined to terminal sires in the three representative farms. Details of other assumptions used are given in Appendix 3, 4 and 5.
9.3. Comparing the various enterprises
One of the key management issues for pastoralists in the region has been to asses the financial merit of each alternative breed relative to traditional system from the whole farm perspective. Here we estimate the economic impact on the representative farm in each sub-region of introducing one of five alternative enterprises:
1. Mating a proportion of Merino ewes to terminal sires and maintaining a SR Merino flock and a wether flock;
2. A wether flock only 3. A SR Merino flock only 4. Replacing the Merino SR flock with SR Dorpers 5. Replacing the Merino SR flock with SR Damaras
The potential economic benefits from these enterprises have been compared by adjusting the sheep enterprise mix in the representative farm models. Neither the area cropped nor the numbers of cattle have been changed. Nor have overhead costs been altered. Of course, an important qualification to this partial analysis is that the costs of the transition to the new mix of sheep enterprises have not been assessed. What is presented is simply a ‘snapshot’ of farm income after the change in sheep enterprises. More over, it should be noted that both the Dorper and the Damara have a higher DSE rating than Merinos. Hence, the number of these breeds that can be run is proportionately lower than the number of Merino sheep and so these variations have been accounted for in the analysis. The results of these analyses for the three regions are presented in Table 9.1 to Table 9.3.
The annual operating budgets for the alternative enterprises in the UD region farming system are presented in Table 9.1. The business return on equity was highest (7.2%) for SR Merino (3) while that of the terminal sire enterprise (1) was 6 percent. The business returns on equity for the Dorper (4) and Damara (5) enterprises were 6.3 and 3%, respectively. The key parameter driving the financial performance of the SR Merino enterprise (3) was the extra income obtained from the sale of additional wool, weaners and hoggets and the lower prices associated with CFA for other breeds relative to the price of Merino CFA.
27
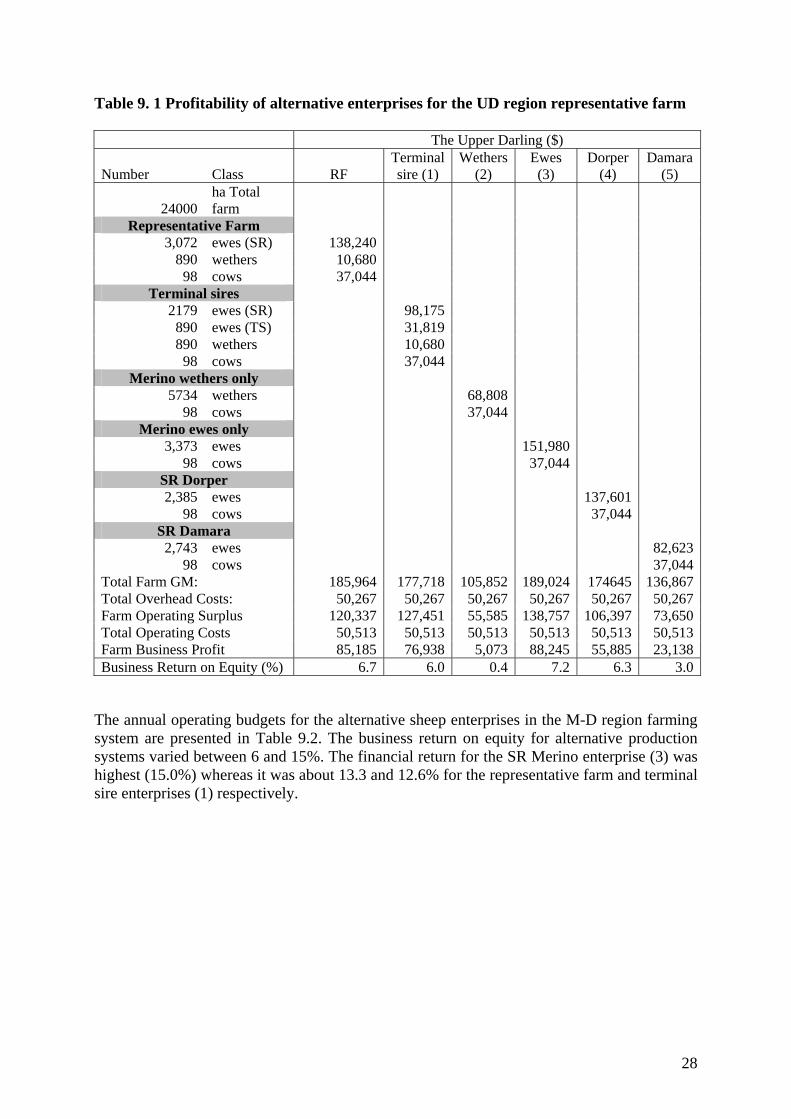
Table 9. 1 Profitability of alternative enterprises for the UD region representative farm
The Upper Darling ($)
Number Class RF Terminal sire (1)
Wethers (2)
Ewes (3)
Dorper (4)
Damara (5)
24000 ha Total farm
Representative Farm 3,072 ewes (SR) 138,240
890 wethers 10,680 98 cows 37,044
Terminal sires 2179 ewes (SR) 98,175
890 ewes (TS) 31,819 890 wethers 10,680
98 cows 37,044 Merino wethers only
5734 wethers 68,808 98 cows 37,044
Merino ewes only 3,373 ewes 151,980
98 cows 37,044 SR Dorper 2,385 ewes 137,601
98 cows 37,044 SR Damara
2,743 ewes 82,62398 cows 37,044
Total Farm GM: 185,964 177,718 105,852 189,024 174645 136,867Total Overhead Costs: 50,267 50,267 50,267 50,267 50,267 50,267Farm Operating Surplus 120,337 127,451 55,585 138,757 106,397 73,650Total Operating Costs 50,513 50,513 50,513 50,513 50,513 50,513Farm Business Profit 85,185 76,938 5,073 88,245 55,885 23,138Business Return on Equity (%) 6.7 6.0 0.4 7.2 6.3 3.0
The annual operating budgets for the alternative sheep enterprises in the M-D region farming system are presented in Table 9.2. The business return on equity for alternative production systems varied between 6 and 15%. The financial return for the SR Merino enterprise (3) was highest (15.0%) whereas it was about 13.3 and 12.6% for the representative farm and terminal sire enterprises (1) respectively.
28
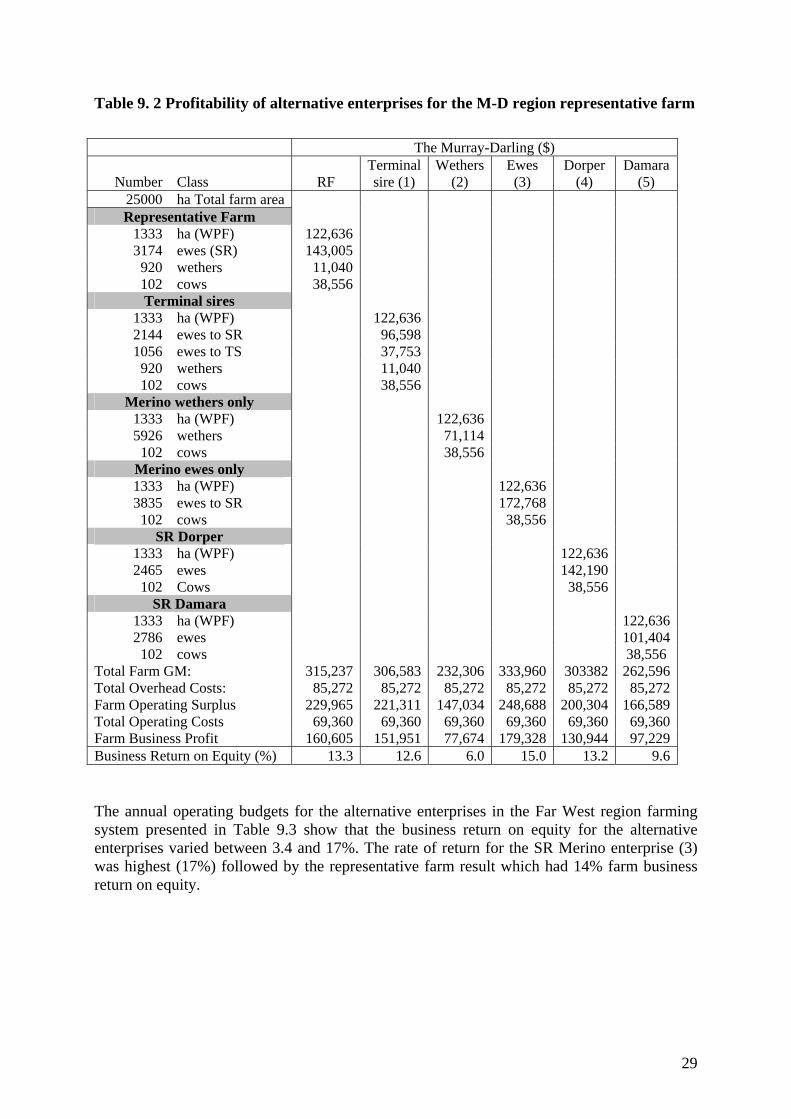
Table 9. 2 Profitability of alternative enterprises for the M-D region representative farm
The Murray-Darling ($)
Number Class RF Terminal sire (1)
Wethers (2)
Ewes (3)
Dorper (4)
Damara (5)
25000 ha Total farm area Representative Farm
1333 ha (WPF) 122,636 3174 ewes (SR) 143,005
920 wethers 11,040 102 cows 38,556 Terminal sires
1333 ha (WPF) 122,636 2144 ewes to SR 96,598 1056 ewes to TS 37,753
920 wethers 11,040 102 cows 38,556
Merino wethers only 1333 ha (WPF) 122,636 5926 wethers 71,114
102 cows 38,556 Merino ewes only 1333 ha (WPF) 122,636 3835 ewes to SR 172,768
102 cows 38,556 SR Dorper
1333 ha (WPF) 122,636 2465 ewes 142,190
102 Cows 38,556 SR Damara
1333 ha (WPF) 122,6362786 ewes 101,404
102 cows 38,556 Total Farm GM: 315,237 306,583 232,306 333,960 303382 262,596Total Overhead Costs: 85,272 85,272 85,272 85,272 85,272 85,272Farm Operating Surplus 229,965 221,311 147,034 248,688 200,304 166,589Total Operating Costs 69,360 69,360 69,360 69,360 69,360 69,360Farm Business Profit 160,605 151,951 77,674 179,328 130,944 97,229Business Return on Equity (%) 13.3 12.6 6.0 15.0 13.2 9.6
The annual operating budgets for the alternative enterprises in the Far West region farming system presented in Table 9.3 show that the business return on equity for the alternative enterprises varied between 3.4 and 17%. The rate of return for the SR Merino enterprise (3) was highest (17%) followed by the representative farm result which had 14% farm business return on equity.
29
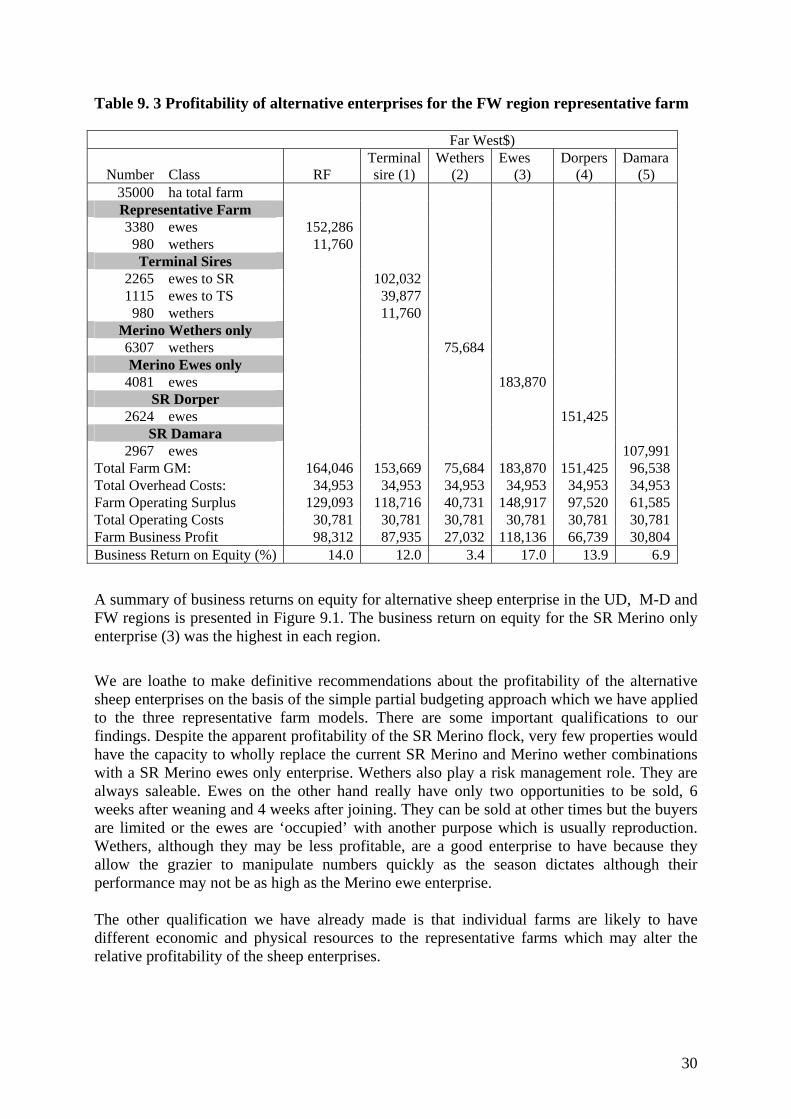
Table 9. 3 Profitability of alternative enterprises for the FW region representative farm
Far West$)
Number Class RF Terminal sire (1)
Wethers (2)
Ewes (3)
Dorpers (4)
Damara (5)
35000 ha total farm Representative Farm 3380 ewes 152,286
980 wethers 11,760 Terminal Sires
2265 ewes to SR 102,032 1115 ewes to TS 39,877
980 wethers 11,760 Merino Wethers only 6307 wethers 75,684 Merino Ewes only
4081 ewes 183,870 SR Dorper
2624 ewes 151,425 SR Damara
2967 ewes 107,991Total Farm GM: 164,046 153,669 75,684 183,870 151,425 96,538Total Overhead Costs: 34,953 34,953 34,953 34,953 34,953 34,953Farm Operating Surplus 129,093 118,716 40,731 148,917 97,520 61,585Total Operating Costs 30,781 30,781 30,781 30,781 30,781 30,781Farm Business Profit 98,312 87,935 27,032 118,136 66,739 30,804Business Return on Equity (%) 14.0 12.0 3.4 17.0 13.9 6.9
A summary of business returns on equity for alternative sheep enterprise in the UD, M-D and FW regions is presented in Figure 9.1. The business return on equity for the SR Merino only enterprise (3) was the highest in each region.
We are loathe to make definitive recommendations about the profitability of the alternative sheep enterprises on the basis of the simple partial budgeting approach which we have applied to the three representative farm models. There are some important qualifications to our findings. Despite the apparent profitability of the SR Merino flock, very few properties would have the capacity to wholly replace the current SR Merino and Merino wether combinations with a SR Merino ewes only enterprise. Wethers also play a risk management role. They are always saleable. Ewes on the other hand really have only two opportunities to be sold, 6 weeks after weaning and 4 weeks after joining. They can be sold at other times but the buyers are limited or the ewes are ‘occupied’ with another purpose which is usually reproduction. Wethers, although they may be less profitable, are a good enterprise to have because they allow the grazier to manipulate numbers quickly as the season dictates although their performance may not be as high as the Merino ewe enterprise. The other qualification we have already made is that individual farms are likely to have different economic and physical resources to the representative farms which may alter the relative profitability of the sheep enterprises.
30
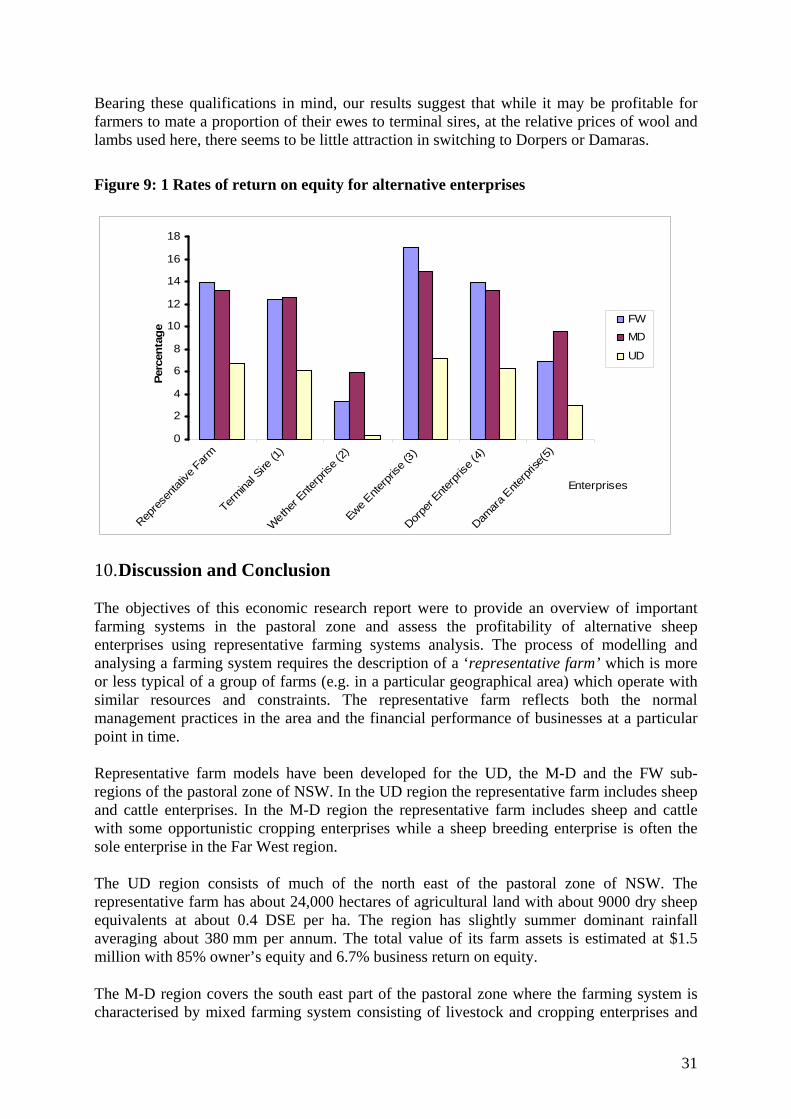
Bearing these qualifications in mind, our results suggest that while it may be profitable for farmers to mate a proportion of their ewes to terminal sires, at the relative prices of wool and lambs used here, there seems to be little attraction in switching to Dorpers or Damaras.
Figure 9: 1 Rates of return on equity for alternative enterprises
0
2
4
6
8
10
12
14
16
18
Repre
senta
tive F
arm
Termina
l Sire
(1)
Wethe
r Ente
rpris
e (2)
Ewe Ente
rpris
e (3)
Dorpe
r Ente
rpris
e (4)
Damar
a Ente
rpris
e(5)
Enterprises
Perc
enta
ge
FWMD
UD
10. Discussion and Conclusion The objectives of this economic research report were to provide an overview of important farming systems in the pastoral zone and assess the profitability of alternative sheep enterprises using representative farming systems analysis. The process of modelling and analysing a farming system requires the description of a ‘representative farm’ which is more or less typical of a group of farms (e.g. in a particular geographical area) which operate with similar resources and constraints. The representative farm reflects both the normal management practices in the area and the financial performance of businesses at a particular point in time. Representative farm models have been developed for the UD, the M-D and the FW sub-regions of the pastoral zone of NSW. In the UD region the representative farm includes sheep and cattle enterprises. In the M-D region the representative farm includes sheep and cattle with some opportunistic cropping enterprises while a sheep breeding enterprise is often the sole enterprise in the Far West region. The UD region consists of much of the north east of the pastoral zone of NSW. The representative farm has about 24,000 hectares of agricultural land with about 9000 dry sheep equivalents at about 0.4 DSE per ha. The region has slightly summer dominant rainfall averaging about 380 mm per annum. The total value of its farm assets is estimated at $1.5 million with 85% owner’s equity and 6.7% business return on equity.
The M-D region covers the south east part of the pastoral zone where the farming system is characterised by mixed farming system consisting of livestock and cropping enterprises and
31
dominant winter annual rainfall averaging about 225mm. The representative farm in this region has a total land area of 25,000 hectares divided between native pasture (64%), with a carrying capacity of 8,800 dry sheep equivalent at a stocking rate of 0.6 DSE per ha, natural reserve (20%) and cropping (16%). The total value of assets for the representative farm is about $1.4 million with 84% owner’s equity and 13.3% farm business return on equity.
The FW region includes the western part the pastoral zone of NSW characterised by relatively lower and anseasonal rainfall averaging 175 mm per annum. The system is dominated by specialist wool and sheep producers obtaining over 98% of farm income from the sale of wool and sheep. The representative farm in this region has a total land area of 35,000 hectares with 4,400 Merino sheep accounting for 7,000 dry sheep equivalent at the stocking rate of 0.2 DSE per ha. The total value of assets for the representative farm is estimated at about $0.883 million, with 80% owner’s equity and about 14% farm business return on equity. Because of a sustained period of low wool prices, high sheep and lamb meat prices and increased difficulty sourcing shearers there has been growing interest in changing the nature of the sheep enterprises in the pastoral zone away from a heavy reliance on wool towards a higher share of income from meat. A range of alternative sheep enterprises has been considered and compared with the representative farm in each sub-region. These enterprises include SR Merinos with a proportion of Merino ewes mated to a terminal sire for prime lamb production, wethers only, SR Merino ewes only, and SR Dorper and Damara enterprises
The business return on equity for the Merino ewes only enterprise was the highest in all sub regions with values of 7.2% in the UD, 15% in the M-D and 17% in the FW regions. The business return on equity for all other enterprises was lower than for the representative farm in all regions.
These results indicate that the farming systems that have evolved in these areas are well suited to their respective environments and the economic incentives to replace the traditional mix of a SR Merino flock and a wether flock do not appear strong, at least for the representative farms under the relative price conditions for wool and sheep assumed here. In addition, our analysis did not account for the cost of changing from one enterprise to another. Other assumptions in the analysis, for example that rangeland resources can be used equally well by the different enterprises and that commodity prices are constant across enterprises, also raise questions about the economic incentives to switch enterprises.
32
References ABARE (2006), Australian Commodity Statistics 2006, Australian Government Printing
Services, Canberra.
ABARE (2003), Australian Farm Survey Report 2003, Australian Government Printing Services, Canberra.
ABARE (2006), Australian Farm Survey Report 1996-2006, Australian Government Printing Services, Canberra.
ABS (2001), Agricultural Census Data 2000/01, Australian Government Printing Services, Canberra.
ABS (1997), Agricultural Census Data 1991-1997, Australian Government Printing Services, Canberra.
Brooke, G. and McGarva, L. (comp.) (1998), The Glove Box Guide to Plants of New South Wales Rangelands Grazing Management and Economics Activities, NSW Agriculture, Orange, ISBN 0731314875.
Campbell, T. and Hacker, R. (2000), The Glove Box Guide to Tactical Grazing Management for the Semi-Arid Woodlands, NSW Agriculture, Orange, ISBN 0 7347 1195 6.
Clewett, J.F., Clarkson, N.M., George, D.A., Ooi, S.H., Owens, D.T., Patridge I.J. and Simpson G.B. (2003), Rainman StreamFlow Version 4.3, Department of Primary Industries, Queensland.
CSIRO Livestock Industries and Australian Sheep Industry CRC (2004), The Merino versus Terminal Sire Flock Model, CSIRO Livestock Industries, Armidale. [On line]. Available. <http://www.sheepcrc.org.au/flock_structure.php>.
CSIRO and DLWC (1999), Study D: Biological status and trends of the land and water systems of the Western Division, NSW Department of Land and Water Conservation, Sydney.
Cunningham, G.M., Milham, W.E., Milthorpe, P.L., and Leigh, J.H. (1992), Plants of New South Wales, Inkata Press, Melbourne.
Condon, R. (1999), Out of the West: Historical Perspectives on the Western Division of New South Wales, Lower Murray-Darling and Western Catchment Management Committees.
Date, W. (1992), ‘Climate’, In: Rangelands Management in Western New South Wales, Simpson I. (ed.), NSW Agriculture, Orange.
DLWC (2000), Western Lands Review, Final Report, Department of Land and Water Conservation, Sydney.
Freudenberger, D., Wilson, A. and Palmer, R. (1999), ‘The importance of perennial grasses for sheep production in the semi-arid woodlands of eastern Australia’, The Rangeland Journal 21:199-219.
Hacker R. B., Alemseged, Y., Carberry, P.M., Browne, R.H. and Smith, W.J. (2006), Betting on Rain: Managing Seasonal Risk in Western NSW, NSW Department of Primary Industries, ISBN 0 7347 1727 X..
Hacker, R., Beange, L., Casburn, G., Curran, G., Gray, P. & Warner, J. (2005), Best Management Practices for Extensive Grazing Enterprises, NSW Department of Primary Industries, Orange.
33
Hacker, R.B., Alemseged, Y. & Carberry, P.M. (2004), Improved Seasonal Forecasts for Wool Producers in Western NSW, Final Report - DAN 16 (Milestone 4), NSW Department of Primary Industries, Orange.
Hacker, R.B. (2004), Policy contributions to environmental risk management – matching policy to the rangeland environment, In: Living in the Outback, Australian Rangeland Society 13th Biennial Conference Alice Springs 5th – 8th July 2004, Conference Papers (eds Bastin, G., Walsh, D. and Nicholson, S.), ISSN 1323-6660. pp 53-58.
Hacker R.B. and McLeod, S.R. (2003), Living with Kangaroos: A guide to kangaroos and their management in the Murray-Darling Basin, NSW Agriculture, ISBN 0 7347 1505 6. 44pp.
Hoadley J., Milham N. and Davenport S. (1994), Looking Forward: The Medium-Term Outlook For Farm Financial Performance in The Western Division of New South Wales, Miscellaneous Report, Economic Services Unit, NSW Agriculture, Orange.
Hodgkinson, K.C. and Harrington, G.N. (1985), ‘The case for prescribed burning to control shrubs in eastern semi-arid woodlands’, The Australian Rangeland Journal 7(2): 64-74.
Jayasuriya, R., Catt, C. and Young, R. (1999), Local Consensus Data Technique, Mimeo, NSW Agriculture, Orange.
LMDCMB (2002), Lower Murray-Darling Catchment Blueprint, Integrated Catchment Management Plan for the Lower Murray-Darling Catchment, Department of land and Water Conservation, Sydney.
LMDCMA (2006), Lower Murray-Darling CMA Catchment Action Plan, Department of land and Water Conservation, Sydney.
Louth BG, (comp.), (2000/1), Property management for the members of the Louth Bestprac Group, NSW Agriculture, Dubbo.
NIEIR (2000a), Necessary conditions and options for socio-economic advancement-A prospective and perspective analysis of the Western Catchment Management Area of New South Wales, A report for the Western Catchment Management Committee, Victoria.
NIEIR (2000b), Prospects for socio-economic advancement In the Western Catchment Management area of New South Wales, A report for the Western Catchment Management Board, Victoria.
McIntosh, G. (Comp.) (2004a), Kerribee Core Site Tour – GRDC Low Rainfall Meeting, Mallee Sustainable Farming Inc. and NSW Agriculture, Dareton.
McIntosh, G. (2004b), Outcomes achieved since 1999 in the Lower Murray-Darling Catchment Authority in NSW, NSW Agriculture, Dareton.
Mackay, B.I. (2002), Managing Drought, NSW Agriculture, Orange.
Murphy, John and Date, Warwick (1989), A Consensus Report of Current Costs, Returns and Management Practices for a Typical Western Cobar Grazing Property, Farm Business Notes No 49, NSW AGRICULTURE & FISHERIES, Agdex 400/820.
Murphy, J. (1992), ‘Enterprises’ In: Rangelands Management in Western New South Wales, ed. Ian Simpson, Chapter 1, NSW Agriculture.
34
Shepherd, R. (Comp) (2006), WEST 2000 Plus: Enterprise Based Conservation Program, Program Management and Recommendations, West 2000 plus, NSW Department of Natural Resources, ISBN: 0 7347 5667 4.
Short, J. (1987), ‘Factors affecting food intake of rangelands herbivores’, in Kangaroos: their ecology and management in the sheep rangelands of Australia (Eds. Caughley G., Shepherd, N. and Short, J.), Cambridge University Press, pp 84-99.
Swift, M.J. and Anderson, J.M. (1994), ‘Agricultural Systems’ In: Biodiversity and Ecosystem Functions, Schulze E.-D. and Mooney, H.A. (1994), eds, Springer-Verlag, Berlin Heidelberg, Germany.
WCMB (2003), Western Catchment Action Plan, Department of Land and Water Conservation, Sydney.
Weilmoringle BG, (comp.), (2000/1), Property management for the members of the Weilmoringle Bestprac Group, NSW Agriculture, Dubbo.
Wilcannia BG, (comp.), (2000/1), Property management for the members of the Weilmoringle Bestprac Group, NSW Agriculture, Dubbo.
WCMA (2006), Draft Western Catchment Plan 2006-2016, Version II. 112 pp. http://www.western.cma.nsw.gov.au/
Wilson, AD (1991), ‘The influence of kangaroos and forage supply on sheep productivity in the semi-arid woodlands’, The Rangeland Journal 13: 69-80.
Young, M. and Kilminster, T. (2004), ‘Alternative meat sheep in the farming system’, Ovine Observer, Number 29, Western Australian Department of Agriculture.
35
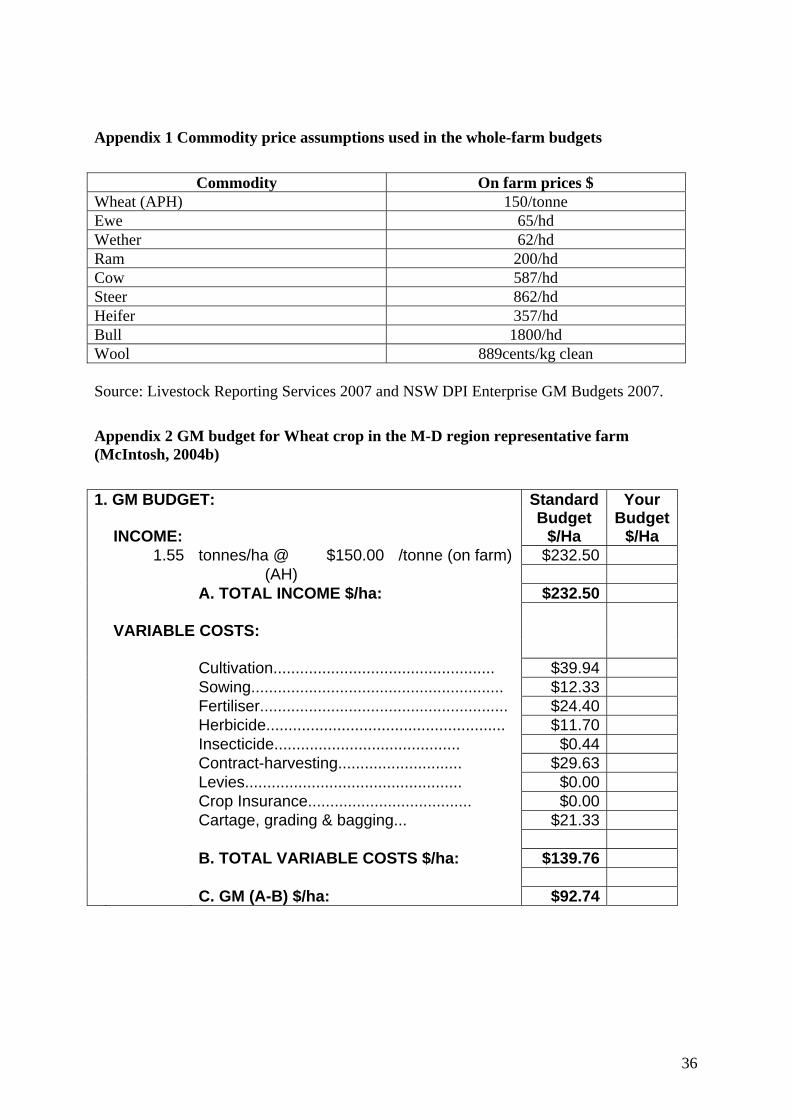
36
Appendix 1 Commodity price assumptions used in the whole-farm budgets
Commodity On farm prices $ Wheat (APH) 150/tonne Ewe 65/hd Wether 62/hd Ram 200/hd Cow 587/hd Steer 862/hd Heifer 357/hd Bull 1800/hd Wool 889cents/kg clean Source: Livestock Reporting Services 2007 and NSW DPI Enterprise GM Budgets 2007.
Appendix 2 GM budget for Wheat crop in the M-D region representative farm (McIntosh, 2004b) 1. GM BUDGET: Standard Your Budget Budget INCOME: $/Ha $/Ha 1.55 tonnes/ha @ $150.00 /tonne (on farm) $232.50 (AH) A. TOTAL INCOME $/ha: $232.50 VARIABLE COSTS: Cultivation.................................................. $39.94 Sowing......................................................... $12.33 Fertiliser........................................................ $24.40 Herbicide...................................................... $11.70 Insecticide.......................................... $0.44 Contract-harvesting............................ $29.63 Levies................................................. $0.00 Crop Insurance..................................... $0.00 Cartage, grading & bagging... $21.33 B. TOTAL VARIABLE COSTS $/ha: $139.76 C. GM (A-B) $/ha: $92.74
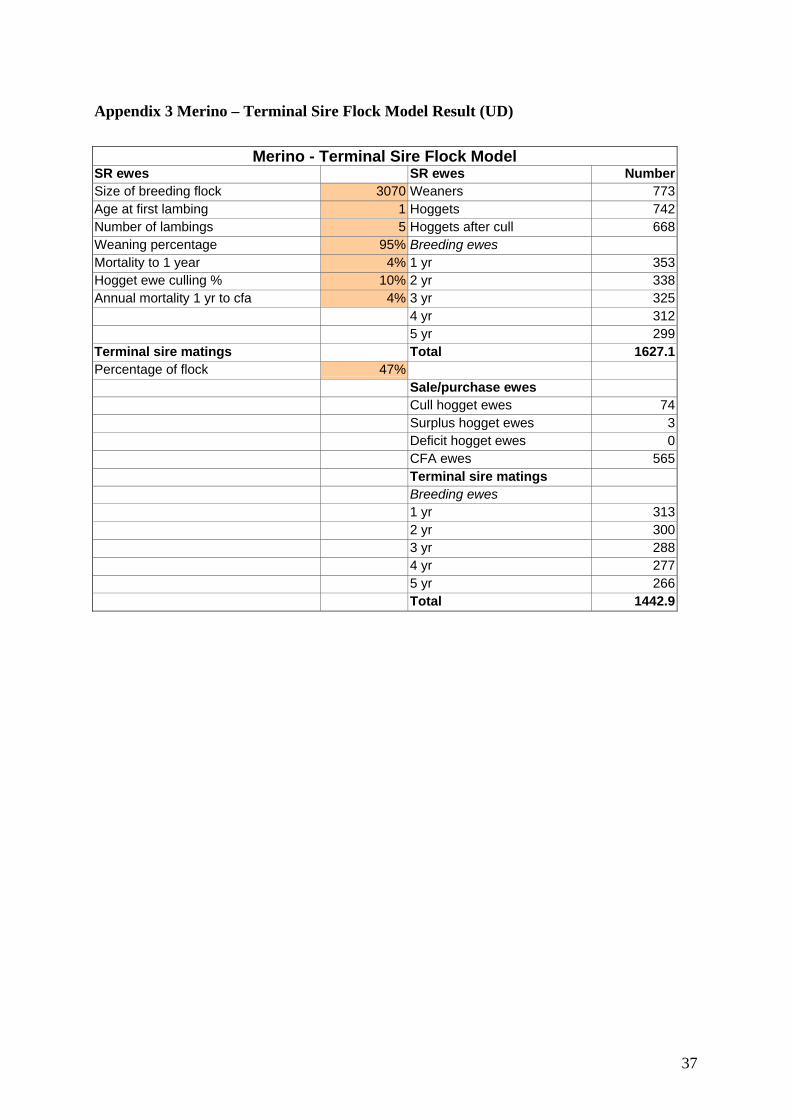
Appendix 3 Merino – Terminal Sire Flock Model Result (UD)
Merino - Terminal Sire Flock Model SR ewes SR ewes NumberSize of breeding flock 3070 Weaners 773Age at first lambing 1 Hoggets 742Number of lambings 5 Hoggets after cull 668Weaning percentage 95% Breeding ewes Mortality to 1 year 4% 1 yr 353Hogget ewe culling % 10% 2 yr 338Annual mortality 1 yr to cfa 4% 3 yr 325
4 yr 312 5 yr 299
Terminal sire matings Total 1627.1Percentage of flock 47%
Sale/purchase ewes Cull hogget ewes 74 Surplus hogget ewes 3 Deficit hogget ewes 0
CFA ewes 565 Terminal sire matings Breeding ewes 1 yr 313 2 yr 300 3 yr 288 4 yr 277 5 yr 266 Total 1442.9
37
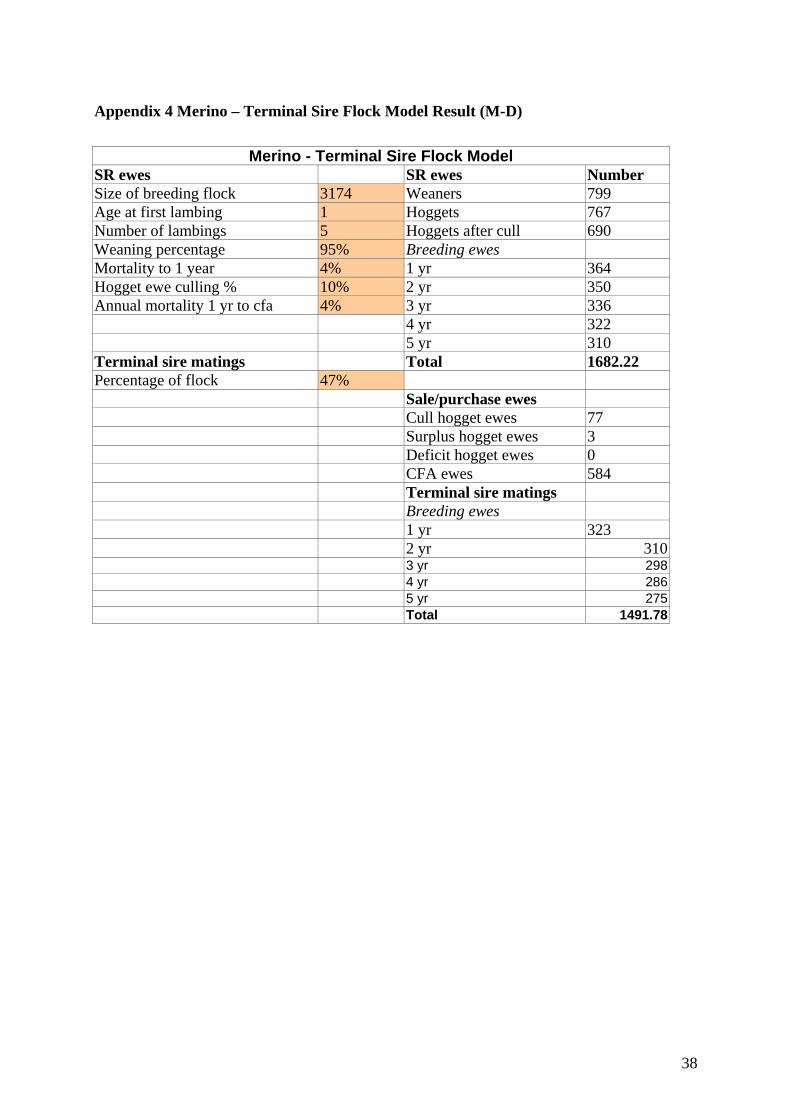
Appendix 4 Merino – Terminal Sire Flock Model Result (M-D)
Merino - Terminal Sire Flock Model SR ewes SR ewes Number Size of breeding flock 3174 Weaners 799 Age at first lambing 1 Hoggets 767 Number of lambings 5 Hoggets after cull 690 Weaning percentage 95% Breeding ewes Mortality to 1 year 4% 1 yr 364 Hogget ewe culling % 10% 2 yr 350 Annual mortality 1 yr to cfa 4% 3 yr 336 4 yr 322 5 yr 310 Terminal sire matings Total 1682.22 Percentage of flock 47% Sale/purchase ewes Cull hogget ewes 77 Surplus hogget ewes 3 Deficit hogget ewes 0 CFA ewes 584 Terminal sire matings Breeding ewes 1 yr 323 2 yr 310 3 yr 298 4 yr 286 5 yr 275 Total 1491.78
38
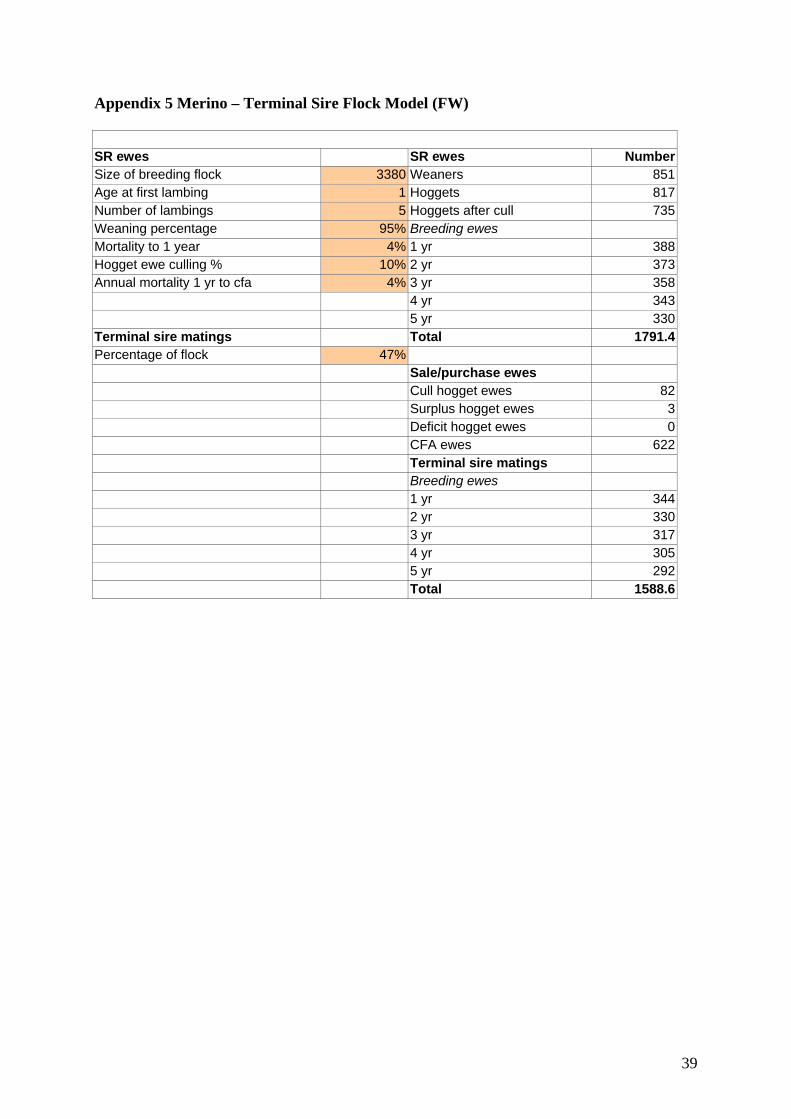
Appendix 5 Merino – Terminal Sire Flock Model (FW)
SR ewes SR ewes NumberSize of breeding flock 3380 Weaners 851Age at first lambing 1 Hoggets 817Number of lambings 5 Hoggets after cull 735Weaning percentage 95% Breeding ewes Mortality to 1 year 4% 1 yr 388Hogget ewe culling % 10% 2 yr 373Annual mortality 1 yr to cfa 4% 3 yr 358
4 yr 343 5 yr 330
Terminal sire matings Total 1791.4Percentage of flock 47%
Sale/purchase ewes Cull hogget ewes 82 Surplus hogget ewes 3 Deficit hogget ewes 0
CFA ewes 622 Terminal sire matings Breeding ewes 1 yr 344 2 yr 330 3 yr 317 4 yr 305 5 yr 292 Total 1588.6
39
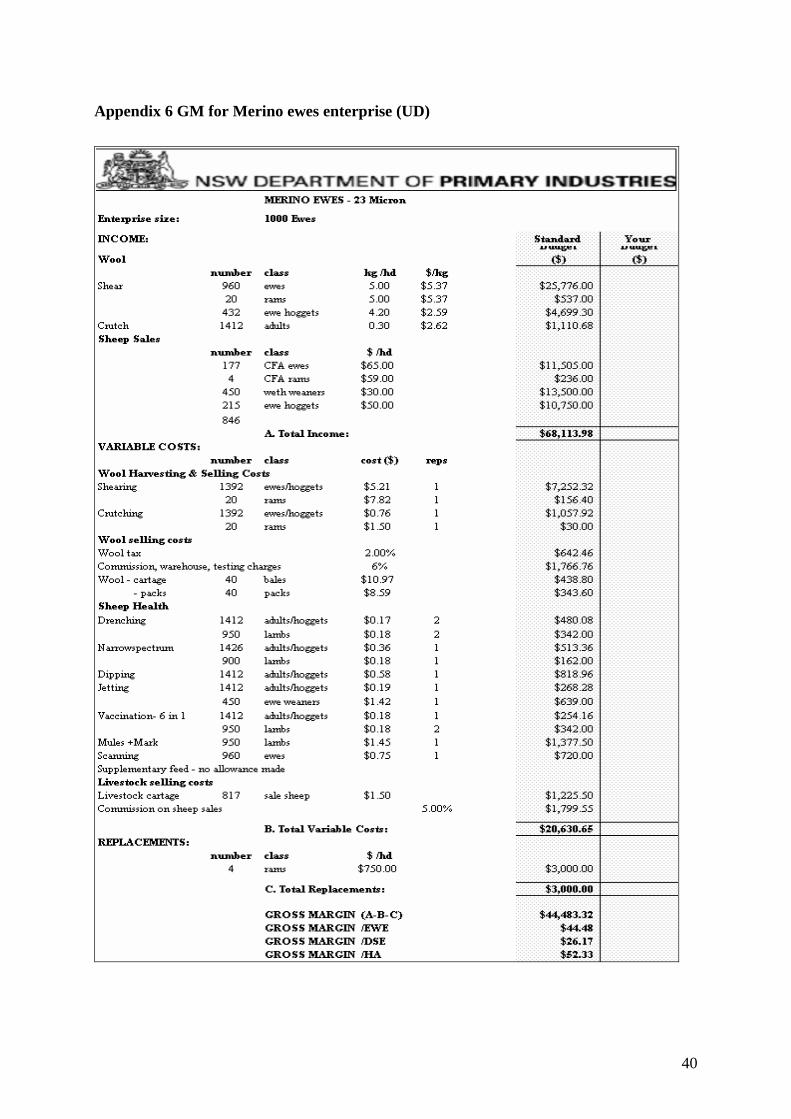
Appendix 6 GM for Merino ewes enterprise (UD)
40
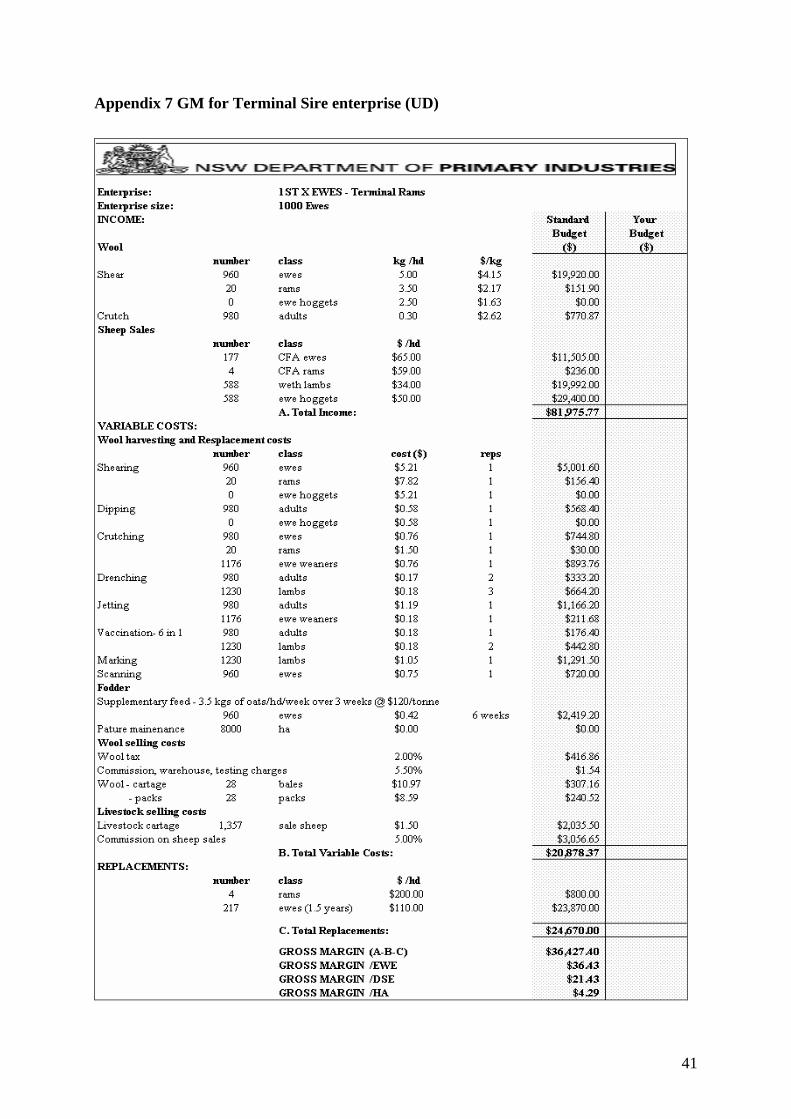
Appendix 7 GM for Terminal Sire enterprise (UD)
41
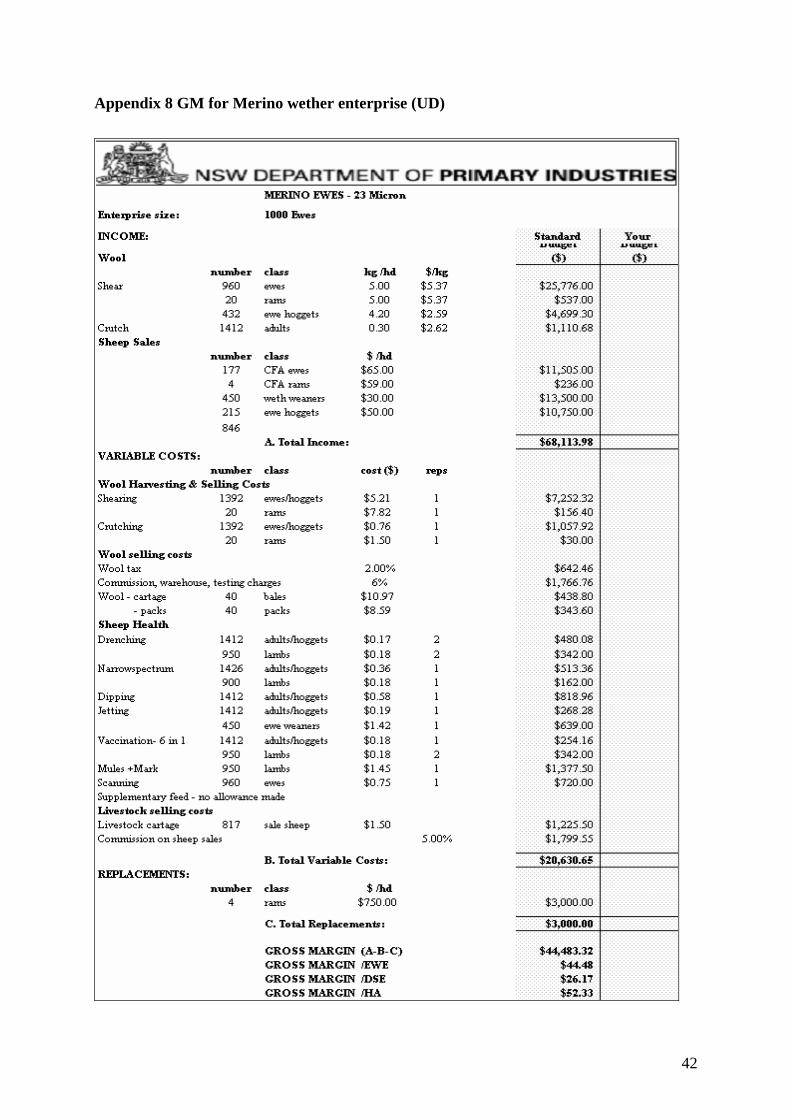
Appendix 8 GM for Merino wether enterprise (UD)
42
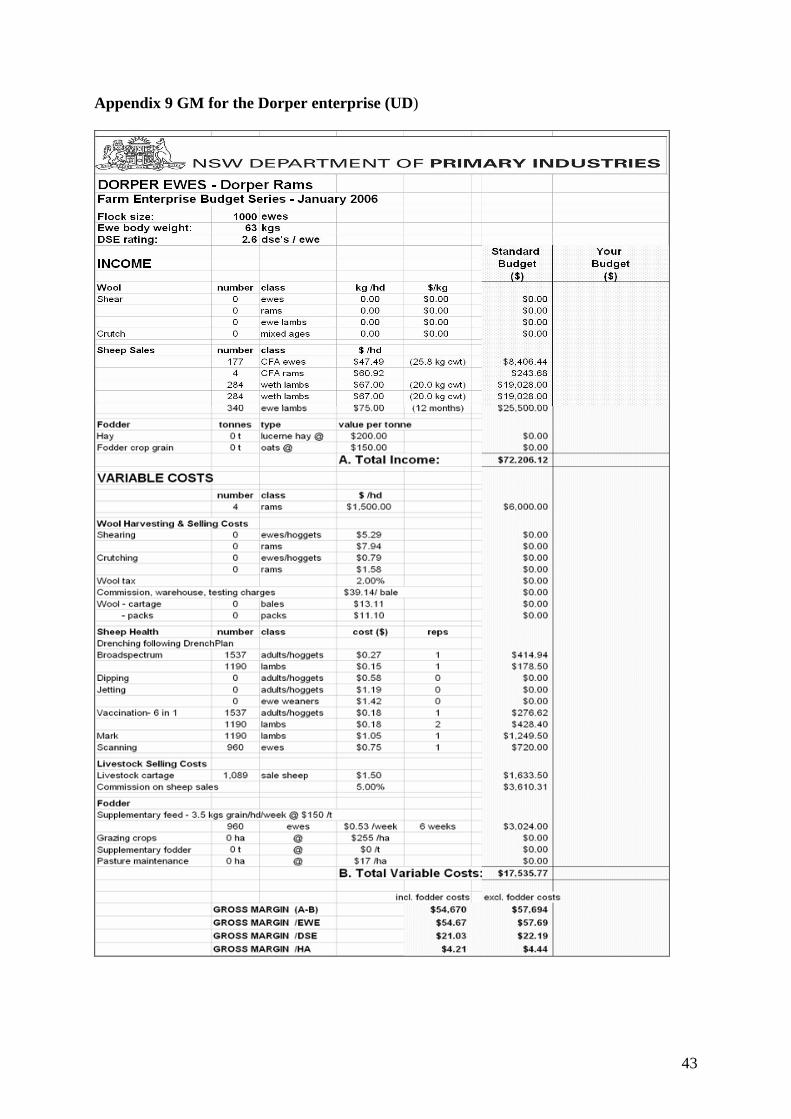
Appendix 9 GM for the Dorper enterprise (UD)
43
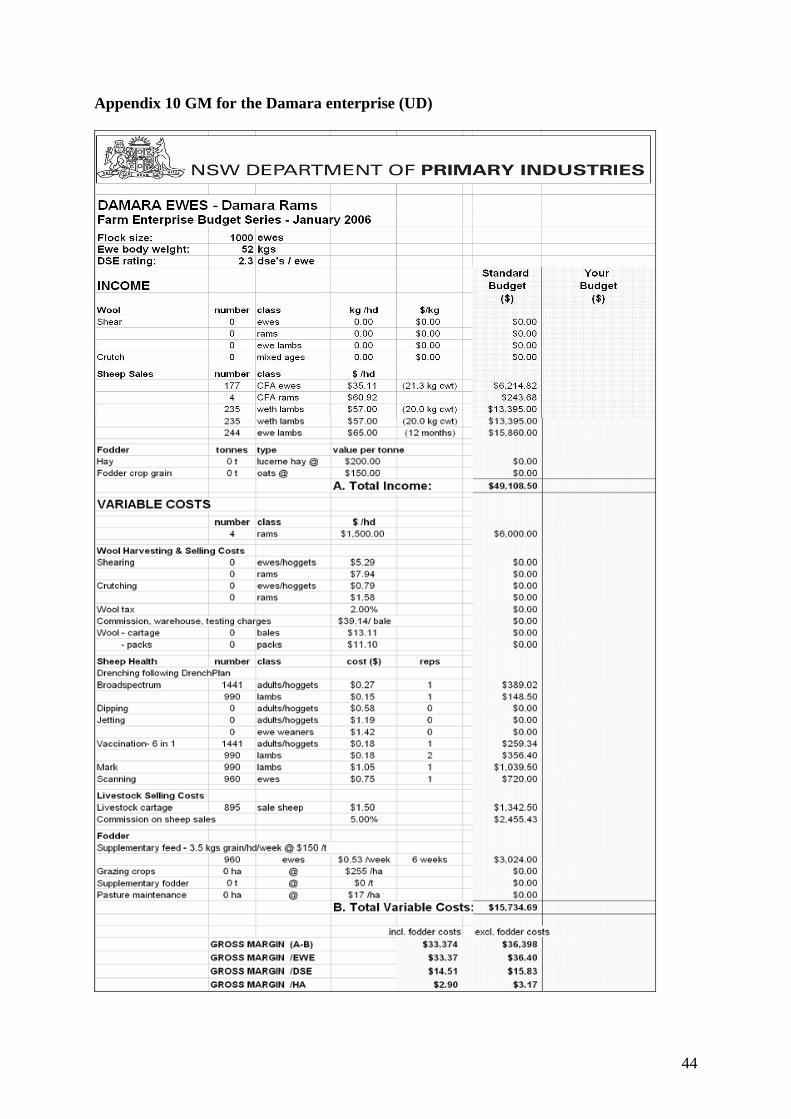
44
Appendix 10 GM for the Damara enterprise (UD)
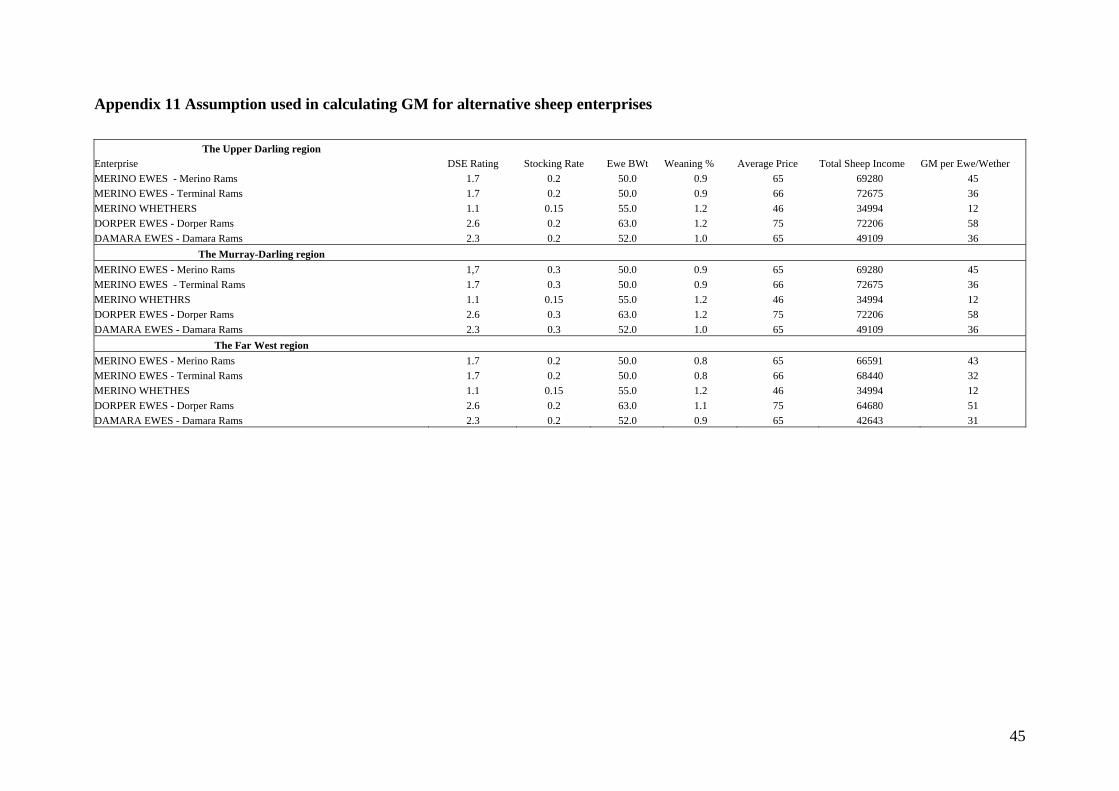
Appendix 11 Assumption used in calculating GM for alternative sheep enterprises
The Upper Darling region Enterprise DSE Rating Stocking Rate Ewe BWt Weaning % Average Price Total Sheep Income GM per Ewe/Wether MERINO EWES - Merino Rams 1.7 0.2 50.0 0.9 65 69280 45 MERINO EWES - Terminal Rams 1.7 0.2 50.0 0.9 66 72675 36 MERINO WHETHERS 1.1 0.15 55.0 1.2 46 34994 12 DORPER EWES - Dorper Rams 2.6 0.2 63.0 1.2 75 72206 58 DAMARA EWES - Damara Rams 2.3 0.2 52.0 1.0 65 49109 36
The Murray-Darling region MERINO EWES - Merino Rams 1,7 0.3 50.0 0.9 65 69280 45 MERINO EWES - Terminal Rams 1.7 0.3 50.0 0.9 66 72675 36 MERINO WHETHRS 1.1 0.15 55.0 1.2 46 34994 12 DORPER EWES - Dorper Rams 2.6 0.3 63.0 1.2 75 72206 58 DAMARA EWES - Damara Rams 2.3 0.3 52.0 1.0 65 49109 36
The Far West region MERINO EWES - Merino Rams 1.7 0.2 50.0 0.8 65 66591 43 MERINO EWES - Terminal Rams 1.7 0.2 50.0 0.8 66 68440 32 MERINO WHETHES 1.1 0.15 55.0 1.2 46 34994 12 DORPER EWES - Dorper Rams 2.6 0.2 63.0 1.1 75 64680 51 DAMARA EWES - Damara Rams 2.3 0.2 52.0 0.9 65 42643 31
45
NSW Department of Primary Industries Economic Research Report Series
Number 1 Brennan, J.P. and Bantilan, M.C.S. 1999, Impact of ICRISAT Research on Australian
Agriculture, Report prepared for Australian Centre for International Agricultural Research, Economic Research Report No. 1, NSW Agriculture, Wagga Wagga.
2 Davies, B.L., Alford, A. and Hollis, G. 1999, Analysis of ABARE Dairy Data for Six
Regions in NSW 1991-92 to 1996-97, Economic Research Report No 2, NSW Agriculture, C.B. Alexander College, Paterson.
3 Brennan, J.P. and Singh, R.P. 2000, Economic Assessment of Improving Nutritional
Characteristics of Feed Grains, Report prepared for Grains Research and Development Corporation, Economic Research Report No. 3, Wagga Wagga.
4 Zhao. X., Mullen, J.D., Griffith, G.R., Griffiths, W.E. and Piggott, R.R. 2000, An
Equilibrium Displacement Model of the Australian Beef Industry, Economic Research Report No 4, NSW Agriculture, Armidale.
5 Griffith, G., I’Anson, K., Hill, D., Lubett, R. and Vere, D. 2001. Previous Demand
Elasticity Estimates for Australian Meat Products, Economic Research Report No 5, NSW Agriculture, Armidale.
6 Griffith, G., I’Anson, K., Hill, D. and Vere, D. 2001. Previous Supply Elasticity
Estimates for Australian Broadacre Agriculture, Economic Research Report No 6, NSW Agriculture, Armidale.
7 Patton, D.A. and Mullen, J.D. 2001, Farming Systems in the Central West of NSW: An
Economic Analysis, Economic Research Report No. 7, NSW Agriculture, Trangie. 8 Brennan, J.P. and Bialowas, A. 2001, Changes in Characteristics of NSW Wheat
Varieties, 1965-1997, Economic Research Report No. 8, NSW Agriculture, Wagga Wagga.
9 Mullen, J.D. 2001, An Economic Perspective on Land Degradation Issues, Economic
Research Report No. 9, NSW Agriculture, Orange. 10 Singh, R.P., Mullen, J.D., and Jayasuriya, R. 2005, Farming Systems in the
Murrumbidgee Irrigation Area in NSW: An Economic Analysis, Economic Research Report No. 10, NSW Department of Primary Industries, Yanco.
11 Brennan, J.P., Aw-Hassan, A., Quade, K.J. and Nordblom, T.L. 2002, Impact of
ICARDA Research on Australian Agriculture, Economic Research Report No. 11, NSW Agriculture, Wagga Wagga.
46
12 Alford, A., Griffith, G. and Davies, L. 2003, Livestock Farming Systems in the Northern Tablelands of NSW: An Economic Analysis, Economic Research Report No. 12, NSW Agriculture, Armidale.
13 Alford, A., Griffith, G. and Cacho, O. 2003, A Northern Tablelands Whole-Farm Linear
Program for Economic Evaluation of New Technologies at the Farm Level, Economic Research Report No. 13, NSW Agriculture, Armidale.
14 Mullen, J.D. and Vere, D.T. 2003, Research and Extension Capabilities - Program
Economists in New South Wales Agriculture, Economic Research Report No. 14, NSW Agriculture, Orange.
15 Farquharson, R.J., Griffith, G.R., Barwick, S.A., Banks, R.G. and Holmes, W.E. 2003,
Estimating the Returns from Past Investment into Beef Cattle Genetic Technologies in Australia, Economic Research Report No. 15, NSW Agriculture, Armidale.
16 O'Donnell, C.J., Griffith, G.R., Nightingale, J.J. and Piggott, R.R. 2004, Testing for
Market Power in Multiple-Input, Multiple-Output Industries: The Australian Grains and Oilseeds Industries, Technical Report for the Rural Industries Research and Development Corporation, Economic Research Report No. 16, NSW Agriculture, Armidale.
17 Brennan, J.P., Martin, P.J. and Mullen, J.D. 2004, An Assessment of the Economic,
Environmental and Social Impacts of NSW Agriculture’s Wheat Breeding Program, Economic Research Report No. 17, NSW Agriculture, Wagga Wagga.
18 Griffith, G.R., Davies, B.L., Alford, A.R., Herd, R.M., Parnell, P.F. and Hegarty, R.S.
2004, An Assessment of the Economic, Environmental and Social Impacts of NSW Agriculture’s Investment in the Net Feed Efficiency R,D&E Cluster, Economic Research Report No. 18, NSW Department of Primary Industries, Armidale.
19 Scott, J.F. and Farquharson, R.J. 2004, An Assessment of the Economic Impacts of NSW
Agriculture’s Research and Extension: Conservation Farming and Reduced Tillage in Northern NSW, Economic Research Report No. 19, NSW Department of Primary Industries, Tamworth.
20 Scott, J.F., Farquharson, R.J. and Mullen, J.D. 2004, Farming Systems in the Northern
Cropping Region of NSW: An Economic Analysis, Economic Research Report No. 20, NSW Department of Primary Industries, Tamworth.
21 Crean, J., Shaw, A., Singh. R. and Mullen, J.D. 2004, An Assessment of the Economic,
Environmental and Social Impacts of NSW Agriculture’s Advisory Programs in Water Use Efficiency, Economic Research Report No. 21, NSW Department of Primary Industries, Orange.
22 Mullen, J.D. 2004, Evaluations in 2003 of Five Areas of Investment by NSW
Agriculture: Summary, Economic Research Report No. 22, NSW Department of Primary Industries, Orange.
47
48
23 Vere, D.T., Jones, R.E. and Dowling, P.M. 2004, An Economic Evaluation of Research into the Improved Management of the Annual Grass Weed Vulpia in Temperate Pastures in South-Eastern Australia, Economic Research Report No. 23, NSW Department of Primary Industries, Orange.
24 Jones, R.E. and Dowling, P.M. 2004, Sustainability, Externalities and Economics: The
Case of Temperate Perennial Grazing Systems in NSW, Economic Research Report No. 24, NSW Department of Primary Industries, Orange.
25 Brennan, J.P. and Quade, K.J. 2004, Analysis of the Impact of CIMMYT Research on the
Australian Wheat Industry, Economic Research Report No. 25, NSW Department of Primary Industries, Wagga Wagga.
26 Brennan, J.P., Sykes, J.D. and Scott, J.F. 2005, Trends in Pulse and Oilseed Crops in
Winter Cereal Rotations in NSW, Economic Research Report No. 26, NSW Department of Primary Industries, Wagga Wagga.
27 Vere, D.T., Griffith, G.R. and Silvester, L. 2005, Australian Sheep Industry CRC:
Economic Evaluations of Scientific Research Programs, Economic Research Report No. 27, NSW Department of Primary Industries, Orange.
28 Singh, R.P., Brennan, J.P. Lacy, J. and Steel, F. 2005, An Assessment of the Economic,
Environmental and Social Impacts of the Ricecheck Program, Economic Research Report No. 28, NSW Department of Primary Industries, Yanco.
29 Jones, R., Saunders, G. and Balogh, S. 2005, An Economic Evaluation of a Pest
Management Control Program: “Outfox the Fox”, Economic Research Report No. 29, NSW Department of Primary Industries, Orange.
30 Griffith, G.R., Parnell, P.F. and McKiernan, W. 2005, An Evaluation of the Economic
Benefits to NSW from Investment in the CRC for Beef Genetics Technologies, Economic Research Report No. 30, NSW Department of Primary Industries, Orange.
31 Khairo, S.A., Mullen, J.D., Hacker, R.B. and Patton, D.P 2008, Farming Systems in the
Pastoral Zoneof NSW: An economic Analysis, Economic Research Report No. 31, NSW Department of Primary Industries, Trangie.
32 Griffith, G., Vere, D., and Jones, R. 2006, Sheep CRC Renewal Proposal: Economic
Evaluation of the Proposed Scientific Themes, Economic Research Report No. 32, NSW Department of Primary Industries, Armidale.