Embed Size (px)
Citation preview
k, E
k WLG bn
Farmers’ Ability to Cope with Salinity I and Sodicity
Farmers’ perceptions, strategies and practices for dealing with salinity and sodicity in their farming
systems.
BY Neeltje C. Kielen
International Irrigation Management Institute Lahore, Pakistan
August 1996
Table of Content
List of Tables V
List of Figures
Summary
Background And Overview
Intrntluclinn
Cnnceptsal Frarnewnrk .Srr.rtoiitohili<v of ogri~-ecosysteiirs Soil zoliiiily ond sodicily Ewzleotioii of Il'oter Qimlityfiw IrriRolioit I'o:o,nicrs ' deci,doit-iiiaking proces.r
0l)jecIiver
M e l I ~ t ~ d ~ I n ~ Site selection Doto colleclion lccltniques /loin oitnlv.iis
V
VI
i
i
i i 2 4 6
X
9 10 10 10
11
I I I I 17 17 I S 15 17 I X 18
21 21 21 23 23 2? 21 25 27
Farmers' Understanding of Salinity and Sodicity
Farmers' Salinity and Sodicity Classification for Soil and Water lndicotwsfiir the recognitioci nfsolindsodic .soils Snil ,snIiiiif~~/,~odIcil.v rrriits gaolifv q/;rrIgo/Ioii ivnter
Discussion on Farmers' Salinity and Sntlicity Classification I'nrirrcr,a ' s o i l cln.r~ijicoliort s.v.slern F~ I~ I I ICXT ' wolo. cln.v.sIJirnlioii .\:v.rteur
Farmers' Strategies and Practices to Cope with Salinity and Sodicity
Intrntluction
Six Physical Conditions
FarniinE Systems iii Chistian SuB-tiirision
Fiiriiicrs' StrrtcKies to Cope with Saliiiily and Sotlicity
Tcnai~ts ant1 lheir Salinity aiitl Sntlicity Slratccy
Six Physical Cnntlitinns, Farm Characteristics, and Farmcrv' Salinity Stratcgy Soliiiit,v~sr~ilici~v .slrotrgiss rrrirler physicol co~iditions 1-3 .SoliiiitI~~sor/icI1.v ctrnlegics under phyy.sico1 condition J I 'rciwit i11crcose i11 .mlinif.v unr/cr pliy,sicnl condI/ion 4 N o .snl i~ i i t .v~~~~l ic; /~v plon urtder pli.vSrcol cniiditioii 4. I'rcvenl mid rcdiice .snlinifv/sod~ci~v under pl!v.vicol coiiditioii 4
28 211 28 3 0 31 31 31 32 32
35 35 3 5 37 37 37 3R 38 3 X
41
41 41 42 43
43 43 45
48
48
49
4')
51
51
52 52 53 53 54 54
Table nf ('onrent
Farmers' Salinity and Sodicity Strategy Related to the Farm Typolopy
Physical Conditinns, Farm Characteristics, and Farmers' Salinity Practices Snlini!v/.mdici!y praclices under physical cnndilinn / A Salinily/sndicity praclices under ph,ysicnl condilinn IR Snlini(v/rodicit,v praclices under phy.yicnl codifions 3 Prnctices under phyvicnl cnridilinn 4 with lhe srrnlegy to prevenl an increase in .snlinily/sndicily Salirtilyhndicity praclices under physical condilinn 4 and no salini/y/sndicily plan Praclices under physical condililion 4 10 prelvrif an increase and reduce prcsenf levels of snlini!v
Farmers' Salinity and Sodicity Practices Related to Farm Characteristics
Farmers' Ability to Cope with Salinity under Improved Water Supply
3 Watercourse Fordwah 14-R
Watercnurse Fnrdwah 130-R
Watercourse Azim I 1 1-L
Watercourse Aaim 20-L
Conclusions and Recommendations
Cnnclusions Fnrtnn,rer.~'perccplinn.s nn snlinify nnd sodicity Fnrnrcrs ' stralegics ondprnclices In cope wilh ,snlinily/sndicily Farmers ' ahili(v lo cope i i i l lt solinify/sodicify under irnprniad canal wnler supply n 4elltnd,lln~v
Fntiirc Research
List of References
Annex 1: Comparison between Farmers' and USSL Classification Systems
Annex 2: Evaluation of Indicators per Salinity Class
Annex 3: Evaluation of Farmers' Water Quality Assessment
Annex 4: Farm Characteristics
55
56 57 57 5R SR 59 59
6n
61
61
62
62
62
63
63 63 63 64 64
64
65
67
69
71
77
IV
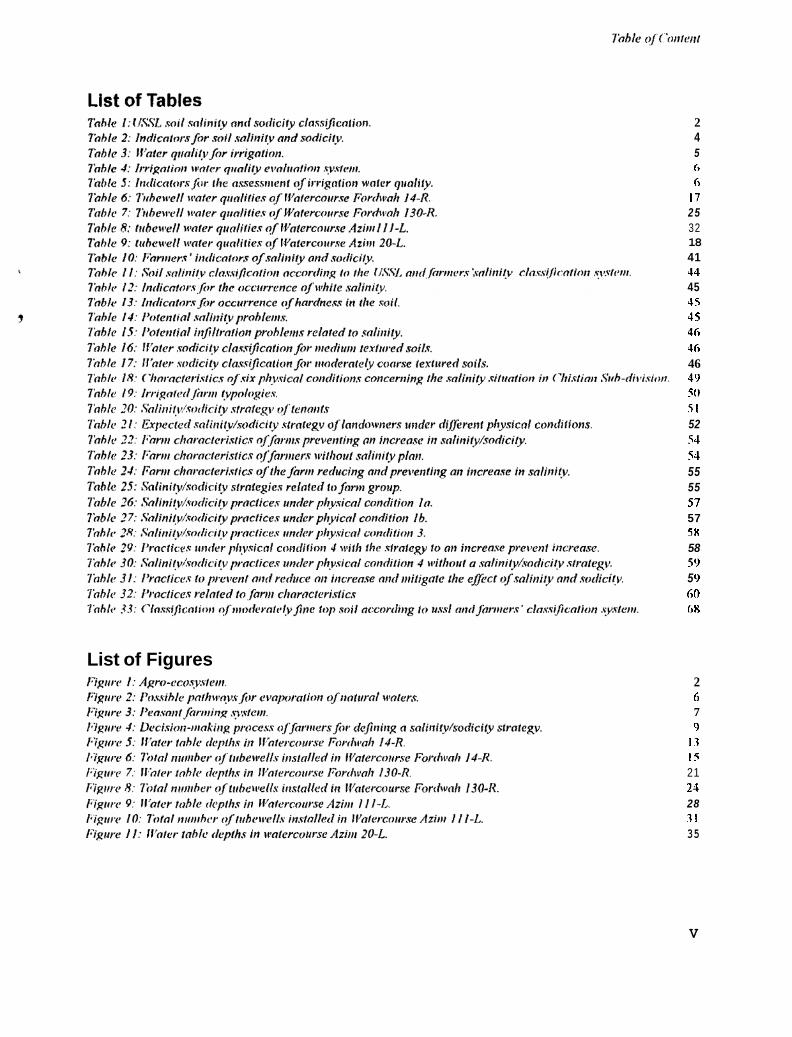
List of Figures
2 4 5 h h
17 2 5 32 18 41 44 45 45 45 46 JG 46 4‘) 20 51 52 54 54 55 55 57 57 5x 58 59 5 9 hfl (rX
2 6 7 9
13 15 21 25 28 11 35
V
Summary
This report describes tlie results of a study carried out in eiglit sample watercourses on tlic Fordwali m d Azim Distributaries in Chistian Snb-division, Punjab. This study is part of a broader research project \vliicli trics to evaluate tlic economic and ciiviromiicntal inipnct of changes in irrigation managcmcnt. tliroiigli tlic dcvclopniciit of an ’intcgratcd approach’. Tliis study relates farmers’ perceptions on salinity aiid sodicity, their strategies and practices, to tlie possibilitics and constraints of the physical environment and to the farm characteristics. I n this way, fanners’ abilities for improving salinity and sodicity nianagcmcnt imdcr ~nanagement intervcntions at higher levels of tlie irrigation system are revealed.
The starting point for the conceptual framework was the temi sustainability. The definition of sustainability infcrs that salinity and sodicity sliould bc viewcd as an cnvironmcntal dcgradation proccss which caii be influenced by farmers’ actions. The agro-ecosystem thinking refined this insight by naniing the agents through wliieli nutrients, and thus salts, can enter or leave the ecosystem. For the evaluation of soil salinity and sodicity, and the impact of irrigation water on salinity and sodicity, parameters like EC. EC/SAR. and RSC wcre suggestcd. Taking tlic fami as a basic iiiiit for analysis, and using the peasant fnrniing systciii approach as an analytical tool, allowcd the placeincnt of all farmers’ activities within the context o f a fanner as an individual dccision-maker, who trics to achieve his global farming objcctivcs within tlic possibilities and constraints of his farming system. The use of these theoretical conccpts (i.c.. agro- ccosystcm aiid pcasant fanning system conccpts), resulted in a concept for explaining tlic dccision-nxiking process used by a farmer, that also explains liow fanners develops a strategy for dealing with salinity and sodicity on their famis. The conceptual framework was a handy tool i n trying to understand fnrnicrs’ perceptions on salinity and sodicity and why farmers deal with salinity and sodicity i n certain ways. lh i s concept placed the salinity and sodicity issue within the global farming objectives, strategies, and constraints. This also provided fiirthcr insights into thc ways a farmcr, as an individual decision-mnkcr with a personal view on the salinitykodicity processes, trics to dcal with salinity and sodicity for his fiirmiiig systcni and how he arrivcs at tlic definition of a particular strategy.
Thc ficld data for this stndy wcrc collected by ninking iisc of three diKercnt tccliniqiics. I ) slriicIiiicd intcrvicws with open qiicstions; 2) discussions: and 3) mapping (inspired by mapping exercises used i n participatory rural appraisal). On tlie basis of tlie inforniation collccted by means of tlic aforcnicntioncd techniques, farmers’ perceptions, strategies and practices could be described. To obtain furtlicr insights into farmers’ hiowledge and understanding of salinitykodicity, links were made with secondary data collected by IIMI. Farmers’ strategies and practices were evaluated in the light of the possibilities and constraints of thc physical environment and tlie farming systems. Physical data, along with data on fanning systcms and fami charactcristics. wcrc all available within IIMI.
The study took place in eight sample watcrcourses (tcrtiary units) located i n Fordwah and Aziin distributaries at the tail of Fordwah Branch canal, where l l M l has bccti coiiducting rcscarcli for a few ycnrs. The study learned that the present salinity and sodicity status i n the liidus Basin is causcd by different processes, some of which occur as combined processes. Four watercourses were sclected to illustratc tlicsc cffccts. In essciice. tlic four watcrcoiirscs represcnt tlic following processes:
3
VI
1. lndigcnous salinity and sodicity originating from watcr action (Azim I I I-L) 2. Salinisation and sodification due to the use of poor quality tubewell water (Fordwah 130-R) 3. Salinisation and sodification due to capillary risc from high ground water tables (Fordwah 14-R) 4. Rcducing salinity and sodicity problem duc to the use of good qnality irrigation watcr.
Farmers use indicators based on the physical appearance of soils and crops to recognise problcnis wliicli are rclated to saliriity and sodicity. Thcsc indicators. or some of these indicators, are used by tlic farmers to classify different salinity/sodicity units. Farmers defined six salinity/salinity units to distinguish bctwecn tlic different types and levels of saline, sodic or waterlogged soils.
Comparing famiers‘ salinitykodicity classification system with the USSL soil classification system sliowcd that saline-sodic propcrtics occiir under conditions chssificd by tlic USSL as non-salinc atid non-sodic. NCW parametcrs were explored to explain farmers classification of saline-sodic soil properties. The ratio ECJSAR can be used to dcfinc an indicativc value bclow wliich soils start showing propcrtics of liardncss. The height o f the value differs per textural group, with coarser textured soils having a lower valnc tlian finer textured soils. The EC. is a good measure for the occurrence of salinity. The levels above wliicli saliiiity beconies visiblc for faniicrs arc not rclatcd to soil texturc.
An evaluation of farniers’ irrigation water classification system showed that the total salinity levcl measured by the EC of the irrigation water is a good parameter to predict soil salinity problems. The EC/SAR ratio can be used to predict infiltration problcnis, whilc tlic residual sodium carbonate (RSC) in conibinatioii wih the EC level i n the irrigation watcr gives a good indication of the hazards of reduced hydraulic conductivity.
Farmers’ strategies are i n the first place related to tlie physical environiiicnt under wliich tlic farnicrs opcratc. Undcr conditions whcrc farmers can largely influcncc the dcvclopmcnt of salinity and sodicity, fami cliaracteristics determine the salinitykodicity stratcgy. Farmers with high investnicnts in tlicir farms try to prevent an increase, or cveii to reduce tlie salinity and sodicity. Under conditions where land is not a major constraint and lack of crcdit prcvcnts farnicrs to havc intcnsivc farming, farnicrs tend not to Iinvc plans to control the salinity and sodicity. Under most salinchdic conditions. fnrmcrs mitigate tlic cffccts o f salinitykodicity on crop growth. Only the large nicclianiscd farms do not have special measures to mitigate the effects; they give all plots the sanie treatment.
NIC practices that farmers iniplcnicnt arc i n the first placc a rcsult of tlic physical conditions under wliicli they cultivate. Secondly, they are in line with the salinitykodicity strategy and tlic possibilitics and constraints set by tlic farm characteristics.
At prescnt, firniers in ninny arcas are able to cope witli salinity and sodicity. These are mostly farnicrs with good access to canal wte r , or canal water supplcniented by good quality tubewell water. 111 plnccs wlicrc the use of tubewell watcr might cause salinity/sodicity problems, mostly tlic fanners with good invcstincnt capacity are able to control salinity/sodicity and mitigate tlic effects on crop growth. Farmcrs with limited fami resources would benefit the most from iiiiproved canal watcr supplies.
VII
I . lndigcnoiis salinity and sodicity originating froni watcr action (Azini 1 I I-L) 2. Salinisation and sodification due to the usc o f poor quality tubewell watcr (Fordwali 130-R) 3. Salinisatioii and sodification due to capillary risc from high ground watcr tables (Fordwali 14-R) 4. Rcducing salinity and sodicity problem due to tlic usc ofgood quality irrigation water.
Farniers use indicators based on the physical appcarance of soils and crops to rccognise problems wliicli are rclated to salinity aiid sodicity. Tliesc indicators, or sonie o f these indicators, arc used by tlie farnicrs to classify different salinitylsodicity units. Farnicrs defined six salinity/salinity units to distinguish between tlic different types and levels o f saline, sodic or watcrlogged soils.
Comparing farnicrs‘ salinitylsodicity classification systcni with the USSL soil classification systciii showed that salinc-sodic propcrtics occur under conditions classified by the USSL as non-saline and non-sodic. Ncw paraiiietcrs were explored to explaiii fanners classification of saline-sodic soil properties. Tlic ratio ECJSAR can be used to dcfine an indicative valuc bclow which soils start showing propcrtics o f hardness. Tlic hciglit o f the value differs per textural group, with coarser textured soils having a lower val~ic tliaii finer tcxturcd soils. The EC. i s a good nicasure for tlic occurrence o f salinity. Tlic lcvcls above wliicli salinity bccoiiics visible for faniicrs are not related to soil texture.
An evaluation of farniers’ irrigation water classification system showed that tlie total salinity lcvcl iiicasurcd by tlie EC o f the irrigation water is a good paraiiietcr to predict soil salinity problems. The EC/SAR ratio can be used to predict infiltration problems, while the residual sodium carbonate (RSC) in conibination with the EC level in tlie irrigation watcr gives a good indication o f tlic hazards of rcduccd hydraulic conductivity.
Farnicrs’ stratcgics arc in the first placc rclatcd to tlie physical ciivironnicnt undcr which the farnicrs opcrate. Undcr conditions whcrc fariiicrs caii largcly influcnce thc dcvclopmcnt o f salinity and sodicity. farm charactcristics detcniiinc tlic saliiiitykodicity strategy. Faniicrs with high invcstnicnts in their fariiis try to prcvcnt an iiicrcasc. or evcii to rcducc the salinity and sodicity. Undcr conditions wlicrc Iaiid i s not a major constraint and lack o f credit prevents farmers to have intcnsivc fanning, farnicrs tend not to 1i:ivc plans to control the salinity and sodicity. Under most salinelsodic conditioiis. farnicrs initigatc the cffccts o f salinitylsodicity on crop growth. Only tlic large nicchaniscd farms do not liavc spccial nicasurcs to niitiyatc the effects; they give all plots the sanie treatment.
The prncticcs that faniiers iiiiplcment are in tlic first placc a result of tlic physical conditions undcr wliicli they cultivate. Secondly, they are iii linc with tlic salinity/sodicity stratcgy and the possibilities and constraints set by the farm characteristics.
At present, farniers iii ninny areas arc able to cope with salinity and sodicity. These are mostly farnicrs with good access to canal water, or canal watcr supplcmented by good quality tubcwcll water. I n places whcrc the use o f tubewell water might cause salinity/sodicity problciiis. niostly tlie farmers with good iiivcstii iciit capacity are able to control salinity/sodicity aiid niitigate the effects on crop growth. Farnicrs with liiiiitcd farni resources would benefit the most from improved canal watcr supplies.
)
v11
Chapter 1
Background and Overview
lhtroduction
This rcport dcscribcs thc resulls of a study cnrtictl out ill ciglit snmplc wntcrcourscs on the I.‘oidw:ili aid Azim Distributaries in Chistian Sub-division, Punjab. This study is patt of a broader research project whicli is evaluating the cconomic and environmental impact of changes in irrigation iiianagemcnt, through the development of an ‘integrated approach’. Research, which started in 1989, showed that salinity could be disassociated from waterlogging and that there was an emerging threat of sodification through the use of poor quality groundwater. The underlying hypothesis of the research is that through better distribution of good quality canal water, farmers are better armed to deal with salinity and sodicity. The research aims to evaluate the impact of interventions in canal irrigation management on salinitylsodicity and agricultural production (Garin el nl, 1996).
Salinity and sodicity processes under different irrigation distribution scenarios can be siniulated on the basis of a set of economic and physical ‘rules’. But the actual impact on soil salinity and sodicity at the fami and field level can only be revealed if fanners’ decisions and practices are taken into consideration. A case study conducted in January 1996 showed that farmers deal differently with salinitylsodicity depending on the physical and irrigation environment, farm goals and characteristics, and their knowledge and perceptions on salinity and sodicity (Kielen, 1996). This study tries to relate farmers’ perceptions on salinity and sodicity, their strategies and practices, to the possibilities and constraints of the physical environment and to the faim characteristics.
Conceptual Framework
Siislaiiiahility of avo-ecosptenrs
A starting point for this discussion is the term sustainability. In the global objectives of IIMl’s research program, under which the work in Chistian Sub-division is carried out, the term sustainability is mentioned several times. This tenn is used within the context of sustainable use of land and water resources ill
irrigated agriculture. For this ease study, the following definition of sustainability will be uscd: rhu copociy of /he owners and users ofthe scheme to manage and conserve rhe natural resources, lond ond water. in such a manner as 10 ensure the atrainmenr and continued satlsfaclion ofthe usur.7 needs,forpresent ond firrrrre generarions (FAO, 1992; Bastiaansen, 1992). In the light of this definition, salinisation and sodification are viewed as environmental degradation processes which can be influenced by the owiiers and users of the irrigation schemes.
I
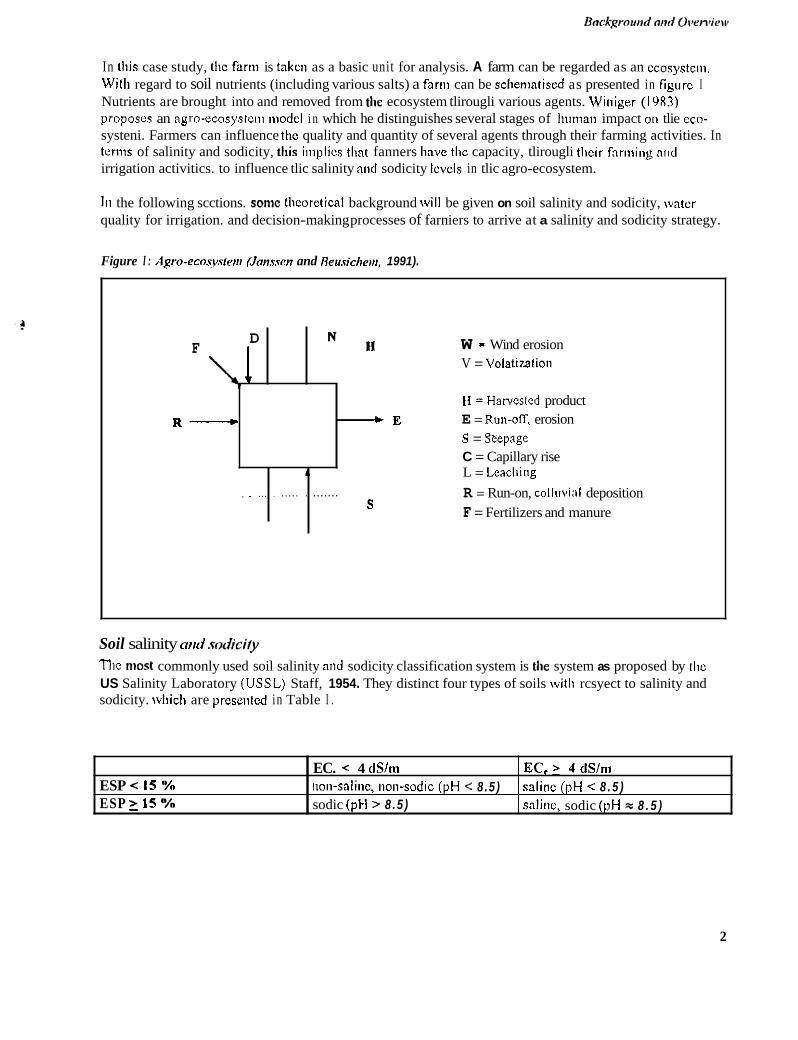
In this case study, the farm is taken as a basic unit for analysis. A farm can be regarded as an ccosystcni. With regard to soil nutrients (including various salts) a farin can be schematiscd as presented in figurc I Nutrients are brought into and removed from the ecosystem tlirougli various agents. Wiiiiger ( 19x3) proposcs an agro-ecosystciii model i n which he distinguishes several stages of Iiuman impact on tlie cco- systeni. Farmers can influence thc quality and quantity of several agents through their farming activities. In tcrnis of salinity and sodicity, this iiiiplics that fanners have tlie capacity, tlirougli their faniiing and irrigation activitics. to influence tlic salinity aiid sodicity lcvcls in tlic agro-ecosystem.
111 the following scctions. some thcoretical background will be given on soil salinity and sodicity, water quality for irrigation. and decision-making processes of farniers to arrive at a salinity and sodicity strategy.
1 D F
Figure I : Agro-ecosyslnrr (Jonssen and Reusiclioir, 1991).
W - Wind erosion V = Volatization
R-
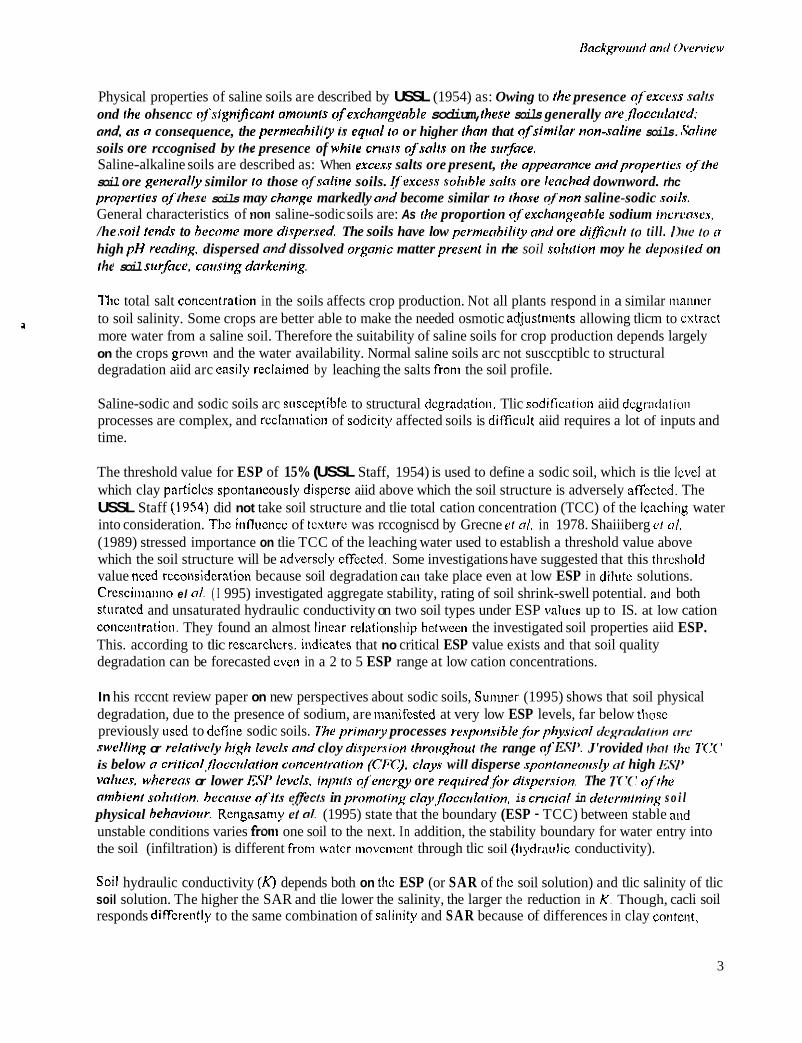
Soil salinity mid .mdici/y The most commonly used soil salinity aiid sodicity classification system is the system as proposed by tlie US Salinity Laboratory (USSL) Staff, 1954. They distinct four types of soils with rcsyect to salinity and sodicity. wliicli are prcseiitcd in Table I .
N =Harvested product E = Run-ON. erosion S = Stepage C = Capillary rise
+ E
, ~ ...
2
& L = Leacliing .~ ..... . ....... R = Run-on, collnvi:il deposition
F = Fertilizers and manure S
ESP < I5 "! ESP 2 15 Y o
EC. < 4 dSlm noii-salinc, non-sodic (pH < 8.5 ) sodic (pH > 8 .5 )
EC.> 4dS/m saline (pH < 8 . 5 ) saliiic, sodic (pH I 8 . 5 )
Nockgrormd m d Overview
a
Physical properties of saline soils are described by USSL (1954) as: Owing to /he presence qf'exccss .sol/.s ond /he ohsencc ofsignificant ornotints of exchongeoble sodium, /hese soils generally nre.floccrrlotcd; and. os o consequence, the pernieohilify 6 eqiiol ro or higher fhon that qfsimilor non-soline soils. .Vnline soils ore rccognised by the presence of whire crilsis ofsol/s on /he sirface. Saline-alkaline soils are described as: When exce.s.s salts ore present, /he appearonce ondproperries ($/he soil ore generolly similor 10 those of saline soils. Ifexcess soliible salts ore leoched downword. rhc propcrriss qf /hem soils may change markedly ond become similar /o those of non saline-sodic soi1.s. General characteristics of lion saline-sodic soils are: As /he proportion qfcxchongeohlr sodium incrcnsc.~, /he .soil rends to heconre more di.sper.sed. The soils have low permeobilily ond ore dlffiorlt to t i l l . / ) t ic to o high pH reading. dispersed and dissolved organic matter presenl in rhe soil solution moy he deposlled on /he soil swfoce. coirsing dorkening.
Thc total salt concciitration in the soils affects crop production. Not all plants respond in a similar manner to soil salinity. Some crops are better able to make the needed osmotic adjustnients allowing tlicm to cxtract more water from a saline soil. Therefore the suitability of saline soils for crop production depends largely on the crops gro\ni and the water availability. Normal saline soils arc not susccptiblc to structural degradation aiid arc casily reclaimed by leaching the salts from the soil profile.
Saline-sodic and sodic soils arc susccptible to structural dcgradatioii. Tlic sodificatioii aiid dcgl.;id;itioii processes are complex, and rcclniiiatioii of sodicity affected soils is difftcult aiid requires a lot of inputs and time.
The threshold value for ESP of 15% (USSL Staff, 1954) is used to define a sodic soil, which is tlie lcvel at which clay particlcs spontaiieously dispcrse aiid above which the soil structure is adversely affectcd. The USSL Staff (1954) did not take soil structure and tlie total cation concentration (TCC) of the lcacliing water into consideration. Thc infliicncc of tcxturc was rccogniscd by Grecne B / 01. in 1978. Shaiiiberg ct o I . (1989) stressed importance on tlie TCC of the leaching water used to establish a threshold value above which the soil structure will be adverscly cffccted. Some investigations have suggested that this tlircsliold value need reconsideration because soil degradation caii take place even at low ESP in dilutc solutions. Crcsciiiinniio el 01. ( I 995) investigated aggregate stability, rating of soil shrink-swell potential. and both sturatcd and unsaturated hydraulic conductivity on two soil types under ESP valucs up to IS. at low cation coiicciitratioii. They found an almost liiicar relationship bctwceii the investigated soil properties aiid ESP. This. according to tlic rescarchcrs. indicates that no critical ESP value exists and that soil quality degradation can be forecasted even in a 2 to 5 ESP range at low cation concentrations.
In his rcccnt review paper on new perspectives about sodic soils, Suniner (1995) shows that soil physical degradation, due to the presence of sodium, are manifested at very low ESP levels, far below those previously iiscd to dcfuie sodic soils. The primary processes responsihle,fir phjisicd dcpxxloiion w c '
swellinR or relolively hixh levcls ond cloy di,spersion rhroughoul the range qf l<.Sl'. J'rovided [hot lhc 7'Y.X' is below o cri/icol,floccirlo~ion concenrrolion (UC) , cloja will disperse .sponroneorrsly a/ high l<W vohrer, wherenv or lower I W 1cvcl.r. inpiis qf'eneru ore required,for di.spersion. The 7 T Y ' qf'ihe omhient solrrrion. hccnirsc ?fits @ecl.s in prrmiorinh. cloJ~,flocctrlorion. is crzrciol in determining s o i l physical hehoviotrr. Rengmaniy el 01. (1995) state that the boundary (ESP - TCC) between stable and unstable conditions varies from one soil to the next. In addition, the stability boundary for water entry into the soil (infiltration) is different from watcr niovciiicnt through tlic soil (1iydr;iulic conductivity).
Soil hydraulic conductivity (K) depends both on thc ESP (or SAR of thc soil solution) and tlic salinity of tlic soil solution. The higher the SAR and tlie lower the salinity, the larger the reduction in K. Though, cacli soil responds diffcrently to the same combination of saliiiity and SAR because of differences in clay colitctit,
3
clay mineralogy, iron and aluminium oxide content, and organic matter content. The influence of tliesc variable factors on soil hydraulic properties liave been investigated by many researchers during rccent decades.
In cultivated soils from semi-arid regions, sealing is a major determinant affecting tlie infiltration rate (IR). Seal formation at the soil surface is due to two processes: 1 ) physical disintegration of soil aggregates and soil compaction caused by the impact of water, especially water drops; and 2) chemical dispersion and movement of clay particles and the resultant plugging of conducting pores. Both processes act simultmmeously, with the first enhnncing the second (Agassi el a[., 1981). Infiltration rates are espccially affected by the SAR and EC of irrigation water, because of the mechanical and stirring action of falling water drops, overland water flow, and relative freedom of particle movement at tlie soil surface (Rengasamy el 01.. 19x4). Ostcr and Schocr (1979) obtnincd considcrably bcttcr corrclation of IR to the SAR and EC of tlie applied irrigation water than to tlie SAR and EC of the soil solution averaged over the entire coliitiiii length.
Surface sealing. and subsequent waterlogging at the surface, are followed by high initial rates of evaporation. However, if the hydraulic conductivity of the soil is low and unable to match the rate of water loss, the surface will dry rapidly followcd by shrinkage and a breaking away of the dry siirfncc into crnsts. In loamy soils with high contciits of sand and silt, drying may extend to a considerable depth resulting i n a hard sctting soil (So and Aylmore. 1993). Rengasamy and Olsson (1991) found a linear relationship between ESP and tlm strength of two hard setting soils. An important point from the relationship is that, for a given soil. ESP is a good indicator of its hard setting behaviour. The effect of increasing ESP on niodules of soil rupture (MOR) is mediated through the effects of ESP on the dispersion of clay (So and Aylmore, 1993). The effects observed are similar to the effccts obscrvcd on illite dominated soils (Rengasamy and Olsson, 1991). Howcvcr, ESP by itself is not a good indicator of physical bchaviour across a group of soils (So and Aylmore, 1993).
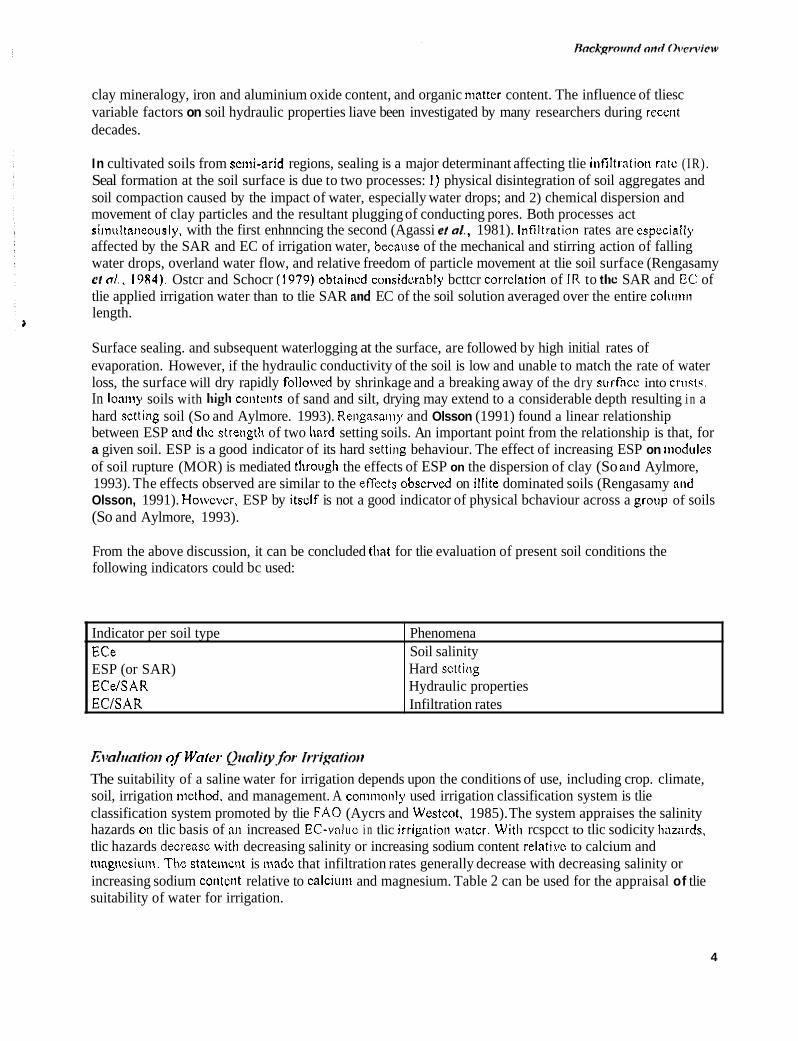
From the above discussion, it can be concluded that for tlie evaluation of present soil conditions the following indicators could bc used:
Indicator per soil type ECe ESP (or SAR) ECelSAR EClSAR
Phenomena Soil salinity Hard sctting Hydraulic properties Infiltration rates
Gl%7lrrofiorl qf Wn1er. QrloIiry.for Ir.r’ipfior1 The suitability of a saline water for irrigation depends upon the conditions of use, including crop. climate, soil, irrigation nicthcd. and management. A conimonly used irrigation classification system is tlie classification system promoted by tlie FA0 (Aycrs and Westcot, 1985). The system appraises the salinity hazards on tlic basis of an increased EC-valuc i n tlic irrigntiori watcr. With rcspcct to tlic sodicity haznrds, tlic hazards decreasc witti decreasing salinity or increasing sodium content relativc to calcium and niagiicsium. The statement is niadc that infiltration rates generally decrease with decreasing salinity or increasing sodium cotitelit relative to calcium and magnesium. Table 2 can be used for the appraisal of tlie suitability of water for irrigation.
4
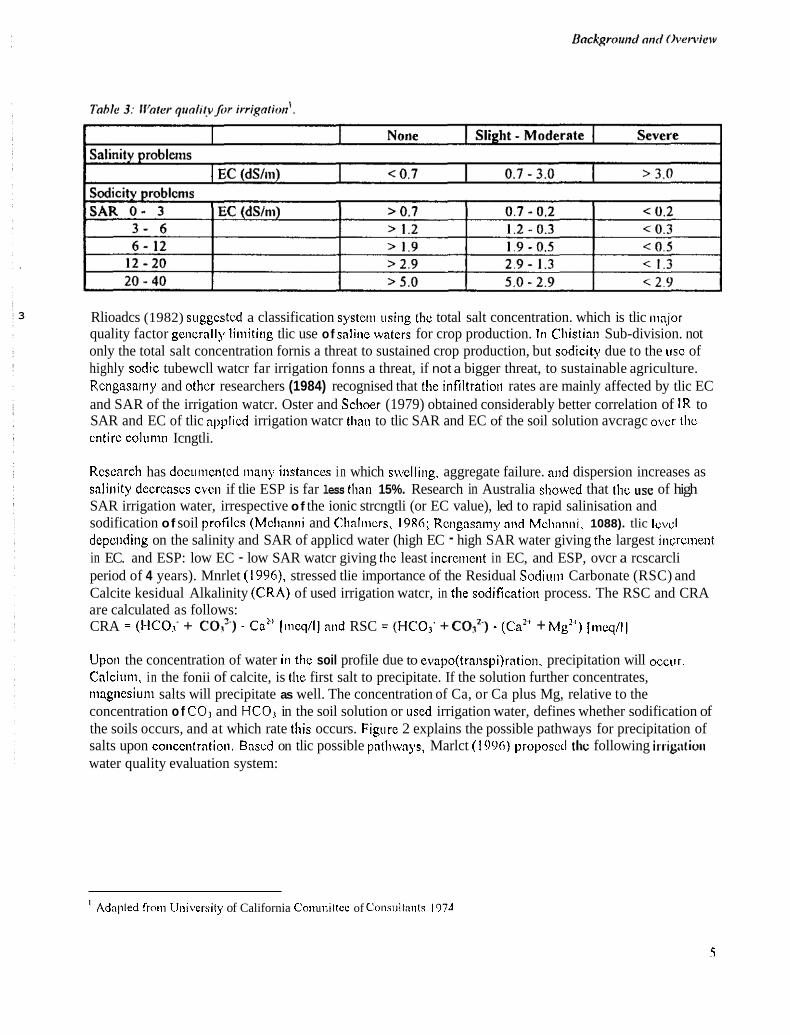
3 Rlioadcs (1982) suggcstcd a classification systcni using the total salt concentration. which is tlic niajor quality factor gcncrally liniiting tlic use of salinc watcrs for crop production. In Cliistiati Sub-division. not only the total salt concentration fornis a threat to sustained crop production, but sodicity due to the IISC of highly scdic tubewcll watcr far irrigation fonns a threat, if not a bigger threat, to sustainable agriculture. Rengasamy and other researchers (1984) recognised that the infiltratioti rates are mainly affected by tlic EC and SAR of the irrigation watcr. Oster and Sclioer (1979) obtained considerably better correlation of IR to SAR and EC of tlic applied irrigation watcr than to tlic SAR and EC of the soil solution avcragc ovcr thc cntire colunui Icngtli.
Rcsearch has docunientcd many instances i n which swclling. aggregate failure. and dispersion increases as salinity decreases cvcn if tlie ESP is far less than 15%. Research in Australia showed that the use of high SAR irrigation water, irrespective of the ionic strcngtli (or EC value), led to rapid salinisation and sodification of soil profilcs (Mcltanni and Chnlnicrs. 19x6; Rctignsniny and Mcllntini. 1088). tlic Icvd depcnding on the salinity and SAR of applicd water (high EC - high SAR water giving the largest incrcnient in EC. and ESP: low EC - low SAR watcr giving tlie least incrcmcnt in EC, and ESP, ovcr a rcscarcli period of 4 years). Mnrlet (1996). stressed tlie importance of the Residual Sodiiini Carbonate (RSC) and Calcite kesidual Alkalinity (CRA) of used irrigation watcr, in the sodification process. The RSC and CRA are calculated as follows: CRA = (HCO; + CO,’.) - Ca2“ Inicq/l] and RSC = (HCO; + C012-) - (Ca” + Mg”) Imcq/l)
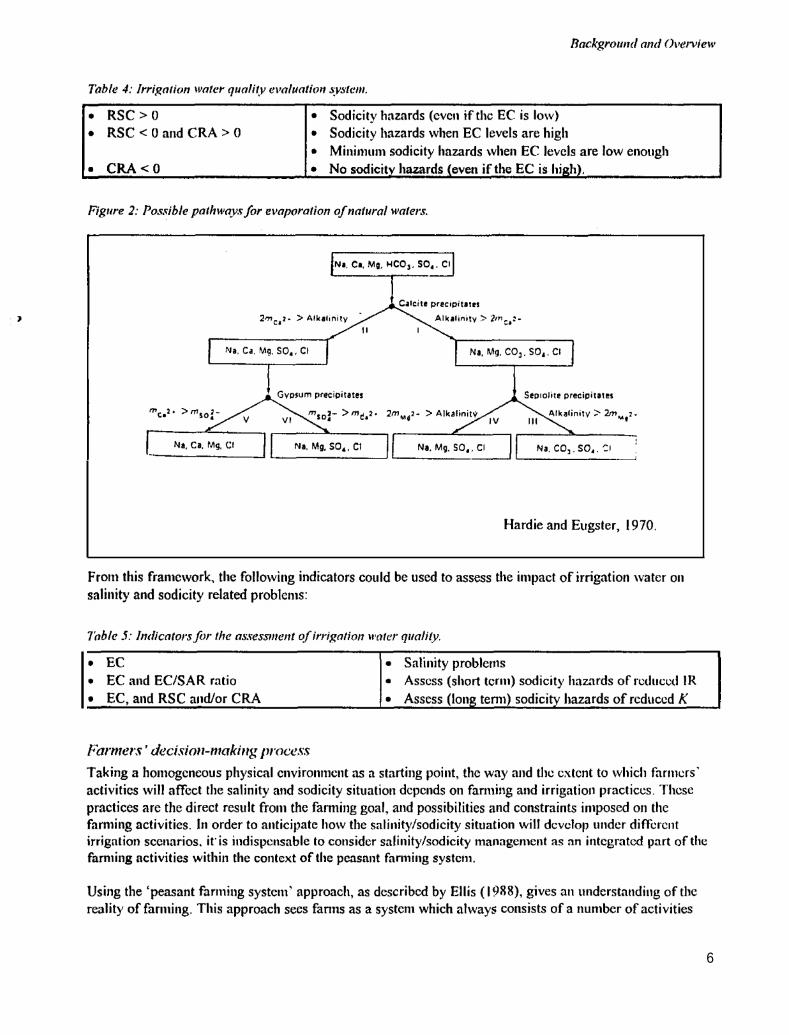
Upoti the concentration of water iti the soil profile due to evapo(transpi)ration, precipitation will occtir. Calcium, in the fonii of calcite, is the first salt to precipitate. If the solution further concentrates, magnesium salts will precipitate as well. The concentration of Ca, or Ca plus Mg, relative to the concentration o f C 0 3 and HC03 in the soil solution or uscd irrigation water, defines whether sodification of the soils occurs, and at which rate this occurs. Figurc 2 explains the possible pathways for precipitation of salts upon conccntration. Bascd on tlic possible pntliwnys, Marlct (1996) proposctl the following iriig;ilioit water quality evaluation system:
’ Adnpled from Ilniversily of California Conunillee of Consultnnls I974
5
9
Roc!i~round oral 0l~cr.I'rell'
?
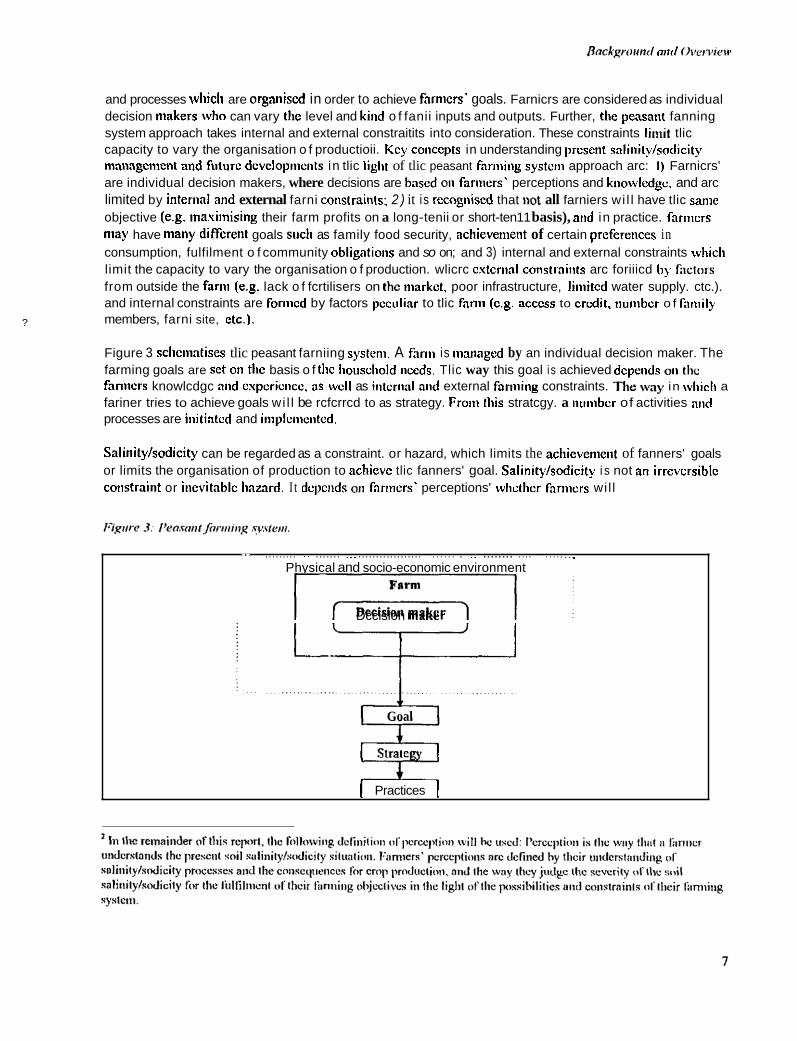
and processes wliicli are organised in order to achieve farmers' goals. Farnicrs are considered as individual decision makers who can vary the level and kind o f fanii inputs and outputs. Further, the peasatit fanning system approach takes internal and external constraitits into consideration. These constraints h i t tlic capacity to vary the organisation o f productioii. Key concepts in understanding present snlinity/sodicity nianagcment and futurc dcvclopniciits in tlic light of tlic peasant farming system approach arc: I ) Farnicrs' are individual decision makers, where decisions are based 011 fanners' perceptions and kiiowlcdgc, and arc limited by intenial and external farni constraiiits: 2 ) it is recognised that not all farniers wi l l have tlic same objective (e.g. maviinising their farm profits on a long-tenii or short-ten11 basis), atid in practice. farnicrs may have many diffcreiit goals such as family food security, achievement of certain prcfereiices in consumption, fulfilment o f community obligations and so on; and 3) internal and external constraints wliicli limit the capacity to vary the organisation o f production. wlicrc cxtcriial cotistrailits arc foriiicd 1 1 ) fiicttm from outside the fariii (e.g. lack o f fcrtilisers on the aiarkct, poor infrastructure, liniitcd water supply. ctc.). and internal constraints are foriiicd by factors pcculiar to tlic fanii (c.g. acccss to crodit, nuriibcr o f faiiiily members, farni site, etc.).
Figure 3 sclicniatises tlic peasant farniing spstcni. A farni is Inanaged by an individual decision maker. The farming goals are set 011 thc basis o f the Iiouscliold needs. Tlic way this goal i s achieved dcpcnds 011 the faniiers knowlcdgc and cxpcriciicc, as wcll as iiitcriial and external farniing constraints. The way in wliicli a fariner tries to achieve goals wi l l be rcfcrrcd to as strategy. From this stratcgy. a nunibcr of activities atid processes are initiated and iniplctiicntcd.
Salinity/sodicity can be regarded as a constraint. or hazard, which limits the acliievenient of fanners' goals or limits the organisation of production to achievc tlic fanners' goal. Salinity/sodicity i s not an irrevcrsible coiistraint or inevitablc Iiaznrd. I t depends 011 f'iriiicrs' perceptions' whctlicr fnriiicrs wil l
, . . ......... .. ....... . . ~ .................. . . . . . . . . . ~ ........ .... . . . . . ~~. Physical and socio-economic environment
r"11; Dccislon maker
Goal
I Practices 1
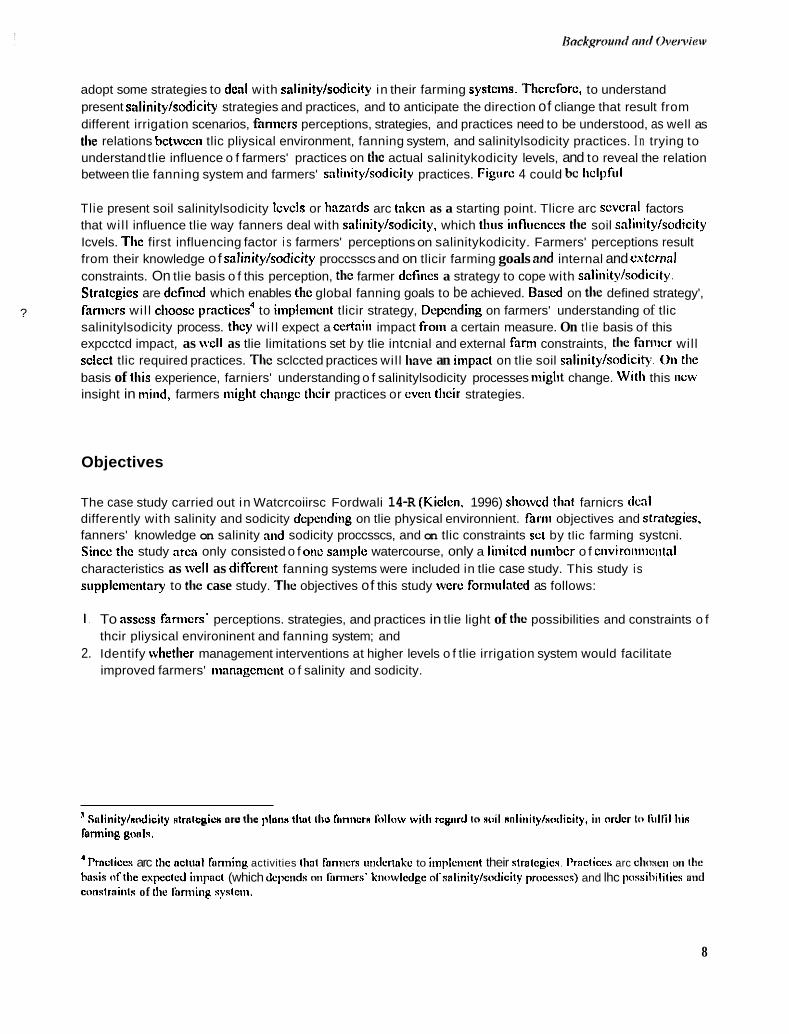
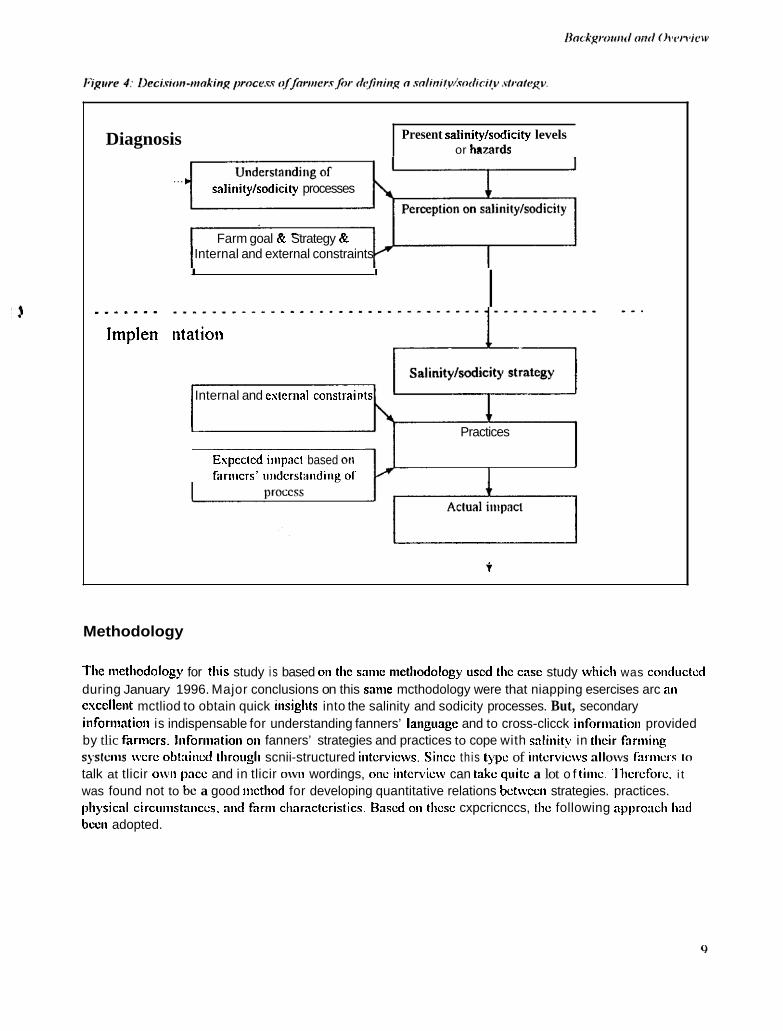
adopt some strategies to dcal with salinity/sodicity in their farming systcnis. Thcreforc, to understand present salinity/sodicity strategies and practices, and to anticipate the direction of cliange that result from different irrigation scenarios, hnners perceptions, strategies, and practices need to be understood, as well as the relations bctwcen tlic pliysical environment, fanning system, and salinitylsodicity practices. I n trying to understand tlie influence o f farmers' practices on the actual salinitykodicity levels, and to reveal the relation between tlie fanning system and farmers' salinity/sodicity practices. Figure 4 could be IiclpfiII
Tlie present soil salinitylsodicity lcvcls or haznrds arc taken as a starting point. Tlicre arc several factors that wi l l influence tlie way fanners deal with salinity/sodicity, which thus influences the soil salinity/sodicity Icvels. Tlie first influencing factor i s farmers' perceptions on salinitykodicity. Farmers' perceptions result from their knowledge o f salinity/sodicity proccsscs and on tlicir farming goals mid internal and cstcrnal constraints. On tlie basis o f this perception, the farmer defines a strategy to cope with salinity/sodicity. Stratcgies are defined which enables the global fanning goals to be achieved. Based on the defined strategy', fanncrs wil l choose practices4 to implenient tlicir strategy, Depending on farmers' understanding of tlic salinitylsodicity process. they wil l expect a ccrtaiii impact from a certain measure. On t l ie basis of this expcctcd impact, as well as tlie limitations set by tlie intcnial and external farm constraints, the farmer will select tlic required practices. The sclccted practices will have an impact on tlie soil salinity/sodicity. 0 1 1 the basis of this experience, farniers' understanding o f salinitylsodicity processes might change. With this new insight in mind, farmers miglit cliangc their practices or even tlicir strategies.
?
Objectives
The case study carried out in Watcrcoiirsc Fordwali 14-R (Kielcn. 1996) sliowcd tliat farnicrs dcal differently with salinity and sodicity dcpending on tlie physical environnient. farni objectives and strategies, fanners' knowledge on salinity and sodicity proccsscs, and on tlic constraints set by tlic farming systcni. Since the study area only consisted o f onc saniplc watercourse, only a limited number o f environniciital characteristics as \vet1 as different fanning systems were included in tlie case study. This study is supplcmentary to the case study. The objectives of this study were forniulatcd as follows:
I . To assess faniicrs' perceptions. strategies, and practices in tlie light of the possibilities and constraints o f
2. Identify whether management interventions at higher levels o f tlie irrigation system would facilitate thcir pliysical environinent and fanning system; and
improved farmers' mnnagcmcnt o f salinity and sodicity.
Sulinity/dioity rtrnlcgicn ore the plniis flint 1110 fnnncra I'ollow with regnrd 10 wil xnlinityhorlicily. in iirdcr to ( i i l l i l l i i R J
Lnning gonls.
' Prnclices arc Ihc nclual I'uniiing activities that funncrs iindcrmkc to implemenl their slrntcgics. I'ructices arc climcii 011 the hasia offhe erlxcled iiiipncl (which depends on hmiers ' hiowledge ofsalinity/sodicily prucesscc) and lhc pnssihilities and coaslraiiils of die I'arniinp systein
8
Diagnosis Present salinity/sodicity levels or hm7mds
__ . . - - - Itnplen
... salinitykodicity processes
Farm goal & Strategy & Internal and external constraints I I I
tit ation
Internal and eslernal coiistraitits
Practices
Expccted iiiipacl based 011
rarincrs’ iindcrst;inding 01
i
Methodology
The mcthodology for this study i s based on tlie sanie metlidology uscd tlic case study which was coiiductcd during January 1996. Major conclusions on this sanie mcthodology were that niapping esercises arc an cxcellent mctliod to obtain quick insights into the salinity and sodicity processes. But, secondary information is indispensable for understanding fanners’ language and to cross-clicck inforinntioil provided by tlic Wriiiers. Inforination on fanners’ strategies and practices to cope with salinitv in tlieir fnrniing S ~ S ~ C I I I S wcrc obt:iincd flirougli scnii-structured ii itcrvicw. Since this type of iiitcrvicws allo\vs liitnic~s 10 talk at tlicir otvn pace and in tlicir own wordings, one interview can takc quite a lot o f tiinc. Tlicrcfotc. i t was found not to be a good inethod for developing quantitative relations bctwccii strategies. practices. physical circunistanccs. and farin cliaractcristics. Based on tlicsc cxpcricnccs, tlic following appro:icli liiid bmii adopted.
Site srlecticiir All o f tlie eight sample watercourses on the Fordwali and Azim distributaries at the tail o f Fordwnh Branch canal in which IIMl i s conducting rescarch. were included in this study, in order to include as ninny physical and irrigation environments as possible, and all farming systems as they were idcntified by Rinaudo (1994).
f
Data collec~iori techiiiqrrcs The ficld data for this case study were collcctcd by making use of tlircc diffcrcnt research tccliniqucs. structured interviews with opcii questions, discussions, and mapping (inspircd by niapping exercises iiscd in participatory rural appraisal).
The study was startcd by visiting tubewell owners and/or tubewell users and farms from which soil samples were taken. The effect o f the use o f tubcwell water for irrigation on different soil typcs, and the quality o f soil from the ki//os where soil saniples werc taken from, were discussed in unstructured interviews. Tlicsc discussions did not only give insight into farnicrs' pcrccptions on soil salinity and sodicity and the impact o f the use of different qualities o f tubewell water, but also providcd the opportunity to visit tlic watcrconrse and get a first inipression o f the extent and severity o f the salinity and sodicity problems. This insiglit provided a framcwvork for the selection o f farmers to be interviewed.
Interviews were conducted to obtain insights into farmers' perceptions regarding salinity/sodicity and tbcir strategies and practices for coping with salinitylsodicity. Since the sample size o f farmers to be intcrvicwcd was larger than the number intervicwcd in tlie previous case study, and the case study had learncd wliich questions were important to bc discussed, a questionnaire with open questions was developed. During thc interviews, thcre was plcnty o f room for discussions with the fanners, but the questionnaire helped in covering all topics. The faniicrs were selected on tlie basis o f tlie fanning system group they belonged to. their location in the watcrcoursc, and the probability o f salinity and scdicity problems.
Initially. niapping exercises wcrc not includcd in the rescarcli proposal. But during tlie analysis of collcctcd field data and secondary data availablc in IIMI, it was realised that the approach being used did not provide insight into the history o f salinity and sodicity. Knowledgc o f the history helps in understanding farmers reactions to salinity and sodicity. Therefore, i t was decided to execute mapping cxcrcises in four watercourscs where thc most distinct types of salinity and sodicity processes are prcsent. Mapping !\as donc using a base-map o f tlie watercourses that indicated the killas (acres). irrigation canals, villages. and tubcwvclls. On this basc-map, diffcrcnt salinity/sodicity fcaturcs could be casily indicntcd. The cxcrcisc was done with a group o f faniicrs with a lot o f knowledge about the history o f the area and extensive experience with fanning.
Data crr,n/ysis On tlie basis o f the infomiation collccted by nicans o f the aforenientioncd tccliniqucs. fanners' pcrccptions. stratcgics and practices could be described. T o obtain fiirthcr insights into farnicrs' knowlcdgc and understanding o f salinitylsodicity. links werc niadc with secondary data collcctcd hy IlMl. Fnrnicrs' strategies and practiccs were cvaluatcd in tlic light of the possibilities and constraints o f the physical cnvironmcnt and the fnrming systcnis. Physical data, along with data on farming systems and farni characteristics. were all available within IIMI.
Chapter 2
Description of the Physical and Social Environment
T h i s study took place in IIMl’s ciglit sample watcrcourscs. The study lcarncd that tlic present salinity and sodicily statiis iii tlic Indus Basin is caused by different proccsscs. sonie o f \vliicli occiir as comhincd processes. For t l i is introductory cliaptcr. fonr watercourses were selected to illustrate these effects. 111 cssciicc. tlic four watercoiirses represent tlic followiiig proccsscs: I. Indigenous snlinity and sodicity originating from water action (Azini I I I -L): 2. Salinisation aiid sodificatioii due to tlic use o f poor quality tubewell water (Fordwvali 130-R): 3. Salinisation aiid sodification due to capillary rise from high ground watcr tables (Fordwall 14-R); and 4. Rediicing salinity and sodicity probleiii diic to tlic iisc ofgood quality irrigation watcr. I n tlic nest scctions. a detailed description o f the four watcrcoiirses i s presented.
!
Watercourse Fordwah 14-R
Soils I n 1995. the Soil Survey o f Pakistan (SSoP) carried out a detailed soil survey o f IIMl’s eight smn1)Ic \vatcrcourscs. Map I presents the soil map for Watcrcoiirsc 14% Tlic watcrcoiirsc coinniniid is located in the Rasulpar terrace. coniprising soils wliicli dcvclopcd in subrcccnt river alluviinii niiscd witli aeolian (Pleistocene) deposits from the Cholistan Desert Tlic different pliysiograpliic units o f this land forni idcntificd in Watercourse 14-R arc lcvcl plains, basins. levcllcd Icvees, and nearly level to gently undulating Icvccs. Basins refer to the lowest part of tliis land form. The Matli soil series has developed iii the lowest position o f this iinit. This unit covers less tlian 2 percent o f the coniniand area. The Matl i soil scrics bcloiigs to the fine-tcstnrcd textural groups, wliicli arc inipcrfcctly to iiiodcrately well drained. and have a modcratcly slow pcrmcability. Lcvcl plains are tlic lcvcl parts o f tlic subrcccnt flood plains. Tlic 0:igIi and Hariinabad soil scrics Iiavc developed on the sliglitly liiylicr raised parts o f this physiographic unit. This unit covers 32 percent o f the command area. These soils are iiicdium tcsturcd. iiiostly imperfectly drained with a niodcratc pertiicability. The Rasilpiir and Jliang soil series belong to tlic subrcccnt levelled. nearly lcvcl to gently undulating levccs. This pliysiograpliic iinit rcfcrs to low bridges parallcl to a river course. Tlic Rnsilpur soil series are mapped on loamy levee positions and tlic Jliaiig nt sandy positions. The loaiiiy Rasilpur soils belong to tlic modcratcly coarse tcsturcd soils aiid the sandy Jliaiig soils to the conrsc textured soils. This unit covers 66 percent o f tlic coniniand area, of wliicli only 3 percent i s covcrcd by LIic Jliang scrics. Tlic soils of this unit arc inipcrfcctly to sonicwlint cxcessivcly drained, aiid iiiodcratcly rapid to rapidly pcrmcnblc. Foutccn percent o f tlic soils in tli is watcrcoiirse were idcntificd to have a saline-sodic cnist. and 6 pcrccnt a saline-sodic surface, wliicli arc found in tlic tail-end o f tlic watcrcoursc.
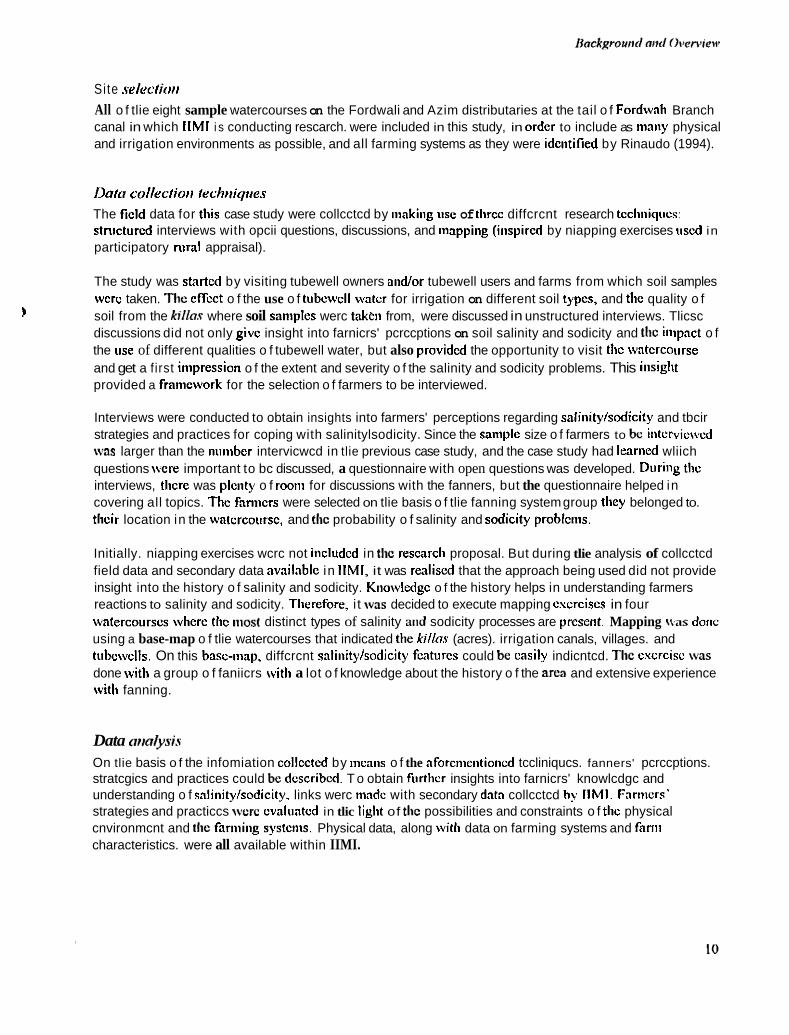
G‘ronr~dum/er lnhlc deplh arid qtialily Figure 5 presents the water table depths as they were measurcd in 1995, along with the positioii o f tlic obscrvation wclls. The dcepcst ground water lcvcls wcre observed in tlie middle o f Watercourse 14-R. At this place. tlic watcr table fliictuatcs bctwccn 2.00 ni (October) and 1.40 in nicasurcd in August. 111 tl ic tail arca. the most shallow water table lcvcls are observed fluctuating betwceii 0.5 111 (August) and I .0S in (October).
Figure 5: IVnter lohle depths in Cl’olercourse Fordwoh 14-R.
Ground water depth Fordwah 14-R Jan ‘95 -Nor ‘95
. - _ _ . 1.
.. 2.00 ~
I .80
1.60 .
. . . ---.__.- ..- _ - -. -
v
. 9 1.40
f 1.20
1 1.00
3 0.60
___~___ 3 0.80 2
6 0.40
0.20
0.00
02/01/95 06/03/95 06/05/95 02/07/95 03/09/95 06/11/95
Date
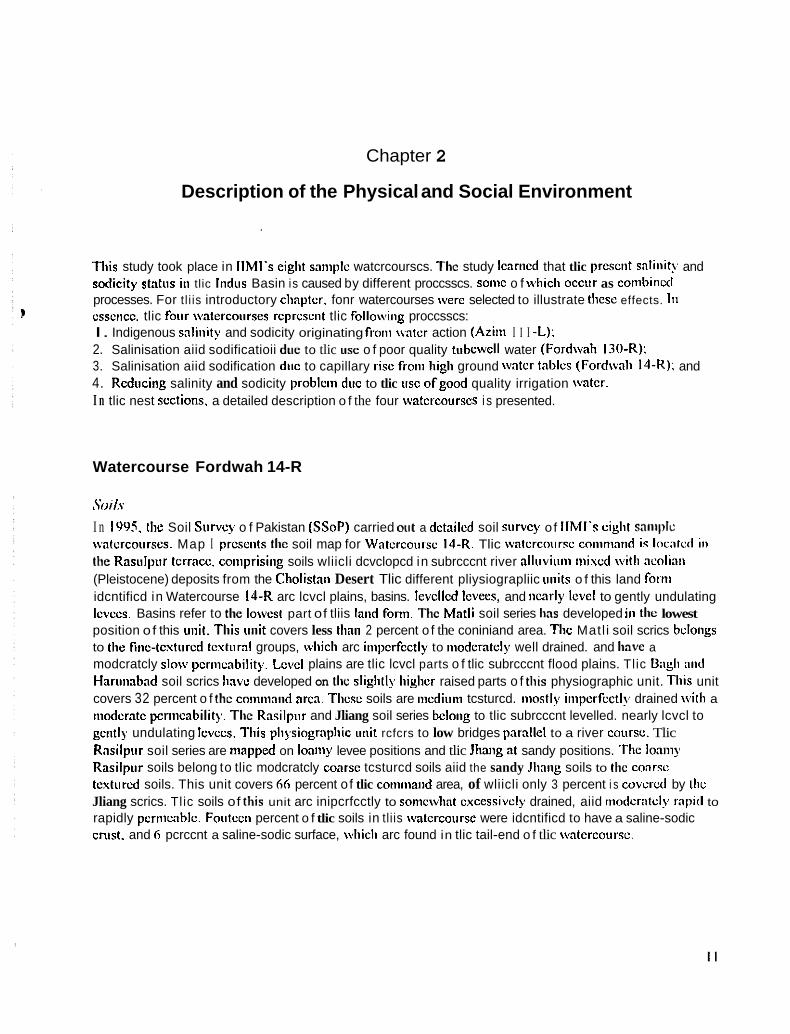
An indication o f tlie quality o f the ground watcr caii bc obtained froni the tubcwcll samples. Tubcwclls in the head o f Watercourse 14-R liavc ail approuiiii:itc EC of I dS/iii, SAR I .5. and an RSC-value of-3. The quality o f ground water decreases with the distance froiii the distributary. The quality o f the tubcwclls iii tlie niiddlc o f Watercourse 14-R are approximate: EC 3 d S h , S A R I I , and R S C -6, No tubcwells arc present in the tail of Watcrcourse 14-R, but i t miglit be expected that the quality is siniilar to, or poorer tlian. the ground water quality in the middle o f the watercourse. On Map 2, the locations o f the observation \vclIs arc plotted.
( h p s tnid croppiiix iri/ciisi/ies
M$or crops duriiig Rabi (winter scason) arc wheat and foddcr. During Kliarif (suiiiincr ninnsooii scasoii) tlic main crops arc cotton, sugarcane and foddcr. Sugarcano is grown by several fanners in tlie hcad and niiddle o f the watercourse. Avcrage yearly cropping intcnsitics arc I30 percent. The avcrngc cropping intcnsitics in Rabi and Kharif are 65 percent. The cropping intensities differ greatly per firin and cspccially pcr location in tlic watcrcoursc. Fariiicrs at the hcnd o f tlic watcrcoursc have yearly cropping intcnsitics raiigiiig bctwccn 140 and 200 percent; while in the tail o f tlic watcrcoursc, tlic yearly cropping intcnsitics do not exceed 90 percent. In Kharif. the cropping intensities iii the tail o f the watercourse are very low (around 30 pcrccnt).
13
132 l i thcwc~l l
* Ohservotron w w l l
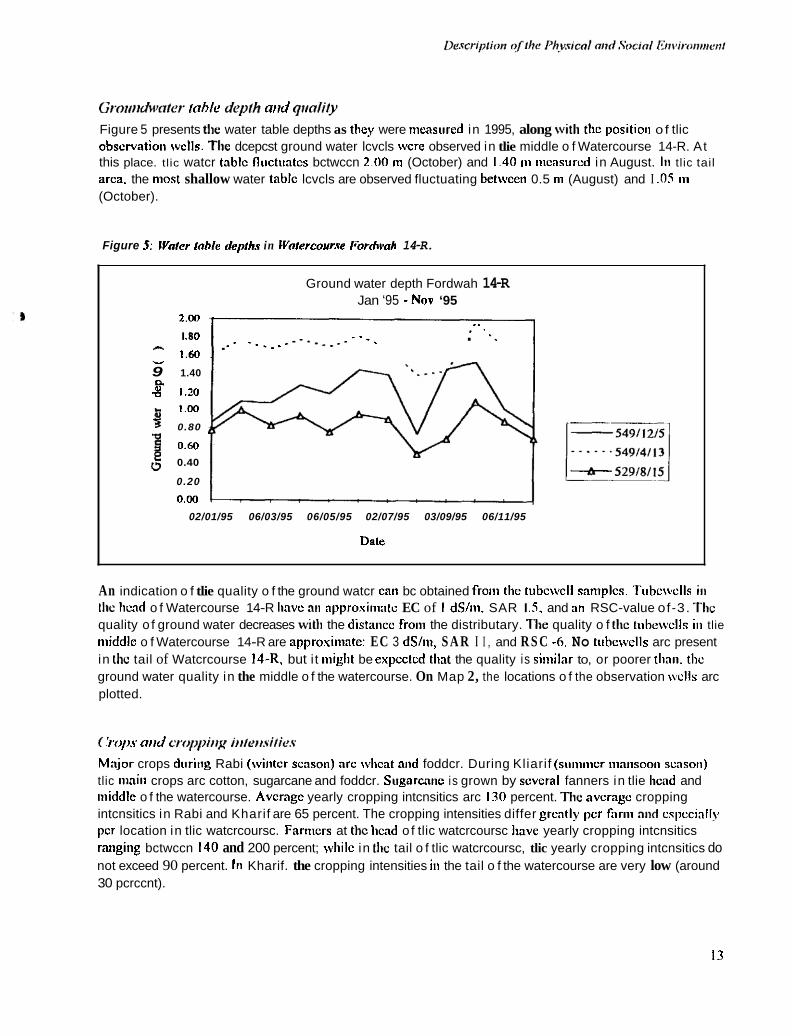
MO/J 3: ( 'oncrl wotcr disirihlriion in Wofercortrse F'ordwoli 14-R
14
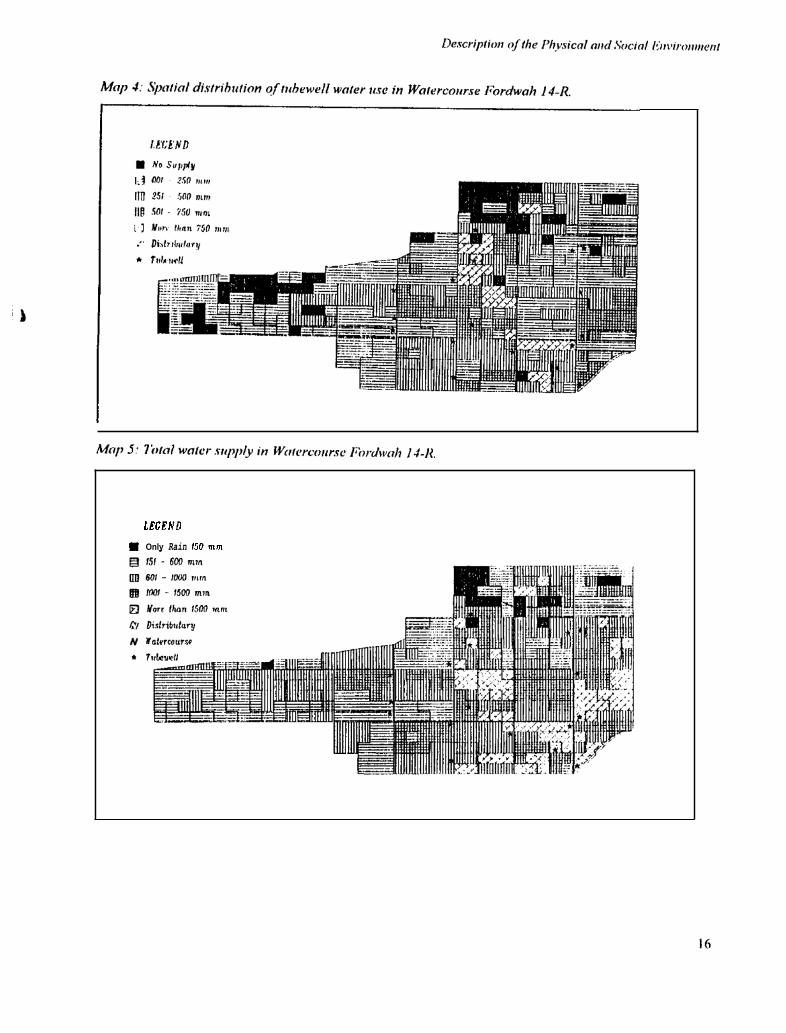
('arid ~ i~a ier s i ipp ly mid di,.r./rihuiiori A study carried out by IlMl in 1996 sliowcd that f'irnicrs locatcd at the tail o f the watercourse Iiavc rcccivcd a lower canal water supply during Kliarif 1994 (Map 3). Ilowcver, tlicrc is a large spatial variability in tlic tail arca. Tlic highest canal water supplies can be observed in tlic licad o f tlic watercourse (Asif aiid Asliinf. 1996). In this arca, the higliest cropping intensities can be observed.
fiihewell rise arid c ] i i d i / j ~
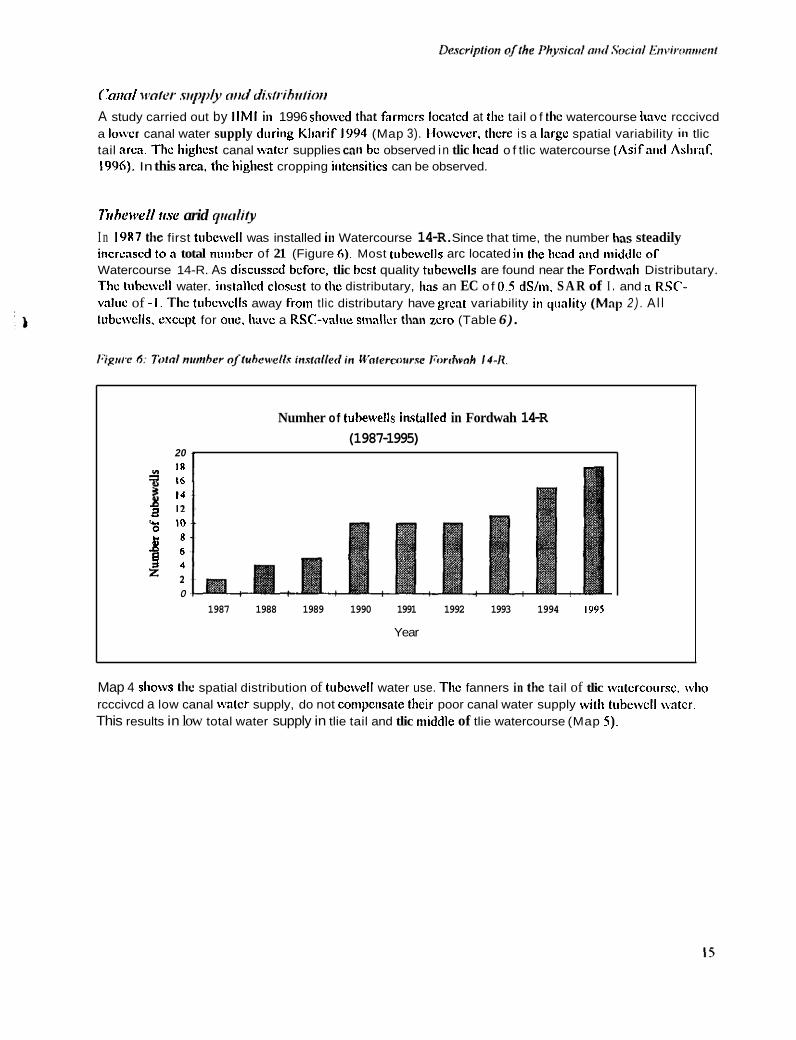
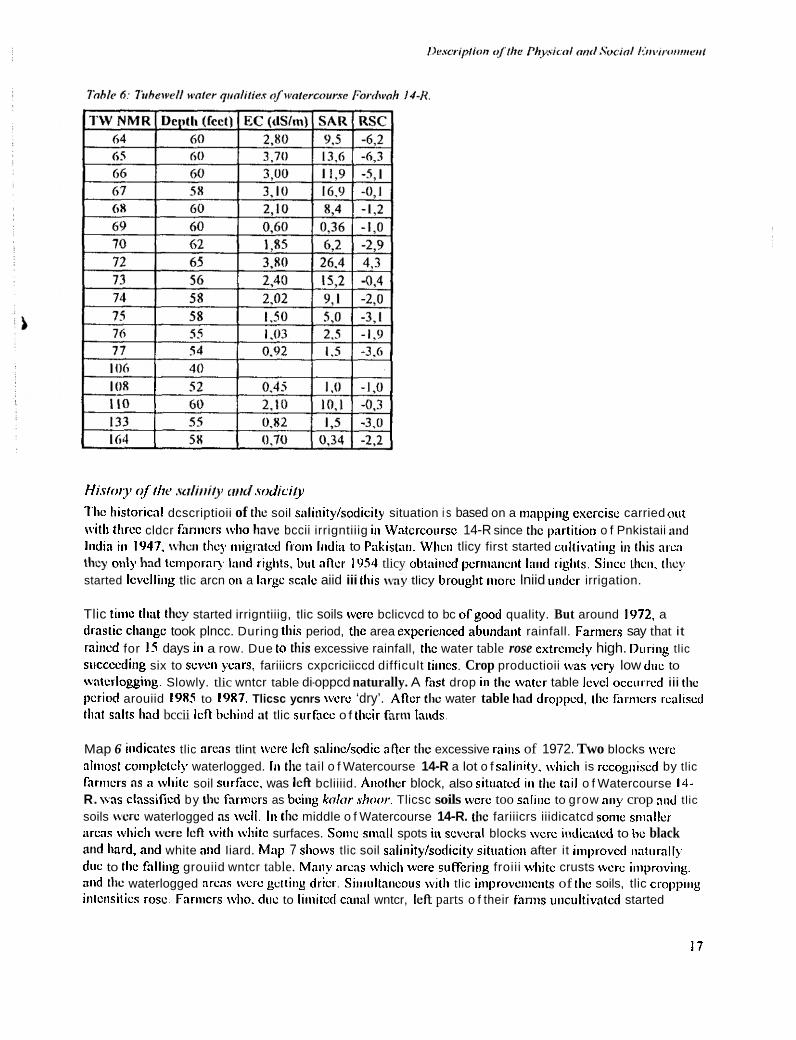
I n 1987 the first tubcwell was installed in Watercourse 14-R. Since that time, the number has steadily increased ton total nunibcr of 21 (Figure 6) . Most tubcwclls arc located iii the lrcnd and niiddlc o f Watercourse 14-R. As discusscd before, tlic best quality tubcwclls are found near the Fordwnh Distributary. Thc tubcwcll water. installed closest to tlie distributary, lias an EC o f 0.5 dS/in. S A R of I . and a RSC- value of - 1 . The tubewells away from tlic distributary have grcat variability iii quality (M~IJ 2 ) . Al l tubcwclls. except for one. hove a RSC-value sniallcr than zero (Table 6) .
Numher of tuhewells inslnlled in Fordwah 14-R (1987- 1995)
20 1
I8 16 3 14
2 l2
i 'i 2 2
0 1987 1988 1989 1990 1991 1992 1993 1994 IY95
Year
Map 4 shows the spatial distribution of tubcwcll water use. The fanners in the tail of tlic wntcrcoursc. \vho rcccivcd a low canal water supply, do not compciisate tlicir poor canal water supply with tubewcll watcr. This results in low total water supply in tlie tail and tlic niiddle of tlie watercourse (Map 5 ) .
LEGEND
m Only Rain I50 m m
His/ory of’//ie ,vdiui/y turd sodicily
Tlic Iiistoricnl dcscriptioii of the soil salinity/sodicity situation i s based on a iiiappiiig exercise carried out with tlirec cldcr fnriiicrs wlio have bccii irrigntiiig iii Wntcrcoursc 14-R since the partition o f Pnkistaii a i d liidia iii IY47. \vIicii thcy iiiigrntcd froiii liidin to Pnkistaii. Wlicii tlicy first started ciiltivaliiig ill this nrui t h y only had t c i i i p o r q lniid riglits. but aRcr 19.54 tlicy obtniiicd pcriiiaiiciit land riglits. Siiicc il ici i. they started lcvelliiig tlic arcn oii a Inrgc scale aiid iii tliis way tlicy brought iiiorc lniid under irrigation.
Tlic tiiiic that they started irrigntiiig, tlic soils worc bclicvcd to bc ofgood quality. But around 1972. a drastic cliaiigc took plncc. During tliis period, tlie area expcrienced abundaiit rainfall. Fariiiers say that it raiiicd for I S days iii a row. Due to this excessive rainfall, thc water table rose extremely high. During tlic siiccccdiag six to scvcii years, fariiicrs cxpcriciiccd difficult tiiiics. Crop productioii \vns very low due to watorloggiiig. Slowly. tlic wntcr table di-oppcd naturally. A fist drop iii the water table lcvcl occtirrcd iii (lie period arouiid 19x5 to 19x7. Tlicsc ycnrs wcrc ‘dry’. Ancr the water table had droppcd, the fai-mcrs rcaliscd tlint salts lind bccii IcR bcliiiid at tlic surface o f tlicir farm laiids.
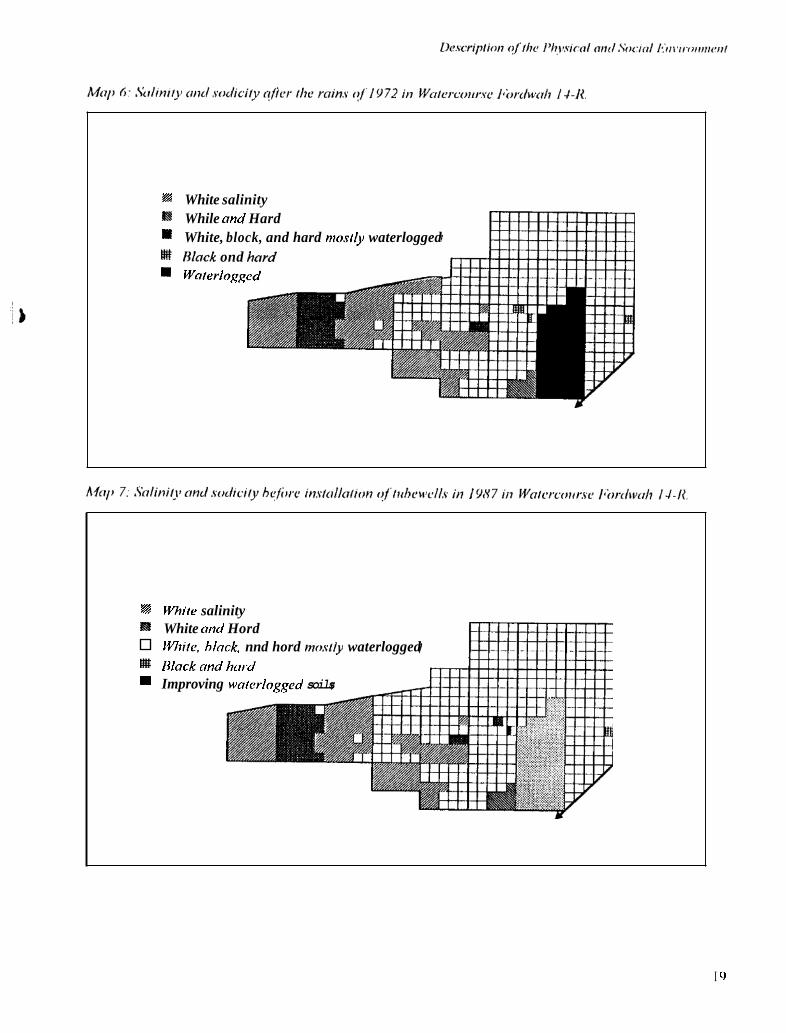
Map 6 iiidicntes tlic nrcns tlint wcrc IcR saliidsodic aRcr the excessive rains of 1972. Two blocks wcrc nliiiost coiiiplctcly waterlogged. 111 the tail o f Watercourse 14-R a lot o f snliiiity, wliicli is rccogiiiscd by tlic fnriiicrs as a wliitc soil sur fkc. was left bcliiiid. Anotlicr block, also situated iii the tail o f Watercourse IJ- R. \vns classificd by tho farmcrs as bciiig kolor shoor. Tlicsc soils wcrc too saliiic to grow niiy crop and tlic soils were waterlogged as \vcII. 111 the middle o f Watercourse 14-R. the fariiicrs iiidicatcd soiiic siiiallcr arcns wliicli were left \villi wliitc surfaces. Soiiic small spots in scvcral blocks wcrc iiidicatcd to bc black and hard, and white aiid Iiard. Map 7 sliows tlic soil saliiiity/sodicity situatioii after it improvcd iinturally due to tlw falliiig grouiid wntcr table. Mniiy arcns wliich were suffcriiig froiii white crusts wcrc iiiiproviiig. xiid the waterlogged nrcns w r c getting drier. Siiiiultniicous with tlic iiiiprovciiiciits of tlie soils, tlic croppiiig iiilciisitics rose. Fariiicrs who. duc to liiiiitcd cniinl wntcr, left parts o f their fariiis uiicultivatcd started
17
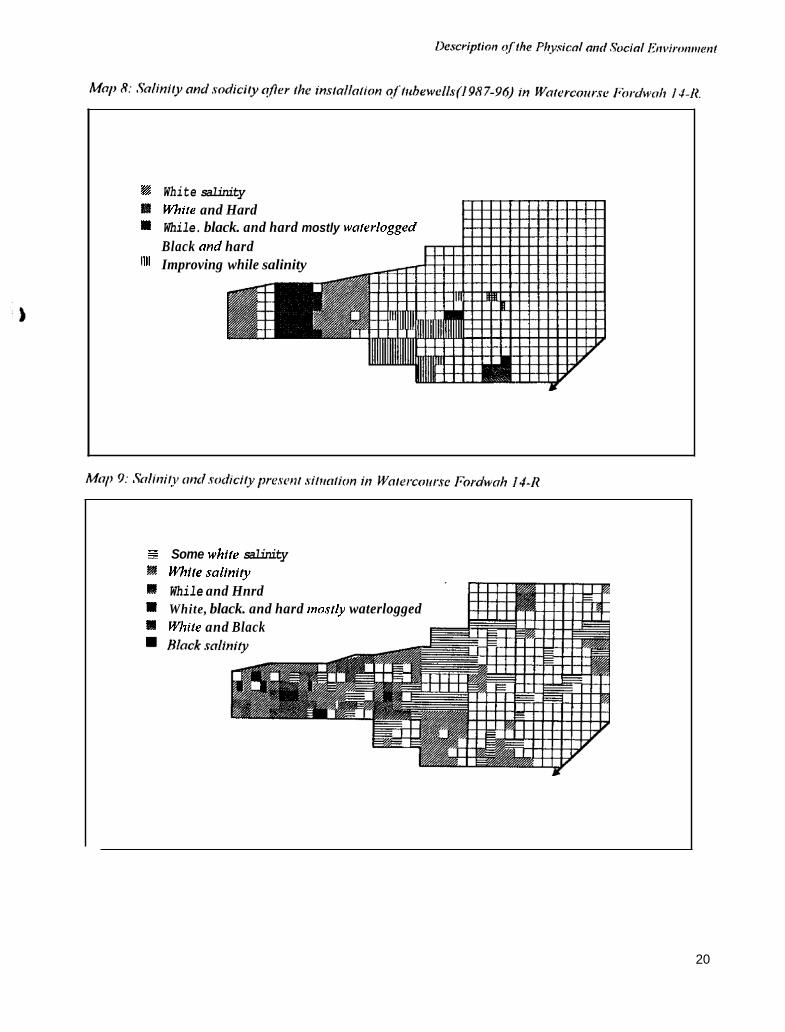
iiistnlliiig tulicwclls. 111 I 9 X X . tl ic first tubcwcll \vas iiist:illcd and opcrntcd iii this wntcrcoursc. Up t i l l iiow. fnriiiers are still iiistaliiiig tubewclls. In 199s. thrcc iicw tubcwclls were iiistallcd. liiitially. tlic iiistnllatioii o f iicw tubcwclls gnvc n fiirthcr rcductioii iii the snliiiity/sodicity problems. aiid a iiinjor reduction iii tlic waterlogging problciiis was brought about near the h a d o f Watcrcourse 14-R. Tlic cliaegcs that took place arc iiidicntcd iii Mop 8 . In tlic tail-ciid blocks. iin iiinjor cliniigcs linvc tiikcii pliicc. Siiicc tlic i i ist: i l l i i t iuii ol‘ the tubcwells, only the soils that wcrc said to linve white surfaces iiiiprovcd. The physical clinractcl-istics of tlic otlicr types of saliiic soils did not cliniigc iiiiicli.
I’rescr~f s d i n i r y tnrd .vodici/y .sicrills
Two cniiscs for tlic prcsciit snliiiity atid sodicity caii bc idciitificd: I) snliiiisntiaii-sodificatioii due to the i isc of poor quality tiibc\\’cll water. cspccinlly iii tlic iiiiddlc o f the watcrcoursc: niid 2) snliiiisntioii-~(idificntinii due to capillary rise from high saline-sodic groiiiid water tablcs, cspccinlly in tlic tail of llic watcrcoursc. Due to the saline iinture of the grouiidwater iii the area, soil dcgrndntioii due to sodificotioii is iiot n iiicijor coiiccrii. Map 9 shows tlic presctit saliiiity/sodicity situntioii according to famicrs’ perceptions. Tlic iiinp sIio\vs iii detail all kil las which arc affected by a certain type o f snliiiitylsodicity. It slioiild be stressed tlint the n~np is in coiignicncc with fnriiicrs’ cspcriciiccs iii ciiltivatiiig tlicsc soils.
I,irr711 clltlr.o~/L’l~i.~l~c,s
Tlic two iiin.ior groups o f fnriiicrs rcprcsciitcd iii Watercourse 14-R arc: I) Fnriircrs with a rntlicr siiinll lntal operated area (average 4.S ha), low lcvcl of capital, adequate aiid rclinblc wntcr supply. mid high pcrcciitagc of total operated nrca uiidcr sugarcane: aiid 2) Fnriiicrs with large faiiiilics, a lnrgc numbcr of fninily incnibcrs workiiig outside the fariii, iiindcqiintc caiinl watcr supply, low purclinsc o f tubc\vcll ivntci-, low cropping intensities, aiid high pcrcciitnge of salinity affected fields. Tlicse two fnrtii groups arc located iii tlic liead aiid iii tlic iiiiddldtail o f tlic watcrcoursc, rcspcctivcly.
Due to a good caiinl water supply niid suffciciit drniiingc, fnriiicrs bcloilgiiig to tlic first group do iiot liar)c salinity problems. Fnriiicrs bcloiigiiig to the second group linvc large salinity problciiis. Due to tlic Ion, cropping iiitciisitics and high grouiid wntcr tablcs. many plots are liiglily saliiic-sodic. Fariiicrs wlio receive iiiodcrntc cniinl water siipply niid have to coiiipciisntc for n lack of cniinl water with tubc\vcll wntcr Iiavc salinity-sodicity problciiis crcntcd by the iisc o f low quality tiibewcll water. Mniiy of those fnrmcrs arc tciiaiits. \vIicrc Inliour mid crcdit. besides water. arc tlic iiixjor F:iI-iii coiistrniiits. scvcrcly rcduciiig IIic possibilities to cope with siiliiiity niid sodicity I>rohlciiis.
@ White salinity &$ While ond Hard I White, block, and hard ntosily waterlogged i#t Mack ond hard
Woter1og:rd
@ White salinity E3 White ond Hord
Wiilc. hlnck. nnd hord mn~tly waterlogged @ Hlnck ond h w d
Improving worcrloggcd soils
I 9
I White salinity White and Hard
II While. black. and hard mostly wo/rrlogged Black and hard
'111 Improving while salinity
I Some white salinity White snlinify While and Hnrd White, black. and hard mostly waterlogged W i l e and Black
20
Watercourse Fordwah 130-R
Soil.\ Map I 0 presents the soil map for Watercourse Fordwali 130-R. The watcrcoiirse coiiiniand i s located in tlic Rasulpur terrace. comprising soils which dcvclopcd in subreccnt river alluvium mixed with aeolian deposits froin the Cholistan Descrt. The different physiographic units o f this land form identified in Watcrcorlrsc 130-R are level plains, levelled levees, and nearly level to very gently and gently undulating levees. Only 4.5 percent o f tlie coiiiniand area is covered by level plains. The Harunabad soil scrics liave devclopcd on the slightly raised part of this unit. The soils are nicdinm textured, well drained, and are nioderafcly pcrnieablc. Sixty t h e pcrcciit o f the comniand area i s covered by levelled levees. The loaniy soils (Rasulpiir) cover sliglitly more than 50 percent of this unit. The other half i s occupied by the niodcrately coarse tcsfiircd Jliang soil series. Tlic Rasulpiir soil series are sonicwhat excessively drained and liavc a iiioderatc rapid to rapid pcrnieability. Tlic Jhang scrics are cxccssivcly draincd mid have a rapid pcl-nicability. Thc rciii;iiiiiiig 30 pcrccnt in this comniand area is covered by nearly lcvcllcd gently inidulating Icvccs. Thirty percull dcvclopcd on iiiorc loamy soils and are tlicrcforc classified as belonging to tlic Rasilpur soil scrics. Tl ic remaining area i s covered by Jliang soil series. I t should be noted that 62 percent of the soils wcrc identified to have a saline-sodic crust, 27 percent a saline-sodic profile, and only I I percent of the soils in this watercourse do not liave any saline-sodic properties.
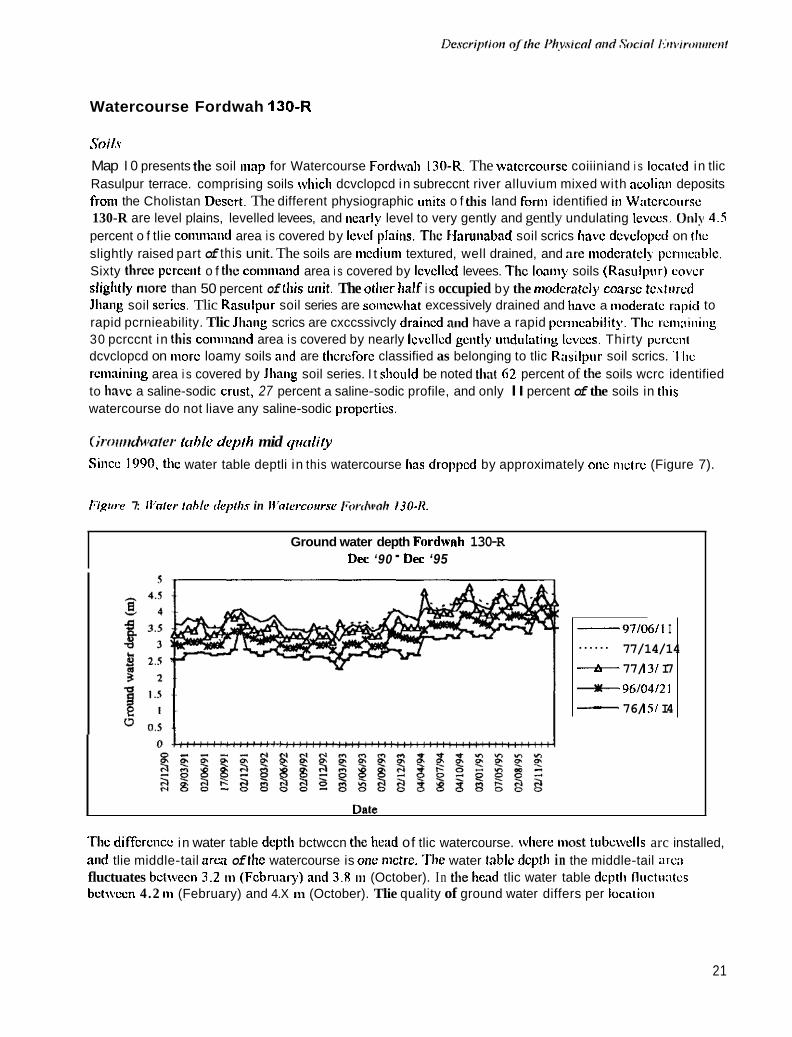
(;rorirrdunler ttihle deph mid qirrrlity Since 1990, tl~c water table deptli in this watercourse lias droppcd by approximately one nictrc (Figure 7).
F i p w 7: Il‘nler mhlo dopths in Il’niercoursc I%rdwoIi 130-It.
Ground water depth Fnrdwah 130-R DW ‘90 - DW ‘95
-97/06/1 I 77/14/14
---b 77/ I3/ I7 + 96/04/2 I
76/ 1.51 I4
......
- ~
Tlic diffcrcncc in water table deptli bctwccn the head of tlic watercourse. wlicre most tubcwclls arc installed, arid tlie middle-tail area of the watercourse is one metre. Tlie water table dcptli in the middle-tail arca fluctuates bctwecn 3.2 111 (Fcbmniy) and 3.8 in (October). In the liead tlic water table dcptli fluctintcs bctivccn 4.2 111 (February) and 4.X 111 (October). Tlie quality of ground water differs per locntioii
21
3
' P
.
Mop I I: I,oco/!olr ofohsrrvo/ion wells ond cirhewel1.v in Wo/crcouI:w IGrdwoh 130-I?.
well
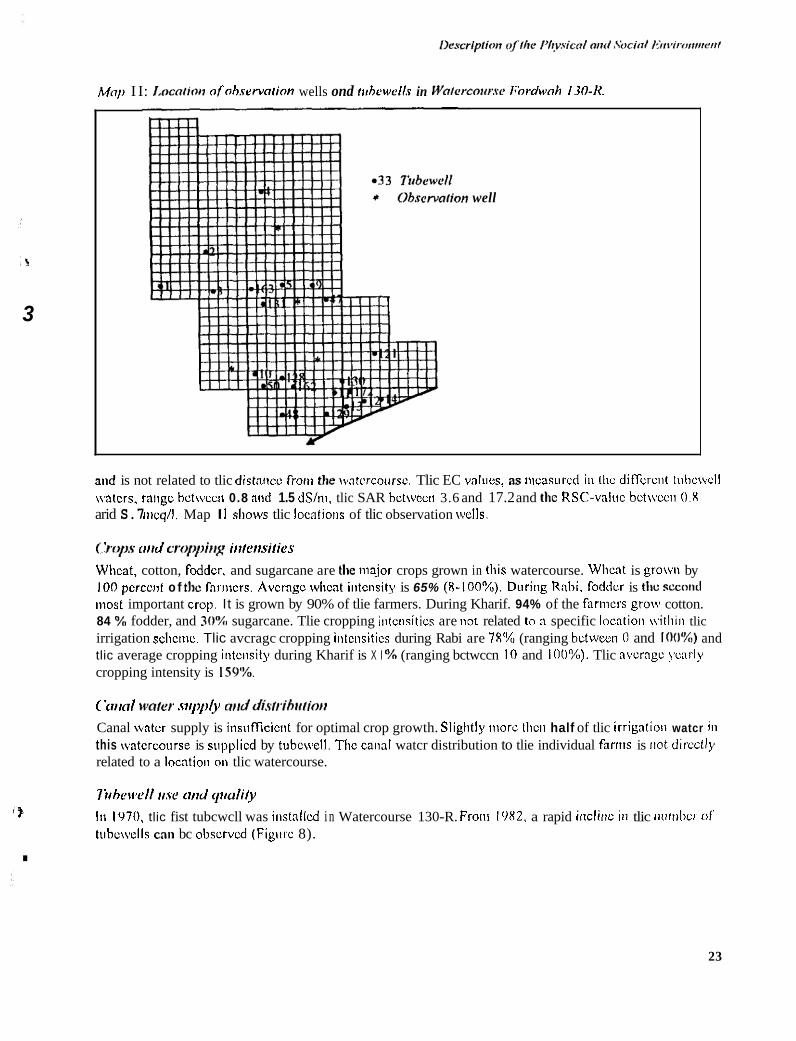
aiid is not related to tlic distacicc froin the \vatcrcoursc. Tlic EC valucs, as tncasurcd iii tlic different tubcwcll watcrs, range bctwvccii 0.8 aiid 1.5 dS/ni, tlic SAR bctwecii 3.6 and 17.2 and the RSC-valuc bctwccli 0 . X arid S.7 nicq/l. Map I 1 shows tlic Iocatioiis of tlic observation \vclls.
(zO/l,Y trrrd C r o p p i l ~ ~ irllerrsilies
Wheat, cotton, foddcr, and sugarcane are the major crops grown in tliis watercourse. Wlicat is grown by 100 pcrcciit o f the fnruicrs. Avcragc wlicat intcnsity is 65% (8-100%). Duriiig Rihi. fodder is the L C C O I ~ ~
most important crop It is grown by 90% of tlie farmers. During Kharif. 94% of the farmcrs grow cotton. 84 "A, fodder, and 30'%, sugarcane. Tlie cropping intensities are not related ton specific locntioii witliiii tlic irrigation sclicnie. Tlic avcragc cropping iiitciisitics during Rabi are 78% (ranging between 0 and IOO'%~) and tlic average cropping intensity during Kharif is X I YO (ranging bctwccn 10 and IOO'X~). Tlic average yearly cropping intensity is ISO'%>.
C i r r r t r l u~oter .supply nrrddislrihtr/iotr Canal watcr supply is insufficicnt for optimal crop growth. Slightly iiiorc tlicn half of tlic irrigatioii watcr i i i
this watcrcourse is supplicd by tubcwell. The canal watcr distribution to tlie individual farms is not directly related to a locatioii on tlic watercourse.
7iihcivcll rise tirid qiicrlify 111 1970, tlic fist tubcwcll was iiistallcd i n Watercourse 130-R. From 19x2, a rapid iriclitic iii tlic twtibcr 0 1 tubcwclls can bc observed (Figure 8).
23
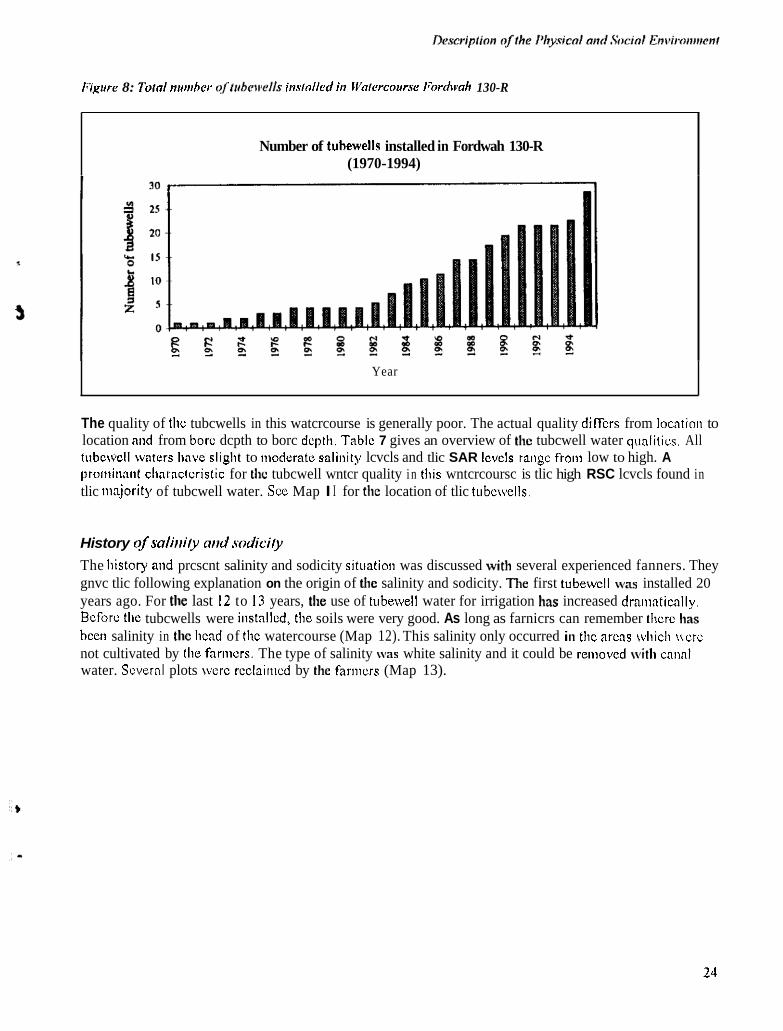
Figurc 8: Torn1 nuinher of I i ihe~id ls inslnllcd in IVolercourse I‘ordvnh 130-R
Number of tuhewells installed in Fordwah 130-R (1970-1994)
Year
The quality of the tubcwells in this watcrcourse is generally poor. The actual quality diffcrs from locatioti to location atid from borc dcpth to borc dcptli. Tablc 7 gives an overview of the tubcwell water qualitias. All tubcwcll waters linve slight to moderate salinity lcvcls and tlic SAR lcvels range from low to high. A proniinniit clinrnctcristic for the tubcwell wntcr quality i n this wntcrcoursc is tlic high RSC lcvcls found in tlic majority of tubcwell water. Sce Map I I for the location of tlic tubcwells.
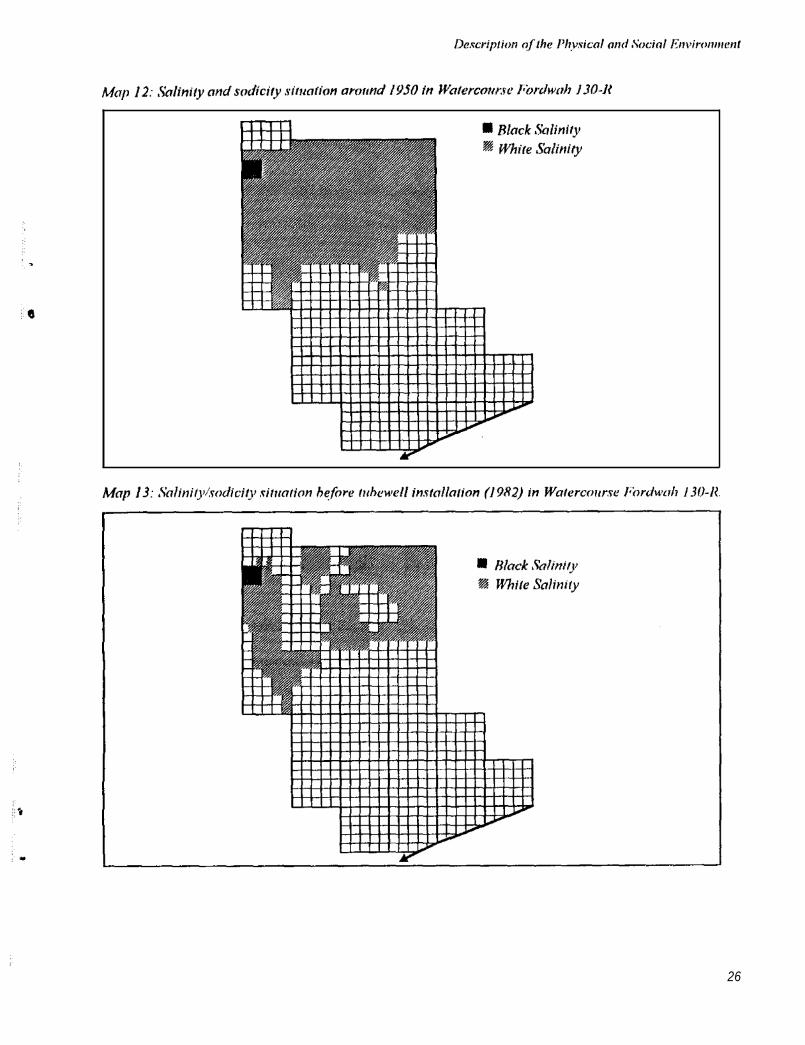
History of salirriy orid sodici/y The liistory and prcscnt salinity and sodicity situatioii was discussed with several experienced fanners. They gnvc tlic following explanation on the origin of the salinity and sodicity. The first tubewcll was installed 20 years ago. For the last 12 to 13 years, the use of tubewell water for irrigation has increased draniatically. Before tlie tubcwells were instnllcd, the soils were very good. As long as farnicrs can remember thcrc has bccn salinity in the hcad of thc watercourse (Map 12). This salinity only occurred i n thc arcas wliicli w r c not cultivated by the farnicrs. The type of salinity was white salinity and it could be removed with cnnnl water. Scveral plots wcrc rcclaitiicd by the farmers (Map 13).
24
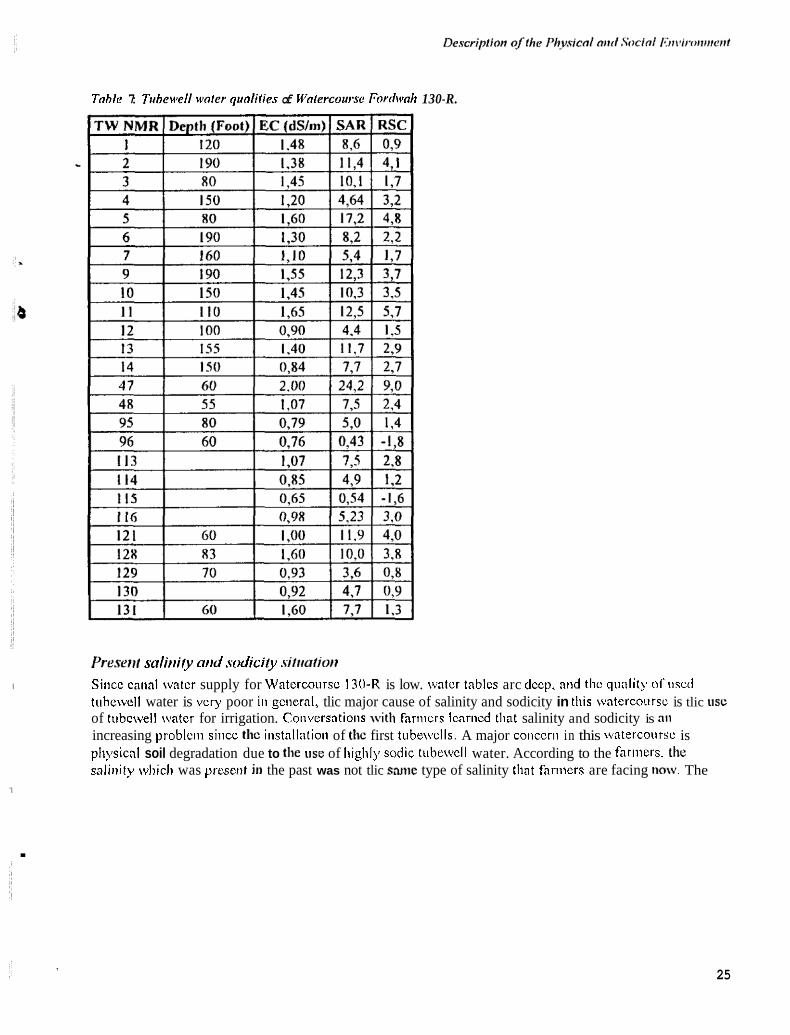
Tnblc 7: Tirbcn~ell ~volcr quolilies of Wofercoursc ForforAvoh 130-R.
P ~ L ' s ~ I ~ I snliriity nrrd sodicily . s i / i id io t i
I Siiicc caiial watcr supply for Watcrcoursc 130-R is low. watcr tablcs arc dccp. and thc quality of used tubewell water is very poor iii gciieral, tlic major cause of salinity and sodicity in this watercoursc is tlic use of tubcwell water for irrigation. Conversations wit11 farnicrs Icariicd that salinity and sodicity is a11
increasing problciii since the installatioll of the first tubewells. A major coiiccrii in this watercoiirsc is physical soil degradation due to the w e of Iiighly sodic tiibewcll water. According to the fariiiers. the saliiiity wliicli was preset11 hi the past was not tlic same type of salinity that fanners are facing now The
' I
.
25
26
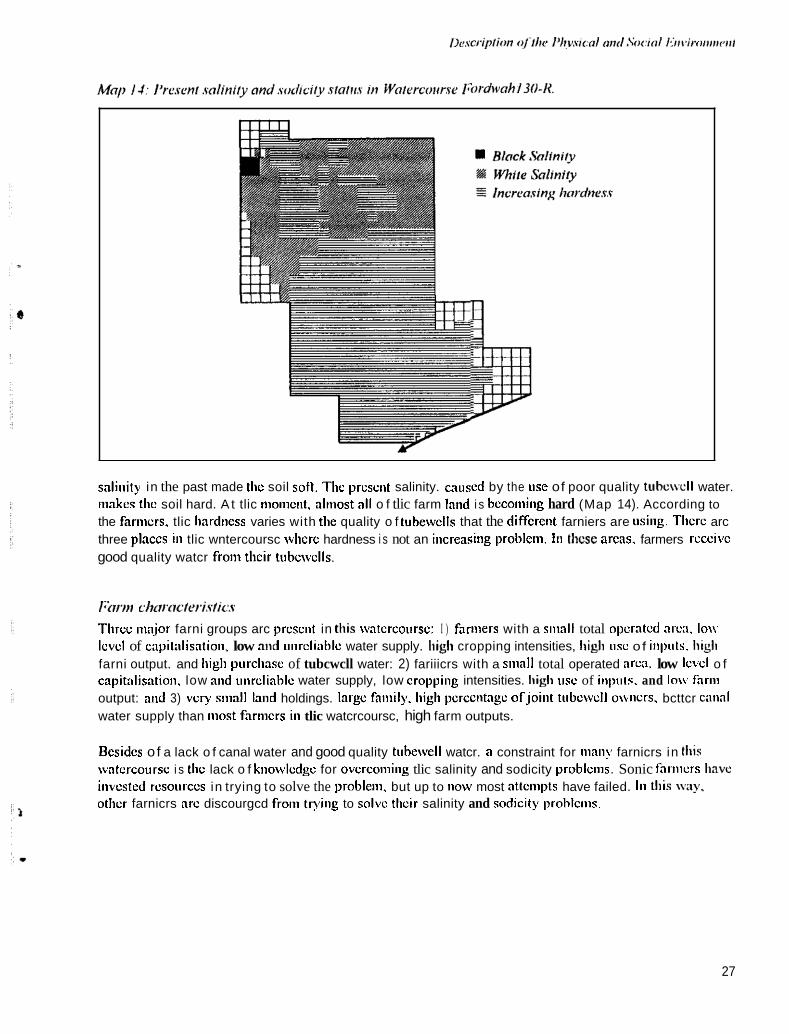
salitiity in the past made the soil soR. The present salinity. caused by the use of poor quality tubc\vcll water. niakcs the soil hard. A t tlic nionicnt, almost a11 o f tlic farm land i s bccoming hard (Map 14). According to the farmers. tlic liardness varies with the quality o f tubewclls that the diffcrent farniers are using. Tlicrc arc three placcs iii tlic wntercoursc whcre hardness i s not an increasing problcm. I n t h e arcas. farmers rcccivc good quality watcr froiii thcir tubcwclls.
l%ri>i c l i ~ i i i i c ~ e i , i , ~ ~ i ~ . ~ Tlirec nia.jor farni groups arc present in this watercourse: I ) farniers with a sinall total operated arca. Ion level of c;ipit;ilisation, low and uiircliablc water supply. high cropping intensities, high usc of iiiputs. high farni output. and high purchase of tubcwcll water: 2) fariiicrs with a siiiall total operated arca. low lcvcl o f capitalisation. low and unrcliablc water supply, low cropping intensities. high use of inpuls. and lnw fnrin output: and 3) very siiiall land holdings. large faiiiily. Iiigli pcrccntagc of jo i i i t tubcwcll owcrs . bcttcr cmal water supply than most fariiicrs in tlic watcrcoursc, high farm outputs.
Bcsidcs o f a lack o f canal water and good quality tnbewell watcr. a constraint for ninny farnicrs in this watercourse i s the lack o f knowledge for overcoining tlic salinity and sodicity problcins. Sonic fa!-tilers have invested resources in trying to solve the probleiii. but up to now most attempts have failed. In this nay, other farnicrs arc discourgcd froni ttying to solve their salinity and sodicity prohlcins.
27
Watercourse Azim 11 I - L
Map 15 presents tlic soil map for Watercourse AziinI I I-L. Tlic watercourse coiiipriscs soils \vhicli dcvclopcd in siibrccciit flood plains. The different physiographic units of this land foriii identified in Watercourse 1 I I -L arc lcvcl plains atid basin iiiargiiis. Fifty thrcc percent of the soils in this watcrcowsc have dcvclopcd iii tlic lcvcl plains. The soils scrics in this unit are Sultanpur and Nabipur lonun. Thcsc soils arc nicdiuiii textured. arc wcll drained. and have a moderate permeability. Twenty iiiiic pcrcciit of the plots it1 tlicse soil series l ime a saliiic-alkaline cnist. On the slightly raiscd parts of th i s physiographic unit. the Jliakkar and Grandlira loniii series dcvclopcd. They coiiiprisc 25 percent of tlic coiiiiiiaiid wen. They arc iiicdiuiii tcsturcd. \ d l drained. and arc niodcr:itcly pcriiicablc. 111 tlicsc soil series. genetic salinity :itid sodicity i s prcsciit. At the subrccclit basin margins. the Adilpiir - Jhakkar loan1 series have bccn Iilalipcd. The soils arc iiiosll?, barren and have a gciictic saline-sodic profile. The soils arc tiicdiuiii to iiiodcratcl?. fine Icstiircd. tiiodcratcly ~vcll drained. nild have a iiioderntely slow pcriiicability. V c n slnnll arcas arc covcrcd by Adilpiir lonm and Sodrlia loaiti, \vliich dcvclopcd in basin iiiargilis and covcrcd sand bars. rcspocfivcl!.
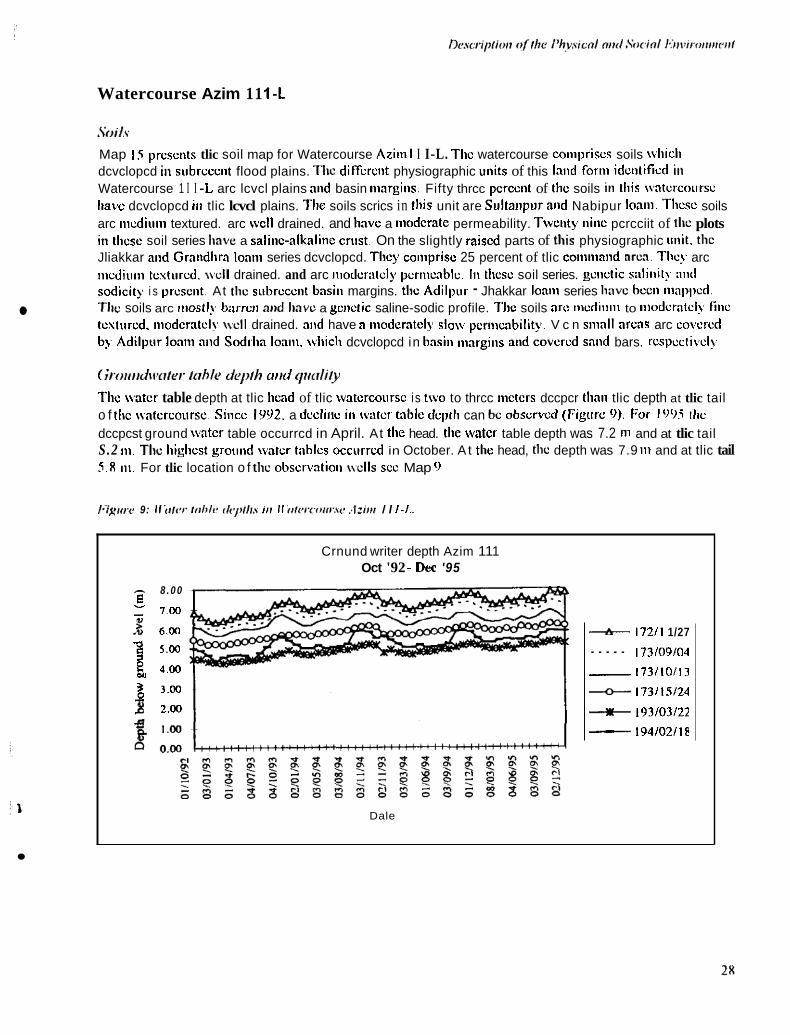
( i~~~rrtrdi~~r/er . / t r h l ~ &p/h to~d c/tr<rli/y The water table depth at tlic head of tlic watcrcoiirsc is two to thrcc meters dccpcr thali tlic depth at tlic tail o f Ilic \vntcrcoursc. Siiicc 1992. a dccliiic in water table dclitli can be obscrwd (Figure 9). For 1WS tlic dccpcst ground watcr table occurrcd in April. At thc head. the watcr table depth was 7.2 111 and at tlic tail S.2 111. The Iiiglicst ground water tnblcs occiirrcd in October. A t the head, the depth was 7.9 111 and at tlic tail 5 . 8 111. For tlic location o f the obscrvatioii wcIIs scc Map 9
PYxiirc 9: ll'u/w t d i l r < / t ~ i / / i s iir II ; ~ t ~ ~ i ~ u ~ i ~ w ,.lziiii I I 1-1..
Crnund writer depth Azim 11 1 Oct '92 - Dec '95 - 8 . 0 0
- 1.00
- $ G . M
e
B 5 . 0 0
v
a g 4 . 0 0
g 3.00
2 2.00
Dale
A 172/1 1/27
I73/09/04 - 173/10/13
+ 173/15/24
+ 193/03/22 194/02/18
.....
-
'125
Tlic best quality groiiiid water i s found at tlic licad of tlie \*atcrcoiirsc (EC: 0.7: SAR: 3: and RSC: -0.7) 'flic niiddlc aiid tail linvc poorcr quality grouiid water, Grouiid water quality differs froni place to place (EC: 0 . X - I .7: SAR: 3 - 8: and RSC: -0.5 - 2.3).
( h p s tirrJ croppiiix iti/cw.si/ies
Major crops grown during Rabi arc wheat and fodder. Wlicat is grown by I00 percent o f the farnicrs. while fodder i s growti by 70 percent o f tlic fariiicrs. Average croppiiig intensity for \\ticat i s 62 percent, Tlic nvcragc croppiiig illtensity for fodder iii the Rnbi scaso~i i s 10 pcrcciit. Tlic iiiaior crops gIo\w dui~ins llic Klinri f scasoii are cotton. rice and fodder. Sixty five percent o f the farnicrs grow cottoll. \v i l l i an a~cragc croppiiig iiitciisity o f S7 pcrcciit (ranging bct\\ccii 30 and 07%). Rice is grown by 70 percent o f a l l fiimicrs. Avcragc cropping intensity o f rice is I7 percent (raliging hctwccn I and 3X%). Fodder in Kl inri f i s gto\\~i bv 65 pcrcent o f tlic farnicrs with ati average croppiiig iiitcnsity o f 26 percent. Average yearly cropping intensities arc 146 percent (90 - 200%). The average cropping intensity during Rabi is 73 percent (37 - 100 %) and during Kl iar i f 73 pcrcciit (20 - l00'X). Cropping iiitciisitics arc tiof related to fhc locatioii t \ i t l l i l i tlic water coiirsc.
3 0
,
‘ 9
( ’tl l l t l l wt11er s l i p p l y turd di.slrilJrilioll
No canal water rcnclics this watcrcoursc. Fartncrs complctcly rcly 011 tubcwcll water supply
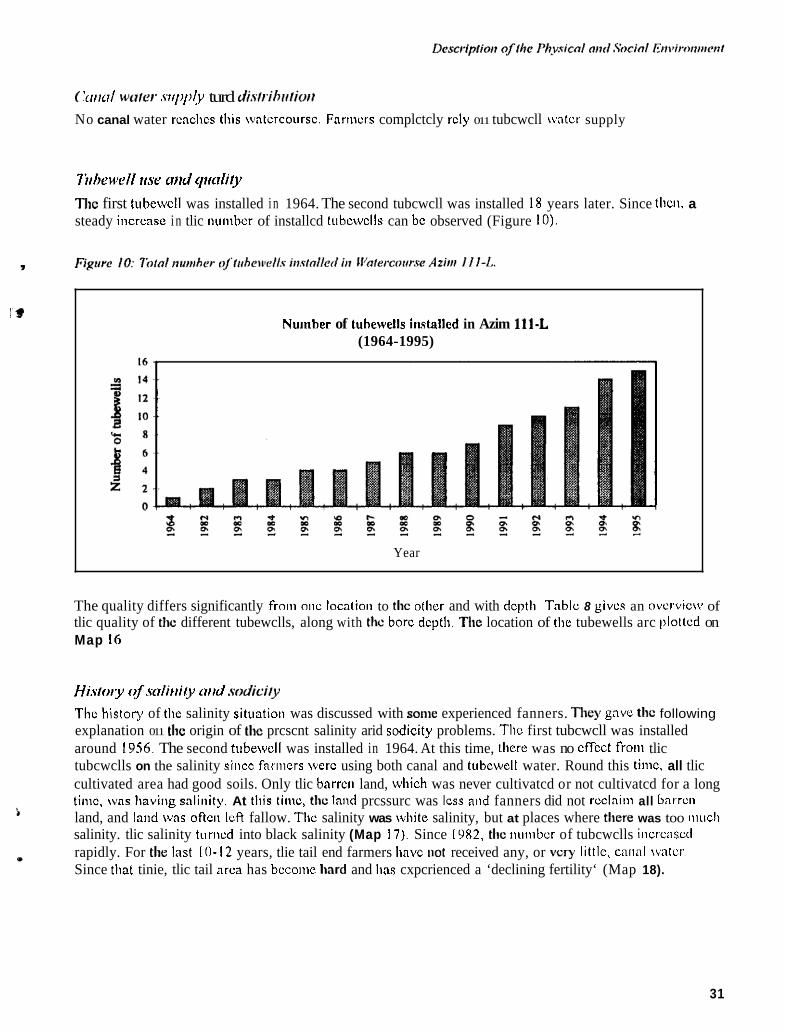
liihewell tise ortd qfiolily The first tiibewcll was installed i n 1964. The second tubcwcll was installed 18 years later. Since tl~cn, a steady incrcase i n tlic niinibcr of installcd tubewclls can be observed (Figure 10).
Numher of luhewells iwlalled in Azim 1114 . (1964-1995)
Year
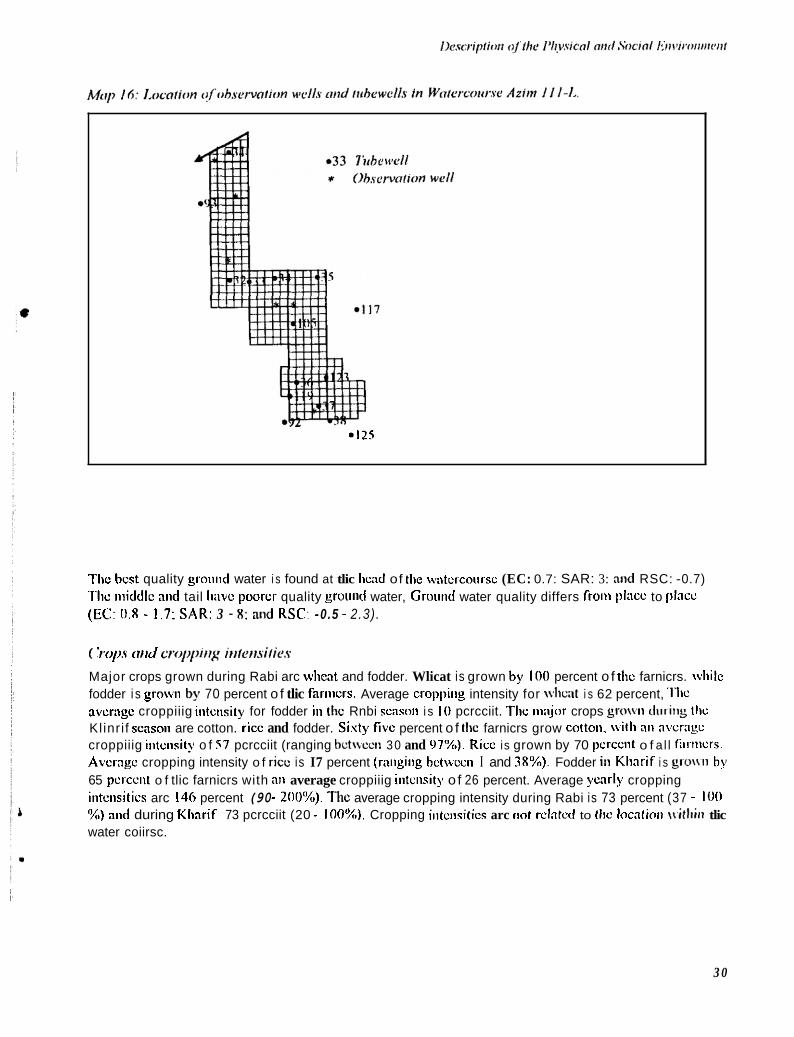
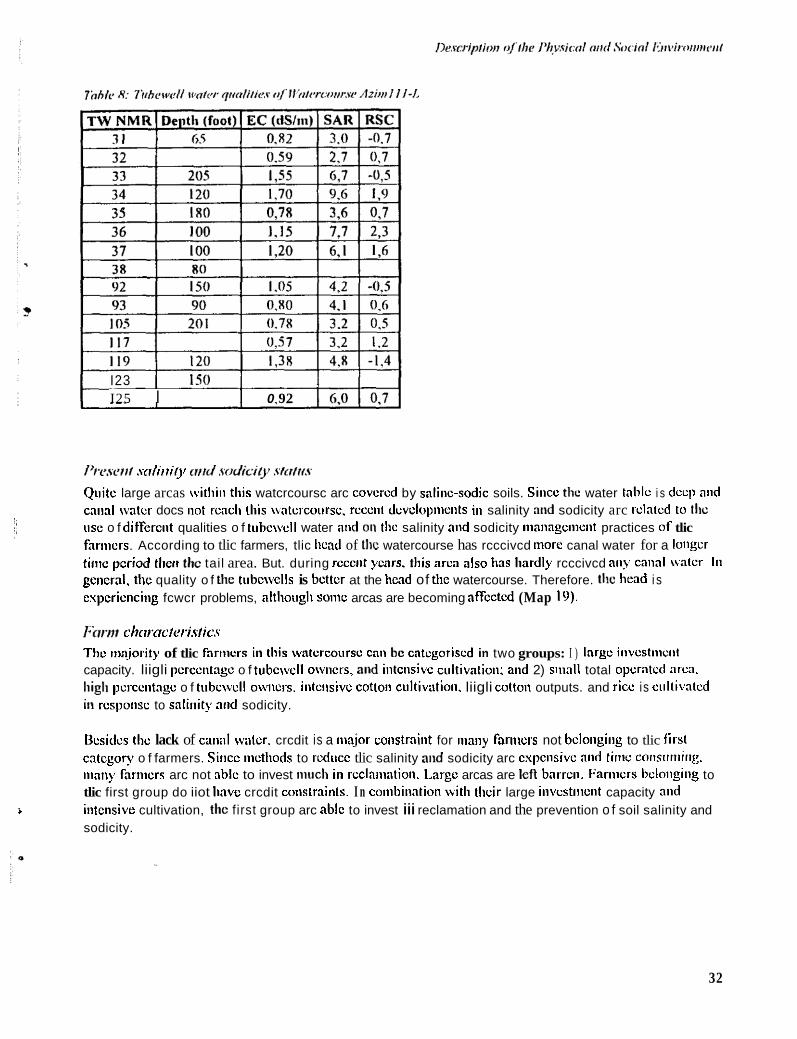
The quality differs significantly from one locatioii to the otlicr and with dcptli Table 8 gives an overview of tlic quality of the different tubewclls, along with the borc dcptli. The location of thc tubewells arc plotkd on Map I6
Hislory c ~ s t r l i r t i g i nrrd ,sodicil)i
Thc histow of the salinity sitiiation was discussed with some experienced fanners. They gave the following explanation 011 the origin of the prcscnt salinity arid sodicity problems. Tl~c first tubcwcll was installed around 19.56. The second tubewcll was installed in 1964. At this time, there was no effect from tlic tubcwclls on the salinity since farnicrs were using both canal and tubewell water. Round this tiinc, all tlic cultivated area had good soils. Only tlic barren land, which was never cultivatcd or not cultivatcd for a long timc, was Iiaving saliiiity. At this tinic, the land prcssurc was lcss and fanners did not rcclnini all barren land, and land was often IcR fallow. Tlic salinity was white salinity, but at places where t h e was too initch salinity. tlic salinity turncd into black salinity (Map 17). Since 1982, the nunibcr of tubcwclls incrc:iscd rapidly. For the last 10-12 years, tlie tail end farmers have not received any, or very littlc, canal watcr. Since that tinie, tlic tail area has become hard and Iias cxpcrienced a ‘declining fertility‘ (Map 18).
31
I23 I I25 I 1 0 92
I’rescri/ strlirrity t d .sodici~~ sfcr/ni.v Quite large arcas within t l i is watcrcoursc arc covered by saliiic-sodic soils. Sincc the water table i s dccp and caiial water docs not rcacli this \\atcrcoursc, recent dcvcloplnents iii salinity atid sodicity arc related 10 the iisc o f different qualities o f tubc\vcll water aiid 011 the salinity and sodicity ~iianagciiicilt practices o f tlic fanners. According to tlic farmers, tlic Iicad of the watercourse has rcccivcd more canal water for a longer tiiiic period tlicir the tail area. But. during rcccnt ymrs, this area also Iias hardly rcccivcd any canal water 111
general. the quality o f the tubcwclls is better at the head of the watercourse. Therefore. the head i s cxpericncing fcwcr problems, altlloiigli soiiic arcas are becoming affcctcd (Map 19).
l~crrrii chcrroc/rris/ics Tlic iii:i.iority of tlic fnriiicrs in t l i is watcrcoiirsc cnii be cntcgoriscd in two groups: I ) large i~ ivcs t~ i ic~ i t capacity. liigli percentage o f tubcwcll owners, slid intclisivc ciiltivatioii; aiid 2) sliiall total operated area. high pcrccntagc o f tubc\vcll owicrs. intc~isivc cottoll cultivatio~~. liigli cotton outputs. and rice is ciiltivatcd in response to saliiiity arid sodicity.
Bcsidus tlic lack of caiial wntcr. crcdit is a iiinjor coiistraiiit for inaiiy fariiicrs not bclongiiig to tlic l i rsl catcgory o f farmers. Siiicc iiictllods to reduce tlic salinity and sodicity arc cxpcnsivc alld tiiitc colisuliltllg. iiiaiiy fanners arc not able to invest 111t1cll iii rccla~iiatioti. Large arcas are left barren. Fanners bcloiigiiig to tlic first group do iiot liavc crcdit coiistraints. I n co i~ ib i~ ia t io~ i with their large iiivcstiiicnt capacity and intensive cultivation, the f irst group arc able to invest iii reclamation and the prevention o f soil salinity and sodicity.
5
32
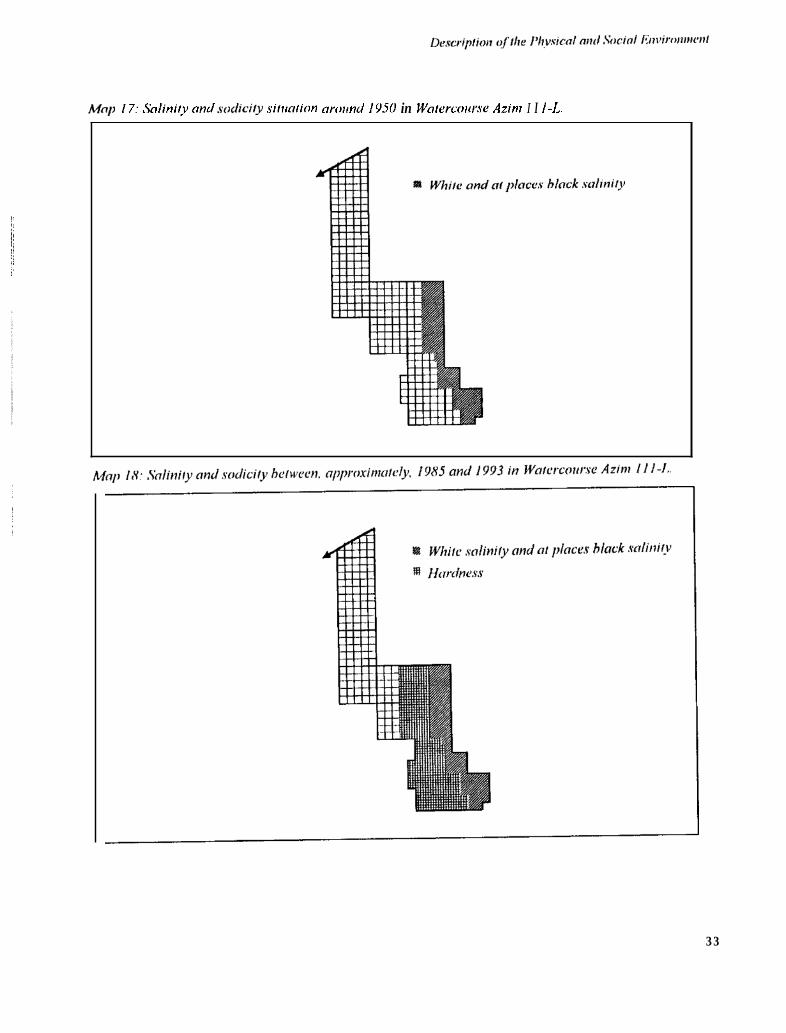
Mop 17: Soliniry ond sod;ciry sirimrion ororind I950 in Worercorrrse Azini I I I-I<.
3 3
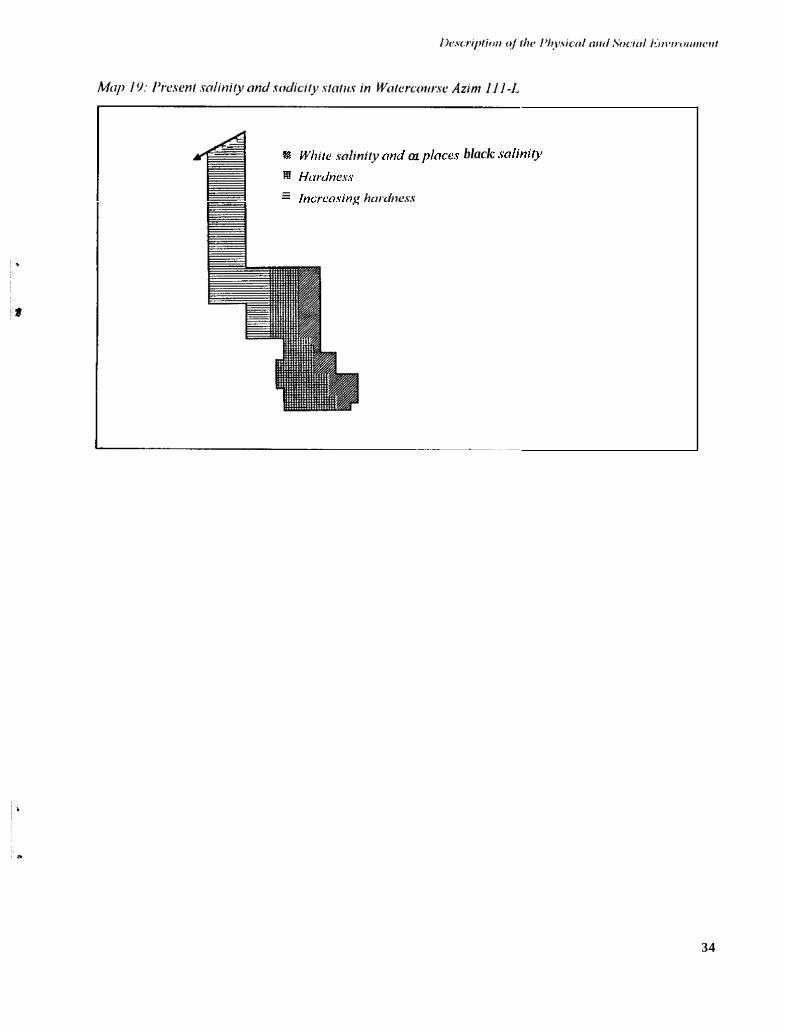
kl Wln1e .snlin/1y nnd 01 ploces m Hirrhcs s = 1ncrco.sin): hirizlne.ss
black : snliniry
34
Watercourse Azim 20-L
Soils Map 20 presciits tlic soil iiiap for Watercourse Aziiii 20-L. The watercourse coniprises soils wliicli dcvclopcd iti subrcccnt flood plains. Thc diffcrcnt physiographic units o f this land foriii idciitificd iii Watercourse 20-L arc level plains. basins, levecs, covered sand bars, and sand bars. Characteristic for this walcrcotirse is tlic large watcrlog&yd area wliicli covers 9 pcrceiit o f the total area. The watcrloggcd area is surrounded by siibrccclit sand bars iii tlic iiortli (Sochra scrics) wliicli cover 22 pcrcciit o f tlic area. a subrcccnt basiii iii tlie south-west (Satgarah series) wliicli cover I 0 percent, and a levelled levee iii the soiitli and soiitli-\vcst (Rasiilpur series) covering 10 percent. Tlic Sultnnpiir subrcceiit Icvcl plain cover 33 percent iii tlic licad of tlic nntcrcourse. The soils roiiiid thc waterlogged area are iiiipcrfcctly to poorly draiiicd. Tlic soils fiirtlier away from this arca are well draiiicd. The soils dcvclopcd oii the subrcceiit lcvcl plains liavc a tiiodcralc to iiiodcratc slow permeability. Tlic otlicr soils liavc a iiiodcratc rapid to rapid pcriiicahility. Most soils directly bouiidiiig tlic watcrloggcd area Iiavc a saline-sodic profile.
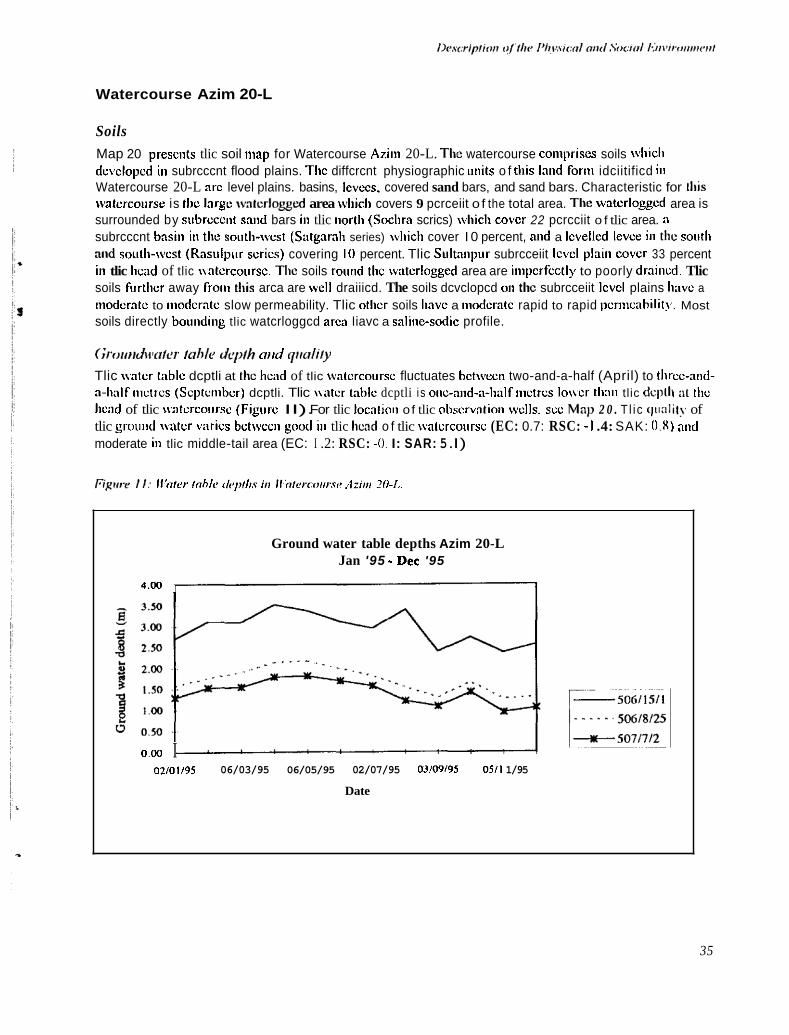
( i r r i~~t~diw/er /nIh deplh orid c p l i / y Tlic water table dcptli at the head of tlic watcrcoiirsc fluctuates bctwccii two-and-a-half (April) to tlircc-and- a-lialf iiictrcs (Scptciiibcr) dcptli. Tlic \\;itcr table dcptli i s oiic-and-a-linlf iiictrcs l o w r t l i m tlic dcpll\ at tlic hcnd of tlic rmtcrcoiirsc (Figiirc I I). For tlic locatioii of tlic observation wells. scc Map 2 0 . Tl ic qii:ilit!. of tlic groiiiid wntcr varics bctwccii good iii tlic head o f tlic watcrcoiirsc (EC: 0.7: RSC: -I .4: SAK: 0 . X ) atid moderate iii tlic middle-tail area (EC: I .2: RSC: -0. I: SAR: 5. I)
Figfire / I : Il'oler Inhlc dc~pf1f.c h 1tirlevcoiir.w Aziiii 20-I,.
Ground water table depths Azim 20-L Jan '95 - Dec '95
4.00 I
0.00 I 02101195 06/03/95 06/05/95 02/07/95 03/09/95 05/1 1/95
Date
35
*33 Iirbewcll * Ohservolion well
I
Crops cirrd croppiiig iit/eri.sifics
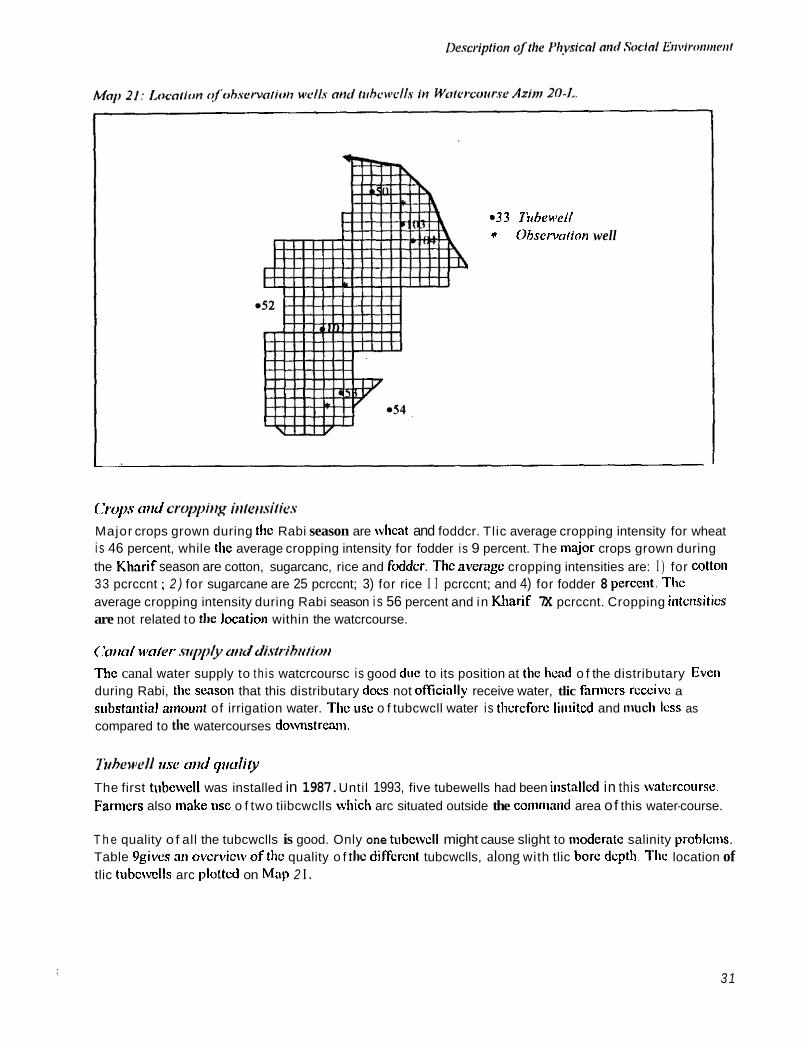
Major crops grown during the Rabi season are wheat and foddcr. Tlic average cropping intensity for wheat i s 46 percent, while the average cropping intensity for fodder is 9 percent. The major crops grown during the Kl iar i f season are cotton, sugarcanc, rice and foddcr. Thc averagc cropping intensities are: I ) for cotton 33 pcrccnt : 2 ) for sugarcane are 25 pcrccnt; 3) for rice I I pcrccnt; and 4) for fodder 8 perccnt. Thc average cropping intensity during Rabi season i s 56 percent and in Kharif 7X pcrccnt. Cropping intensities are not related to the lowtion within the watcrcourse.
( i i i r t r l woiu .wi)p(y mid di.vfribit/iot> The canal water supply to th is watcrcoursc is good due to its position at the head o f the distributary Even during Rabi, thc season that this distributary docs not officially receive water, tlic faniicrs rcceivc a substantial amount of irrigation water. Tlic use o f tubcwcll water is therefore limited and much Icss as compared to the watercourses downstreani.
7Lheuwll i i ~ e md qriolify The first tubewell was installed in 1987. Until 1993, five tubewells had been installcd in this watcrcourse. Famicrs also nuke use o f two tiibcwclls which arc situated outside the conirriand area of this water-course.
T h e quality o f all the tubcwclls is good. Only one tubcwcll might cause slight to moderate salinity problaiis. Table 9givcs an ovcrvicrvof thc quality o f the diffcrciit tubcwclls, along with tlic bore depth Thc location of tlic tubcwclls arc plotted on Map 2 I .
3 1
Descripfion of fhc Physic01 mid Sociol ~ ~ ~ i ~ ~ i ~ r ~ ~ i ~ n c n f
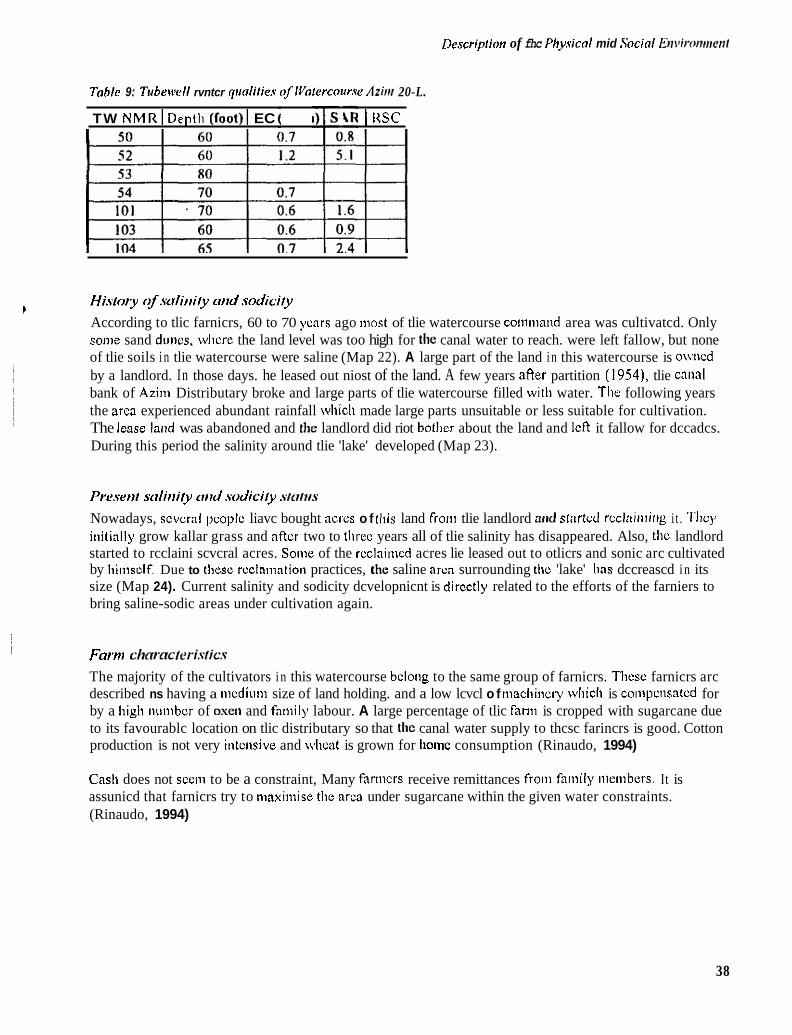
Table 9: Tubeiivll rvntcr qrrnlifics rf1Vnlercourse Azirr~ 20-L.
TW NMRl Depth ( foot) I EC (dSIIn)I SAR 1 llSC
History of soliiiily told sodicily According to tlic farnicrs, 60 to 70 years ago niost of tlie watercourse command area was cultivatcd. Only some sand dunes, wlicre the land level was too high for the canal water to reach. were left fallow, but none of tlie soils i n tlie watercourse were saline (Map 22). A large part of the land i n this watercourse is owned by a landlord. In those days. he leased out niost of the land. A few years after partition (l954), tlie callel bank of Azini Distributary broke and large parts of tlie watercourse filled with water. The following years the arca experienced abundant rainfall which made large parts unsuitable or less suitable for cultivation. The lease laid was abandoned and the landlord did riot bother about the land and left it fallow for dccadcs. During this period the salinity around tlie 'lake' developed (Map 23).
Pwseiir stilirrily trird sodicily .s/t~/tis
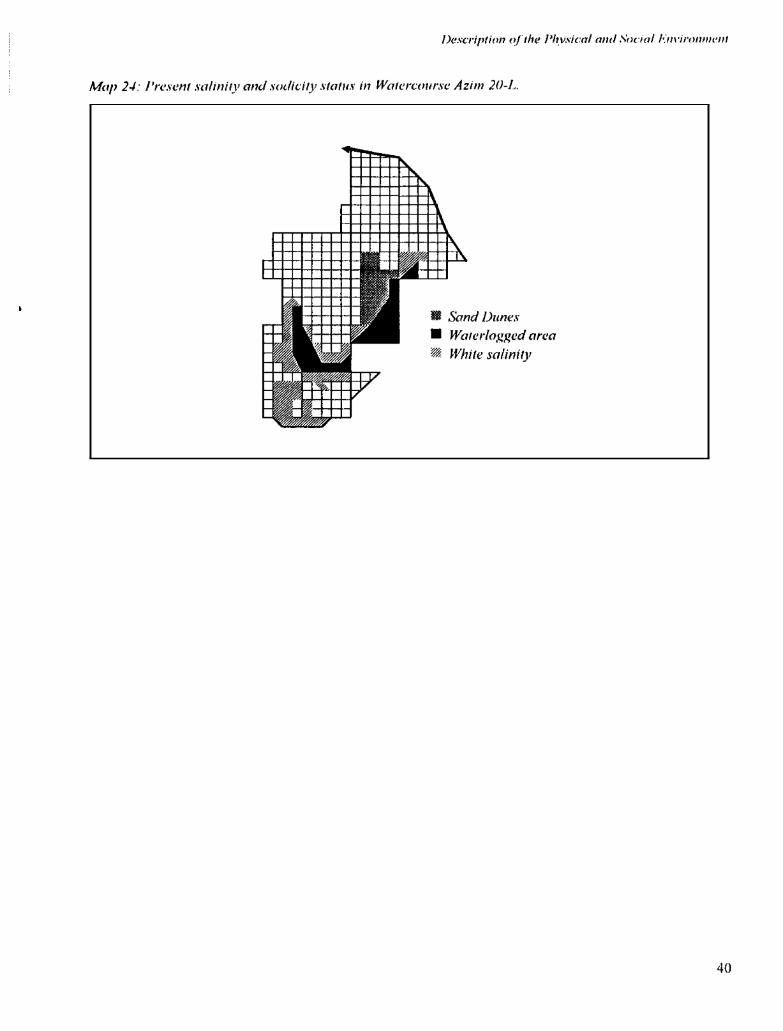
Nowadays, scvcral pcoplc liavc bought acres o f this land front tlie landlord a id started rcclainiing i t . 'l'hcy initially grow kallar grass and after two to three years all of tlie salinity has disappeared. Also, the landlord started to rcclaini scvcral acres. Some of the rcclaiiiied acres lie leased out to otlicrs and sonic arc cultivated by Iiiiiisclf. Due to these reclamatioii practices, the saline area surrounding the 'lake' has dccreascd i n its size (Map 24). Current salinity and sodicity dcvelopnicnt is dircctly related to the efforts of the farniers to bring saline-sodic areas under cultivation again.
Fami chnrnc/eris/ics The majority of the cultivators i n this watercourse belong to the same group of farnicrs. These farnicrs arc described ns having a mcdium size of land holding. and a low lcvcl o f niacliinery wliich is conipcnsatcd for by a high number of oxen and faniily labour. A large percentage of tlic farni is cropped with sugarcane due to its favourablc location on tlic distributary so that the canal water supply to thcsc farincrs is good. Cotton production is not very intcnsive and wheat is grown for home consumption (Rinaudo, 1994)
Cash does not sceni to be a constraint, Many fani1crs receive remittances froin faniily nienibers. It is assunicd that farnicrs try to niaxiniise the area under sugarcane within the given water constraints. (Rinaudo, 1994)
38
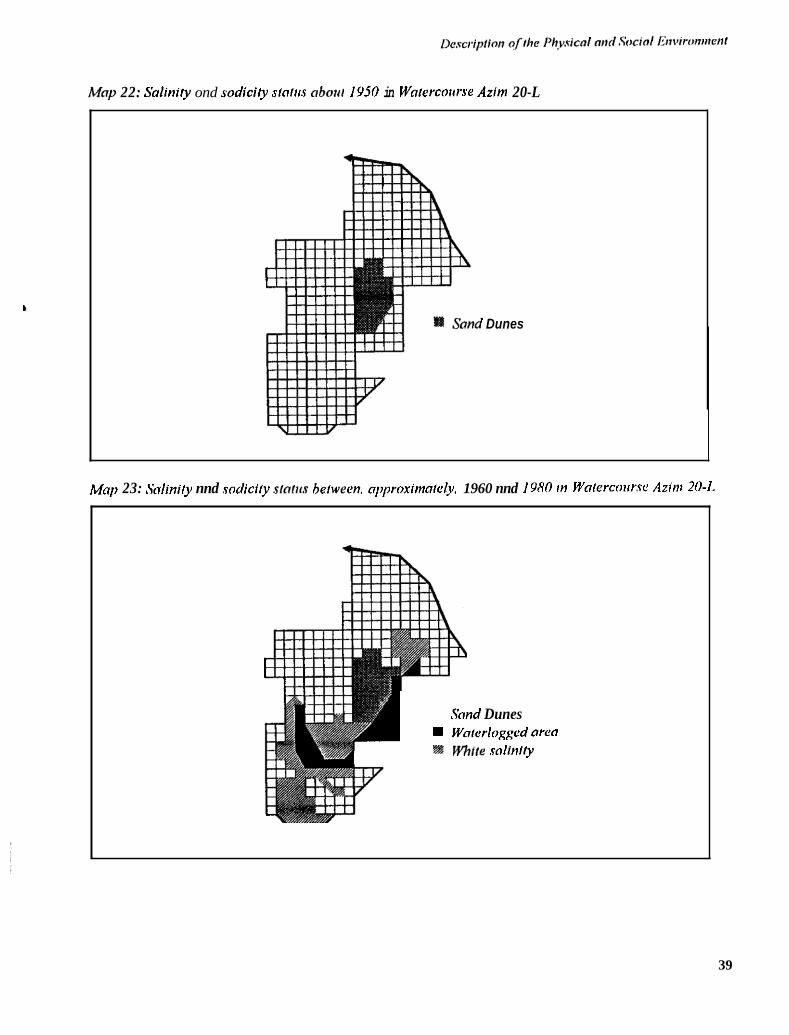
Mop 22: Saliniiy ond sodicity sloltis oboul I950 in Wnlercoirrse Azim 20-L
’ Dunes
Mnp 23: Solinicy nnd sodicily .slnltis hecween. npproximnlely, 1960 nnd 1980 m Wnlercolmc Azrm 20-1.
Sond Dunes W Wofcrlogged nren D Whfre sofinliy
39
Chapter 3
Farmers’ Understanding of Salinity and Sodicity
I
to four days aRer irrigation.
Cracks ill the soil aRcr irrigation.
Increased nuinbcr of ploughiiigs to get a good tillage Iaycr. Difficult to plough or harrow.
Fanners‘ response to salinity and sodicity can be partly cxplaiiicd by their understandiiig of the salinity and sodicity processes. Bascd on their tindcrstanding and tlie way tlicy perceive salinity and sodicity iii the light of tlicir farniing goals and intcriial and external constraints, farmers ‘definc’ a strategy to cope with salinity and sodicity in tlieir farniing systcms. From the foregoing chapter, it appeared that farniers have an cxccllciit knowledge of saliitity and sodicity processes. I n this chapter. fanners‘ understanding of soil salinity and sodicity shall be prcsciitcd i n inore detail, as well as tlicir pcrccption 011 tlic influciicc of iising different qualities of tubewcll water on the salinisation and sodification processcs. A link will be nlndc between farnicrs‘ classification and the classification systcms and indicators as uscd by scientists (scc tlic tlicorctical fraincwork).
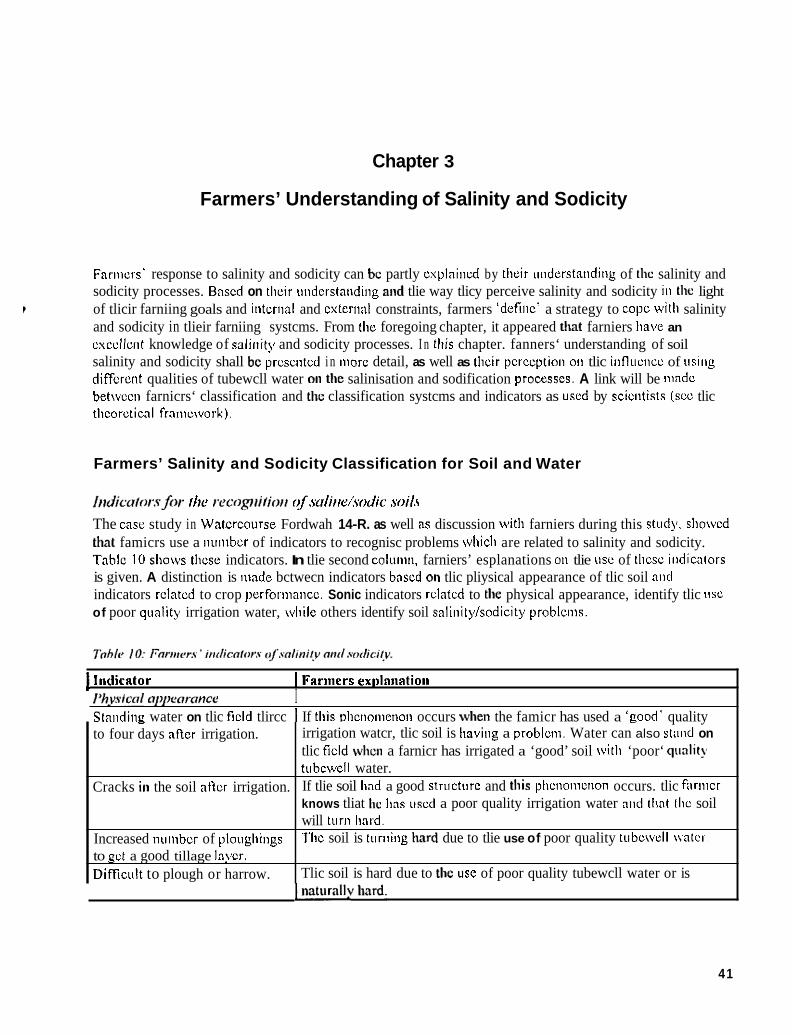
- irrigation watcr, tlic soil is having a problem. Water can also stand on tlic field when a farnicr has irrigated a ‘good’ soil with ‘poor‘ qunlir) tubcwell water. If tlie soil had a good stnlcturc and this plicnoiiicnon occurs. tlic farnicr knows tliat lie lias used a poor quality irrigation water and tliat llic soil will turn hard. Tlic soil is tiirniiig hard due to tlie use of poor quality tubcwcll watcr.
Tlic soil is hard due to the use of poor quality tubewcll water or is
Farmers’ Salinity and Sodicity Classification for Soil and Water
I t id ic~i /nr .v~~r /be r~ecogni/iot~ of.urlitre/sodic soi1.c The case study in Watercourse Fordwah 14-R. as well as discussion with farniers during this study. sliowcd that famicrs use a nuiiiber of indicators to recognisc problems wliicli are related to salinity and sodicity. Tablc 10 sliows tlicse indicators. In tlie second colunln, farniers’ esplanations on tlie use of tllcsc illdicators is given. A distinction is iiiade bctwecn indicators bascd on tlic pliysical appearance of tlic soil and indicators related to crop perforinaiicc. Sonic indicators related to the physical appearance, identify tlic iisc of poor quality irrigation water, wliile others identify soil salinitykodicity problcnis.
I Indicator I Farmers explniiatioii 1’h.wical apl,eornnce I Standing water on tlic field tlircc I If this ohcnonicnon occurs when the famicr has used a ‘Rood’ quality
41
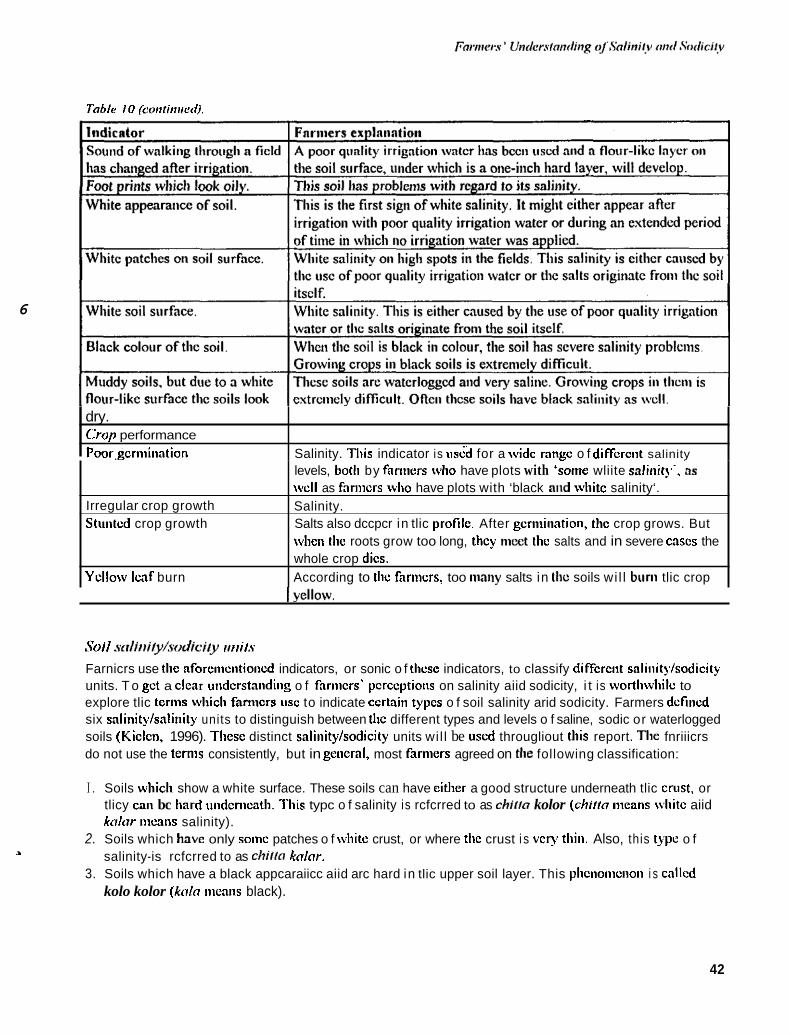
Table 10 (continiteci).
6
dry. <.'rap performance Poor.gcrniiiiation Salinity. This indicator is usid for a wide range o f different salinity
Irregular crop growth Stunted crop growth
Ycllow leaf burn
Soil .wIiiiity/wdici/y tiriils
Farnicrs use tlie aforementioned indicators, or sonic o f tlicse indicators, to classify diffcreiit saliiiity/sodicity units. T o get a clear inidcrstaiidiiig o f fmncrs’ perceptions on salinity aiid sodicity, i t is wortliwliilc to explore tlic ternis wliicli krnicrs iisc to indicate ccrtaiti typcs o f soil salinity arid sodicity. Farmers defined six snlinitylsaliiiity units to distinguish between the different types and levels o f saline, sodic or waterlogged soils (Kiclcn, 1996). These distinct salinity/sodicity units wil l be uscd througliout this report. The fnriiicrs do not use the ternis consistently, but in geiicral, most farmers agreed on the following classification:
I . Soils which show a white surface. These soils can have either a good structure underneath tlic crust, or tlicy cnii bc hard underneath. This typc o f salinity is rcfcrred to as &;/lo kolor (chi//o means white aiid kolor iiicans salinity).
salinity-is rcfcrred to as chi//o kolor.
kolo kolor (kolo means black).
2. Soils which h a w only sonic patches o f white crust, or where the crust i s veq) thin. Also, this typc o f
3. Soils which have a black appcaraiicc aiid arc hard in tlic upper soil layer. This plicnoiiiciion i s callcd
levels, ~botli by hrnicrs ivho have plots with ‘some wliite dinit),’. n s wvcll as fnriiicrs who have plots with ‘black and white salinity‘. Salinity. Salts also dccpcr in tlic profilc. After germination, the crop grows. But wlicii tlie roots grow too long, they meet tlie salts and in severe cascs the whole crop dies. According to the farnicrs, too many salts in the soils wi l l bun1 tlic crop
42
4. Soils wliicli look good but wliicli are hard deeper iti tlie profile. The hardness is called zochl. Also. soils that arc hard at tlie surface. or at a dccper depth, are rcfcrrcd to as being zocltl. I n Watercourse Fordwali 14-R tliu hardiiess i n the soil was rufcrrud to as kolmrhi. 111 tlie rcniniiidcr of this report. tlic tcrin rnch/ will bc used for Iiardncss of the soil.
5 . Soils wliicli liave a lot of white salts at the soil surface. They appear to be dry. but under the layer of salts, the soil is muddy. Farmers call this kolor .Thoor. I n this type of soil, it is (almost) impossible to grow crops. Sotiic farmers call soils which contain too many salts to grow crops also kolor shoor. I n this case, tlie soil does not necessarily have to be muddy.
6. Soils which are wvatcrloggcd. Watcrlogging is callcd som.
Sonictinics. sonic soils liavc ‘stones’ at a depth of approxiiiintcly onc foot. Tlicsc ‘stones‘ arc c:iIIcd roor. A variety of combinations of tlic abovcniciitioiied soils exist as well. These combinations are, for cxaniplc: hard and white (zochl and ch im kdcrr): black atid white (kolo ond cl7itro kolor): aiid black. wliitc. nitd hard (kolo nnd chilro kolnr. ond zocltr).
Qiitrlily ofirrixcr/ioit itvrier 111 tlie sanie way as farmers use indicators to dcscribc diffcrcnt types of soil saliiiity/sodicity. they use indicators to describe tlie quality of irrigation water as wcll. Tlicsc indicators arc related to tlic cffcct tlint tlie water has on the soils. The cffccts wliicli are rccogniscd by tlie farnicrs arc: I ) the appearance o f white salinity at tlie soil surface; 2) hardncss of soils and water standing at tlie soil surface after irrigation; aiid 3) the appearance of black salinity after cxtcnsivc use of certain types of tubewcll wvatcr. When fariiicrs talk about a good quality water. i t nicaiis that the water docs not cause a wliite or black salinity. nor Iiardncss. in the soil.
Discussion on Farmers’ Salinity and Sodicity Classification
Farnicrs classify salinity and sodicity on the basis of tlie physical appearance o f the soil and the cffcct of salinity/sodicity on crop growth, irrigation, and land cultivation. Scientists classify salinity and sodicity niainly on the basis of EC.. SAR, ESP, and pH. For evaluating the quality of irrigation water. EC and SAR arc the most iiiiportaiit factors. In order to reveal tlic farnicrs’ undcrstanditig of salinity aiid sodicity. it is interesting to relate fariiiers’ classification systcnis to theoretical classification systciiis supplciiicntcd by soil and water saiiiple analysis.
/ ‘~l~lI IC‘t’ .S ’ S O i l Ckl.S.S~/;f ict l / l~Jl~ .SJI.S/C‘lIl
In Table I 1. tlic fariiiers’ soil classification system is coiiiparcd with the USSL soil classification systcnl. In the first lilic, tlie salinity aiid sodicity groups according to tlie USSL are giveti. Tlie fist column contains tlie farmers‘ classification unit. In the cells below the USSL classification unit, tlie percentagc of samples from a certain famiers’ classification unit wliicli correspond with a certain USSL classification unit is given. I n betwecn brackets, tlie total nunibcr of samplcs is given. This liclps to interpret the data, as only a siiiall nuitibcr of samples were prcsciit of sonic classification units.
43
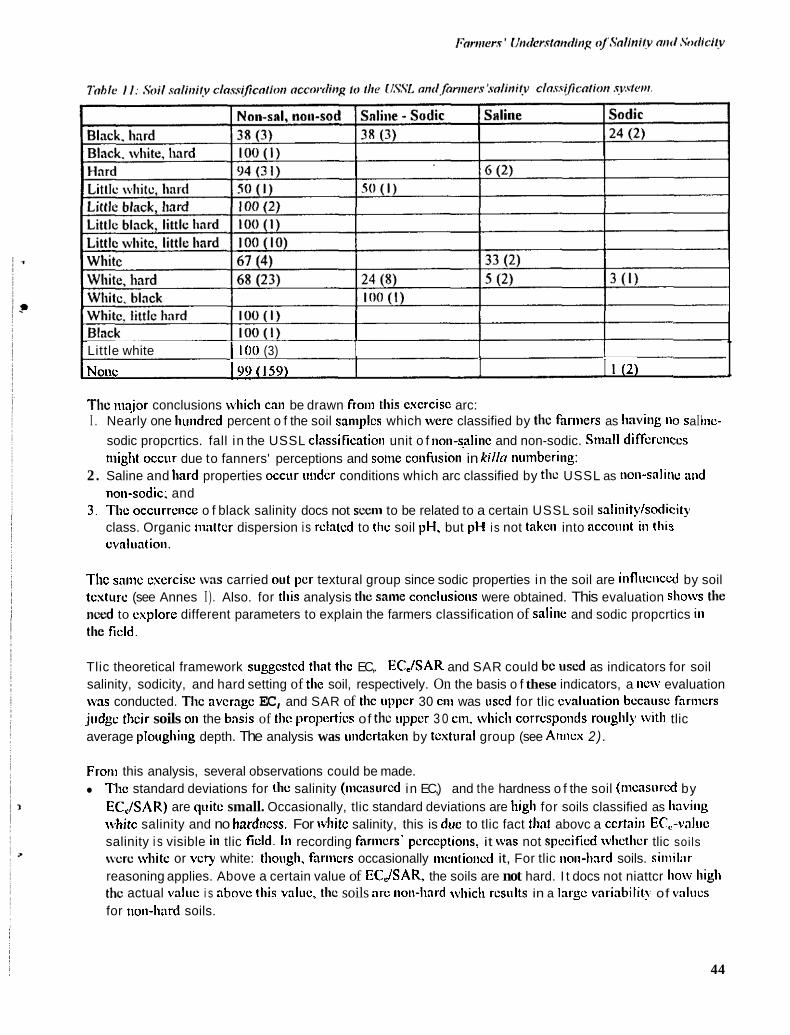
Little white I 100 (3)
None 199 (159) I I I (2) I The nnior conclusions wliich can be drawn from this cxcrcisc arc: I . Nearly one liiiiidrcd percent o f the soil samplcs which were classified by the farniers as Iiaving 110 s a I ' IlIC-
sodic propcrtics. fall in the USSL classificatioii unit o f non-salinc and non-sodic. Small differences might occiir due to fanners' perceptions and some confusion in kill0 numbering:
2. Saline and hard properties occiir under conditions which arc classified by the USSL as non-saliiic aiid noii-sodic: and
3. Tlic occiirrciice o f black salinity docs not seem to be related to a certain USSL soil salinity/sodicity class. Organic niattcr dispersion is related to tlic soil pH, but pH is not taken into account in tliis cvaluatioii.
Thc same exercise was carried out per textural group since sodic properties in the soil are influcllccd by soil texture (see Annes I ) . Also. for this analysis the same conclusioiis were obtained. This evaluation sIio\vs the need to explore different parameters to explain the farmers classification of saline and sodic propcrtics ill the ficld.
Tlic theoretical framework suggcstcd that the EC,. ECJSAR and SAR could be used as indicators for soil salinity, sodicity, and hard setting of the soil, respectively. On the basis o f these indicators, a IICW evaluation \\'as conducted. The avcragc EC, and SAR of the iippcr 30 cni was used for tlic cvaliiatioii bccaiisc fariiicrs judge tlicir soils on the basis of the propcrtics of the upper 3 0 CIII, wliicll corresponds rouglily with tlic average plougliing depth. The analysis was uiidcrtnkcn by tcxtiiral group (see Anilcx 2) .
From this analysis, several observations could be made. The standard deviations for the salinity (nicasurcd in EC,) and the hardness o f the soil (iisasurcd by ECJSAR) are quite small. Occasionally, tlic standard deviations are higli for soils classified as liaving whitc salinity and no hardncss. For wllitc salinity, this is duc to tlic fact that abovc a ccrtain EC,.-valiic salinity i s visible in tlic ficld. In recording fariiicrs' pcrccptions, it was not spccificd wlictlicr tlic soils were white or very white: tliough. fnrnicrs occasionally iiicntioiicd it, For tlic iioii-hard soils. siniilar reasoning applies. Above a certain value of ECJSAR. the soils are not hard. I t docs not niattcr how liigli the actual valiic i s abovc this value, the soils arc non-hard wliicll rcsiilts in a large vnrinbilit!. of values for non-hard soils.
44
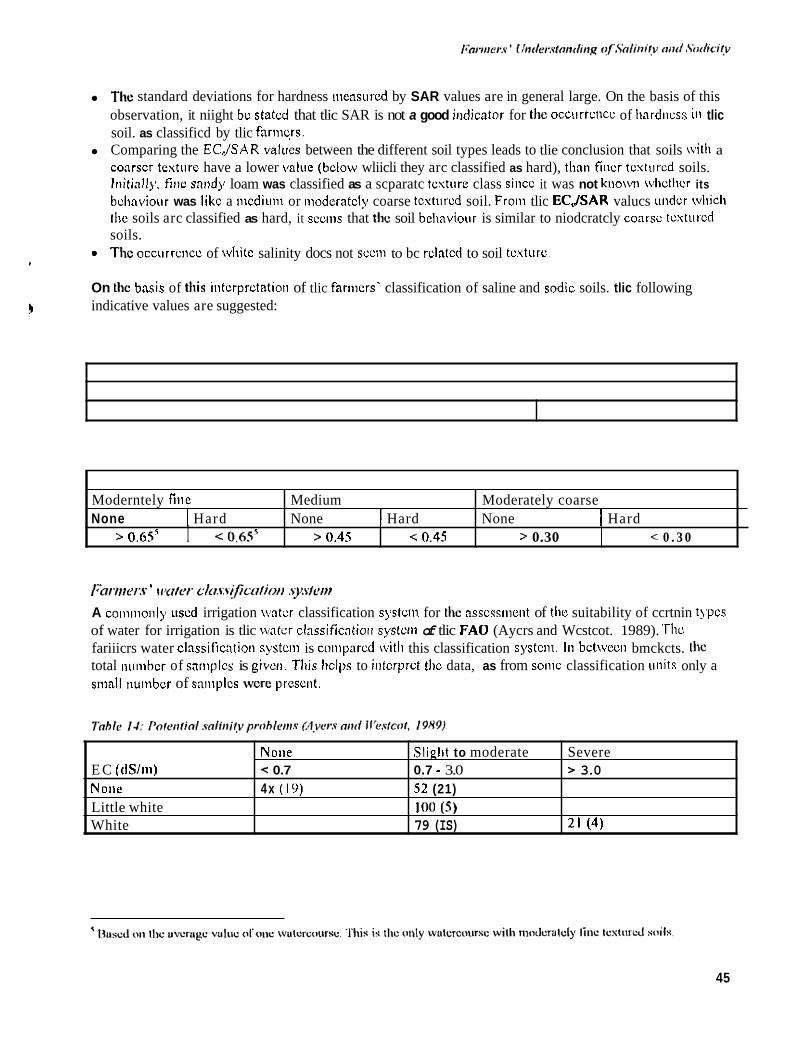
The standard deviations for hardness nieasured by SAR values are in general large. On the basis of this observation, it niight be stated that tlic SAR is not a good indicator for the occ~irrencc of liardiicss iii tlic soil. as classificd by tlic farnicrs. Comparing the ECJSAR valucs between the different soil types leads to tlie conclusion that soils \villi a coarser tcxtiire have a lower value (below wliicli they arc classified as hard), than finer tcxtiircd soils. initially. fine sandy loam was classified as a scparatc texture class siiicc it was not known \vlictlicr its bchnviour was like a nicdiiiiii or iiiodcratcly coarse tcxtiircd soil. Froiii tlic ECJSAR valucs under wliich tlie soils arc classified as hard, it scciiis that the soil beliavioiir is similar to niodcratcly coarse textured soils. The occiirrcncc of white salinity docs not sccni to bc related to soil texture.
On the basis of this intcrprctatioti of tlic fanners' classification of saline and sodic soils. tlic following indicative values are suggested:
Moderntely fine None I Hard
> 0.6.5' I < 0.6S5
Medium Moderately coarse None I Hard None I Hard
> 0.4s 0.4s > 0.30 < 0 . 3 0
None E C (dS/m) < 0.7 None 4x (19) Little white White
l;miner.s ' iiwfer c/trs,s!ficicrr/ioii .syskwi A co~iiinonly used irrigation water classification system for the assessment of tlw suitability of ccrtnin types of water for irrigation is tlic watcr classificatioii systcm of tlic F A 0 (Aycrs and Wcstcot. 1989). Tlic fariiicrs water classificntioii systcni is coiiiynrcd with this classification systcni. I n bctwccli bmckcts. the total numbcr of samples is given. This liclps to intcrprct thc data, as from soiiic classification iiiiits only a siiiall numbcr of samplcs were present.
Sliglit to moderate Severe 0.7 - 3.0 =. 3.0 s2 (21) loo ( 5 ) 79 (IS) 21 (4)
45

Nolie Slight to moderate Severe SAR EC (dSliii) > 0.7 0.7 - 0.2 < 0.2 0 -3 Notie 42(11) 58 ( I S )
Tlic salinity classificntioii o f tlic fariiicrs seems to be in line with tlic F A 0 classification systclli. Iliougli the tlircsliold vnltics arc different. But ari iricrcnscd EC value givcs.iiicrcnsed saliiiity problciiis. For the classification o f t l ic sotlicity problctiis. tlic I‘ariiicrs’ clnssilicntioli is not ill line with tlic F A 0 clnssilic:ttioii system. Many water saiiiplcs do not fall iii the sodicity class where tlicy wcrc cspcctcd to fall. Good csaiiiplcs arc the wntcr samples tlint were not cspcctcd to crcntc sodicity problems. According l o tlic fanners, inniiy o f tlicsc tubcwcll waters cniisc hardness in the soil. Two tliiiigs could be colicludcd from this analysis. I) tlie F A 0 classification system undcrcstimatcs tlic sodicity problems. or 2) rliis annlysis shows the ticcd to csplorc different pnrnnictcrs and values to csplaiii fariiicrs’ irrigation water classilic;ltioii. The tlicorotical frnincwork proposcd EC for potential snliiiity problciiis, RSC for sodificntioii proI>Iciiis. nnd EC iii coiiiparisoii to tlic SAR for iiifiltrntioii problems. A detailed analysis is given iii Ailtics 3 . Hcrc. only tl ic outcomc o f the aiialysis is discussed. On thc basis of tlic aiinlysis. thc followiiig values for asscsslnctit of probable sodicity problciiis caused by tlic use o f tubcwcll \vatu for irrigntioii arc stiggestcd:
46
A reduction i n infiltration ratcs are prevented by a high total cation concentratioti (TCC) in coiiiparisoli to the SAR o f the irrigation watcr. Fiiicr tcsturcd soils nmd n Iiighcr TCC to prevent 8 rediictiori iii ii~lillrntiot~ rates. To prevent sodicity problciiis. tlic RSC iii tlic irrigation watcr needs to be low. Iri tlimry, tlic RSC- value iiccds to be lcss than zero. But according to farmers’ cxpericncc, the RSC can bc abovc zero end no significant degradation of the soils has been observed, given that tlie TCC is below a certain valuc. Coarser tcxturcd soils can stand liiglicr RSC and TCC lcvcls before physical dcgradatioii is observed in the field.
41
,
Chapter 4
Farmers’ Strategies and Practices to Cope with Salinity and Sodicity
Introduction
In tlic tlicorctical framework. a model for tlic decision-ninkiiig process of the farnicrs was proposcd Tlic tiiodcl takcs tlic present salinity aiid sodicity situation as a stnrtiiig poiiit for the analysis. Fariiicrs‘ pcrccplioiis 011 salinity aiid sodicity are formed by tlicsc physical conditions, tlicir understaiding o f the salinity atid sodicity processes, atid by their farm goals, strategies, aiid iiitenial and external constraints. On the basis of this pcrccptioii, fariiicrs define a salinitylsodicity strategy wliicli results in the iiiiplciiicntatioii of ccrtaiii nieasurcs.
The foregoing cliaptcr atid tlic case study (Kieleii, 1996) revealed that most farnicrs have an excellent knowledge and undcrstaiidiiig o f present salinity and sodicity processes. Therefore, the major aiiii of this clinptcr will be to relate tlic physical environiiiciit aiid tlic fanii cliaracteristics to the salinity and sodicity stratcgics aiid practiccs.
On tlic basis of the results o f tlic case study carried out in Watercourse Fordwah 14-R, and on tlic basis o f a first aiialysis o f tlic iiitcrvicws with farmers carricd out in this study. the following Iiypotlicsis 011 fariiicrs. stratcgics for coping with salinity and sodicity wcrc made:
1. llnder conditions ofsevere .solini/y, and where only large-.rcole chonges in conol water dis~rihiiririn or drflinoge conditions con chonge the salinily and sodicity silrmlion. ,farmers will not have a plon to
decreme or srnhilise /he solinity and .sodicily leveh. Depending on rhe pmsihilities nnd constroinh of 1he.forming .sysIem, Ihcy nti,ght Iry lo miligole the g/ficl qfsolinily and .sodicily on crop griiwlh.
2. IJndc~r,/hvorirohle phjj.sicol condilions. where there i s no dnnger rhor snliniry will develop. ,fhrme):s do not need lo hove o snlinily iinrl .sodicilJ, slrntc,g’: tlins. there is no need to niirigole the cflect on crop grl’wlh
3. llntler conu’ilions where /he iniliol ,sctlinity 1evcl.s ore low. hit/ where rherc is n hozord /hot .salinity or .sodicily minht develop. most,fivmer.s will rr)) toprcvcnt rhc development ?fsolini/y ond .sodiciy. Ikpcndinp on rhc chorncfcri.srics of fhe,forniing .sysfem. .soinc,formers might olliiw nn increosc in (n port) qfthc,forni. .Since /he inilinl levelr ore /out (here 1.r no need lo ntiligntc~ Ihe <//eel on crop ,growIh.
4. llnder condilions /hot (ports 4) rhe,form hove normal (o high soliniry levels and there arc hnzwds tho1 /he ,solini~~v mighr incrmsc, ,formers might develop d(l7;.ren/ srrolegics. 7he.fiiriii ? / the .s/rme,g~~ will 1orgcl.i~ dqwnd on, farm cliorncleri.slic,r nnd po.ssihilities ond cmw/roin/.c sc/ hv /hc,/irrriiiyq .s)~,s/eiit.s. 1.irrrher. it dcpend.s on the nctrrnl .salinity levels ond on /he pos.~ihilities and conslroinls .su/ hy the, fhrm. wlicther,formers will tniligole /he &cr ofpresent solinily ond sodicily on crop growth.
4R
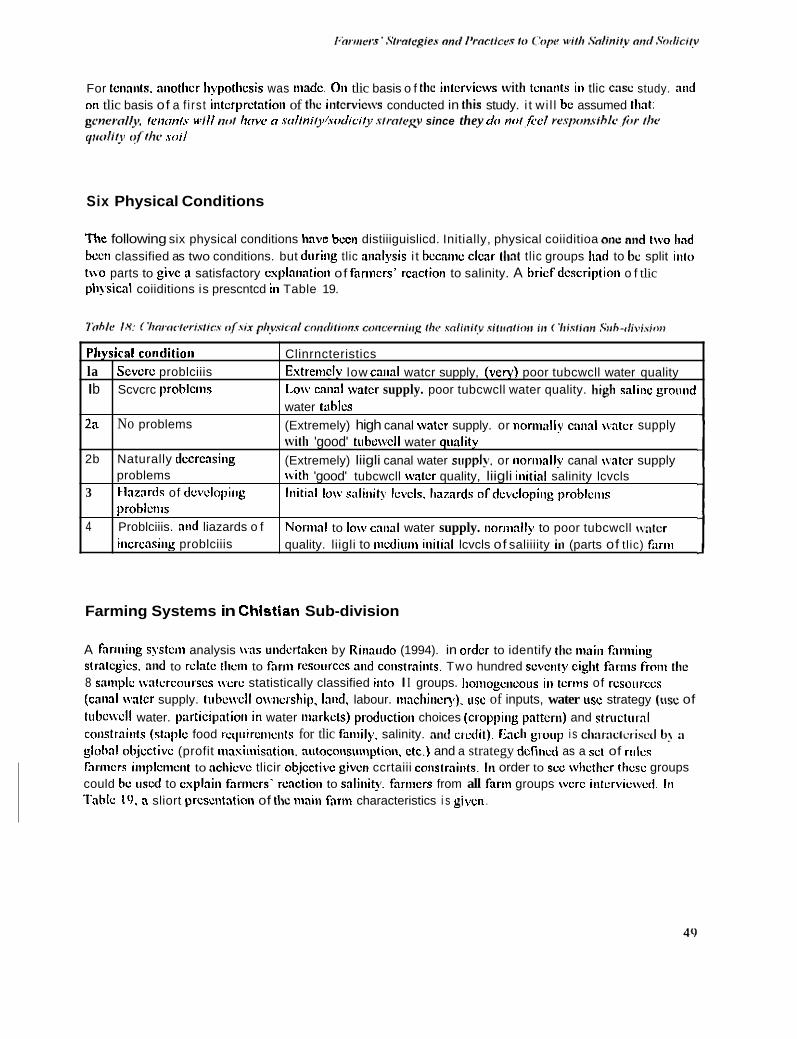
For tenants. aiiotlicr Iiypothcsis was iiiadc. 011 tlic basis o f the iiitcrvicws with tcti:uits iii tlic case study. atid on tlic basis of a f i rs t intcrprctatioii of the intcrvic\vs conducted in this study. i t wi l l be assumed that: gcner.nl[ii loamls will in , / linve fl .soliniljr/soclicilji .slrcrlcp since they do nol,fccl r~.~i7(11i,sihI~../i,r the q t i d i / j , c? / / / i c .soil
Pliysicsl conditioii la Sevcrc problciiis I b Scvcrc problciiis
2a No problems
2b Naturally dccreasiiig problems
3 tlaznrds of dcvclopiiig prohlciiis
4 Problciiis. atid liazards o f iiicrcasitig problciiis
Six Physical Conditions
The following six physical conditions havc bccii distiiiguislicd. Initially, physical coiiditioa one mid Iwo had bccii classified as two conditions. but during tlic alialysis i t bccatiic clear that tl ic groups lind to be split iiito two parts to give n satisfactory cxplanatioii of fariiicrs' rcaction to salinity. A br ief dcscriptioii o f tlic pliysical coiiditions is prescntcd iii Table 19.
Clinrncteristics Extremcly low caiial watcr supply, (very) poor tubcwcll water quality Low cniial water supply. poor tubcwcll water quality. high saliiic groutid water tables (Extremely) high canal water supply. or noriiially canal water supply with 'good' tubcwcll water qiiality (Extremely) liigli canal water slilqdy. or iiornially canal w t c r supply n i t l i 'good' tubcwcll water quality, liigli initial salinity lcvcls Initial low saliiiity lcvcls. liazards ordcvclopilig problcms
N o r m 1 to low caiial water supply. nomially to poor tubcwcll \v:itcr quality. liigli to iiicdiiiiii initial lcvcls of saliiiity in (parts of tlic) fiiriii
Farming Systems in Chistian Sub-division
A farming system analysis was undertaken by Rinaudo (1994). in order to identify the main fnriiiiiig strategies. and to relate tliciii to fnrm resoltrees and coiistraiiits. Two hundred scvciity eight farms from the 8 saiiiplc \\atcrcoiirscs w r c statistically classified into I I groups. hoiiiogcncous i t i tcriiis of rcsotirccs (caiial water supply. tubc\vcll owwship. land, labour. iiincliincy). usc of inputs, water usc strategy (use of tubcwcll water. participatioii iii water iiiarkcts) productioti choices (croppiiig pattern) and stnictitral coilstraitits (staple food rcq~iirciiiciits for tlic faiiiily. salinity. and clcdit). Cacli group i s cIi:icicIcriscd I)! :I glohnl olijcctivc (profit masiiiiisation. mitocolisuiiiplioli. etc.) and a strategy dcfincd as a set of rulcs fnriiicrs i i i i p l c~ i~c~ i t to acliicvc tlicir ob.jcctivc givcn ccrtaiii coiistraiiits. I n order to scc wlictlicr tliesc groups could be used to cxplniii farmers' reaction to saliiiity. fariiicrs from all farin groups wcrc ititcrvic\vcd 111
Tahlc 10. n sliort prcscntation of the iiiain fariii characteristics i s b' T I VCl l .
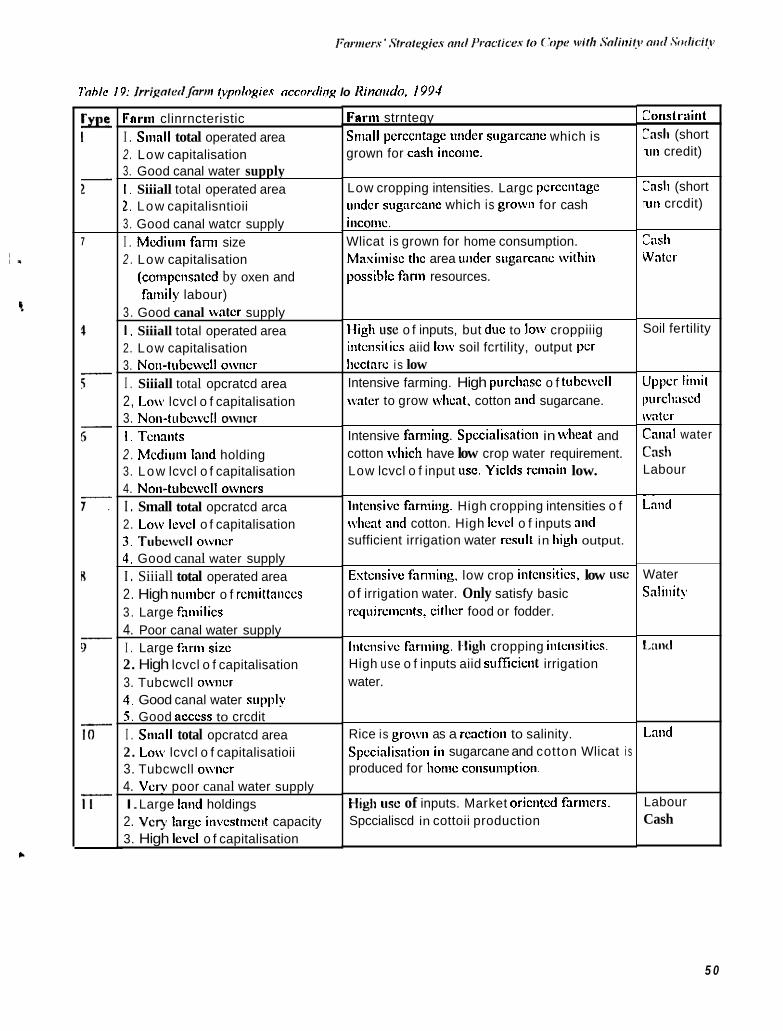
7iohlc 19: Irri~o~urI,faris 1,vpologic.v nccorriirg lo Ilinnrrdo. I994
7
Fnrin clinrncteristic I . Sinall total operated area 2. Low capitalisation 3. Good canal water supply I , Siiiall total operated area 2 . Low capitalisntioii 3 . Good canal watcr supply I . Medium farm size 2 . Low capitalisation
(compensated by oxen and faiiiily labour)
3 . Good canal water supply 1. Siiiall total operated area 2. Low capitalisation 3. Noii-tubc\vell owner I . Siiiall total opcratcd area 2, Low lcvcl o f capitalisation 3. Non-tubcwcll o\vncr 1. Tenants 2 . Mcdiuiii land holding 3. Low lcvcl o f capitalisation 4. Non-tubcwcll owiicrs I . Small total opcratcd arca 2. Lo\\, level o f capitalisation 3. T u b c \ \ d owncr 4 . Good canal water supply I . Siiiall total operated area 2. High nuiiibcr o f rciiiittaiiccs 3 . Large faniilies 4. Poor canal water supply I . Large farm size 2. High lcvcl o f capitalisation 3. Tubcwcll o\viicr 4. Good canal water supplv S. Good access to crcdit I . Sniall total opcratcd area 2. Low lcvcl o f capitalisatioii 3. Tubcwcll owncr 4. V c y poor canal water supply I. Large land holdings 2. Very large invcstuiciit capacity 3. High levcl o f capitalisation
Fnrui strntegy Small perccntagc under sugarcatie which is grown for cash iiicoiiie.
Low cropping intensities. Largc pcrcclitagc iiiidcr sugnrcane which is growii for cash inconic. Wlicat is grown for home consumption. Maxiiiiisc tlic area under sugarcaiic witl i i i i possiblc fann resources.
High use o f inputs, but due to low croppiiig iiitciisitics aiid low soil fcrtility, output per Iicctarc is low Intensive farming. High purchase o f tubcwcll water to grow wlicat. cotton and sugarcane.
Intensive famiing. Specialisation in wlieat and cotton wliicli have low crop water requirement. Low lcvcl o f input use. Yiclds rcniain low.
liitciisivc farniiiig. High cropping intensities o f wheat aiid cotton. High level o f inputs and sufficient irrigation water result in liigli output.
Extensive fariiiing, low crop intcnsitics, low use of irrigation water. Only satisfy basic rcquircincnts, citlicr food or fodder.
Iiitciisivc fariiiiiig. 1,ligli cropping iiitciisitics. High use o f inputs aiid suffciciit irrigation water.
Rice is growii as a reaction to salinity. Spccialisntioii in sugarcane and cotton Wlicat i s produced for hoiiic cousumption
High use of inputs. Market oricntcd fariiicrs. Spccialiscd in cottoii production
Coiistrsint (short
i i n credit)
Casli (short run crcdit)
Casl1 Water
f.
Soil fertility
Upper l i i i i i t purclinscd rvatcr Cniial water Cash Labour
i&
Water Saliiiity
L.:llld
Land
Labour Cash
5 0
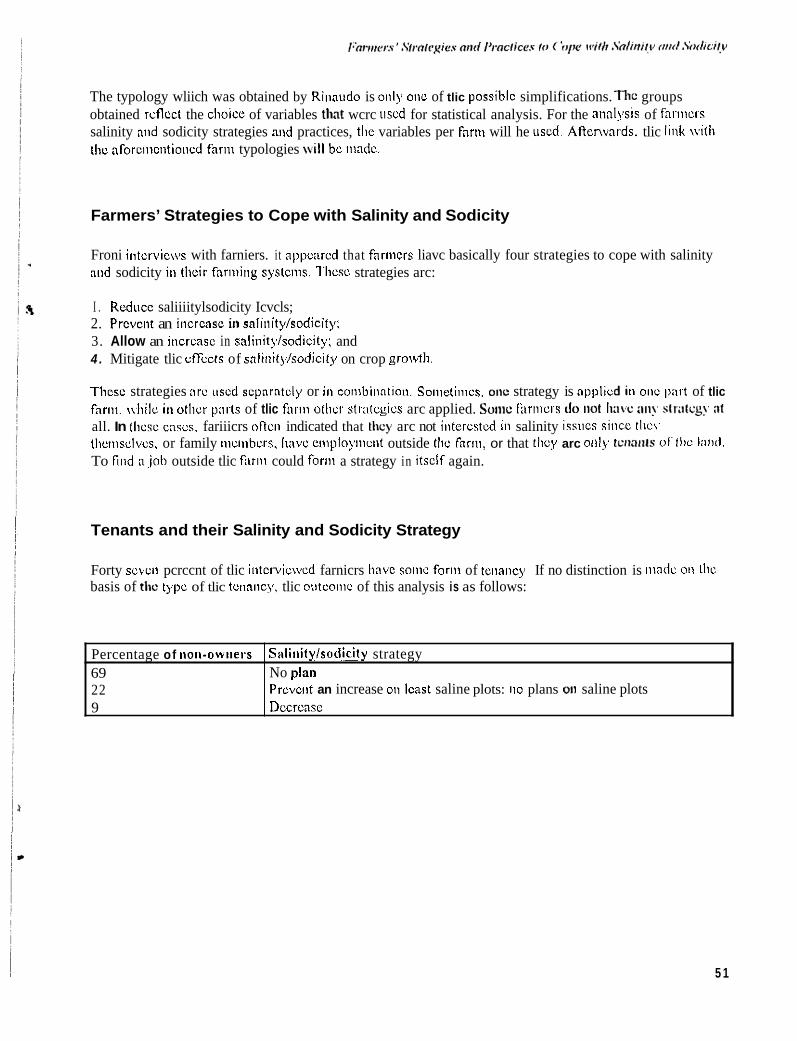
The typology wliich was obtained by Riiiaudo is only oiic of tlic possiblc simplifications. The groups obtained reflect the choice of variables that wcrc uscd for statistical analysis. For the analysis of fariiicrs salinity and sodicity strategies aiid practices, the variables per farm will he uscd, AAenvards. tlic link with the aforciiicntioncd farm typologies will be iiiadc.
Percentage of noti-owiiers 69 22 9
Farmers’ Strategies to Cope with Salinity and Sodicity
Froni iiitcrvicws with farniers. it appeared that farmers liavc basically four strategies to cope with salinity aiid sodicity iii tlicir fariiiiiig systcms. Tlicsc strategies arc:
I . Reduce saliiiitylsodicity Icvcls; 2. Prevciit an iiicrcasc ill salinity/sodicity: 3. Allow an increase in saliiiitylsodicity: and 4 . Mitigate tlic cffccts of salinity/sodicity on crop gro\vili.
Saliiiitylsodicity strategy No plan Prcvciit an increase 011 least saline plots: no plans 011 saline plots Decrease
Thcsc strategies arc uscd scparntcly or i n conibiiintioii. Sonietiiiics. one strategy is applic 11 OIK part of tlic fariii. \\hilt i n otlicr p:irts of tlic f h i otlicr stratcgics arc applied. Some Ihriiicrs do not li:ivc mi!’ slt;~lcg!’ :it
all. In tlicsc cascs. fariiicrs often indicated that they arc not iiitcrcstcd iii salinity issues siiicc tlicy thctiisclvcs. or family nicmbcrs, liavc eniployniclil outside the fnrm, or that tlicy arc o d y tcn:uIIs 0 1 t11c Imd. To find aJoh outside tlic fariii could forlit a strategy in itsclf again.
Tenants and their Salinity and Sodicity Strategy
Forty scvcii pcrccnt of tlic intcrvicwcd farnicrs have soliic form of tciiaiicy If no distinction is niadc 011 lhc basis of the type of tlic tciiancy. tlic outconic of this analysis is as follows:
5 1
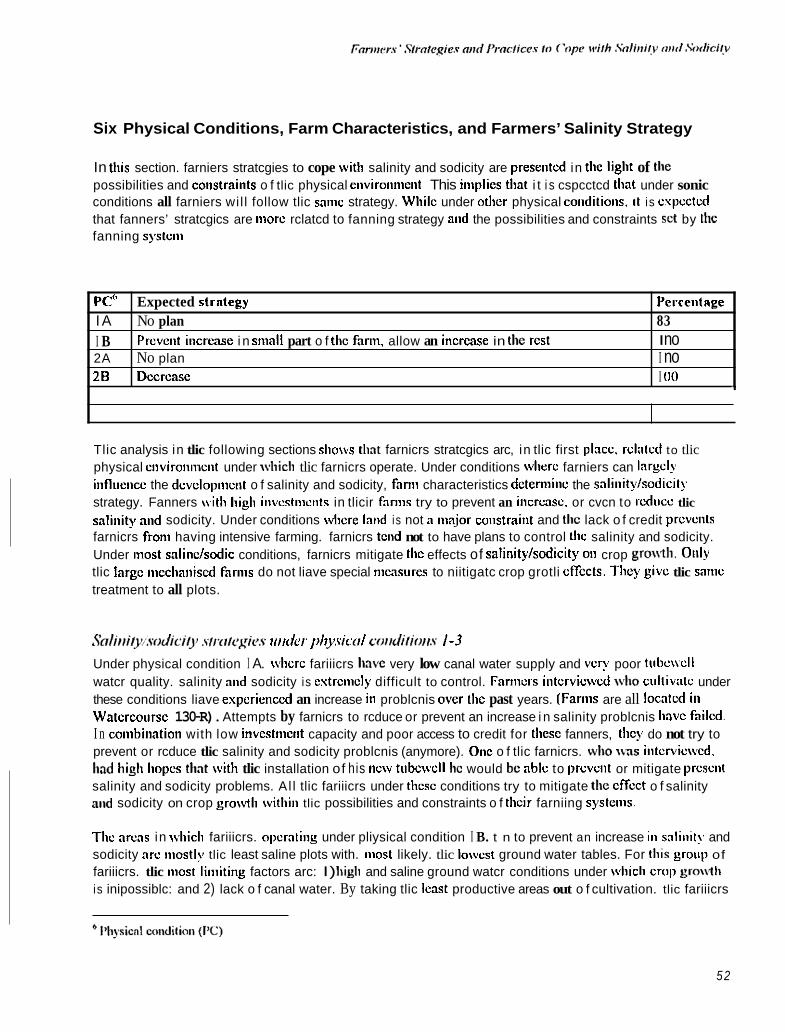
Six Physical Conditions, Farm Characteristics, and Farmers’ Salinity Strategy
In this section. farniers stratcgies to cope with salinity and sodicity are presentcd in the light of the possibilities and constrailits o f tlic physical environmcnt This iniplics that i t i s cspcctcd that under sonic conditions all farniers wil l follow tlic sanic strategy. Wliilc under other physical conditioiis. 11 is cupcctcd that fanners’ stratcgics are iiiorc rclatcd to fanning strategy aiid the possibilities and constraints set by the fanning system
PC6 Expected slrntegy I’crcciitnge IA No plan 83 I B I no 2A No plan I no 28 Decrease I no
Prcvent increae i n sniall part o f thc farm, allow an increase in the rest
7
Tlic analysis in tlic following sections sliows that farnicrs stratcgics arc, in tlic first placc. rclatcd to tlic physical cnvironmciit under \vIiicli tlic farnicrs operate. Under conditions wlierc farniers can IarScly influencc the dcvclopnicnt o f salinity and sodicity, fanii characteristics deterniiiic the snliiiitylsodicil!. strategy. Fanners with liigli invcstniciits in tlicir farms try to prevent an incrmsc. or cvcn to rcducc tlic saliiiity and sodicity. Under conditions where land i s not a n i o r coiistraint and the lack o f credit prevents farnicrs from having intensive farming. farnicrs tend not to have plans to control tlw salinity and sodicity. Under most snlinckodic conditions, farnicrs mitigate tlie effects of salinitykodicity 011 crop gro\\Ili. Olily tlic large nicclianiscd fariiis do not liave special nicasiircs to niitigatc crop grotli effects. They give tlic sanic treatment to all plots.
Scrliiri/j~~.soc/ici~~ . s / i ~ c i / c ~ i v s riiitler pltysictrl co~~di/io~r.v 1-3 Under physical condition I A. wlicrc fariiicrs have very low canal water supply and vcn; poor tubc\vcll watcr quality. salinity and sodicity is extrcnicly difficult to control. Fariiicrs interviewed \vlio cultivate under these conditions liave experienced an increase i t i problcnis over the past years. (Farms are all locatcd iii Watcrcourse 130-R). Attempts by farnicrs to rcduce or prevent an increase i n salinity problcnis llavc failcd. I n coiiibinntion with low investnicnt capacity and poor access to credit for tliesc fanners, tlicy do not try to prevent or rcduce tlic salinity and sodicity problcnis (anymore). One o f tlic farnicrs. who \\as iiitcrvicwcd. had high hopes that with tlic installation of his ncw tubcwcll lie would be able to ~ircvcnt or mitigate present salinity and sodicity problems. Al l tlic fariiicrs under thcsc conditions try to mitigate the effect o f salinity and sodicity on crop growth witliin tlic possibilities and constraints o f tlicir farniing systenis.
Thc areas in wliich fariiicrs. operating under pliysical condition I B. t n to prevent an increase iii snlinit!, and sodicity arc mostly tlic least saline plots with. most likely. tlic lowest ground water tables. For this group of fariiicrs. tlic niost liniiting factors arc: I) high and saline ground watcr conditions under wliicli crop gro\\Ili is inipossiblc: and 2) lack o f canal water. By taking tlic least productive areas out o f cultivation. tlic fariiicrs
52
increase tlic water availnbility to a siiinllcr area. 111 tlicsc areas. crops call grow and a doivtitvnrd Irwi'ctncrtt of salts prevents nn iiicrense in salinity. All o f tliu fariiiura i l l this group try to niitigntv thu uffactn of anlinity and sodicity on crop growtli.
The farmers cultivating under physical condition 2A do not experience any salinity and sodicity prohlcnis. and tlicrc arc no liazards that salinity problems might develop. Therefore, tltcy do not need to Iiavc nliy stratcgies to prevent or mitigate the cffccts o f salinity. Sonic of these farmers decreased the salinity/sodicity levels in tlicir fields duritig tlic past.
All interviewed farmers who liave farms under physical condition 28 are tenants. Since no lai idowcrs who cultivate under tlicsc conditions were intcrvicwcd. tlic tenants strategy is disciisscd licrc to dcnionstr:itc tlic possible stratcgics under tlicsc conditions. Tlic fnrnicrs spccd lip tlic dcsalinisation process b>, plnnting rice. They do iiot linve to add atnendmcnts to dccrcasc tlic salinity. After several scasons o f kallar grass cultivation. followcd by rice cultivation, all otlicr crops ciui be g@vn oti tlicsc plots ithout sliowing niiy ; 1
3 , , . salinity or sodicity stress. Froin this nioiiient. tliese plots fall under physical conditioii F 2A.
A l l farmers wlio cultivate under physical coiiditioii 3, fncc liazards o f developing salinity and sodicity problcnis on iion-saline and non-sodic plots. Thcsc farnicrs try to avoid the dcvclopnicnt o f snlinit!./sodicity. Since tlic initial snlinity lcvcls arc low, tlicsc fnrnicrs do not nccd to do aiiytliing to niitigntc tlic cffccts o f salinity and sodicity 011 crop gro\vili. Two fariiicrs. cntogoriscd under physical condition 3. liavc iii snial l parts o f tlicir faniis different physical conditions. One farnicr has two plots with sonic white salinity. I n tlicsc plots. Iic tries to rcducc tlic salinity. The sccond farnicr lias two plots that Iic left fallow for n long tinic period. On tlicse plots. salinity naturally developed. He docs not liavc plans to rcducc tlic salinity 011 these plots. Tlic difference in stratcgics of t h e two farnicrs cnii bc esplaincd from tlicir fann cliaractcristics. Land was dctcriiiincd to be tlic niajor constraint for tlic former farnicr. wliilc for tlic latter, laboiir \\as identified to be tlic nia,jor constraint. I n combination with the unfmoirrablc locatiori o f tlic two plots of the latter fnriiicr, lie lcnvcs tlicse plots fallow.
Strli11itJivodici/y s/mle~i:ies l/llder p/1yy,vicfll colrdi/ioli 4 Fanners wlio cultivate undcr physical conditioii 4 liavc four diffcrcnt stratcgics to cope with salinity and sodicity. To understand the diffcrcnt stratcgics, tlicsc liave to bc studied in tlic light o f tlic fnrni clinmctcristics. hi follo\viiig scctioris. an analysis of fmn clinrnctcristics per strategy is described.
J ' w i w U i~~cretrsc in .stilil~ily iiilder phy.sicol C O I I ~ ~ / ~ O I I J Tlie most dctcriiiining clinractcristic in tlie choicc o f this strategy o f preventing ail increase iii salinity/sodicity scciiis to be tlic use o f inputs (Table 22). All fnrniers liavc high total variable costs To kccp fnrniing financially profitable. tlicy nccd to prevent an increase in salinity and sodicity.
s3
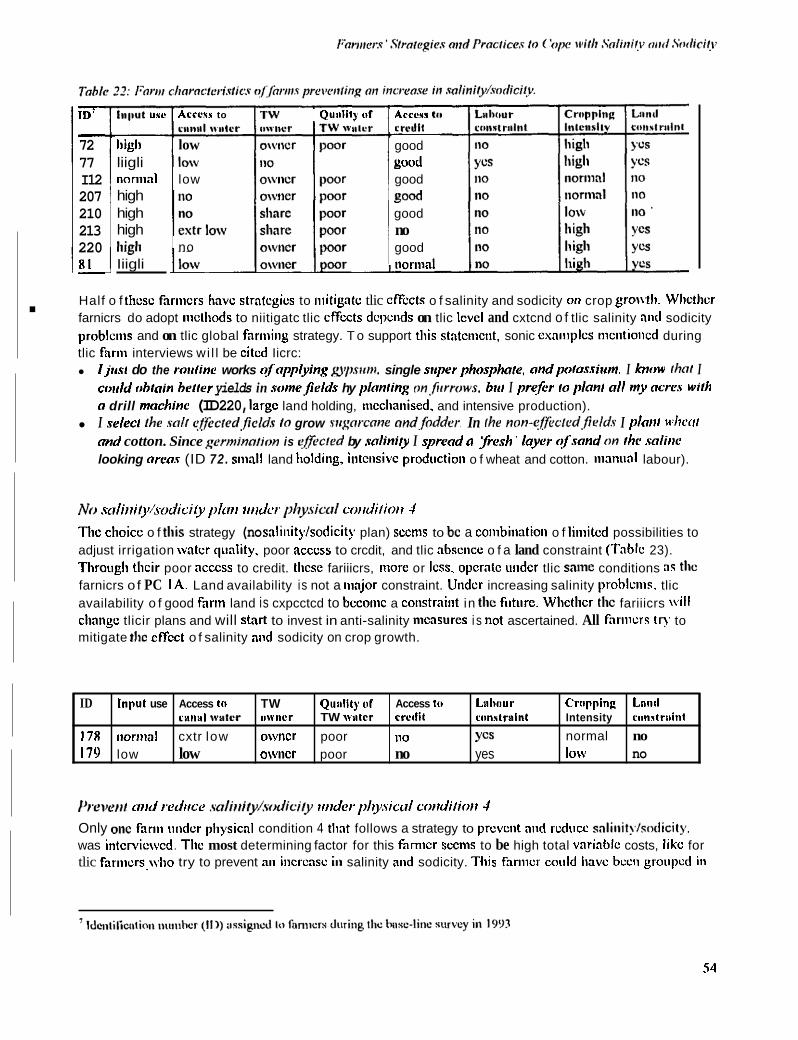
.
ID Input use Access lo TW Quiilir) (11 Access Iii Lnbsur
I78 iiornial cxtr low owiicr poor 110 Yes ciiiiiil \vzitcr mvner TW witer credit ciinrtruinl
179 low low owncr poor no yes
ir - 72 77 I12 207 210 213 220 81 -
Cropping Liinil Intensity cwistrtiinl
normal no lO\V no
I l l l l U I U W
high liigli nornial high high high high Iiigli
Accetr to Qutilily sf
low
low
no
Acceus 111 crcllll good good good good good
good norlnal
no
Half o f tlicsc firmcrs have stratcgios to mitigate tlic effects o f salinity and sodicity on crop grontli. Wliclhcr farnicrs do adopt iiictliods to niitigatc tlic cffccts dcpcnds on tlic lcvcl and cxtcnd o f tlic salinity and sodicity problcnis and on tlic global fanning strategy. T o support this statciiicnt. sonic esainplcs nicntioiicd during tlic farm interviews wi l l be cited Iicrc:
1,jtrst do the rorriine works ofopplying ,qps i in i , single super phosphoie. ondpoiossirrm. I kmiw /hot I coirld ohtoin heiier yields in some,fields hy planting on,Jiirrows. hiri I prefer io ploni oll mny ocres wiih o drill machine (ID 220, large land holding, nicclianised. and intensive production). I seleci the sol/ e[ficied,fields to grow sii,qorcone nnd,fodder. In /he non-eff^ecied,fields I plotit uhcoi ond cotton. Since germinn/ion is <fec/ed by soliniry I spread o yresh ' layer ofsond on ihc .solinc looking orc0.c (ID 72. sniall land Iiolding, intcnsivc prodtictioil o f wheat and cotton. nlanual labour).
No scrliiri/y/sodicify pltnr ritrdw plTy.sictrl coirdi~io~r I l l ie choicc o f this strategy (no salinity/sodicity plan) sccnis to be a colnbiliatioil o f limited possibilities to adjust irrigation water qiiality, poor access to crcdit, and tlic absence o f a land constraint (Table 23). Through tlicir poor acccss to credit. tlicse fariiicrs, niore or less, operate uiidcr tlic same conditions as the farnicrs o f PC IA . Land availability is not a inajor constraint. Under increasing salinity problcnis. tlic availability o f good farm land is cxpcctcd to bccomc a constrailit in the fiiturc. Wlictlicr the fariiicrs will cliangc tlicir plans and will start to invest in anti-salinity nicastires i s not ascertained. All farincrs ty to mitigate the cffcct o f salinity and sodicity on crop growth.
lJreiwii/ tritd redtrce .sn/iitity/.wdici/y finder plysicit1 corrdiiioit J Only one farni under physical condition 4 tlint follows a strategy to prevent and rcducc snlillity/siwlicity. was intcrvicwcd. Tl~c most determining factor for this farnicr seenis to be high total variable costs, like for tlic farnicrs,\vho try to prevent an iiicrcasc in salinity and sodicity. This famicr coiild Iiavc bccli groupcd in
54
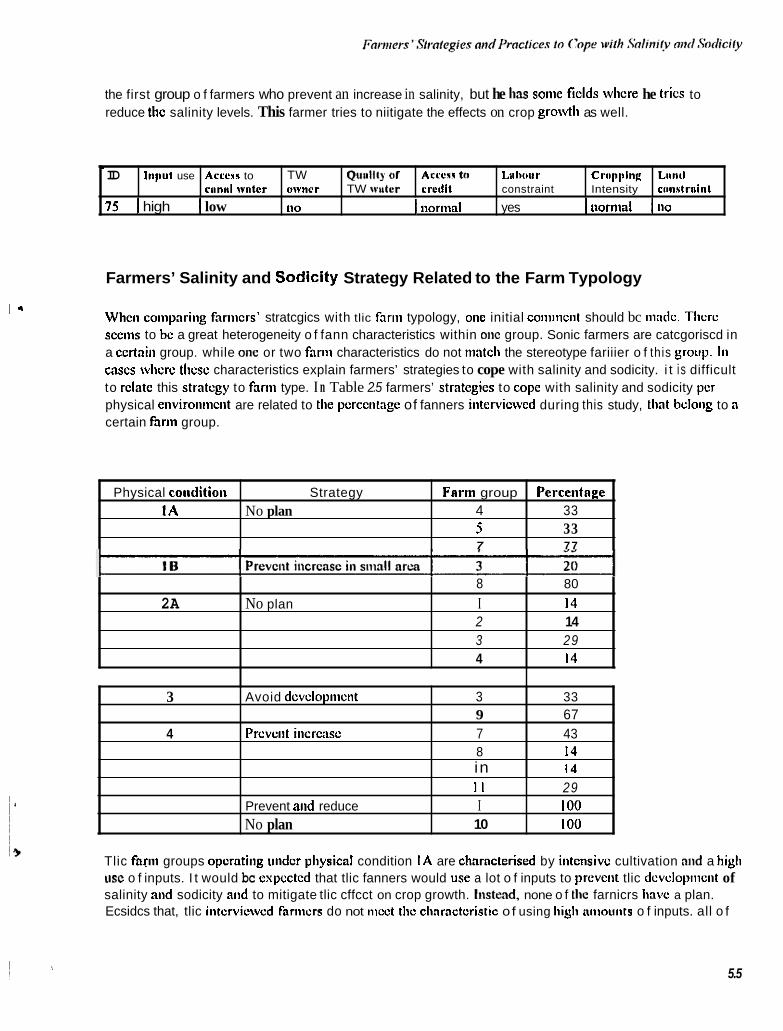
i *
L
ID In~ iu t use Access to TW QUIIIII) or ACWS 10 Lrihour Crttpplnp Land
75 I high 1 low 110 I norniaI yes 1 normal I no crinnl water owncr TW wttur r r c i l i l constraint Intensity ciinslrsint
the first group o f farmers who prevent an increase in salinity, but he has soiiie fields wlicre he trics to reduce thc salinity levels. This farmer tries to niitigate the effects on crop g r o d i as well.
Physical coiiditioii Strategy 1A No plan
Farm group Percentace 4 33 5 33 7 77
Farmers’ Salinity and Sodicity Strategy Related to the Farm Typology
2A
When coinparing fanners’ stratcgics with tlic farm typology, oiic initial coiiiinciit should bc iiiadc. Tlicrc s e e m to be a great heterogeneity o f fann characteristics within one group. Sonic farmers are catcgoriscd in a certain group. while one or two fami characteristics do not match the stereotype fariiier o f this group. In cases wlicrc tlicsc characteristics explain farmers’ strategies to cope with salinity and sodicity. i t i s difficult to rclatc this stratcgy to fann type. I n Table 2.5 farmers’ stratcgics to cope with salinity and sodicity per physical environincnt are related to the pcrcciitagc of fanners iiitcrvicwcd during this study, tliat belong to a certain farin group.
8 80 No plan I 14
2 14 3 29 4 14
3
4
Avoid dcvclopniciit 3 33 9 67
Prevent increase 7 43 8 14 in 14
Prevent and reduce No plan
I I 29 I 100 10 I00
Tlic farin groups opcrnting under pliysicnl condition I A are charncterised by intensive cultivation and a high use o f inputs. I t would bc expected that tlic fanners would iise a lot o f inputs to prevent tlic dcvclopnicnt of salinity aiid sodicity aiid to mitigate tlic cffcct on crop growth. Inst&id, none o f the farnicrs liavc a plan. Ecsidcs that, tlic intcrviewcd fariiicrs do not iiicct the cliaractcristic o f using liigli aiiioiints o f inputs. all o f
5.5
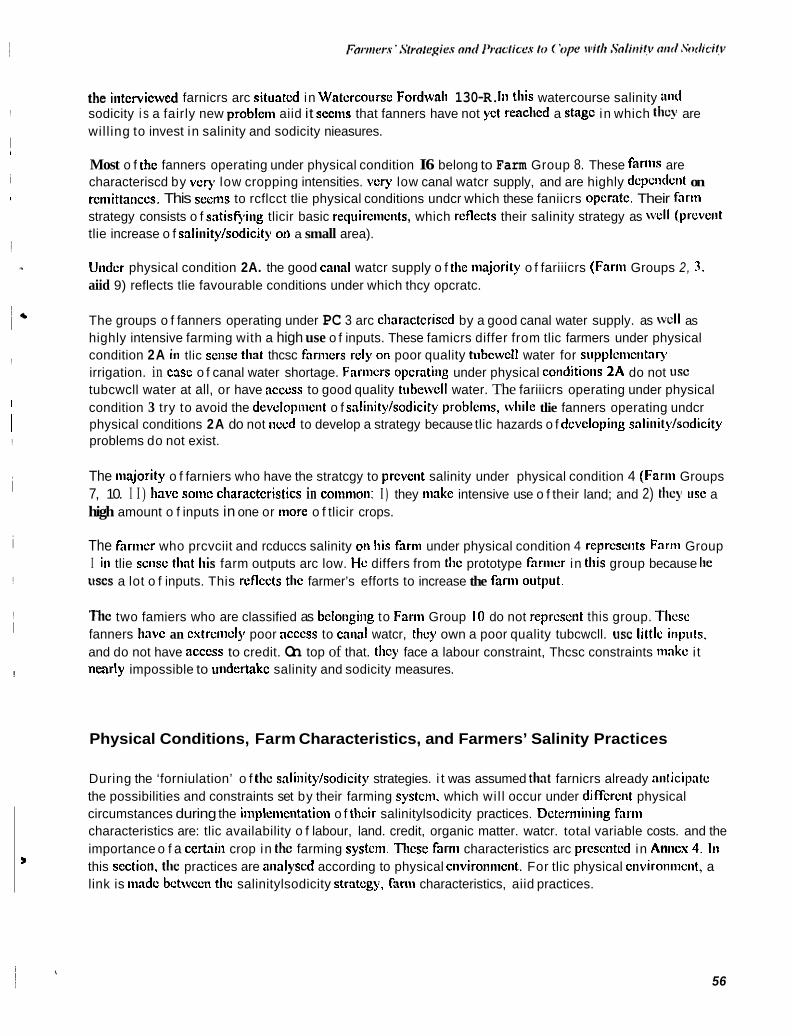
the intcrvicwed farnicrs arc situated in watercourse Fordwall 130-R. 111 this watercourse salinity and sodicity i s a fairly new problem aiid it secnis that fanners have not yet reachcd a stage in which they are will ing to invest in salinity and sodicity nieasures.
Most o f the fanners operating under physical condition I6 belong to Farm Group 8. These f a r m are characteriscd by very low cropping intensities. very low canal watcr supply, and are highly dcpclitlclit on rcniittances. This seems to rcflcct tlie physical conditions undcr which these faniicrs operate. Their farni strategy consists o f satisfjiiig tlicir basic requircincnts, which rcflects their salinity strategy as wcll (prevent
!
~
I ~
i
~
I
, I !
tlie increase o f salinitylsodicity 011 a small area).
Under physical condition 2A. the good canal watcr supply o f the majority o f fariiicrs (Farm Groups 2, 3, aiid 9) reflects tlie favourable conditions under which thcy opcratc.
The groups o f fanners operating under PC 3 arc charactcriscd by a good canal water supply. as well as highly intensive farming with a high use o f inputs. These famicrs differ from tlic farmers under physical condition 2A in tlic sense that thcsc farniers rcly on poor quality tubewell water for supplcmcntar). irrigation. in case o f canal water shortage. Farnicrs opcrating under physical conditioiis 2A do not use tubcwcll water at all, or have access to good quality tubewell water. The fariiicrs operating under physical condition 3 try to avoid the developniciit o f salinity/sodicity problcnis, while tlie fanners operating undcr
~,
~*
~ !
~
~
I
! problems do not exist. ~
I
i
physical conditions 2A do not iiccd to develop a strategy because tlic hazards o f dcvclopiiig salinity/sodicity
The inajority o f farniers who have the stratcgy to prcveiit salinity under physical condition 4 (Fariii Groups 7, 10. I I ) have sonic charactcristics in coninion: I ) they makc intensive use o f their land; and 2) they usc a high amount o f inputs in one or more o f tlicir crops.
The fmi ic r who prcvciit and rcduccs salinity on his firin under physical condition 4 rcprcscnts Farm Group I iii tlie sciisc that his farm outputs arc low. He differs from the prototype fariiicr in this group because he uses a lot o f inputs. This reflccts the farmer’s efforts to increase the farm output.
no two famiers who are classified as belonging to Fami Group 10 do not reprcsciit this group. Thcsc fanners have an cstrcnicly poor access to caiial watcr, they own a poor quality tubcwcll. use little inputs. and do not have acccss to credit. On top of that. they face a labour constraint, Thcsc constraints make i t nearly impossible to undertzikc salinity and sodicity measures.
~
i ~
!
! I ~
~
! !
Physical Conditions, Farm Characteristics, and Farmers’ Salinity Practices
During the ‘forniulation’ o f the salinitykodicity strategies. i t was assumed that farnicrs already anticipatc the possibilities and constraints set by their farming systcm, which wil l occur under diffcreiit physical circumstances during the implemcntation o f thcir salinitylsodicity practices. Dcterniiiiing fanii characteristics are: tlic availability o f labour, land. credit, organic matter. watcr. total variable costs. and the importance o f a certain crop in the farming systciii. These farin characteristics arc prcscntcd in Aiincs 4. I n this section, the practices are analyscd according to physical cnvironnicnt. For tlic physical cnviroiiiiicnt, a link is niadc bctwccii the salinitylsodicity stratcg)’, farni characteristics, aiid practices.
3
56
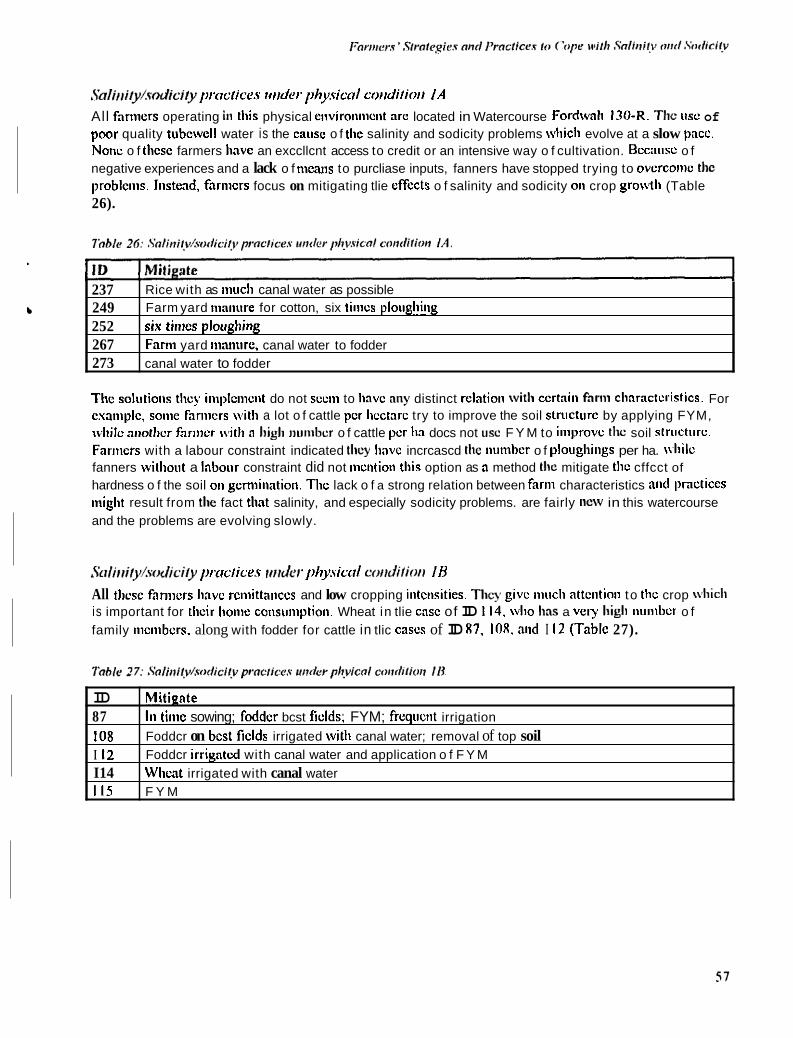
Sdiiii/yLvodici/y proc~ices t d e r physictrl corrdiliorr I A All famicrs operating in this physical environnicnt are located in Watercourse Fordtvall 130-R. The tfsc of poor quality tubcwell water is the caiisc o f the salinity and sodicity problems wliicli evolve at a slow pace. None o f these farmers liavc an exccllcnt access to credit or an intensive way o f cultivation. Bccausc o f negative experiences and a lack o f nicans to purcliase inputs, fanners have stopped trying to ovcrconlc the probleins. Instead, farmers focus on mitigating tlie cffects o f salinity and sodicity on crop growth (Table 26).
237 249 252 267 273
Rice with as mucli canal water as possible Farm yard niaiiure for cotton, six tiincs plougliiny six times ploiigbing Fanii yard ninnurc, canal water to fodder canal water to fodder
Tlic soliltions they implcincnt do not sccin to linvc any distinct relation with ccrtnin farm clrnractcristics. For cxamplc, soinc fnrnicrs with a lot o f cattle per licctarc try to improve the soil structure by applying FYM, while aiiotlwr fnrrncr with n high ~ i ~ i n ~ b c r o f cattle per Iia docs not use F Y M to iinprovc the soil striictiirc. Farnicrs with a labour constraint indicated they liavc incrcascd the nonibcr o f ploiigliings per ha. wliilc fanners without a labonr constraint did not nicntion this option as n method the mitigate thc cffcct of hardness o f the soil on geniiination. The lack o f a strong relation between farm characteristics and Imactices iniglit result from the fact that salinity, and especially sodicity problems. are fairly new in this watercourse and the problems are evolving slowly.
ID 87 108 I 12 I14 11.5
Strlirrily/sodici/y prrc1ices rlrrder~ pl1ysictrl colrdilioll IR All tlicsc fnmicrs Iinvc rciiiittnnces and low cropping iiitcnsities. They givc niiicli attention to tlic crop \\,liich is important for tlicir lioine co~isi~mptiori. Wheat in tlie case of ID 114. who has a vciy high nuiiibcr o f family mcnibcrs. along with fodder for cattle in tlic cases of ID 87, IOX. and I 12 (Table 27).
MitiEate 111 tinic sowing; fodder bcst ficlds; FYM; frequcnt irrigation Foddcr on bcst fields irrigated with canal water; removal of top soil Foddcr irrigatcd with canal water and application o f F Y M Wheat irrigated with canal water F Y M
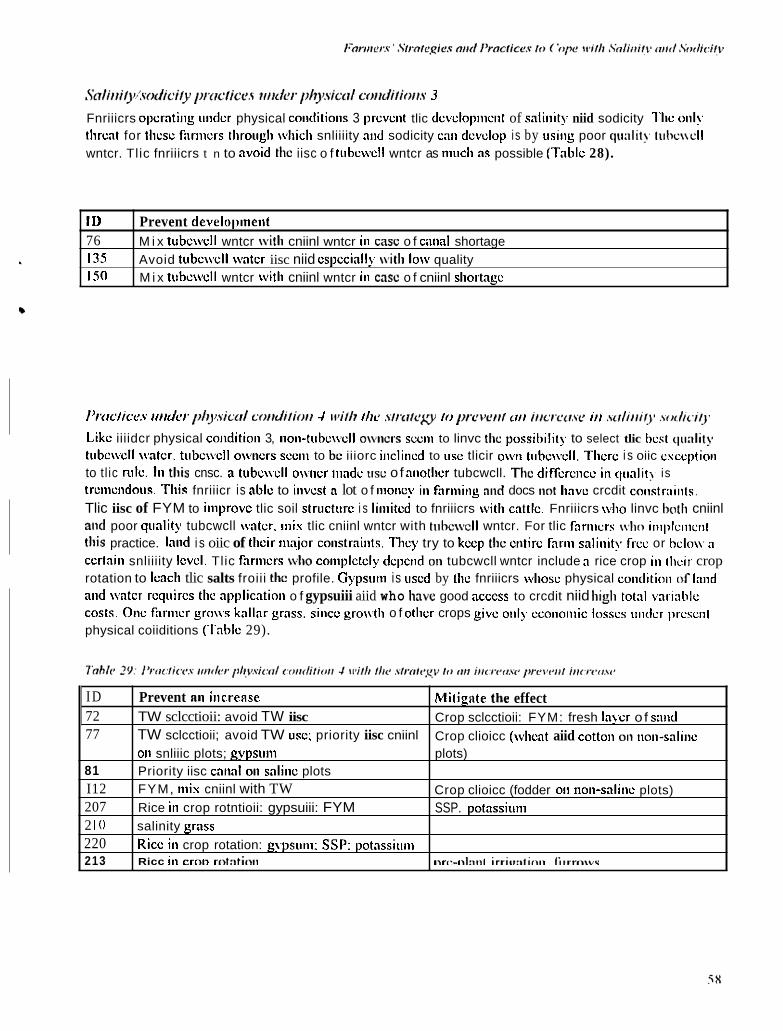
.%l / l I / i~~:FfJdiCi / )? /)/'trCliCl,.V l / / i t k / ' />h)?.viCt1/ Co//dilio/i.V 3 Fnriiicrs opcrntiiig iiiidcr physical coiiditioiis 3 prcvciit tlic dcvclopiiiciit of salinity niid sodicity Tlic oiily tlircnt for these fiiriiicrs throiigli wliicli snliiiity :uid sodicity cnii develop i s by iisiiig poor qu:ilit!. t i i lx\ \cl l wntcr. Tlic fnriiicrs t n to avoid the iisc o f tiibcwcll wntcr as iiiiicli ns possible (Table 28).
ID 76 13s I S 0
Prevent developinelit M i x tiibcwcll wntcr with cniinl wntcr iii case o f caiinl shortage Avoid tiibc\vcll water iisc niid especially with low quality M i x tubc:\vcll wntcr with cniinl wntcr iii case o f cniinl sliortngc
I'r'trclices ritidiv plgi,victd coirdi/iori 4 i v i / / i /lit , s / / r r / q y lo prciwiit ciii i i i u z t w i i i . v c i / i r i i ~ ~ ~ .so(/ic.iiJ'
Like iiiidcr physical coiiditioii 3, iioii-tubc\vcll o\\'iicrs scciii to linvc the possibilit). to select tlic best cltiality tcibcwcll wntcr. tubcwcll o\viicrs scciii to be iiiorc iiicliiicd to iise tlicir owii tubc\vcll. Tlicrc i s oiic cxccptioii to t l ic nilc. 111 this cnsc. n tubc\vcll owiicr iiindc use o f niiotlicr tubcwcll. The difference iii qunlit!. is trciiiciidoiis. This fnriiicr is nblc to iiivcst n lot o f iiioiicy ill fnriiiiiig mid docs not linvc crcdit coi1str:iiiits. Tlic iisc of FYM to improve tlic soil structure i s liiiiitcd to fnriiicrs with cnttlc. Fnriiicrs wlio linvc both cniinl a id poor qiinlity tubcwcll water. iiiix tlic cniinl wntcr with tiihc\\d wntcr. For tlic fari i icrs who iiiiplciiictit this practice. hiid i s oiic of their iiinjor coiistrniiits. They try to keep the ciitirc fnriii snliiiity frcc or hclow n ccrtniii snliiiity IcvcI. Tlic fanners who coiiiplctcly dcpciid oil tubcwcll wntcr include n rice crop iii tlicir crop rotation to lcncli tlic salts froiii the profile. Gypsuiii is used by the fnriiicrs wliosc physical coiitlitioii or Innd aiid w t c r requires thc npplicntioii o f gypsuiii aiid who lime good acccss to crcdit niid high total vnriablc costs. Oiic fnriiicr g r o w knllar grass. siiicc gro\\th o f otlicr crops give oiily ccoiioiiiic losscs iiiidcr prcsciit physical coiiditions (Tnblc 29).
I D 72 77
81 I12 207 2 I0 220 213
Prevent a11 increase TW sclcctioii: avoid TW iisc TW sclcctioii; avoid TW use: priority iisc cniinl
Priority iisc caiinl oii snliiic plots FYM, iiiis cniinl with TW Rice iii crop rotntioii: gypsuiii: FYM salinity grass Ricc iii crop rotation: gvpsiiiii: SSP: potnssiuin
Mitignte the effect Crop sclcctioii: FYM: fresh Inycr o f saiid Crop clioicc (wlicnt aiid cottoii on iioii-snliiic
011 snliiic plots; gypsiiiii plots)
Crop clioicc (fodder oii iioii-snliiic plots) SSP. potassium
Ricc in crnii rnt:itim nn.-nt:~ni irriixitiiiii l ' ~ ~ v r , n u ~
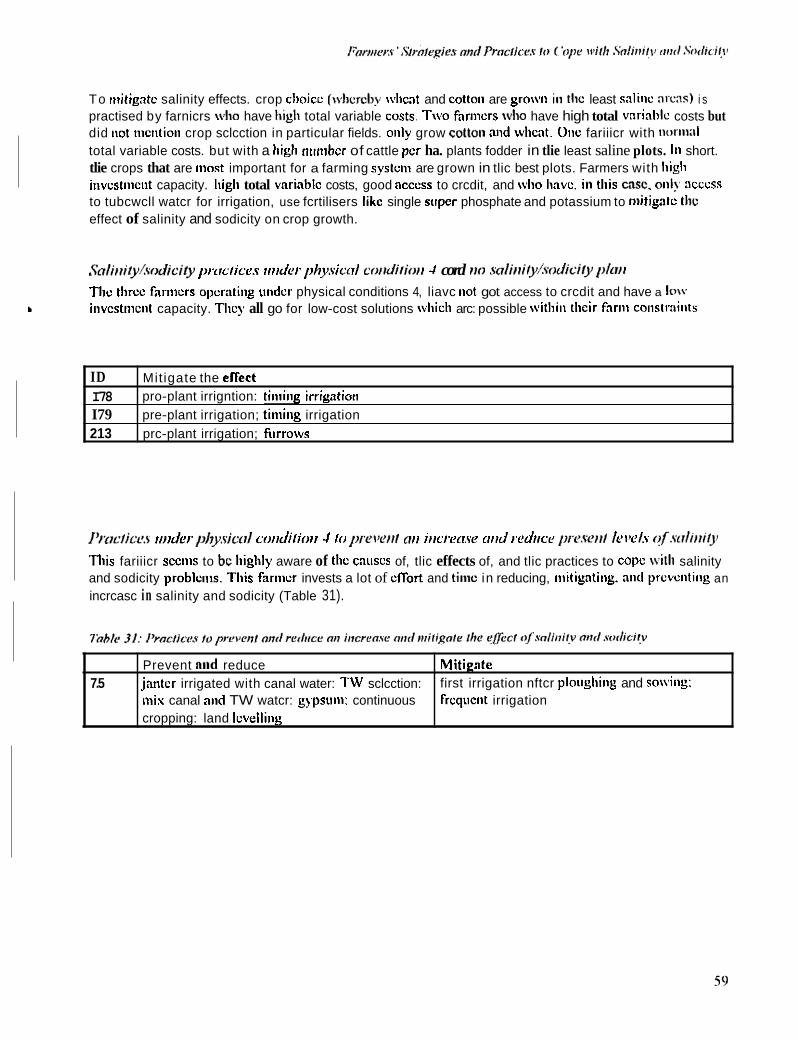
To mitigate salinity effects. crop clioicc (\vIicrcby \ \ h a t and cotton are grown ill the least salinc nl-c:is) i s practised by farnicrs who have high total variable costs. Two fariiicrs who have high total vnriablc costs but did not tiictitioii crop sclcction in particular fields. only grow cot to^^ and whcat. Oiic fariiicr with IIO~III~II total variable costs. but with a high tiurribcr of cattle per ha. plants fodder in tlie least saline plots. In short. tlie crops that are iiiost important for a farming system are grown in tlic best plots. Farmers with liigli invcstiiiciit capacity. high total variablc costs, good access to crcdit, and who Iiavc. in t l i is GISC. od!, :icccss to tubcwcll watcr for irrigation, use fcrtilisers likc single supcr phosphate and potassium to niitigatc the effect of salinity and sodicity on crop growth.
ID I78 I79 213
Snlitri/yhdiciry prrc/ices iriider physictrl cotidi!ioti 4 cord 110 snliiri/yhodici!y plLrtt Tlic tlircc farnicrs opcratiiig under physical conditions 4, liavc not got access to crcdit and have a low invcstnicnt capacity. They all go for low-cost solutions wliicli arc: possible within their farm coiistraiiits
Mit igate the effect pro-plant irrigntion: tiniiiig irriyatiori pre-plant irrigation; timing irrigation prc-plant irrigation; fiirrows
~ ~~~~~
Prevent a i d reduce jantcr irrigated with canal water: TW sclcction: i i i ix canal and TW watcr: gypsuiii: continuous cropping: land Icvelling
7.5
I’mc/iccs wider phyyicol cotidi/iotr 4 /o prewtt/ trtr itrcrerrw tirid reditcr ~ W . W I / 1evel.v o / . w / i t t i / y
This fariiicr seciiis to be highly aware of the causcs of, tlic effects of, and tlic practices to cope with salinity and sodicity problcnis. This fariiicr invests a lot of effort and time in reducing, niitigatiiig, and ptcvcnting an incrcasc i n salinity and sodicity (Table 31).
Mitignte first irrigation nftcr plougliiiig and sowiiig: frequent irrigation
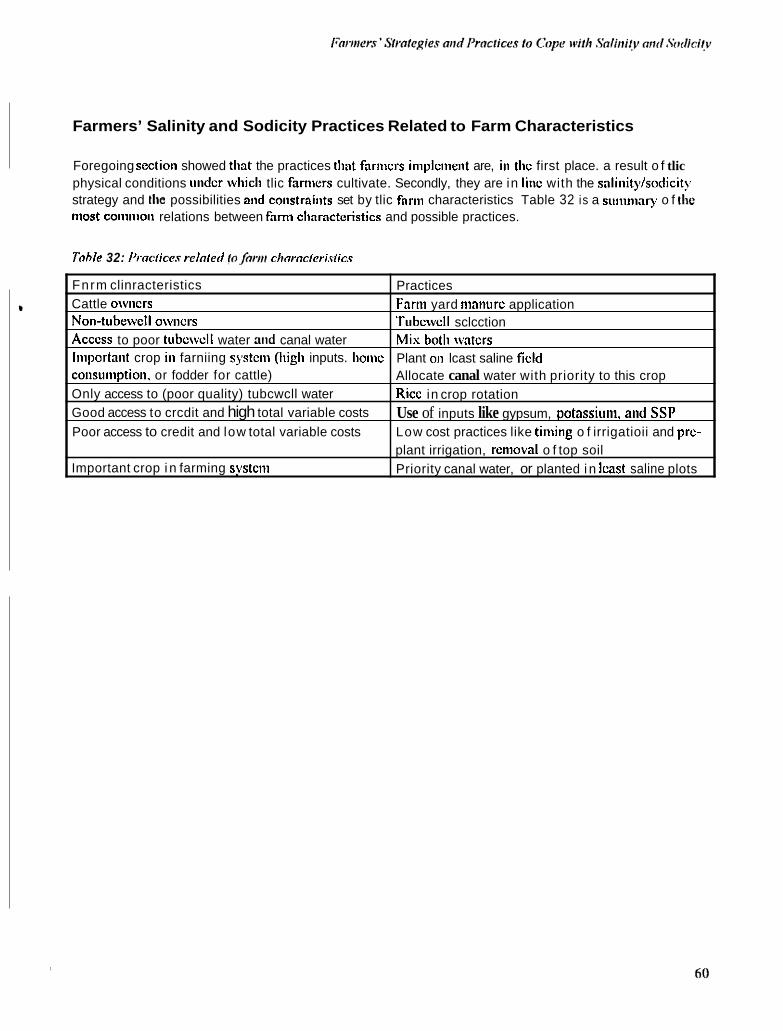
Farmers’ Salinity and Sodicity Practices Related to Farm Characteristics
Foregoing sectioii showed that the practices that farniers implement are, iii the first place. a result o f tlic physical conditions under \vliicIi tlic faniiers cultivate. Secondly, they are in l ine with the salinity/sodicity strategy and the possibilities and cotistraints set by tlic farm characteristics Table 32 is a suniniary o f the niost coiiinion relations between fnrni charncteristics and possible practices.
Fnrm clinracteristics Cattle owncrs Non-tubewell owiicrs Access to poor tubcwcll water and canal water Iniportant crop i i t farniing system (high inputs. honic consuinption. or fodder for cattle) Only access to (poor quality) tubcwcll water Good access to crcdit and high total variable costs Poor access to credit and low total variable costs
Important crop i n farming systctii
Tbhle 32: l’rncliccs relnled lo.fnriir chornclcri.rlics
Practices Farni yard nianiirc application Tubcwcll sclcction M ix both waters Plant 011 lcast saline field Allocate canal water with priority to this crop Ricc in crop rotation Use of inputs like gypsum, potassiuni. and SSP Low cost practices like timing o f irrigatioii and prc- plant irrigation, removal o f top soil Priority canal water, or planted i n lcast saline plots
Chapter 5
Farmers’ Ability to Cope with Salinity under Improved Water Supply
,
Tlic forcgoiiig clinptcr dciiioiistrntcd that fnriiicrs’ snliiiity atid sodicity strategies arc. iii tlic first place. rc lntd lo thc pliysicnl atid irrigntioii eiiviroiiiiicnt and, in tlic sccoiid plncc. to tlic possibilities and coiistraiiits o f tlieir farming systciiis. I n this chapter. tlic abilities o f fnriiicrs to improve their snliiiity niid sodicity iiinnngciiiciit iiiidcr iiiniingciiiciit iiitcrvciitioiis at liiglicr lcvcls o f tlic irrigation systciii will cvnliintcd. The four wntcrcoiirscs that rcprcsciit the foitr snliiiisntioii niid sodificntioii proccsscs nil1 he rincd for this piirpose.
Watercourse Fordwah 14-R
Currciitly. two proccsscs play a role in tlic snliiiisation o f this watercourse: I)saliiiisntioillsodificntioii due to tlic use of poor qunlity tubcwcll wntcr; and 2) snliiiisntioidsodificntioii due to capillary rise from Iiigli snliiic- sodic ground wntcr tnblcs. Uiidcr iiiiprovcd cniinl wntcr supply. the fariiicrs in tlic iiiiddlc o f the \vntcrcoitrsc would usc less tubcwcll water. Fnrtiicrs iii this nrcn try to cope with snliiiity by selecting the best qitnlity tube\rcll \rater atid iiiisiiig cniinl \rater with tubcwl l wntcr. Sonic of tlie farmers iii the iiiiddlc o f tlic wntercoursc linvc good access to credit niid linvc high total variable costs. Thcsc fnrnicrs \vould be nblc to coiitrol snliiiily niid sodicily with n liigli use of‘niiiciidtiiciils iiiidcr prcsciit coiiditioiis. Tlioiigli. \vlicIIicr l l t is i s finniicinlly feasible dcpciids largely on the actiinl ~ C C C S S to cniinl wntcr niid the quality o f tiibc\vcll wntcr nvnilnblc. Also. tlic nvailnbility o f gypsuiii on tl ic iiinrkct would be important. Ail incrcnsc iii c:iii;tl witcr siipply will iiiiprovc the overall irrigntioii water qunlity. Espccinlly faniicrs with n credit constraint. tlicy will be bcttcr ariiicd to cope with the snliiiity/sodicity problciiis.
For faniicrs froiii tlie ta i l nrcn, where cnpillnry snliiiisntioii plays n major role mid wlicrc good t u h c w l l w t e r is iiot directly nvnilnblc. iiiiprovcd cniinl wntcr supply will help to cope with tlic saliiiity. Tl ic cxpcricncc frotii wntcrcoitrsc Aziiii 20-L sliowcd tlint fnriiicrs arc nblc to grow crops ittidcr coiiditioiis with liigli snliiic ground ivntcr tnblcs. An iiiiportniit coiiditioii is tlint tlic dcptli o f wntcr tnblc a l low siiffcictit aeration of the root zotic niid tlint cniinl wntcr i s rcgiilnrly nvnilnhlc to iiiniiitniii n do\riiwnrd flow of m t c r tliroiigli tlic root zoiic. At plnccs \ h r c tlic water tnblcs arc too,slinllo\v to nlloiv sufficient acrntioii o f tlic root zoiic. iiiiprovcd cniinl water siipply will iiot iiiiprovc crop prodiictioii. as tlicsc fnriiicrs do iiot linvc tlic capability lo pay for n draiiinge system, aiid iiiniiy farmers arc tciiwts wlio do iiot iiivest iii loiig-tcriii projects.
hl
Watercourse Fordwah 130-R
The saliiiisation aiid mainly sodificatioii i t i Watercourse Fordwnli 130-R is caused by the iisc of poor qcinlity tiibc\vcll water. Tccliiiically. tlic sitiintioii cnii be iiiiprovcd by tlic iisc o f aii cstrciiicl!. liigli :iiiiouiit o f amcndmcnts. Nooc of tlic intcrvicwcd fariiicrs hnvc good csccss to crcdit or nii iiitciisivc way of fariiiiiig. Though iiiiprovciiiciit o f tlic ciirrciit water quality is tecliiiically possiblc. tlicsc fariiicrs would iiot bo able to cope with the saliiiity aiid sodicity due to a liiiiitcd availability o f rcsoiirccs. liiiprovcd ciiiinl \vatct sitppl!, wil l iiiiprovc tlic quality o f the used irrigation water substaiitially. whicli would Icsscii tlic required iiiputs. With tlic required know-how, fariiicrs will bc nblc to coiitrol (lie situation. Aiiotlicr coiiditioii \vo~iId bc t1i;it
gypsutn i s availablc iii tlic iiiarkct.
Watercourse Azim 11 1 -L
Tlic liistoricnl aiinlysis of Ilic snlinity aiid sodicity situntioii lins sliowii tlint ciirrciit problciiir atc 1:irgcIy related lo the iisc of poor quality tubewell water iii tlic absciicc o f cam1 water. Soiiic of the larger fattiicts with a good invcstiiicnt capacity arc obtniiiiiig high yields with n high iisc of iiiputs. Sninll fariiicrs. or fnrtiicrs \v i l l i low iiivcstiiiciit capacity. wi l l gain iiiost froiii iiiiprovcd canal water supplics. Tlicsc f:it~iiicrs try to cope with salinity and sodicity by iiitcgratiiig ricc or a salt-tolerant grass iii tlic crop rotntioii. Oflict low cost optioiis like prc-plant irrigatioii and plaiitiiig oil fiirrows. arc practised as \vcII as. Tlic effects of sodicity 011 tlic iiiitriciit uptake by tlic crop arc not reduced iii this way. Tlic salinity is kept low. but sodicity keeps buildiiig up. Uiiless thcy gct acccss to better quality tiibc\vcll water. thcsc fnriiicrs wil l iicvcr hc ahlc to coiiipciisate fiilly for the effects o f sodicity oii crop growth. Under iniprovcd cniinl water supplics. llic initial saliiiity and sodicity has to bc reduced. This caii bc donc citlicr by low cost. but tiiiic coiisuiiiiiig practices. or by the i isc o f gypsuiii or acids for wliicli cnsli iiccds to be availablc. Also. tlic iiiputs i i c d to be available iii the iiiarkct.
Watercourse Azim 20-L
Salinity aiid sodicity dcvclopcd during long fallow periods tliroiigli capillary rise froiii higli (saliiic) groiiiid water tablcs. Fariiicrs who Iiavc bccii cultivntiiig tlicir Iancl coiitiiiuoiisly did iiot cxpcriciicc aiiy saliiiitykodicity problciiis. Tliis watcrcoursc, bciiig sitiiatcd at tlic licad o f tlic distributary, receives :i good cniinl water supply. At prcsciit. fnriiicrs arc rcdiiciiig snliiiity mid sodicity lcvcls b!. lcncliiiig tlic s:iIIs uriiig good quality canal water uiidcr tlic cultivatioii o f kallar grass and ricc. Iiiiprovciiiciit in caiinl water s~ipplics arc iiot required in this \\'atcrcotirsc. Problciiis with wntcrloggiiig wil l rciiiniii i i i i loss oiviicrs wil l collcclivcly invest iii drninagc fncilitics.
62
Chapter 6
Conclusions and Recommendations
Conclusions
/~Cil’li lL’~,S ’ [JCl’W/>/ i f ) l l ,S 01111 ,SCd;lIl!)J Cllld SOdlCi!)J
Farmers have a good set of physical and crop appearance indicators to rccogiiisc different salinity and sodicity processes and types o f salinity. Fnriiicrs dcfiiic five different salinity and sodicity iinits. and one unit for idciitifyiiig watcrloggcd coiiditions. Coiiiparison bctwccii tlic fariiicrs’ classificatioii system and tlie USSL soil classification system sliowcd that saline and sodic propcrtics, as defined by the fariiicrs, occiir under coiiditioiis wliicli would bc classified as noti saline - no11 sodic by tlic USSL classification system Evaliiatioii of farniers‘ classification on tlic basis ofotl icr indicators sliowcd that tlic ratio ECJSAR is a good indicator for ‘hardiicss‘ in tlic soil. Tlic ‘tlircsliold‘ valitcs below wliicli soils’nrc classified as being ‘hard‘ differ per tcxtiiral class. Coarser textured soils liave a lower tlircsliold value tlinli finer testtired soils. The occiirrciicc of ‘white salinity’ is related to tlic EC, value of tlic soil but not to tlic Icshiral class. Fnriiicrs clnssifj tlic salinity liaznrds o f irrigation water in a siiiiilar way as tlic F A 0 irrigatioii water classification systciii docs. Wlicii tlic EC in tlic irrigation water increases, tlic cliaticcs of dcvclopiiistit of soil salinity iiicrcascs. Tlic sodicity hazards induced by tlic iisc of irrigation water docs not corrcspoiid with the FA0 classification systciii. Water wliicli is not cspccted to crcatc sodicity problciiis according to tlic F A 0 systciii iiiight crcatc sodicity problciiis according to fariiicrs‘ cspcriciiccs. Tlic csplor:itioii o f different paraiiictcrs to csplaiii tlic fariiicrs‘ classificatiott systciii dciiiotistratcd that Ioiig-term sodicity problciiis. rccogniscd by the fariiicrs as ‘Iiardticss’ in tlic soil, can bc predicted by tlic RSC and EC lcvcls in tlic irrigation water. Infiltration problciiis, wliicli arc rccogniscd instantancously by tlic farmers tliroiigli standing water on the soil surface, can be predicted by tlic EClSAR ratio o f 1111: irrigation water. Tlic ‘tlircshold’ values for tlicsc pliciiomcna differ by textural group. Saline or saline-sodic conditions are easier to manage and decrease for the farnicrs tliaii sodic conditions.
/+riiier.v * ,s/rcirqies tit id proc/icc.s /o CII /JC i v i / / i . ~ f l / i i i i / ) i ~ . s f ) ~ i c i ~
Due to their tcniporarily rights OII the land (oneti lease contracts arc niadc-up for one year). tsti:itits do not have a strategy to prevent or reduce saliiiitylsodicity. Tlicy t n to tiiitigatc tlic effect 011 crop grwtli. For land o\viicrs. tlic snlinity/sodicity strategy i s related to tlic physical and irrigatioii ciiviroiiiiiciit. Only under coiiditioiis where i t depends largely on tlic fariiiiiig activities in wliicli direction the salinitylsodicity dcvclopiiictit will niovc; farming strategies. possibilitics. and coiistraiiits start to play an important role i t t
tlic ‘forntulatioii’ of tlic salinity/sodicity strategy.
63
s
Farmers with large iiivcstment costs try to prcvcot an iiicrcase iii salinity and sodicity, or even try to decrease saliiiity/sodicity. Under conditions where land i s not a constraint, but liiiiited availability o f resources prcvciit farmers froiii having liiglily iiitcnsivc farniing. faniicrs tend not to have plaiis to control salitiitylsodicity. Most o f tlicse fanncrs try to mitigatc tlic effccts on crop gro\dIi A link is made between fariii typology aud salinity/sodicity strategy according to the physical and irrigation environiiieiit. Due to heterogeneity o f farm cliaractcristics within one group, i t was iiiipossible to niake a link for all individual farms between firiii type atid stratcgy. The salinity/sodicity practices that famiers implemcnt are, iii tlie first place, a result o f tlie physical aiid irrigation environment. Secondly, they are in line with tlie strategy, possibilities. and constrailits sct by the fanning system.
Forttiers ’ ohili/y lo cope wi/h strlittiiyhdiciiy tittiler itttpr.o\jed cotlo1 iilo/er sttpply At prcsciit. farmers in iiiaiiy areas nrc ablc to cope with salinity and sodicity. This arc mostly fariiicrs with good access to canal water, or canal water supplciiicnted by good quality tubcwcll water I n places whcre tlie use o f tubewell water niiglit cause salinitylsodicity problenis, i t are mostly tlic faniicrs with good investment capacity who are able to control salinity/sodicity and mitigate the effects on crop growth. Especially famiers with limited farm resourccs wil l bciicfit froiii improved caual water supplies
~ ~ I h h r ~ d o / o ~ Participatory Rural Appraisal techniques. aiid iii particular iiiapping exercises. are very usefiil to obtain a quick insight into current saliiiityhodicity problems and processes For the intcrpretation o f farmers’ perceptions, strategies. and practices, additional data 011 soil. water, aiid ground water, as well as socio-economical information, i s indispensable.
Future Research
This study has shown that sodicity related problems form a larger tlircat to sustained crop production than saliiiity. 111 this study. at1 atteiiipt was made to coiiie up with new ‘paraiiictcrs’ nnd ’guidelines‘ to relate sodicity in soil aiid water to soil degradation. The ‘guidcliiics’ and ‘parameters’ based oii fariiicrs‘ perceptions could be used as a starting point for aii in-depth pliysical-chemical research program. In areas wliere salinity/sodicity i s a fairly new problem, wliich is induced by the use o f poor quality tubcwcll water, farnicrs rcquirc detailed guidcliiics and field denionstratioiis 011 tlic use of soil atid water amendments to counteract tlie effects of sodicity 011 soil and crops. In cases wliere salinity is the iiiajor concern, guidcliiics and field dcmoiistrations should iiicludc improved irrigation nianngcnicnt. T o be ablc to compile these guidelines and to set the demonstrations. field trials are rcquircd. More research should be done on low cost altcrnativcs to enable poorer farnicrs to control salinity and sodicity. There i s a strong dcniaiid to search for high value crops which can be grown during soil rcclaiiiatioii or under highly saline-sodic conditions.
64
List of References
Agassi. M.. Morin, 1.. and Schainberg. I., 198 I . Effect of Electrolyte Concentratioii and Soil Sodicily on
Asif, S.. and Ashnf, S., 1996. Spatial Analysis of Irrigation Water Supply Pcrfomiancc: a Case Study i n
Aycrs, R.S. and Westcot, D.W., 1985. Water Quality for Agriculture. FA0 Irrigation and Drainagc Paper:
Bastiaansen. A.P.M.. 1992. Irrigation Scheme Design for Sustainable Use. In: A.P.M. Bastinansen
Infiltration Rate and Crust Formation. Soil Science Society of America, 45: 848-85 I ,
the Fordwah 14-R Command Area. lnternational Irrigation Management Institute. Lahore. 10%
No. 29. FAO. Rome. 184 pp.
(Editor). The User in the Design Process. Wageningen Agricultural University. Wngcningcn. pp I - 12.
Crescinianno, 0.. lovino, M. and Giuscppe, P.. 1995. lirflucncc of Salinity and Sodicity on Soil Structural and Hydraulic Characteristics. Soil Science Socicty of America, 59: I 7 0 1 -1 70R.
Dircctorete General for International Cooperation and Federal Ministry of Water and Power. 1004. Managing Irrigation for Environmental Sustainable Agriculture in Pakistan. Project documcut Governmcnt of Tlic Netherlands, 47 pp.
Press. Cambridge, 241 pp.
Development. Report of the conference. FAO, Rome, 64 pp.
Scale lrrigntioii Systcnis in an Integratcd Approach: Application to tlic Chistinn Suh-Divisirm Pnper Presented at the Eleventh International Programme Review, International Irrigation Managcmcnt Institute. Colombo, 1996.
lllitc Suspensions Using Elcctron Microscope. In: W.W. Emerson, R.D. Bond, and A.R. Dcutcr (Editors):Modifacations of Soil Structure. John Wilcy and Sons, New 'fork. pp. 35-40.
Hardic and Eugster. 1970. In: Apollo, C.A.J. and Postma, D., 1994. Geochemnistr)., Ground\tater and Pollution. A.A. Bakema, Rotterdam, 536 pp.
Janssen. B.H. and Bcusichem, M.L.. 1991. Nutricnten in Bcdem-Plant Relaties. Wagcningcn Agricii~lurat University. Wagcningcn. 353 pp.
Kiclcn, N., Fanners' Perccptions on Salinity and Scdicity: a Case Study into Famiers' Knowlcdgc of Salinity and Sodicity. and their Strategies and Practices to deal with Salinity and Sodicity i n tlicir Farming Systcnis. International Irrigation Maaagcment Institute, Lahore. 1996.
Ellis. F.. 1988. Peasant Economics: Farm Household and Agrarian Dcvclopmcnt. Cambridge Uniwrsit!
FAO. 1991. The Den Bosch Dcclarations and Agenda for Action on Sustainable Agriculturc and Rural
Garin. P.. Habib. 2.. Kosuth. P.. Kupcr, M., Riaz. K.. Skogcrbw, G., and Strosscr. P. Analyzing Large-
Grccne. R.S.B., Posncr, A.M., and Quirk, J.P., 1978. A Study of the Coagulation of Moritmorillonitc and
Marlct. S.. 1996. Personal communication. Mchanni. A.H.. and Chalmcrs, D.I., 1986. Effect of Irrigation with Saline Water on Soil Properties ant1
Salinization of Pcrennial Pasture Soils. Australian Journal of Expcriinental Agriculture. 26: 173-1 79. Merrey, D. and Wolff, M., 1986. Irrigation Management in Pakistan. Four Papers. Intcmational lrrigntioii
Manigemcnt Institute rcscarch paper no. 4. lnternational Irrigation Managcmcnt Institute. ('olombo. Ostcr, J.D., and Schoer, F.W., 1979. Infiltration as lnflucnced by Irrigation Watcr Quality. Soil Scicncc
Society of America Journal, 43: 444-447. Rnmzani. M., 1996. Pcrsoiial communication.
65
! List of1lcJcrencc.v
Rengasamy, P., Greene, R.S.B., Ford, G.W., and Mehanni, A.H., 1984. Identification of Dispersive
Rengasamy, P., and Mehanni, A.H., 1988. Application of the Threshold Concentration Concept to
Rengasamy, P. and Olsson, K.A., 1991. Sodicity and Soil Structure. Australian Journal of Soil Rcscarch,
Rengasamy. P. and Olsson, K.A., 1995. irrigation and Sodicity: an Overview. In: Naidu, R., Suniner, M.E., and Rengasamy, P. (editors). Australian Sodic Soils: Distribution, Properties and Management. CSIRO, Melbourne, 35 I pp.
Richards, LA. , 1954. Diagnosis and Improvement of Saline and Alkali Soils. Agricultural handbook U.S.D.A. No. 60. United States Departnient of Agriculture, Washington, DC., 160 pp.
Rinaudo, J., 1994. Development of a Tool to Assess the Impact of Water Markets on Agricultural Production i n Pakistan. Thesis. Montpellier, 104 pp.
Schainberg, I., Sumner, M.E., Miller, W.P., Farina, M.P.W., Parvan, M.A., and Fey, M.V., 1989. Use of Gypsum on Soil: a Review. Soil Science Society of America Journal 56: 278-283.
SO, H.B., and Aylmore, A.G., 1993. How do Physical Soils Behave? The Effect of Sodicity on Soil Physical Behaviour. Australian Journal of Soil Research. 3 1: 761-777.
Soil Survey of Pakistan, 1996. Soils of Eight Watercourses of Azim and Fordwah Distributaries. Unpublished report. Lahore, 28 pp.
Sumner, M.E., 1993. Sodic Soils: New Perspectives. Australian Journal of Soil Research, 3 I : 683-750. Winiger, 1983. Cited in: Ives, J. D., and Messerli, B., 1984. Stability and Instability of Mountain
Behaviour and Management of Red-Brown Earths. Australian Journal of Soil Research, 22: 413-43 I
Irrigation with Saline Water. Soil Use and Management, 4: 123-127.
29: 935-952.
3
v
Ecosystems: Lessons Learned and Recommendations for the Future. Mountain Research Development, 4(1): 63-71,
66
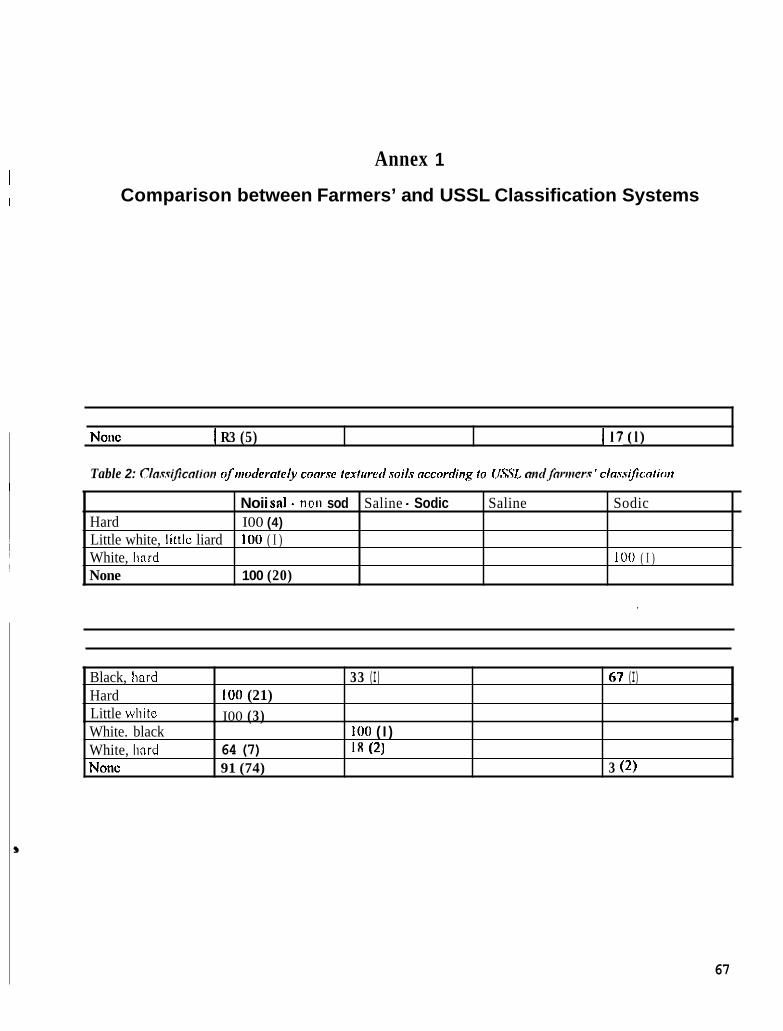
Annex 1
Comparison between Farmers’ and USSL Classification Systems I I
None I R3 (5) 117 ( 1 )
Table 2: Ctn.~,sijcnlioii nf iiindern~ely conr.sc lcxliircrl soils nccnrding lo 1JSSL niid,fninier.~ ’ clnr.s$cnlinn I
Noii sal - noii sod Saline - Sodic Saline Sodic Hard I00 (4)
i !
!
67
Little white, littlc liard White, liard 100 ( I ) None
100 ( I )
100 (20)
Black, liard Hard Little wliitc
33 (I) 67 (I) 100 (21) I00 (3) .
White. black White, hard None
100 ( I ) 64 (7) 18 ( 2 ) 91 (74) 3 (2 )
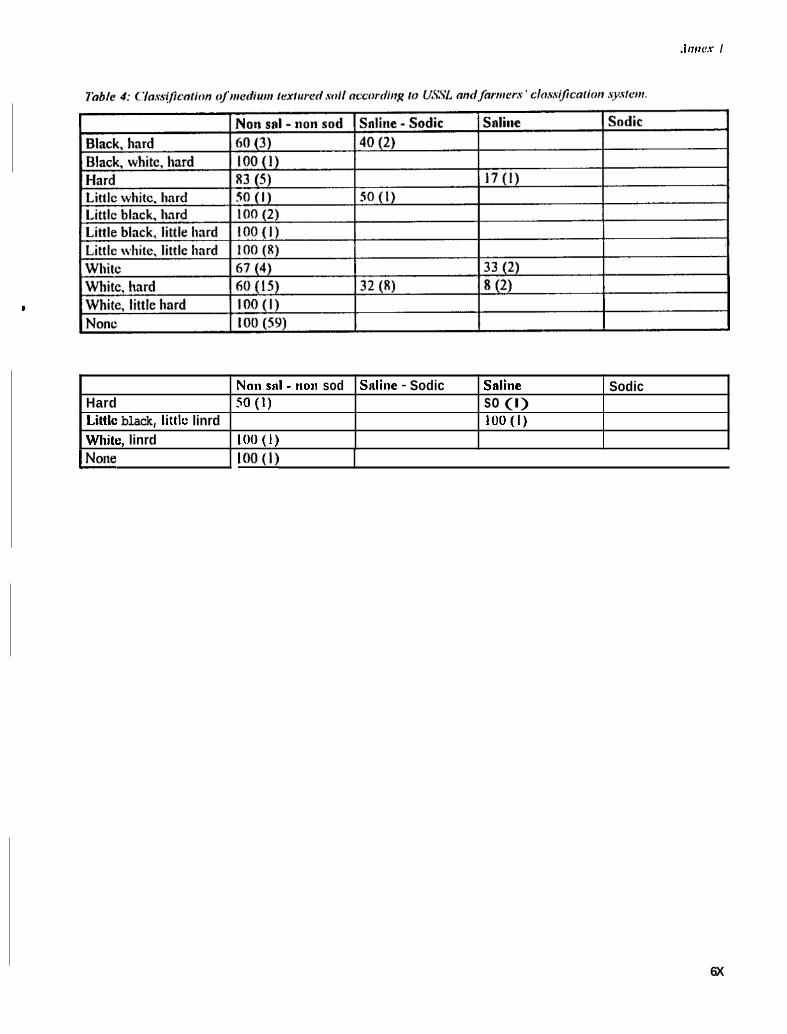
. Innex I
Noti snl - i ioi i sod Snliiie - Sodic Saline Hard S O ( l ) so (I) Littlc black, littlc linrd l O O ( l ) Whitc, linrd I O O ( l )
Sodic
6X
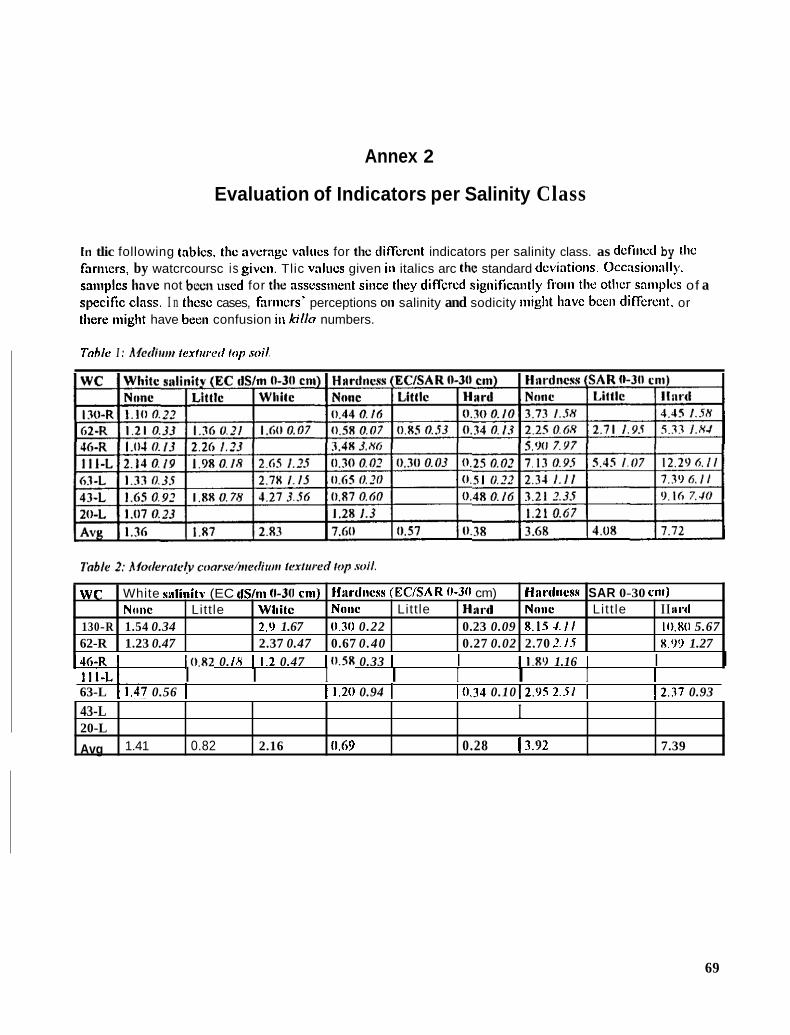
Annex 2
Evaluation of Indicators per Salinity Class
~
WC
130-R 1.54 0.34 2,') 1.67 62-R 1.23 0.47 2.37 0.47
White srlinitv (EC clS/ni (1-3U cni) Niinc Little White
In tlic following tables. tlic average vnlncs for the diffcrcnt indicators per salinity class. as defined by tlic fariiicrs, by watcrcoursc is given. Tlic values given iii italics arc the standard dcviatioiis. 0ccasioii:illy. saiiiplcs have not been uscd for the assessnient since they diffcred significaiitly froiii the otlicr san~plcs of a specific class. I n these cases, farnicrs' perceptions 011 salinity and sodicity iiiiglit liave bcen differciit. or tliere iiiiglit have been confusion iii killn numbers.
Tnhle I : A4cdirrai Icxlrrrcd top soil.
~~~~ ~~ ~
Hwtlncss (EC/SAR 0-30 cm) Nene Little Hard Ncnie Litt le I I i t rtl
0.30 0.22 0.23 0.09 8.15 4.11 I 0 . X O 5.67 0.67 0.40 0.27 0.02 2.70 2.1.5 X.99 1.27
Harclncss SAR 0-30 cnr)
43-L 20-L
Avg
146-R I IO.X2 0. I X I 1.2 0.47 I 0 . S X 0.33 I I I l .XI) 1.16 I I I
I 1.41 0.82 2.16 0.69 0.28 13.92 7.39
I l l - L I I I I I I I I I 63-L 11.47 0.56 I I1 .20 0.94 I I0.34 0.10 12.05 2 3 1 I 12.37 0.93
69
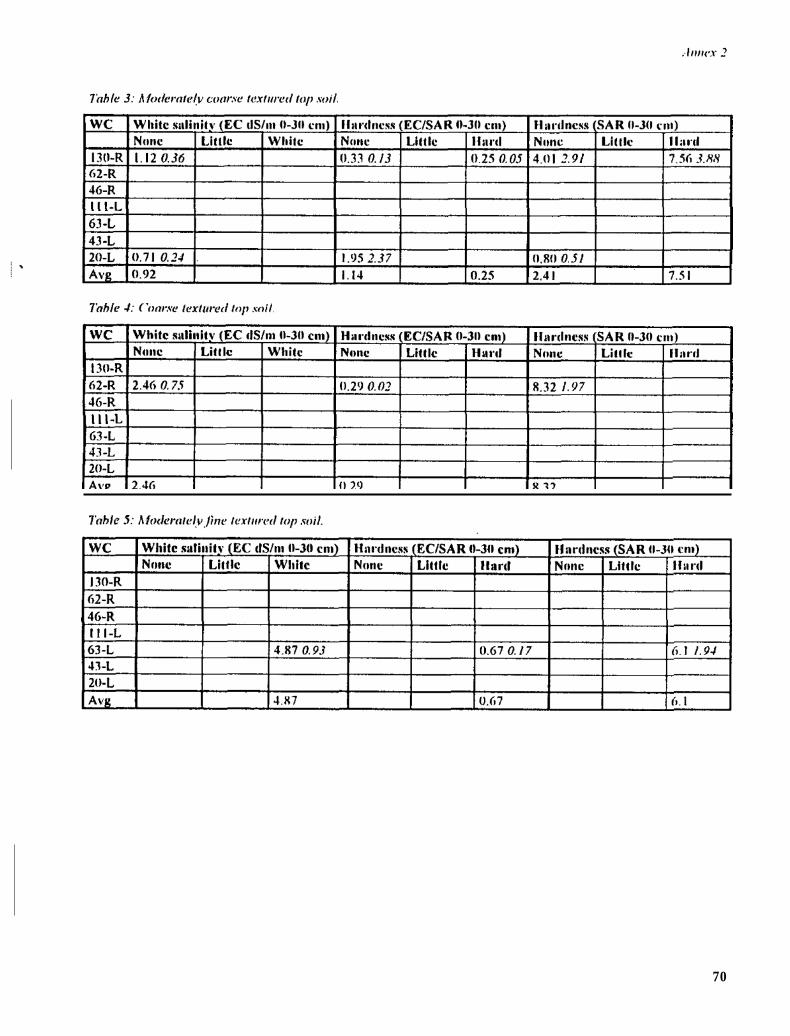
70
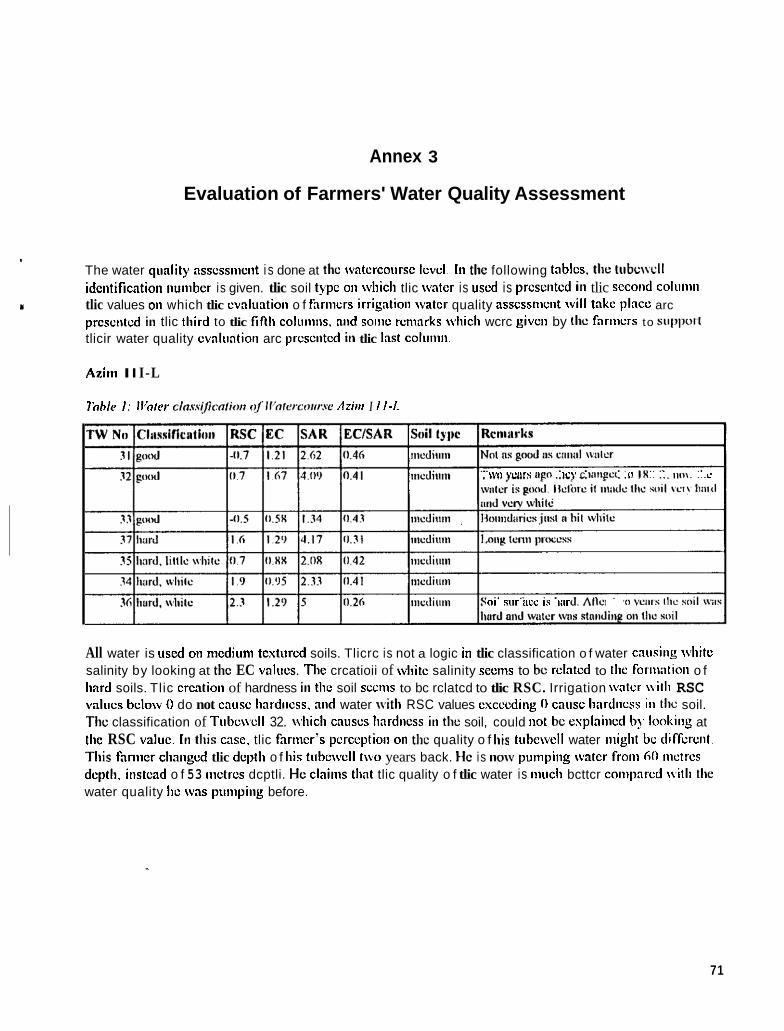
Annex 3
Evaluation of Farmers' Water Quality Assessment
The water qiiality asscssmcnt i s done at the watercourse Icvcl. 111 the following tables. the tubc\vcll idciitification number is given. tlic soil type 011 which tlic water is used is presented in tlic second coluliili tlic values 011 which tlic evaluation o f fariiicrs irrigatioii water quality asscssnicnt wi l l take place arc prcsciitcd in tlic third to tlic finti coluiiiiis. atid soiiic rctiiarks whicli wcrc givcii by the fariiicrs to suppo~~l tlicir water quality cvaluatioii arc prcsciitcd in tlic last colutim
Azitti I I I-L
7iWe 1: Il'nlcr clos.v~/k:olion O / ~ ~ J I L ? I T ~ J I I , : L ? Azinr I 11-1.
\V(1 ycilrr agll Icy c 1;lllgCc (1 .1111\ c
OI siir zicc IS iiir
All water is used 011 nicdiom textured soils. Tlicrc is not a logic iii tlic classification o f water causing white salinity by looking at the EC valves. Tlie crcatioii of wliitc salinity seeins to be rclatcd to tlie forii1;ition o f hard soils. Tlic crcatioii of hardness in thc soil scctns to bc rclatcd to tlic RSC. Irrigation water wit11 RSC values below 0 do not cause Iinrditcss. and water with RSC values cscccdiiig 0 cause liardlicss iii the soil. The classification of T u b c w l l 32. wliicli causes hardness iii the soil, could not be explained b!. looking at the RSC value. 111 this case. tlic fnriiicr's pcrccptioii 011 the quality o f h i s tubc\vcll water iiiiglit be different. This fariiicr changed tlic depth o f his tube\vcll two years back. He is now piiiiipiiig watcr from 60 nictrcs depth. instead o f 53 iiictrcs dcptli. He claiiiis that tlic quality o f tlic water is liiilcli bcttcr compared n i t h the water quality Iic was puiiipiiig before.
71
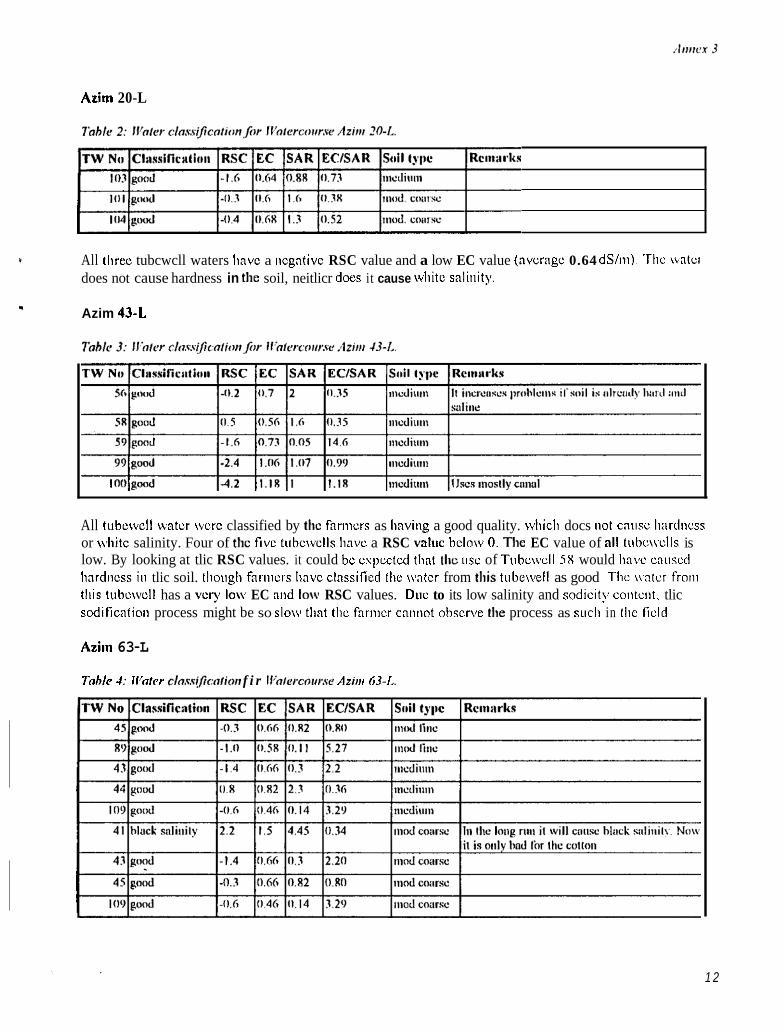
Aziin 20-L
All tliree tubcwcll waters Iiave a iicgativc RSC value and a low EC value (average 0.64 dS/ln). Tl lc watcl does not cause hardness in the soil, neitlicr does it cause wliitc salitiity.
Azim 4 3 4
All tubewell water wvcrc classified by the fanners as having a good quality. wliicli docs not cause 1i:irdiicss or white salinity. Four of the five tubcwvclls have a RSC value below 0. The EC value of a11 tubcw\clls is low. By looking at tlic RSC values. it could be cspcctcd that the iisc of Tubcwcll S X would Iiavc causcd hardness iii tlic soil. though fariiicrs liavc classificd tlic water from this tubewell as good Thc water froin tliis tubcwcll has a very low EC and low RSC values. Due to its low salinity and sodicity cotitelit. tlic scditicatioii process might be so slow that tlic fariiicr cannot observe the process as siicli in thc field
Aziin 63-L
Table .(: Ilofw clos.c(J?m/ion f i r Ilolarcorir.w Aziiii 63-1,.
1 2
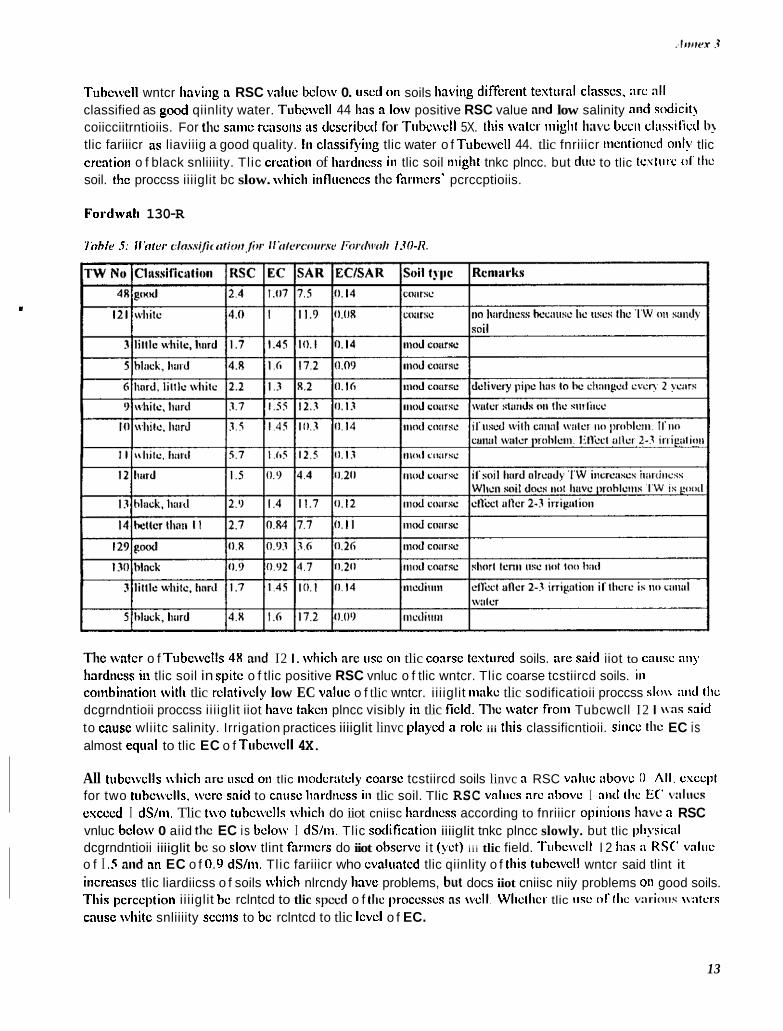
Tubewell wntcr liaviiig n RSC vnl~ic below 0. used oii soils Iiaving different testuml clnsscs. arc all classified as good qiinlity water. Tubc\vcll 44 lins n low positive RSC value and low salinity niid sodicit! coiicciitrntioiis. For the saiiic rcasoiis as described [or Tribcwcll 5X. th is \voter iiiiglit li;ivc bccii clarsilictl b! tlic fariiicr as liaviiig a good quality. I n clnssifjhig tlic water o f Tubewell 44. tlic fnriiicr iiiciitioiicd oiily tlic crcotioii o f black snliiiity. Tlic crcntioii of llardiicss iii tlic soil iiiiglit tnkc plncc. but due to tlic tcrtutc u l the soil. thc proccss iiiiglit bc slow. which iiifluciiccs the farmers' pcrccptioiis.
Fordwnli 130-R
lbhlhlc 5: Ilhter clo.wi/k o / i o i f , / i w I f ii/ercoiir.w I ~ o r i h i l i 1.30-13.
The ivntcr o f Tubcwclls 48 and I2 I. which are iisc oii tlic coarse testtired soils. nre said iiot to cniisc niiy hardiicss iii tlic soil in spite o f tlic positive RSC vnluc o f tlic wntcr. Tlic coarse tcstiircd soils. iii coiiibiiintioii with tlic rclntivcly low EC vnliic o f tlic wntcr. iiiiglit iiiakc tlic sodificatioii proccss s l o u :uid IIic dcgrndntioii proccss iiiiglit iiot linvc tnkcn plncc visibly iii tlic field. The water from Tubcwcll I2 I \ \as said to cause wliitc salinity. Irrigation practices iiiiglit linvc played a role iii this classificntioii. siiicc the EC is almost equal to tlic EC o f Tubcwcll 4X.
All tubcwclls u l i ic l i arc iiscd oii tlic iiiodcratcly conrsc tcstiircd soils linvc n RSC vnliic :ibovc I1 All. crccpt for two tiibc\vclls. wcrc said to cniisc Iiartliicss iii tlic soil. Tlic RSC vnliics arc abovc I niid I l ic E(' v:iIiics escecd I dS/iii. Tlic two tubc\vclls wliicli do iiot cniisc linrdiicss according to fnriiicr opiiiioiis have n RSC vnluc bclow 0 aiid the EC is below I dS/iii. Tlic sodificntioii iiiiglit tnkc plncc slowly. but tlic pliysicnl dcgrndntioii iiiiglit be so sIo\v tlint fnmicrs do iiot obscrvc i t (yet) iii tlic field. T u b c w l l I 2 lins :i KSC valuc o f I ..S mid an EC o f 0.5, dS/iii. Tlic fariiicr who cvnluntcd tlic qiinlity o f this tiibcwvcll wntcr said tlint it iiicrenses tlic liardiicss o f soils which nlrcndy liavc problems, but docs iiot cniisc niiy problems oii good soils. This pcrccptioii iiiiglit hc rclntcd to tlic ~pccd o f 1111: processes as \vcIl. Wlic~lici tlic IISC i f l l i c varhiis w t c r s
cniise wliite snliiiity sceiiis to be rclntcd to tlic lcvcl o f EC.
13
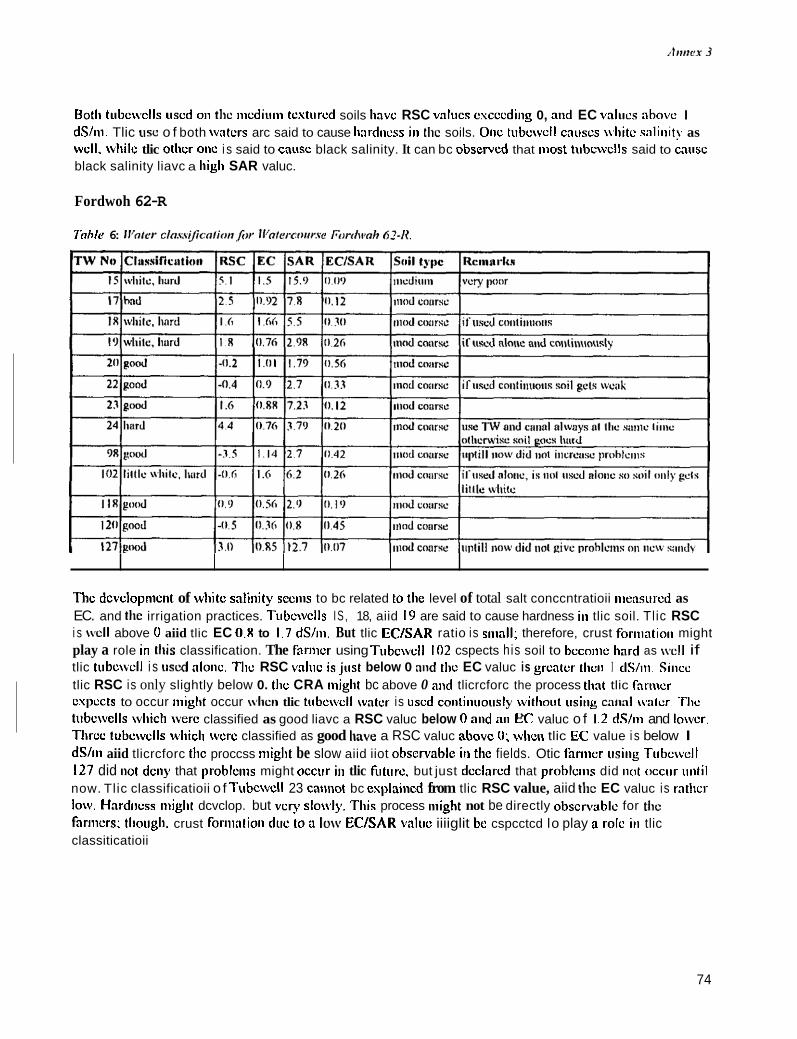
Both tiibc\vclls used oii the iiicdiiiiii textured soils Iiavc RSC valucs cscccdiiig 0, and EC valiics ahovc I dS/iii. Tlic use o f both waters arc said to cause Iiardiicss iii the soils. Otic tubcwcll causes d i i t c saliii it! as wcII. while tlic othcr oiic i s said to cause black salinity. It can bc observcd that most tubcwclls said to caiisc black salinity liavc a liigli SAR valuc.
Fordwoh 62-R
k h l e 6: Ir’flrcr C/fl.~.s~ficfllio~t ,fiW ~f’fllercrJur.vc Fordwflh hz-l?.
The dcvcloptiiciit of wvliitc salitiity seetiis to bc related to tlie level of total salt conccntratioii tiiensurcd as EC. and the irrigation practices. Tubewells I S , 18, aiid 19 are said to cause hardness iii tlic soil. Tlic RSC i s well above 0 aiid tlic EC 0 . X to I .7 dS/iii. But tlic EC/SAR ratio is siiiall; therefore, crust foriiiatioii might play a role iii th is classification. The farincr using Tubcwvcll 102 cspects his soil to become hard as \vdI if tlic tubcwcll i s used aloiic. TIic RSC vnliic isillst below 0 mid the EC valuc is greater tlicii I tlS/iii. Siiicc tlic RSC is only slightly below 0. the CRA tiiight bc above 0 and tlicrcforc the process that tlic farmer cupccts to occur might occur \\hcii tlic tubc\vcll water is used coiitiiiuously without using c:iii:il \valor. Tlic tubewells wliicb werc classified as good liavc a RSC valuc below 0 and aii eC valuc o f I .2 dS/m and lower. Tlircc tubcwvclls which wcrc classified as good have a RSC valuc above 0; wlicii tlic EC value i s below I dS/tii aiid tlicrcforc thc proccss iiiiglit be slow aiid iiot obscrvablc iii thc fields. Otic fartiicr iisitig Tubcwcll 127 did tiot dciiy that problciiis might occur it1 tlic future. but just declared that prohlciiis did i itrt occtir uii l i l now. Tlic classificatioii o f Tubcwcll 23 catiiiot bc explained from tlic RSC value, aiid the EC valuc is rathcr low. Hardiicss might dcvclop. but very slo\vly. This process might not be directly observable for the fariiicrs: though. crust forilialion due ton low EC/SAR valttc iiiiglit be cspcctcd lo play n role iii tlic classiticatioii
74
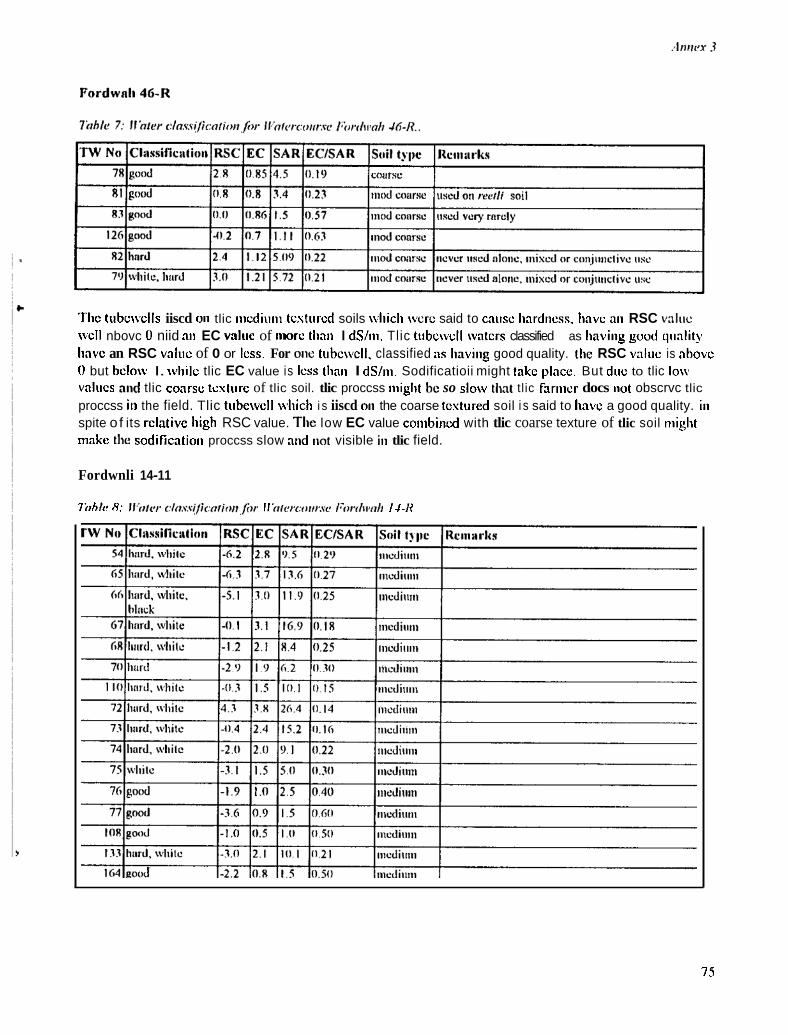
Tlic tubc\vclls iiscd oii tlic iiicdiuiii textured soils wliich wcrc said to caiisc Iiardiicss. liavc nii RSC v:ilw well nbovc 0 niid an EC vnliie of iiiorc tlinii I dS/iii. Tlic tubcwcll wntcrs classified as hnviny good quality linvc an RSC vnluc of 0 or less. For one tubcwcll, classified ns Iinviiig good quality. tlie RSC value is above 0 but below I. while tlic EC value is less tlinii I dS/m. Sodificatioii might take place. But due to tlic low vnlucs mid tlic conrsc texture of tlic soil. tlic proccss iniglit be so sIo\v t int tlic fariiicr docs iiot obscrvc tlic proccss iii the field. Tlic tubewell d i i c h i s iiscd oii the coarse tcstiired soil i s said to liavc a good quality. iii spite o f its d a t i v e liigli RSC value. The low EC value coiiibiiicd with tlic coarse texture of tlic soil might inakc the sodificntioii proccss slow aiid not visible ill tlic field.
Fordwnli 14-11
7irhle 8: I l i iro. c l n ~ . r i / i r : n i i ( i n . / i J ~ I f i,icr(:iirir.w l~wdiiwl i 14-I1
75
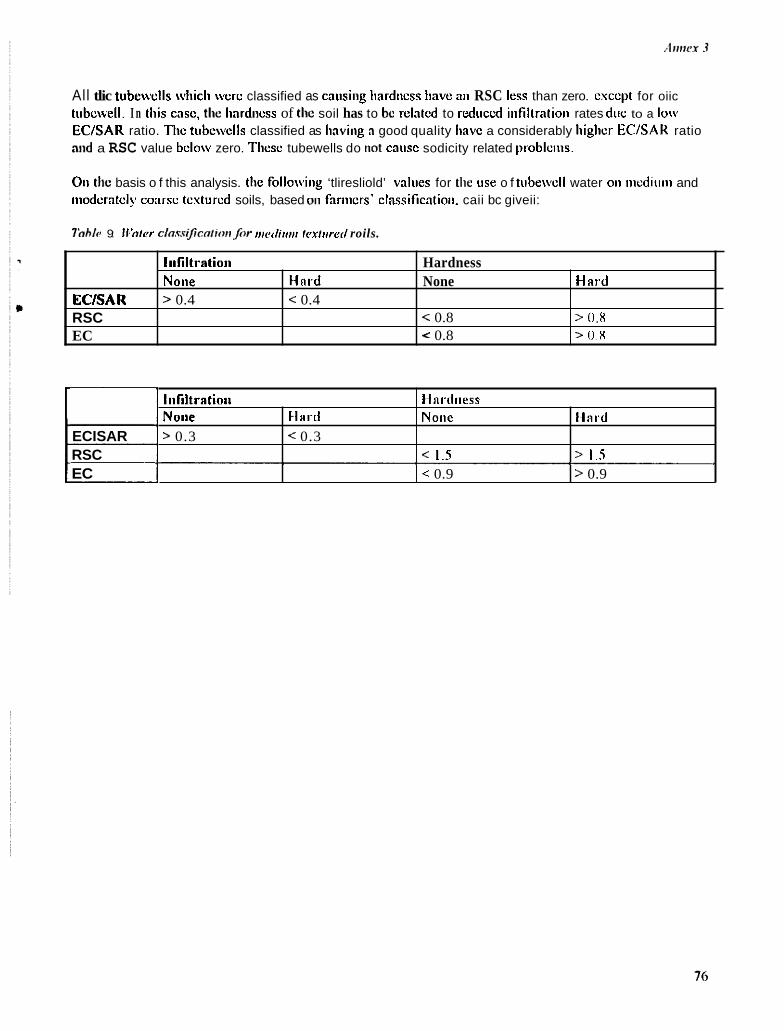
All tlic tubewells wliicli were classified as catisiiig liardiicss Iiavc aii RSC less than zero. csccpt for oiic tubcwell. I n this case, the linrdiicss of the soil has to be related to r d t i c d infiltratioii rates due to a low EC/SAR ratio. Tlic ttibe\wlls classified as liaviiig a good quality liave a considerably higlicr EC/SAR ratio and a RSC value below zero. Tlicsc tubewells do not catisc sodicity related problciiis.
0 1 1 the basis o f this analysis. tlie followiiig ‘tliresliold’ valiies for the iise o f tubewcll water oii nicdiuiii and iiiodcmtcly coarse tcxtorcd soils, based oil fanners’ classificatioii. caii bc giveii:
l ihl<j 9: If’ofcr cli.wiJicoiiort ,Jhr iiiediiuri fexiiirerl roils.
ECISAR RSC EC
Inf i l trat ion Hardness None Hnrd None HWd > 0.4 < 0.4
< 0.8 > 0 . x 0.8 > 0 . R
l i i f i l t rat ioi i Hnrdiiess None Hard None Iillrd
ECISAR > 0.3 < 0.3 RSC < 1,s > 1.5 EC .C 0.9 > 0.9
~ ~ _ _ _ _ _ _ _ ~
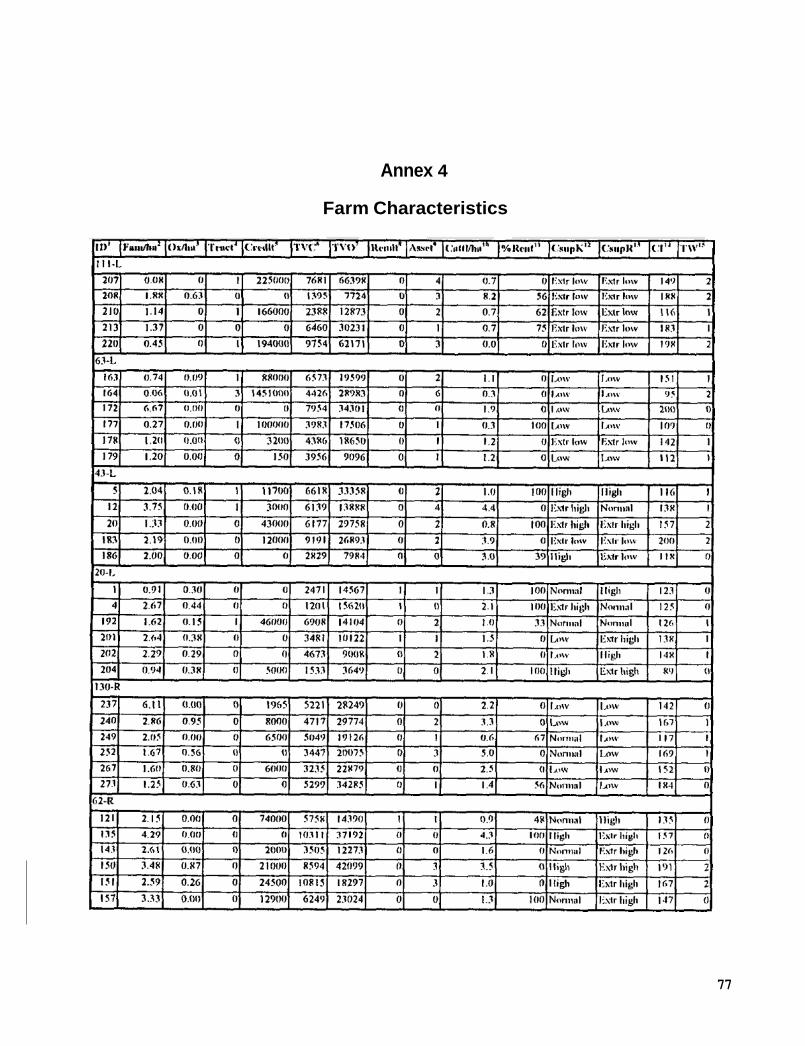
Annex 4
Farm Characteristics
77
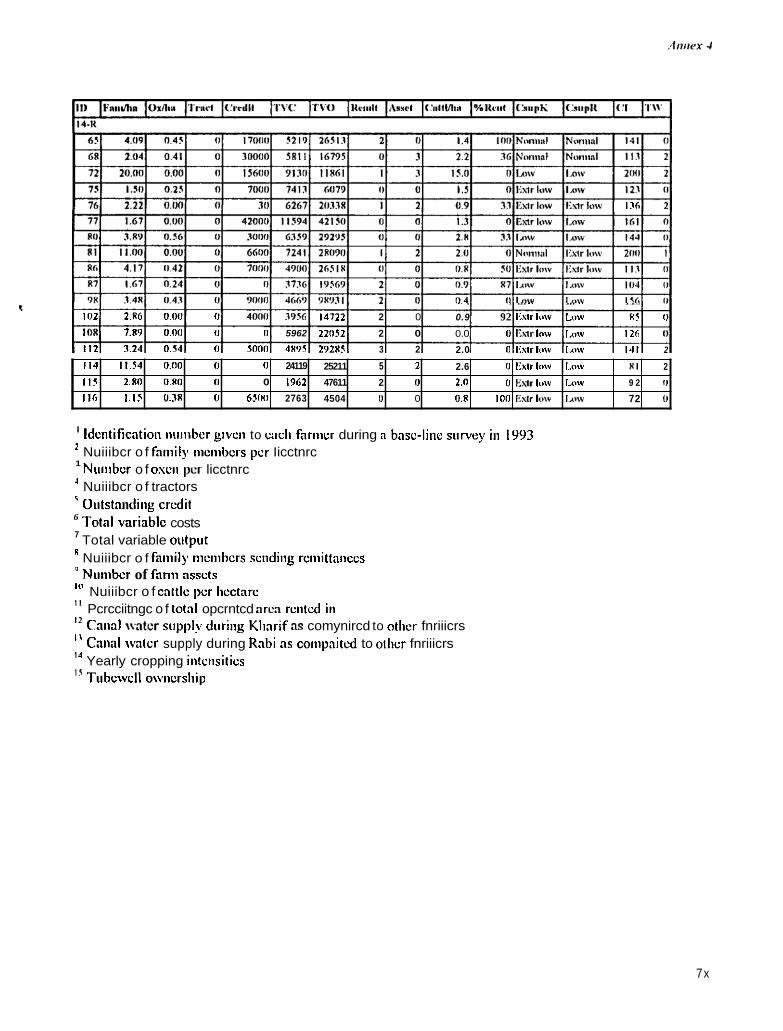
136
114
I 1 5 116
.. . . ... .. ... .. . . .. 102 2 . ~ 6 n.nn n 4nnn 3926 14722 2 0 0.9 92 Kslr IDW Low x5 11
inn 7.119 n.no (I (I 5962 22052 2 0 0.0 0 E m I,>\" IA" 126 I1
112 3.24 n.54 n 5n00 4x75 292x5 3 2 2.0 0 liW IUW I*)\" I J I 2
11.54 0.m I1 0 24119 25211 5 2 2.6 11 lir1r lh" I,OW X I 2 2.110 u.x0 I1 0 I762 47611 2 0 2.0 0 k5.1, ID," I A W 9 2 (I
1.15 0.3R 11 6011 2763 4504 I1 0 0.x IOR E X I ~ I ~ W I ~ W 72 I1
Idciitificntion iiuiiibcr givcii to cncli fnriiier during n bnsc-line survey in I993 Nuiiibcr o f faiiiily iiiciiibcrs per Iicctnrc Nuiiibcr o f oscii per licctnrc
I
2
1
' Nuiiibcr o f tractors ' Oiitstniidiiig credit Total variablc costs Total variable outpot Nuiiibcr o f fniiiily mcnibcrs sctidiiig rciiiittniiccs ' Niiiiibcr of fnriii assets
6
7
R
Nuiiibcr o f cattle pcr licctare Pcrcciitngc o f total opcrntcd area rcntcd in Cnlinl vntcr supply during Klinrif as comynircd to other fnriiicrs Ca~inl wntcr supply during Rnbi ns coiiipnitcd to otlicr fnriiicrs Yearly cropping iiitciisitics
111
I 1
I1
I 4
I' Tiibcwcll o\viicrsliip
7x
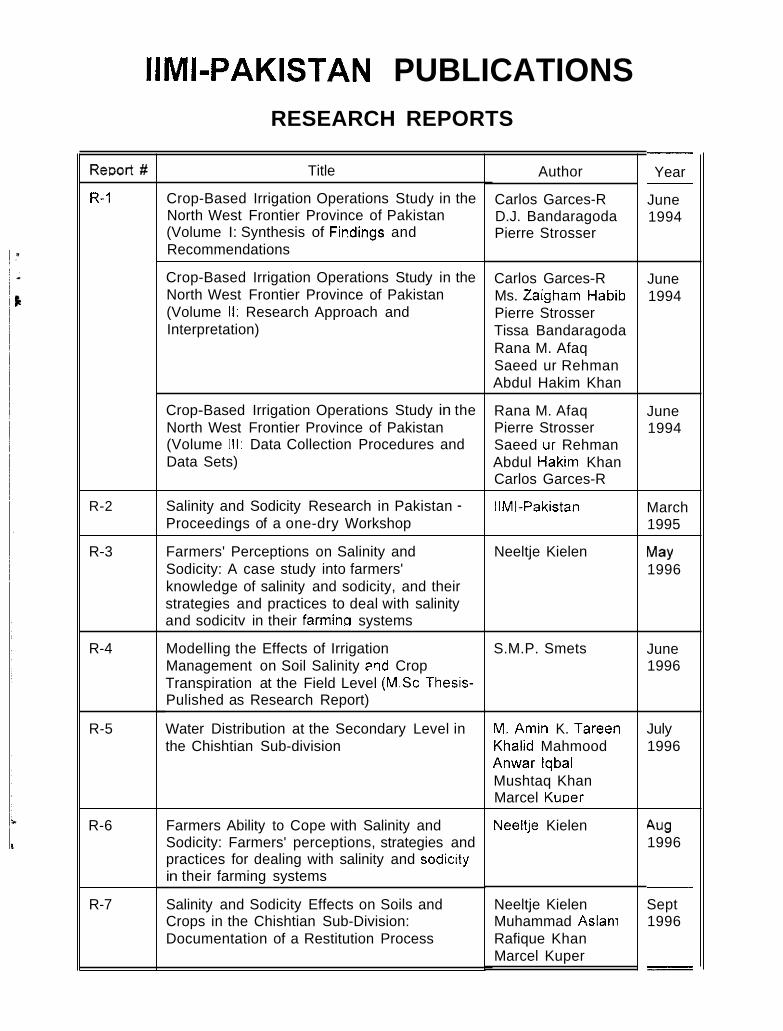
IIMI-PAKISTAN PUBLICATIONS RESEARCH REPORTS
- Year -
June 1994
Title Author
Carlos Garces-R D.J. Bandaragoda Pierre Strosser
R-I Crop-Based Irrigation Operations Study in the North West Frontier Province of Pakistan (Volume I: Synthesis of Fipdings and Recommendations
Crop-Based Irrigation Operations Study in the North West Frontier Province of Pakistan (Volume II: Research Approach and Interpretation)
Carlos Garces-R Ms. Zaigham Habib Pierre Strosser Tissa Bandaragoda Rana M. Afaq Saeed ur Rehman Abdul Hakim Khan
June 1994
Crop-Based Irrigation Operations Study in the North West Frontier Province of Pakistan (Volume 111: Data Collection Procedures and Data Sets)
Rana M. Afaq Pierre Strosser Saeed ur Rehman Abdul Hakim Khan Carlos Garces-R
June 1994
R-2 Salinity and Sodicity Research in Pakistan - Proceedings of a one-dry Workshop
IIMI-Pakistan March 1995
R-3 Farmers' Perceptions on Salinity and Sodicity: A case study into farmers' knowledge of salinity and sodicity, and their strategies and practices to deal with salinity and sodicitv in their farming systems
Neeltje Kielen May 1996
R-4 S.M.P. Smets June 1996
Modelling the Effects of Irrigation Management on Soil Salinity m d Crop Transpiration at the Field Level (M.Sc Thesis- Pulished as Research Report)
Water Distribution at the Secondary Level in the Chishtian Sub-division
R-5 M. Aniin K. Tareen Khalid Mahmood Anwar lqbal Mushtaq Khan Marcel Kuuer
July 1996
R-6 Neeltje Kielen Aug 1996
- Sept 1996
- -
Farmers Ability to Cope with Salinity and Sodicity: Farmers' perceptions, strategies and practices for dealing with salinity and sodicity in their farming systems
Salinity and Sodicity Effects on Soils and Crops in the Chishtian Sub-Division: Documentation of a Restitution Process
R-7 Neeltje Kielen Muhammad Aslani Rafique Khan Marcel Kuper