Embed Size (px)
Citation preview

Salinity and Sodicity Management
Water or soil with salinity and/or sodicity levels sufficiently elevated
to have the potential to have adverse effect on long-term
sustainability of either the soil or plant resource

Using CBM/CBNG Product Water for Irrigation – either as a sole source or as a component of
blended water
Salinity and Sodicity Issues, Irrigation, Infiltration and Movement of Water in Soil:
-low to modest salinity will enhance water movement
-salinity promotes/enhances aggregation, structural stability
-water which is free of electrolytes (salts) can/will cause dispersion of soil aggregates

-sodium in water can cause soil structural deterioration
-the causes are swelling, slaking, dispersion
-salinity can counteract sodium
salinity can/will have an adverse effect on plant performance
salinity is more dynamic (subject to change, less stable) than sodicity in soil
salinity problems are corrected by drainage and leaching
sodium problems are corrected by amendments, changing soil chemistry,
drainage, and leaching

The issue of use or management of either saline/sodic water or CBM/CBNG product
water for irrigation, either solely or blended, comes down to three questions:
1 - What are the specific levels of salinity and sodicity that work?
2- How to manage irrigation water to insure that the necessary levels or criteria are not
violated?
3- If there is an adverse consequence, how and what needs or can be done to resolve
problems created?

See also Van Voast, 2003; See poster by Roffe, 2003..

Trend of increasing sodium adsorption ratio (SAR), electrical conductivity (EC) and total dissolved solids (TDS) progressing north and west through the basin (Rice et al., 2000).
CBM product water chemistry at outfall EC range of 0.4-4.3 dS/m SAR range of 5-
68.7, median 8.8, median 1.3 dS/m TDS range of 270-2,730 mg/l, median 838 mg/l
Note: water chemistries do not remain the same on pumping from seam or on discharge from well– EC and SAR can change significantly
CBM product water in the Powder River Basin - knowns

Montana
Wyoming
North Dakota
South Dakota
Powder
Casper
Miles CityForsyth
Belle Fourche
River
North Platte
River
TongueYello
wstone
River
677
11
8
29
2418
32
53
1
24
45
3
32Circle size isProportional to TDS
Number is SAR
Figure compliments of John Wheaton, Montana Bureau of Mines and Geology
EC < 1.2 dS/m
EC ~ 1.5-2.0 dS/m
EC ~ 2.5-3.0 dS/m
EC > 3.0 dS/m

Most wells in southern portion are within the irrigation standards; discharge from these wells would most likely influence the Powder River.
Most wells in the northern section are above the limits for salinity and sodicity (Rice et al., 2002); this is particularly true for the Tongue River drainage.
Soils are generally moderate to high in clays and can be saline-sodic; predominant clay type in upper parts of watershed is generally smectite; clays in lower part of the watersheds are mixed mineralogies.

CBM Product Water Chemistry
CBM product water is bicarbonate rich and ‘confined’ (under pressure) in coal seams.
When product water is exposed to the atmosphere, discharged into surface water or applied to soil, sodium bicarbonate undergoes the following reaction:
NaHCO3 H+ + CO3-2 + Na+
(See poster by R. Drake, 2003; also Van Voast, 2003)

CBM Product Water Chemistry
Free carbonate (CO3-2) in solution is
now available to bind with calcium in the surface water or soil to form calcium carbonate, i.e., limestone or calcite.
Ca+2 + 2HCO3- CaCO3
- + H20 + CO2Van Voast, 2003; Patz and Reddy, 2003; see Poster by R. Drake

Change in water chemistry for three water qualities over a 9 day time period (subject to evapoconcentration).
Initial vs. Final
pH
Initial vs. Final EC (dS/m)
Initial vs. Final
SAR
% Change EC
% Change SAR
% Change pH
Powder River
7.4 / 8.13.07 / 3.75
3.7 / 4.4 22.15 18.92 9.5
CBM 7.7 / 8.43.36 / 4.01
12.5 / 18.0 19.35 44.00 9.1
Saline-sodic CBM
7.5 / 9.15.42 / 6.71
20.7 / 33.8 23.80 63.29 21.3
Average % Change: 21.77 42.07 13.3

Changes in product water chemistry - from discharge to downstream location:
Mean values
pH--
ECdS/m
SARpractical
SARtrue
Sue DrawDC 1 7.13 4.30 24.76 33.5
Site 3 8.54 4.20 29.74 44.1
Site 4(below res.)
9.15 4.27 32.46 53.4
% Change:(discharge to Site 4)
28.3% increase
<1% decrease
31.1%increase
59.4%increase
Source: Patz, Marji J. Coalbed Methane Product Water Chemistry on Burger Draw, Wyoming, M.S., Department of Renewable Resources. University of Wyoming. May, 2002.

Tolerant EC > 8
Semi-Tolerant EC = 4-8
Sensitive EC < 4
Crops BarleySugarbeetSunflower
WheatOatsCornSafflower
PotatoField BeanPeasLentils
Forages Tall wheatgrassBearless wildryeAltai wildryeSlender wheatgrassWestern WheatgrassRussian wildryeBarley
SweetcloverAlfalfaTall FescueWheat (hay)OrchardgrassCicer milkvetch
White cloverRed cloverLadino cloverAlsike cloverMeadow foxtail
Crop Tolerance to Saline Water

Saline and sodic conditions promote new plant communities
Typically, application of saline and sodic water promotes the development of salt-tolerant, halophytic communities
Commonly occurring species which should be considered as indicators of changing salinity conditions include: Prairie cordgrass Cattail Baltic rushes American bullrush Salt cedar Alkali grass

Species
Perennial Barley
(Hordeum marinium)
Big Saltbrush (Atriplex
lentiformis)
Saltbush (Atriplex wytana)

0.00
1.00
2.00
3.00
4.00
5.00
6.00
7.00
8.00
1 2 3 4 5 6 7 8 9 10 11 12 13 14 15 16 17 18 19 20 21 22 23 24 25 26 27 28 29 30 31 32
Weeks
control-Hordeum marinium
treatment-Hordeum marinium
EC of shallow groundwater over a 32-week period of irrigation of Hordeum marinium (Maritime barley) (no drainage, average of all water table positions). Bold horizontal lines at EC=1.9dS/m and
EC=3.5dS/m correspond to applied water EC.
EC applied = 3.5 dS/m
EC applied = 1.9 dS/m
EC
, d
S/m

0.00
1.00
2.00
3.00
4.00
5.00
6.00
7.00
8.00
9.00
10.00
11.00
1 2 3 4 5 6 7 8 9 10 11 12 13 14 15 16 17 18 19 20 21 22 23 24 25 26 27 28 29 30 31 32
Weeks
SAR
control-Hordeum marinium
treatment-Hordeum marinium
CBM SAR
PRSAR
SAR of groundwater over a 32-week period of irrigation of Hordeum marinium (no drainage). Bold horizontal lines at SAR=3.5 and SAR=10.5 correspond
to applied water SAR
SAR applied=10.5
SAR applied =3.5

The Soil Issue –Some soil-related management options

Almost without exception in semi-arid regions the soil solution in irrigated fields will be more saline than the salinity of the irrigation water because of evapotranspiration that leaves the salts from the irrigation water in the soil and the dissolution of some soil minerals (Rhoades et al., 1973).
Irrigation may increase the salinity and sodicity of the soil profile to a point at which plant growth is reduced (Maas and Hoffman, 1977)…..
And the soil structure may be damaged (Ben-Hur et al., 1998)

To avoid accumulation of salt in the soil, salt leaching from the root zone needs to be conducted (Ben-Hur et al., 2001).
The leaching fraction is the water that is intentionally applied in excess of plant water needs to hold the salt concentration of the soil below a specific value. It is the fraction of the applied water that appears as drainage water (Rhoades et al., 1973).
The water percolating below the root zone moves downward to the groundwater and may cause the water table to rise.

Sodic water is any water with a SAR greater than 12. Sodic water is not
necessarily saline.
Potential impact of sodium is often assessed with ESP > 15% and > 35% swelling clay.
Sodic soil has exchangeable sodium percentage (ESP) greater than 15%.
Effect of EC and SAR of applied water on relative hydraulic conductivity (Source: Shainberg and Letey, 1984).
Red line – as SAR increases, relative HC decreases at fixed EC
Green line – as EC increases at fixed SAR, relative HC increases

0
5
10
15
20
25
30
35
0 0.5 1 1.5 2 2.5 3 3.5 4
EC (dS/m)
SA
R
Powder River-Moorhead-'72-'01
CBM Product Water
Copyright: K. M. Robinson, MSU-BozemanLand Resources Environmental Science-2002
EC (salinity, dS/m) versus SAR (sodium adsoption ratio) of Powder River discharges of record in Montana and of permitted CBM discharges of record within Powder River
basin, as of October, 2001.
Moderate to severe risk of dispersion Slight to moderate
dispersion potentialLittle to no risk of dispersion

Water Quality Treatment
Mean EC (dS/m)
Mean SAR
Treatment EC x
SAR
Base 49 0.82 a 2.56 a
1.6 x 4.5
1X P.R. 49 1.51 b 5.94 b
3.1 x 13.0 1X CBM 49 2.46 c 3.92 b1.6 x 4.5
5X P.R. 49 3.21 d 4.94 b
1.6 x 4.5
5X P+d 49 3.02 e 4.86 b
3.1 x 13.0 5X CBM 49 6.93 f 11.31 c3.1 x 13.0 5X C+d 49 5.73 g 10.85 c
Resultant Mean Saturated Paste EC and SAR for Treatment Combinations (across all textures)
0
5
10
15
20
25
30
0 2 4 6 8 10 12
EC (dS/m)
SA
R (
soil)
Baseline
1X Wet/Dry-P.R.
1X Wet/Dry-CBM
5X Wet/Dry-CBM
5X Wet/Dry-CBM + Distilled
5X Wet/Dry-P.R.
5X Wet/Dry-P.R. + Distilled
Copyright: K. M. Robinson, MSU-BozemanLand Resources Environmental Science-2002
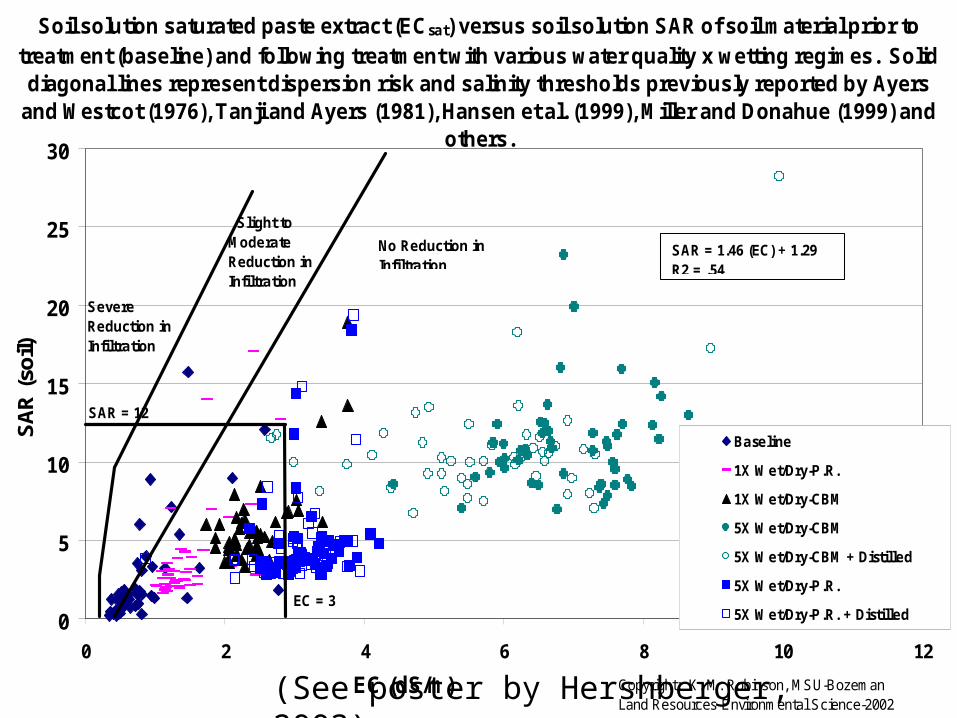
SAR = 1.46 (EC) + 1.29R2 = .54
Soil solution saturated paste extract (ECsat) versus soil solution SAR of soil material prior to treatment (baseline) and following treatment with various water quality x wetting regimes. Solid diagonal lines represent dispersion risk and salinity thresholds previously reported by Ayers
and Westcot (1976), Tanji and Ayers (1981), Hansen et al. (1999), Miller and Donahue (1999) and others.
No Reduction in Infiltration
Slight to Moderate Reduction in Infiltration
Severe Reduction in Infiltration
SAR = 12
EC = 3
(See poster by Hershberger, 2003)

The Soil Issue –Some case studies of soil responses

- SAR 1, 3, 5, 8
- EC 0, 0.25, .5, 1.0, 5.0, 10.0 dS/m
- Soils amended with gypsum and sulfuric acid and subsequently leached with simulated rainfall
- Outcomes:
- At low EC (<12 mmolcL-1, EC = 1.2 dS/m) internal swelling occurred, reducing the number of large, free-draining pores, reducing water holding capacity and conducting porosity of soil at low tension, i.e., soil does not drain as readily after wetting.
Leaching and Reclamation of Soil Irrigated with Moderate SAR Waters. J.E. Mace and C. Amrhein. SSSAJ 65:199-204,
2001

Fig 1 (pg 200)
Value divided by 10 = EC in dS/m
EC = 3.0 dS/mInterpretation:as SAR of appliedincreases from 1 to 8, the entireHC curve drops;as EC of applied water increasesfrom 0 to 10 dS/m,the HC at any SAR increases.
In some situations, even at low SAR, HCcan decrease withreductions in EC.

Mace and Amrhein, 2001
Loss of hydraulic conductivity occurred at all SAR; was reversible with gypsum additions.
At SAR 5 and 8, irreversible plugging of soil pores by dispersed clay.
Conclusion: Hydraulic conductivity of soil decreased as a function of increasing SAR and decreasing EC.
Even modestly saline-sodic water used for irrigation can have an adverse effect on soil structure, especially during rainfall.

Fig 4 (pg 202)
Interpretation
Effectiveness of gypsum application is highest on soils previously treated with water of SAR 1-3
Significant difference of responsiveness of soils previously irrigated with low SAR v. high SAR water
Hydraulic conductivity increase most evident immediately after gypsum application and significantly decreases with second and subsequent leaching event
Implication – gypsum applications need to be repeated as long as water of elevated SAR is applied

The Soil Issue –Some case studies of soil responses

-60-50-40-30-20-10
0
0 2 4 6 8 10EC, dS/m
Soil D
epth
(inch
es)
Continuous CBM discharge water; EC = 2.25 dS/m, SAR = ~63, Birney Baseline-no
CBM discharge water; irrigated with Powder River
Baseline-no CBM discharge water, Birney site; irrigated with Tongue River
Al’s site/Birney, MT, 9/2003, deep, well-drained, fine sandy loam; no watertable present; Al’s Moorhead site, shallow, poorly drained silty clay loam, shale subsoil at 18’, shallow water table
EC (dS/m paste extract) v. soil depth – Al’s Barley, 9/2003

-60-50-40-30-20-10
0
0 2 4 6 8 10
SAR
Soil D
epth
(inch
es)
Al’s site/Birney, MT, 9/2003, deep, well-drained, fine sandy loam; no watertable present; Al’s Moorhead site, shallow, poorly drained silty clay loam, shale subsoil at 18’, shallow water table
SAR v. Soil Depth – Al’s Barley, 9/2003
Baseline-no CBM discharge water; irrigated with Powder River
Continuous CBM discharge water; EC = 2.25 dS/m, SAR = ~63, Birney;
Baseline-no CBM discharge water, Birney site; irrigated with Tongue River

-60
-50
-40
-30
-20
-10
0
0 5 10 15 20
EC, dS/m
Soil D
epth
(inch
es)
EC, dS/m v. soil depth - Beehive Site, 9/2003
Intermittent CBM discharge water
Continuous CBM discharge water
Baseline-no CBM discharge water Beehive site/Birney, MT,
9/2003, deep, well-drained, fine sandy loam; no water table present
Applied water: EC = 1.7-1.8 dS/m, SAR = 70.8, pH = 8.5-8.6

SAR v. Soil depth - Beehive site, 9/2003
-60
-50
-40
-30
-20
-10
0
0 5 10 15 20 25 30
SAR
Soil D
epth
(inch
es) Baseline-no
CBM discharge water
Continuous CBM discharge water
Intermittent CBM discharge water
Beehive site/Birney, MT, 9/2003, deep, well-drained, fine sandy loam; no water table present
Applied water: EC = 1.7-1.8 dS/m, SAR = 70.8, pH = 8.5-8.6

-60
-40
-20
0
0 5 10 15
EC, dS/m
Soil D
epth
(inch
es)
Continuous CBM discharge water; EC = 1.6-1.8 dS/m, SAR = 35.9, pH = 8.3
Continuous CBM impoundment overflow site; EC = 1.6-1.8 dS/m, SAR = 35.9, pH = 8.3
Frequent CBM discharge water; EC = 1.6-1.8 dS/m, SAR = 35.9, pH = 8.3
Baseline-no CBM discharge water
EC (dS/m) v. soil depth – Schoolhouse site, 9/2003
Schoolhouse site/Moorhead, MT, 9/2003, shallow, poorly drained silty clay loam, shale subsoil at 18’, shallow water table

-60-50-40-30-20-10
0
0 5 10 15 20 25
SAR
Soil D
epth
(inch
es)
Schoolhouse site/Moorhead, MT, 9/2003, shallow, poorly drained silty clay loam, shale subsoil at 18’, shallow water table
Continuous CBM impoundment overflow site; EC = 1.6-1.8 dS/m, SAR = 35.9, pH = 8.3
Continuous CBM discharge impoundment; EC = 1.6-1.8 dS/m, SAR = 35.9, pH = 8.3
Frequent CBM discharge water; EC = 1.6-1.8 dS/m, SAR = 35.9, pH = 8.3
Baseline-no CBM discharge water
SAR v. soil depth – Schoolhouse site, 9/2003

Sustainability of crop production in Saline/Sodic Conditions
Certain conditions need to be met: the soil being irrigated must be well-drained salt tolerant crops should be the primary crops
grown rotations should be planned to provide for a
sequence of progressively more salt tolerant crops salts should be leached out of the soil in the spring
or winter as the salinity of either the irrigation water or soil
solution increases (with prolonged crop water use and through the irrigation season), the volume of irrigation water applied should be progressively increased.

Management of Sodic Soils
Basic rule – the first thing you need is good
drainage - an outlet to which to send the sodium when it is displaced.
a source of calcium (already in the soil or as an amendment), and exchange process,
a source of water to flush the sodium from the system

Thank you
Jim Bauder, MSU