Embed Size (px)
Citation preview
Farmer Willingness to Supply Poultry Litter
for Energy Conversion and to Invest in an
Energy Conversion Cooperative
Kimberly L. Jensen, Roland K. Roberts, Ernie Bazen,
R. Jamey Menard, and Burton C. English*
Conversion of poultry litter to energy can serve as a renewable energy source and provide analternative to land application in areas where poultry production is intensive. Economies ofsize may limit a farmer’s ability to economically use on-farm conversion. Capital costs can bespread across several poultry farmers to convert poultry litter to energy in a centralized fa-cility. This research determined influences on the amount of litter poultry producers will tosell to a centralized conversion facility, on their willingness to invest in a conversion co-operative, and on the prices for litter required to divert litter from current uses.
Key Words: poultry litter, supply, renewable energy
JEL Classifications: Q12, Q13
Increases in energy costs, with energy costs
comprising over half of cash expenses for
poultry producers (Cunningham, 2008), cou-
pled with a desire for sustainable production
practices, highlight the need to investigate the
use of poultry litter as a potential energy feed-
stock. Poultry litter, the bedding and waste ma-
terials removed from poultry houses, can serve
as an energy feedstock for heating and elec-
tricity generation either in on-farm systems or
in centralized litter-to-energy conversion fa-
cilities. Conversion of poultry litter to energy
can have two primary environmental benefits.
First, electricity produced from poultry litter is
considered renewable energy. The U.S. De-
partment of Energy (DOE) includes bioenergy,
or energy from biomass, as a source of re-
newable energy and includes animal wastes in
its definition of biomass that can be used to
generate renewable energy (DOE, 2009). Sec-
ond, conversion of litter to electricity can pro-
vide an alternative use for the litter in areas
where poultry production is intensive and litter
supplies exceed the fertilizer needs on nearby
farmlands. While litter can serve as an in-
expensive fertilizer, when the poultry litter is
applied to meet nitrogen needs, excess phos-
phorus can build up at the soil surface, po-
tentially causing eutrophication of the water
supply (Howry et al., 2008). Hence, in some
areas of intensive poultry production, new uses
other than land application may be environ-
mentally beneficial.
On-farm energy systems have appeal in that
they use litter from the farm to supply elec-
tricity back to the farm directly or to sell onto
Kimberly L. Jensen and Roland K. Roberts are pro-fessors, Ernie Bazen is assistant professor, R. JameyMenard is research associate, and Burton C. English isprofessor, Department of Agricultural Economics, TheUniversity of Tennessee.
This study was funded in part by a grant fromTennessee Department of Agriculture.
Journal of Agricultural and Applied Economics, 42,1(February 2010):105–119
� 2010 Southern Agricultural Economics Association
the grid, but these systems require investment
of dollars, labor, and management by poultry
operators. Furthermore, because litter may be
applied as fertilizer, sold to litter handlers/
farmers to be applied on nearby farms, or used
in trade for poultry house cleaning, the value in
energy production must be sufficient to draw
litter from these current uses.
Poultry houses are typically cleaned out
once or twice per year. About 75% of the pro-
ducers in this study cleaned their houses out
once or twice per year. Potential poultry litter
handling costs include cleanout of the houses,
transport to another location if the litter is sold
and transportation is provided, and application
costs either to the farmer’s own land or another
farmer’s land. Among Tennessee poultry pro-
ducers investigated in this study, about 48% of
the litter was used on-farm, about 15% was
used in trade for poultry house cleaning ser-
vices, and just less than 37% was sold. Of the
on-farm use, over 68% was applied as fertilizer
to hay/grassland. Skid steer loaders and dump
trucks are used for collecting and transporting
litter, while manure spreaders are used in land
application. Most farmers in this study either
cleaned out their own poultry houses or used
a cleanout service which accepted litter in
return for the cleanout service, while only a few
paid a fee for cleanout services. Among those
who had paid a fee for cleanout, the average fee
was about $1,266 per house or about $7.42 per
ton (n 5 18). The benefit of applying litter to
the farmer’s own land is that litter is an in-
expensive source of fertilizer, often used to
improve pastureland. As part of the survey,
farmers were asked how much litter they land
applied as well as estimates of the tons per acre
of nitrogen, P205 (phosphorus), and K20 (po-
tassium) fertilizer that were replaced. The av-
erage values per ton of litter as fertilizer, as
estimated by the farmers, were about 78 pounds
of nitrogen, 48 pounds of P205 (phosphorus),
and 44 pounds of K20 (potassium) per ton of
litter. Based on current market prices at the
time of the survey, the estimated value of a ton
of litter as fertilizer was about $49 per ton.
Economies of size required for cost effec-
tive energy conversion may limit an individual
farmer’s ability to economically use on-farm
energy conversion of poultry litter. Capital
costs of energy conversion, however, can be
spread across several poultry farmers to convert
poultry litter to energy in a centralized energy
facility (Bachewe et al., 2008). Central anaer-
obic digesters, for example, can process a vari-
ety of wastes, including food processing wastes,
dairy manure, swine manure, in addition to
poultry litter. Larger scale gasification facilities
can be used in high density areas of broiler lit-
ter production (Flora and Riahi-Nezhad, 2006).
Numerous state and federal resources, such as
grants, low interest loans, and tax credits, exist
for conversion of litter to energy (EPA, 2009). A
poultry litter to energy conversion facility could
provide poultry producers with an alternative
market for their farms’ poultry litter. Further-
more, if producers invest in a cooperative that
converts litter to energy, producers could ben-
efit from an additional market for their poultry
litter, as well as income potential from elec-
tricity sales from the conversion facility.
The objective of this research was to de-
termine the factors influencing the amount of
litter Tennessee poultry producers are willing to
sell to a centralized energy conversion facility,
the dollar amount they believe they would re-
quire to sell the poultry litter into the facility,
and their willingness to invest in a cooperative
that converts litter and other wastes to energy.
Data to model these three decisions are from
a 2008 survey of Tennessee poultry producers.
Previous Studies
Several recent studies have examined issues
of land application and composting of litter
(Armstrong, Goodwin, and Hamm, 2007;
Carreira et al., 2007; Howry et al., 2008;
Kemper, Goodwin, and Mozaffari, 2008). Other
studies have examined feasibility of central
digesters (Lewis, 2001; Kubsch, 2003; Myers
and Deisinger, 2006; Je et al., 1998). Goan et al.
(2002) evaluated the disposition of poultry lit-
ter. Two studies have focused specifically on
the feasibility of using poultry litter in energy
conversion. Whittington (2007) examined avail-
ability of poultry litter for energy feedstock but
did not incorporate costs of handling, revenues,
or costs for conversion. Flora and Riahi-Nezhad
Journal of Agricultural and Applied Economics, February 2010106
(2006) conducted a feasibility study of using
litter for energy purposes in South Carolina.
They employed facility scales of 1,000 tons of
litter per year for an on-farm facility (50–70 kW
capacity), 10,000 tons per year for a community-
scale facility (500–700 kW capacity), and
50,000 tons per year for a regional-scale facil-
ity (2.5–3.5 MW capacity). Another study ex-
amined using large-scale gasification facilities,
such as 55 MW using 700,000 tons of litter per
year (LaCapra Associates, 2006). While several
studies have examined feasibility of energy con-
version using animal wastes, including poultry
litter, none has examined factors influencing
farmers’ willingness to supply litter for alterna-
tive energy systems, pricing of litter, nor their
willingness to invest in energy cooperatives to
convert waste to energy.
Numerous studies have examined de-
mographics of cooperative members compared
with nonmembers. Wachenheim, deHillerin,
and Dumler (2001) studied producer percep-
tions of hog marketing cooperatives. They
found that, compared with cooperative mem-
bers, independent producers tended to be older,
less educated, and market a lower number of
hogs. Black (1985) had similar findings re-
garding farm size, with results indicating that
farmers and ranchers who were cooperative
members owned or leased more land than in-
dependent producers. Bravo-Ureta and Lee
(1988) found that dairy cooperative members
were more likely to have Extension Service
contacts and operate smaller dairies than in-
dependent producers. Stofferahn (2004) exam-
ined demographics and farm characteristics
across willingness to share labor and machin-
ery, and found that farmers who were willing
to share rented more land, had more education,
were slightly older, and were more likely to
already be members of cooperatives than those
farmers who were not willing to share. Puaha
(2003) evaluated determinants of investment in
a value-added wheat products New Generation
Cooperative. Results from the study indicated
that those who were members had planted more
wheat, had higher education levels, were
younger, and had a higher share of income from
wheat than those who were not members. These
studies indicate interest among researchers and
others in knowing the determinants of will-
ingness to participate in farmer cooperatives in
general, and more specifically potential interest
in an energy conversion cooperative that uses
poultry litter as a feedstock.
Carreira, Goodwin, and Hamm (2006) in-
vestigated the value of litter to farmers who
might potentially purchase litter to land apply
on their farms. Among those who had pre-
viously purchased poultry litter, they found that
the purchase price for broiler litter averaged
$26 per ton. They found that some of the im-
pediments to farmers using litter were that the
litter was not available when needed, they did
not have much experience using poultry litter,
they did not have proper equipment to use
litter, and that land application is very time
consuming.
Data and Methods
A mail survey of Tennessee poultry producers
was conducted to obtain information for this
study. The survey was mailed in September
2008 to 499 poultry producers who, according
to National Agricultural Statistical Service
(NASS), had at least one poultry house in
Tennessee. A total of 122 producers responded
for a 24.5% response rate. The survey con-
tained questions about farm characteristics,
such as farm income, acres farmed, litter pro-
duction, and litter disposition. It also contained
questions regarding farmer demographics, such
as farmer age, education level, and membership
in organizations. Included in the survey were
questions regarding willingness to supply litter
to a central energy conversion facility, dollars
per ton that producers stated they would require
for the poultry litter to sell it into a conversion
facility, and willingness to invest in an energy
conversion cooperative that would use litter as
a feedstock. To obtain information about will-
ingness to supply litter to a conversion facility,
farmers were first asked whether they would be
willing to sell a portion of their operation’s
poultry litter for energy conversion in a cen-
tralized energy project. If they indicated they
would sell some, they were asked how many
tons per year they could commit. They were
then also asked what price they would need for
Jensen et al.: Farmer Willingness to Supply Poultry Litter for Energy Conversion 107
the litter if the centralized facility arranged for
litter to be picked up at the farm. If they would
exchange the litter for hauling, they were asked
to indicate a price of $0.
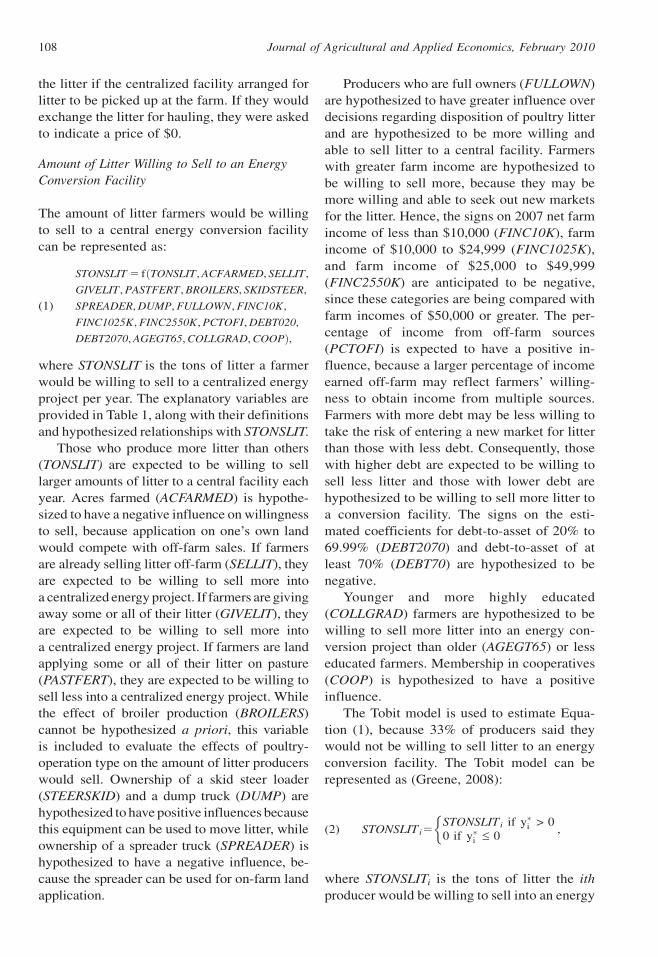
Amount of Litter Willing to Sell to an Energy
Conversion Facility
The amount of litter farmers would be willing
to sell to a central energy conversion facility
can be represented as:
(1)
STONSLIT 5 fðTONSLIT , ACFARMED, SELLIT ,
GIVELIT , PASTFERT , BROILERS, SKIDSTEER,
SPREADER, DUMP, FULLOWN, FINC10K,
FINC1025K, FINC2550K, PCTOFI, DEBT020,
DEBT2070, AGEGT65, COLLGRAD, COOPÞ,
where STONSLIT is the tons of litter a farmer
would be willing to sell to a centralized energy
project per year. The explanatory variables are
provided in Table 1, along with their definitions
and hypothesized relationships with STONSLIT.
Those who produce more litter than others
(TONSLIT) are expected to be willing to sell
larger amounts of litter to a central facility each
year. Acres farmed (ACFARMED) is hypothe-
sized to have a negative influence on willingness
to sell, because application on one’s own land
would compete with off-farm sales. If farmers
are already selling litter off-farm (SELLIT), they
are expected to be willing to sell more into
a centralized energy project. If farmers are giving
away some or all of their litter (GIVELIT), they
are expected to be willing to sell more into
a centralized energy project. If farmers are land
applying some or all of their litter on pasture
(PASTFERT), they are expected to be willing to
sell less into a centralized energy project. While
the effect of broiler production (BROILERS)
cannot be hypothesized a priori, this variable
is included to evaluate the effects of poultry-
operation type on the amount of litter producers
would sell. Ownership of a skid steer loader
(STEERSKID) and a dump truck (DUMP) are
hypothesized to have positive influences because
this equipment can be used to move litter, while
ownership of a spreader truck (SPREADER) is
hypothesized to have a negative influence, be-
cause the spreader can be used for on-farm land
application.
Producers who are full owners (FULLOWN)
are hypothesized to have greater influence over
decisions regarding disposition of poultry litter
and are hypothesized to be more willing and
able to sell litter to a central facility. Farmers
with greater farm income are hypothesized to
be willing to sell more, because they may be
more willing and able to seek out new markets
for the litter. Hence, the signs on 2007 net farm
income of less than $10,000 (FINC10K), farm
income of $10,000 to $24,999 (FINC1025K),
and farm income of $25,000 to $49,999
(FINC2550K) are anticipated to be negative,
since these categories are being compared with
farm incomes of $50,000 or greater. The per-
centage of income from off-farm sources
(PCTOFI) is expected to have a positive in-
fluence, because a larger percentage of income
earned off-farm may reflect farmers’ willing-
ness to obtain income from multiple sources.
Farmers with more debt may be less willing to
take the risk of entering a new market for litter
than those with less debt. Consequently, those
with higher debt are expected to be willing to
sell less litter and those with lower debt are
hypothesized to be willing to sell more litter to
a conversion facility. The signs on the esti-
mated coefficients for debt-to-asset of 20% to
69.99% (DEBT2070) and debt-to-asset of at
least 70% (DEBT70) are hypothesized to be
negative.
Younger and more highly educated
(COLLGRAD) farmers are hypothesized to be
willing to sell more litter into an energy con-
version project than older (AGEGT65) or less
educated farmers. Membership in cooperatives
(COOP) is hypothesized to have a positive
influence.
The Tobit model is used to estimate Equa-
tion (1), because 33% of producers said they
would not be willing to sell litter to an energy
conversion facility. The Tobit model can be
represented as (Greene, 2008):
(2) STONSLITi5STONSLITi if y�i > 00 if y�i £ 0
�,
where STONSLITi is the tons of litter the ith
producer would be willing to sell into an energy
Journal of Agricultural and Applied Economics, February 2010108
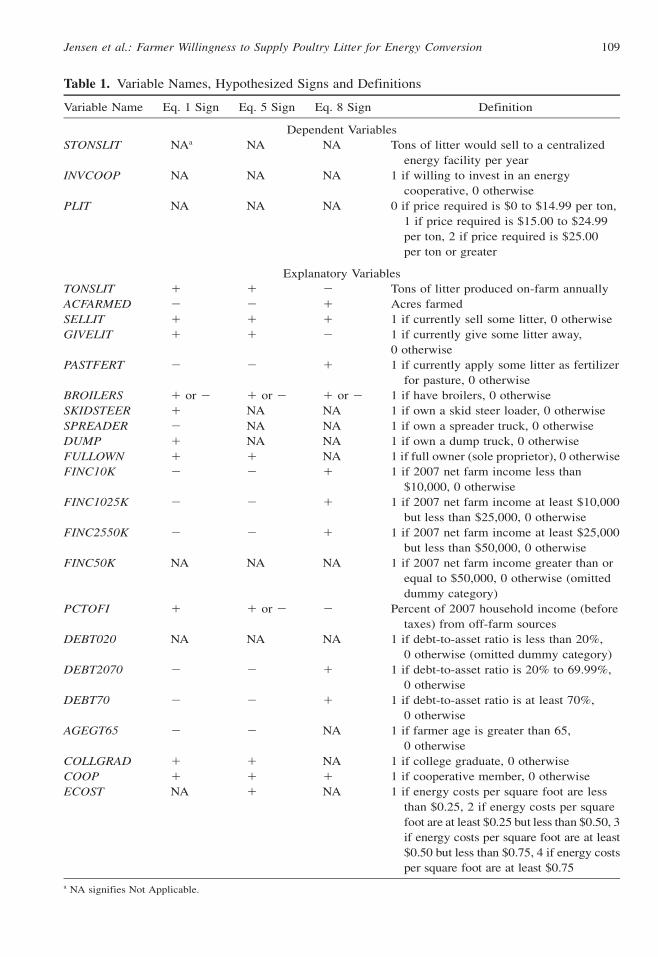
Table 1. Variable Names, Hypothesized Signs and Definitions
Variable Name Eq. 1 Sign Eq. 5 Sign Eq. 8 Sign Definition
Dependent Variables
STONSLIT NAa NA NA Tons of litter would sell to a centralized
energy facility per year
INVCOOP NA NA NA 1 if willing to invest in an energy
cooperative, 0 otherwise
PLIT NA NA NA 0 if price required is $0 to $14.99 per ton,
1 if price required is $15.00 to $24.99
per ton, 2 if price required is $25.00
per ton or greater
Explanatory Variables
TONSLIT 1 1 2 Tons of litter produced on-farm annually
ACFARMED 2 2 1 Acres farmed
SELLIT 1 1 1 1 if currently sell some litter, 0 otherwise
GIVELIT 1 1 2 1 if currently give some litter away,
0 otherwise
PASTFERT 2 2 1 1 if currently apply some litter as fertilizer
for pasture, 0 otherwise
BROILERS 1 or 2 1 or 2 1 or 2 1 if have broilers, 0 otherwise
SKIDSTEER 1 NA NA 1 if own a skid steer loader, 0 otherwise
SPREADER 2 NA NA 1 if own a spreader truck, 0 otherwise
DUMP 1 NA NA 1 if own a dump truck, 0 otherwise
FULLOWN 1 1 NA 1 if full owner (sole proprietor), 0 otherwise
FINC10K 2 2 1 1 if 2007 net farm income less than
$10,000, 0 otherwise
FINC1025K 2 2 1 1 if 2007 net farm income at least $10,000
but less than $25,000, 0 otherwise
FINC2550K 2 2 1 1 if 2007 net farm income at least $25,000
but less than $50,000, 0 otherwise
FINC50K NA NA NA 1 if 2007 net farm income greater than or
equal to $50,000, 0 otherwise (omitted
dummy category)
PCTOFI 1 1 or 2 2 Percent of 2007 household income (before
taxes) from off-farm sources
DEBT020 NA NA NA 1 if debt-to-asset ratio is less than 20%,
0 otherwise (omitted dummy category)
DEBT2070 2 2 1 1 if debt-to-asset ratio is 20% to 69.99%,
0 otherwise
DEBT70 2 2 1 1 if debt-to-asset ratio is at least 70%,
0 otherwise
AGEGT65 2 2 NA 1 if farmer age is greater than 65,
0 otherwise
COLLGRAD 1 1 NA 1 if college graduate, 0 otherwise
COOP 1 1 1 1 if cooperative member, 0 otherwise
ECOST NA 1 NA 1 if energy costs per square foot are less
than $0.25, 2 if energy costs per square
foot are at least $0.25 but less than $0.50, 3
if energy costs per square foot are at least
$0.50 but less than $0.75, 4 if energy costs
per square foot are at least $0.75
a NA signifies Not Applicable.
Jensen et al.: Farmer Willingness to Supply Poultry Litter for Energy Conversion 109
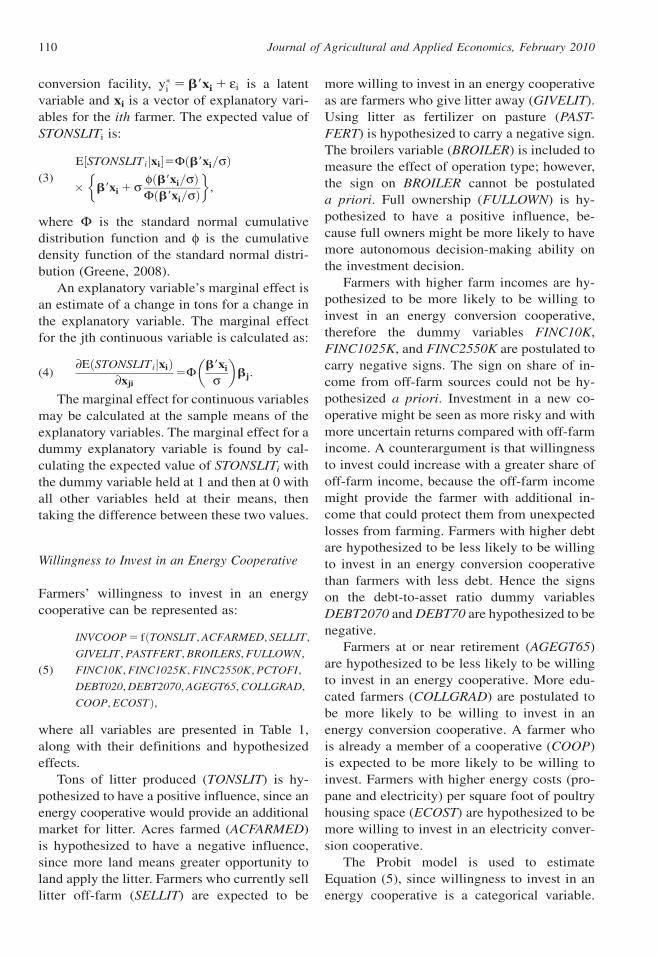
conversion facility, y�i 5 b9xi 1 ei is a latent
variable and xi is a vector of explanatory vari-
ables for the ith farmer. The expected value of
STONSLITi is:
(3)
E½STONSLITijxi�5F b9xi=sð Þ
� b9xi 1 sfðb9xi=sÞFðb9xi=sÞ
� �,
where F is the standard normal cumulative
distribution function and f is the cumulative
density function of the standard normal distri-
bution (Greene, 2008).
An explanatory variable’s marginal effect is
an estimate of a change in tons for a change in
the explanatory variable. The marginal effect
for the jth continuous variable is calculated as:
(4)¶EðSTONSLITijxiÞ
¶xji5F
b9xi
s
� �bj.
The marginal effect for continuous variables
may be calculated at the sample means of the
explanatory variables. The marginal effect for a
dummy explanatory variable is found by cal-
culating the expected value of STONSLITi with
the dummy variable held at 1 and then at 0 with
all other variables held at their means, then
taking the difference between these two values.
Willingness to Invest in an Energy Cooperative
Farmers’ willingness to invest in an energy
cooperative can be represented as:
(5)
INVCOOP 5 fðTONSLIT , ACFARMED, SELLIT ,
GIVELIT , PASTFERT , BROILERS, FULLOWN,
FINC10K, FINC1025K, FINC2550K, PCTOFI,
DEBT020, DEBT2070, AGEGT65, COLLGRAD,
COOP, ECOSTÞ,
where all variables are presented in Table 1,
along with their definitions and hypothesized
effects.
Tons of litter produced (TONSLIT) is hy-
pothesized to have a positive influence, since an
energy cooperative would provide an additional
market for litter. Acres farmed (ACFARMED)
is hypothesized to have a negative influence,
since more land means greater opportunity to
land apply the litter. Farmers who currently sell
litter off-farm (SELLIT) are expected to be
more willing to invest in an energy cooperative
as are farmers who give litter away (GIVELIT).
Using litter as fertilizer on pasture (PAST-
FERT) is hypothesized to carry a negative sign.
The broilers variable (BROILER) is included to
measure the effect of operation type; however,
the sign on BROILER cannot be postulated
a priori. Full ownership (FULLOWN) is hy-
pothesized to have a positive influence, be-
cause full owners might be more likely to have
more autonomous decision-making ability on
the investment decision.
Farmers with higher farm incomes are hy-
pothesized to be more likely to be willing to
invest in an energy conversion cooperative,
therefore the dummy variables FINC10K,
FINC1025K, and FINC2550K are postulated to
carry negative signs. The sign on share of in-
come from off-farm sources could not be hy-
pothesized a priori. Investment in a new co-
operative might be seen as more risky and with
more uncertain returns compared with off-farm
income. A counterargument is that willingness
to invest could increase with a greater share of
off-farm income, because the off-farm income
might provide the farmer with additional in-
come that could protect them from unexpected
losses from farming. Farmers with higher debt
are hypothesized to be less likely to be willing
to invest in an energy conversion cooperative
than farmers with less debt. Hence the signs
on the debt-to-asset ratio dummy variables
DEBT2070 and DEBT70 are hypothesized to be
negative.
Farmers at or near retirement (AGEGT65)
are hypothesized to be less likely to be willing
to invest in an energy cooperative. More edu-
cated farmers (COLLGRAD) are postulated to
be more likely to be willing to invest in an
energy conversion cooperative. A farmer who
is already a member of a cooperative (COOP)
is expected to be more likely to be willing to
invest. Farmers with higher energy costs (pro-
pane and electricity) per square foot of poultry
housing space (ECOST) are hypothesized to be
more willing to invest in an electricity conver-
sion cooperative.
The Probit model is used to estimate
Equation (5), since willingness to invest in an
energy cooperative is a categorical variable.
Journal of Agricultural and Applied Economics, February 2010110
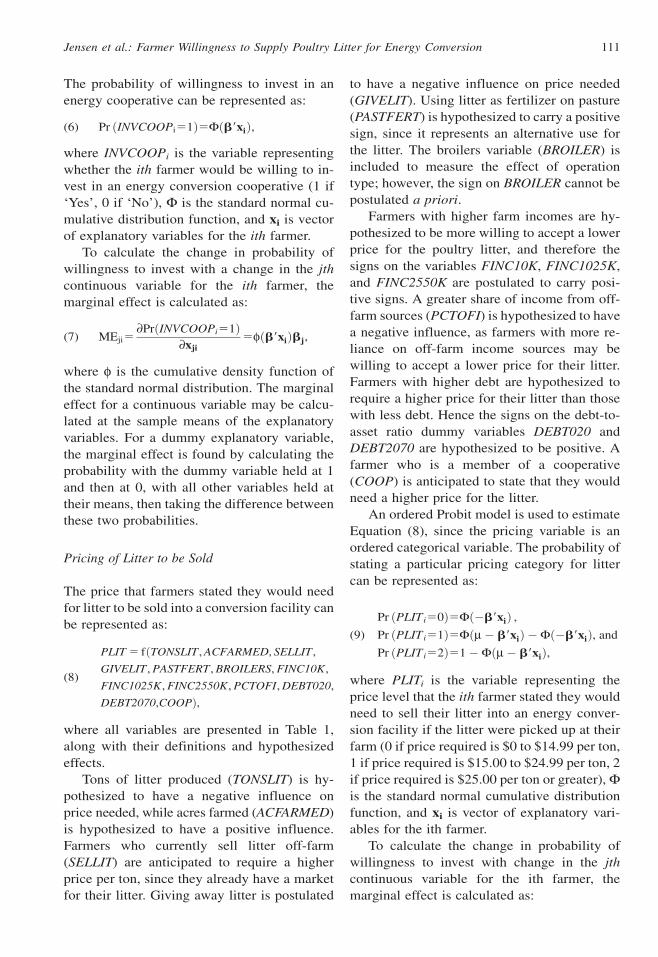
The probability of willingness to invest in an
energy cooperative can be represented as:
(6) Pr ðINVCOOPi51Þ5Fðb9xiÞ,
where INVCOOPi is the variable representing
whether the ith farmer would be willing to in-
vest in an energy conversion cooperative (1 if
‘Yes’, 0 if ‘No’), F is the standard normal cu-
mulative distribution function, and xi is vector
of explanatory variables for the ith farmer.
To calculate the change in probability of
willingness to invest with a change in the jth
continuous variable for the ith farmer, the
marginal effect is calculated as:
(7) MEji5¶PrðINVCOOPi51Þ
¶xji5fðb9xiÞbj,
where f is the cumulative density function of
the standard normal distribution. The marginal
effect for a continuous variable may be calcu-
lated at the sample means of the explanatory
variables. For a dummy explanatory variable,
the marginal effect is found by calculating the
probability with the dummy variable held at 1
and then at 0, with all other variables held at
their means, then taking the difference between
these two probabilities.
Pricing of Litter to be Sold
The price that farmers stated they would need
for litter to be sold into a conversion facility can
be represented as:
(8)
PLIT 5 fðTONSLIT , ACFARMED, SELLIT ,
GIVELIT , PASTFERT , BROILERS, FINC10K,
FINC1025K, FINC2550K, PCTOFI, DEBT020,
DEBT2070,COOPÞ,
where all variables are presented in Table 1,
along with their definitions and hypothesized
effects.
Tons of litter produced (TONSLIT) is hy-
pothesized to have a negative influence on
price needed, while acres farmed (ACFARMED)
is hypothesized to have a positive influence.
Farmers who currently sell litter off-farm
(SELLIT) are anticipated to require a higher
price per ton, since they already have a market
for their litter. Giving away litter is postulated
to have a negative influence on price needed
(GIVELIT). Using litter as fertilizer on pasture
(PASTFERT) is hypothesized to carry a positive
sign, since it represents an alternative use for
the litter. The broilers variable (BROILER) is
included to measure the effect of operation
type; however, the sign on BROILER cannot be
postulated a priori.
Farmers with higher farm incomes are hy-
pothesized to be more willing to accept a lower
price for the poultry litter, and therefore the
signs on the variables FINC10K, FINC1025K,
and FINC2550K are postulated to carry posi-
tive signs. A greater share of income from off-
farm sources (PCTOFI) is hypothesized to have
a negative influence, as farmers with more re-
liance on off-farm income sources may be
willing to accept a lower price for their litter.
Farmers with higher debt are hypothesized to
require a higher price for their litter than those
with less debt. Hence the signs on the debt-to-
asset ratio dummy variables DEBT020 and
DEBT2070 are hypothesized to be positive. A
farmer who is a member of a cooperative
(COOP) is anticipated to state that they would
need a higher price for the litter.
An ordered Probit model is used to estimate
Equation (8), since the pricing variable is an
ordered categorical variable. The probability of
stating a particular pricing category for litter
can be represented as:
(9)
Pr ðPLITi50Þ5Fð�b9xiÞ ,Pr ðPLITi51Þ5Fðm� b9xiÞ �Fð�b9xiÞ, and
Pr ðPLITi52Þ51�Fðm� b9xiÞ,
where PLITi is the variable representing the
price level that the ith farmer stated they would
need to sell their litter into an energy conver-
sion facility if the litter were picked up at their
farm (0 if price required is $0 to $14.99 per ton,
1 if price required is $15.00 to $24.99 per ton, 2
if price required is $25.00 per ton or greater), Fis the standard normal cumulative distribution
function, and xi is vector of explanatory vari-
ables for the ith farmer.
To calculate the change in probability of
willingness to invest with change in the jth
continuous variable for the ith farmer, the
marginal effect is calculated as:
Jensen et al.: Farmer Willingness to Supply Poultry Litter for Energy Conversion 111
(10)
¶PrðPLITi50Þ¶xji
5� fðb9xiÞbj,
¶PrðPLITi51Þ¶xji
5ðfð�b9xiÞ � ðm� b9xiÞÞbj, and
¶PrðPLITi51Þ¶xji
5fðm� b9xiÞbj,
where f is the cumulative density function of the
standard normal distribution. The marginal effect
for a continuous variable can be calculated at the
sample means for the explanatory variables. For
a dummy explanatory variable, the marginal ef-
fect is found by calculating the probability with
the dummy variable held at 1 and then at 0, with
all other variables held at their means, then taking
the difference between these two probabilities.
Results
Amount of Litter Willing to Sell to an Energy
Conversion Facility
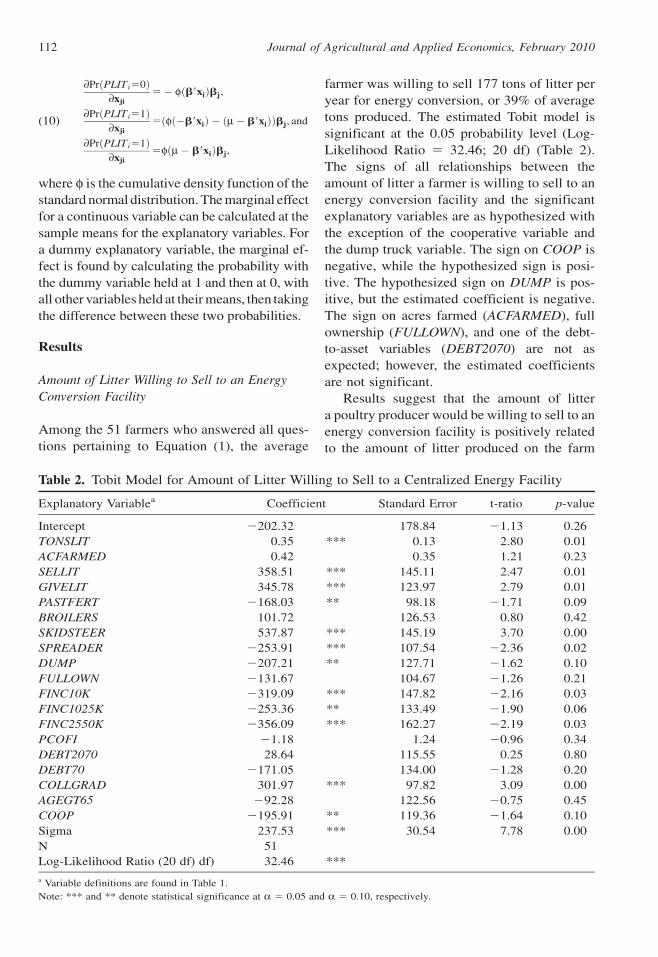
Among the 51 farmers who answered all ques-
tions pertaining to Equation (1), the average
farmer was willing to sell 177 tons of litter per
year for energy conversion, or 39% of average
tons produced. The estimated Tobit model is
significant at the 0.05 probability level (Log-
Likelihood Ratio 5 32.46; 20 df) (Table 2).
The signs of all relationships between the
amount of litter a farmer is willing to sell to an
energy conversion facility and the significant
explanatory variables are as hypothesized with
the exception of the cooperative variable and
the dump truck variable. The sign on COOP is
negative, while the hypothesized sign is posi-
tive. The hypothesized sign on DUMP is pos-
itive, but the estimated coefficient is negative.
The sign on acres farmed (ACFARMED), full
ownership (FULLOWN), and one of the debt-
to-asset variables (DEBT2070) are not as
expected; however, the estimated coefficients
are not significant.
Results suggest that the amount of litter
a poultry producer would be willing to sell to an
energy conversion facility is positively related
to the amount of litter produced on the farm
Table 2. Tobit Model for Amount of Litter Willing to Sell to a Centralized Energy Facility
Explanatory Variablea Coefficient Standard Error t-ratio p-value
Intercept 2202.32 178.84 21.13 0.26
TONSLIT 0.35 *** 0.13 2.80 0.01
ACFARMED 0.42 0.35 1.21 0.23
SELLIT 358.51 *** 145.11 2.47 0.01
GIVELIT 345.78 *** 123.97 2.79 0.01
PASTFERT 2168.03 ** 98.18 21.71 0.09
BROILERS 101.72 126.53 0.80 0.42
SKIDSTEER 537.87 *** 145.19 3.70 0.00
SPREADER 2253.91 *** 107.54 22.36 0.02
DUMP 2207.21 ** 127.71 21.62 0.10
FULLOWN 2131.67 104.67 21.26 0.21
FINC10K 2319.09 *** 147.82 22.16 0.03
FINC1025K 2253.36 ** 133.49 21.90 0.06
FINC2550K 2356.09 *** 162.27 22.19 0.03
PCOFI 21.18 1.24 20.96 0.34
DEBT2070 28.64 115.55 0.25 0.80
DEBT70 2171.05 134.00 21.28 0.20
COLLGRAD 301.97 *** 97.82 3.09 0.00
AGEGT65 292.28 122.56 20.75 0.45
COOP 2195.91 ** 119.36 21.64 0.10
Sigma 237.53 *** 30.54 7.78 0.00
N 51
Log-Likelihood Ratio (20 df) df) 32.46 ***
a Variable definitions are found in Table 1.
Note: *** and ** denote statistical significance at a 5 0.05 and a 5 0.10, respectively.
Journal of Agricultural and Applied Economics, February 2010112
(TONSLIT). Dummies representing current
disposition of litter are all significant, with the
signs on selling litter (SELLIT) or giving away
litter (GIVELIT) being positive and the sign on
using litter for pasture fertilization (PASTFERT)
being negative. Owning a skid steer loader
(SKIDSTEER) positively affects the amount of
litter a farmer is willing to sell, while owning
a manure spreader (SPREADER) negatively
affects the amount of litter a farmer is willing to
sell to a conversion facility. The coefficient on
broiler production (BROILERS) is not signifi-
cant in the model.
Results further suggest that poultry farmers
with higher incomes are willing to sell more
litter to an energy conversion facility than those
with lower incomes, with the signs on the
dummy variables (FINC10K, FINC1025K, and
FINC2550K) being negative. A higher per-
centage of income from off-farm sources
(PCTOFI) and debt level (DEBT2070,
DEBT70) have no statistically significant in-
fluence. Being a college graduate (COLL-
GRAD) has a positive influence, while being
over 65 years old (AGEGT65) is not statisti-
cally significant.
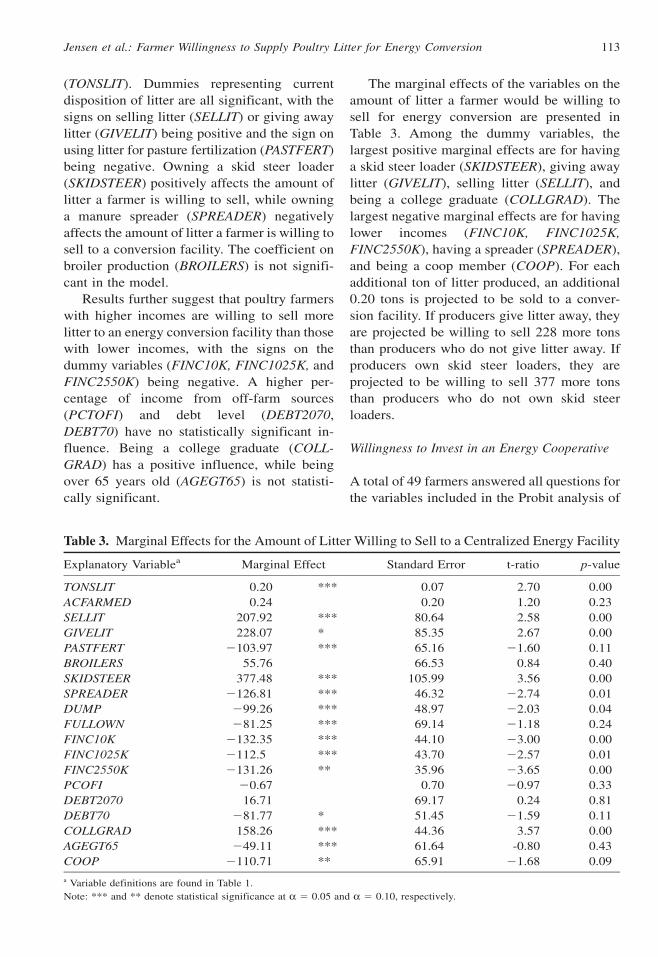
The marginal effects of the variables on the
amount of litter a farmer would be willing to
sell for energy conversion are presented in
Table 3. Among the dummy variables, the
largest positive marginal effects are for having
a skid steer loader (SKIDSTEER), giving away
litter (GIVELIT), selling litter (SELLIT), and
being a college graduate (COLLGRAD). The
largest negative marginal effects are for having
lower incomes (FINC10K, FINC1025K,
FINC2550K), having a spreader (SPREADER),
and being a coop member (COOP). For each
additional ton of litter produced, an additional
0.20 tons is projected to be sold to a conver-
sion facility. If producers give litter away, they
are projected be willing to sell 228 more tons
than producers who do not give litter away. If
producers own skid steer loaders, they are
projected to be willing to sell 377 more tons
than producers who do not own skid steer
loaders.
Willingness to Invest in an Energy Cooperative
A total of 49 farmers answered all questions for
the variables included in the Probit analysis of
Table 3. Marginal Effects for the Amount of Litter Willing to Sell to a Centralized Energy Facility
Explanatory Variablea Marginal Effect Standard Error t-ratio p-value
TONSLIT 0.20 *** 0.07 2.70 0.00
ACFARMED 0.24 0.20 1.20 0.23
SELLIT 207.92 *** 80.64 2.58 0.00
GIVELIT 228.07 * 85.35 2.67 0.00
PASTFERT 2103.97 *** 65.16 21.60 0.11
BROILERS 55.76 66.53 0.84 0.40
SKIDSTEER 377.48 *** 105.99 3.56 0.00
SPREADER 2126.81 *** 46.32 22.74 0.01
DUMP 299.26 *** 48.97 22.03 0.04
FULLOWN 281.25 *** 69.14 21.18 0.24
FINC10K 2132.35 *** 44.10 23.00 0.00
FINC1025K 2112.5 *** 43.70 22.57 0.01
FINC2550K 2131.26 ** 35.96 23.65 0.00
PCOFI 20.67 0.70 20.97 0.33
DEBT2070 16.71 69.17 0.24 0.81
DEBT70 281.77 * 51.45 21.59 0.11
COLLGRAD 158.26 *** 44.36 3.57 0.00
AGEGT65 249.11 *** 61.64 -0.80 0.43
COOP 2110.71 ** 65.91 21.68 0.09
a Variable definitions are found in Table 1.
Note: *** and ** denote statistical significance at a 5 0.05 and a 5 0.10, respectively.
Jensen et al.: Farmer Willingness to Supply Poultry Litter for Energy Conversion 113
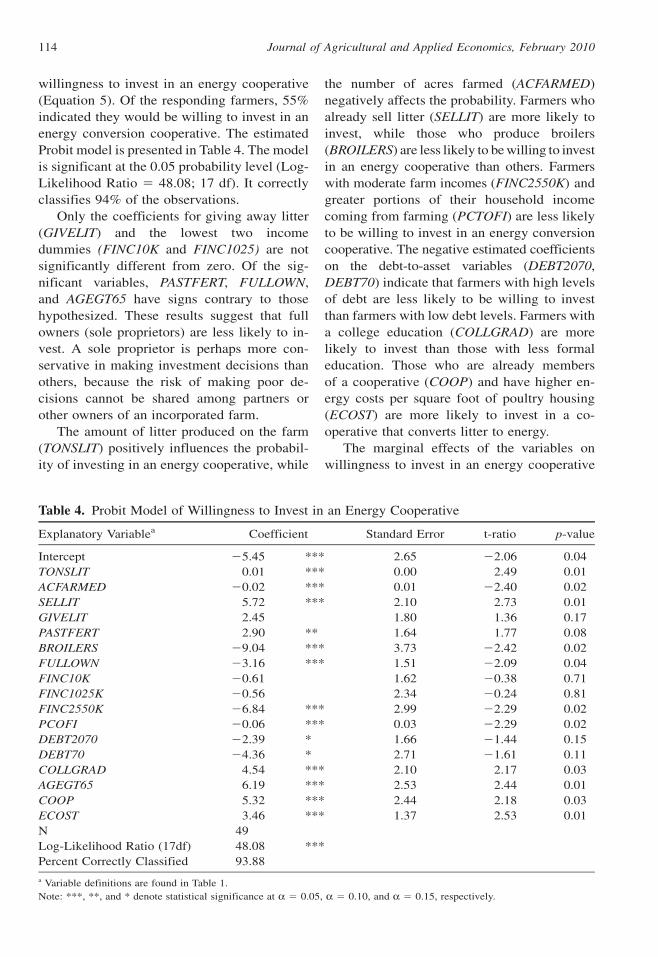
willingness to invest in an energy cooperative
(Equation 5). Of the responding farmers, 55%
indicated they would be willing to invest in an
energy conversion cooperative. The estimated
Probit model is presented in Table 4. The model
is significant at the 0.05 probability level (Log-
Likelihood Ratio 5 48.08; 17 df). It correctly
classifies 94% of the observations.
Only the coefficients for giving away litter
(GIVELIT) and the lowest two income
dummies (FINC10K and FINC1025) are not
significantly different from zero. Of the sig-
nificant variables, PASTFERT, FULLOWN,
and AGEGT65 have signs contrary to those
hypothesized. These results suggest that full
owners (sole proprietors) are less likely to in-
vest. A sole proprietor is perhaps more con-
servative in making investment decisions than
others, because the risk of making poor de-
cisions cannot be shared among partners or
other owners of an incorporated farm.
The amount of litter produced on the farm
(TONSLIT) positively influences the probabil-
ity of investing in an energy cooperative, while
the number of acres farmed (ACFARMED)
negatively affects the probability. Farmers who
already sell litter (SELLIT) are more likely to
invest, while those who produce broilers
(BROILERS) are less likely to be willing to invest
in an energy cooperative than others. Farmers
with moderate farm incomes (FINC2550K) and
greater portions of their household income
coming from farming (PCTOFI) are less likely
to be willing to invest in an energy conversion
cooperative. The negative estimated coefficients
on the debt-to-asset variables (DEBT2070,
DEBT70) indicate that farmers with high levels
of debt are less likely to be willing to invest
than farmers with low debt levels. Farmers with
a college education (COLLGRAD) are more
likely to invest than those with less formal
education. Those who are already members
of a cooperative (COOP) and have higher en-
ergy costs per square foot of poultry housing
(ECOST) are more likely to invest in a co-
operative that converts litter to energy.
The marginal effects of the variables on
willingness to invest in an energy cooperative
Table 4. Probit Model of Willingness to Invest in an Energy Cooperative
Explanatory Variablea Coefficient Standard Error t-ratio p-value
Intercept 25.45 *** 2.65 22.06 0.04
TONSLIT 0.01 *** 0.00 2.49 0.01
ACFARMED 20.02 *** 0.01 22.40 0.02
SELLIT 5.72 *** 2.10 2.73 0.01
GIVELIT 2.45 1.80 1.36 0.17
PASTFERT 2.90 ** 1.64 1.77 0.08
BROILERS 29.04 *** 3.73 22.42 0.02
FULLOWN 23.16 *** 1.51 22.09 0.04
FINC10K 20.61 1.62 20.38 0.71
FINC1025K 20.56 2.34 20.24 0.81
FINC2550K 26.84 *** 2.99 22.29 0.02
PCOFI 20.06 *** 0.03 22.29 0.02
DEBT2070 22.39 * 1.66 21.44 0.15
DEBT70 24.36 * 2.71 21.61 0.11
COLLGRAD 4.54 *** 2.10 2.17 0.03
AGEGT65 6.19 *** 2.53 2.44 0.01
COOP 5.32 *** 2.44 2.18 0.03
ECOST 3.46 *** 1.37 2.53 0.01
N 49
Log-Likelihood Ratio (17df) 48.08 ***
Percent Correctly Classified 93.88
a Variable definitions are found in Table 1.
Note: ***, **, and * denote statistical significance at a 5 0.05, a 5 0.10, and a 5 0.15, respectively.
Journal of Agricultural and Applied Economics, February 2010114
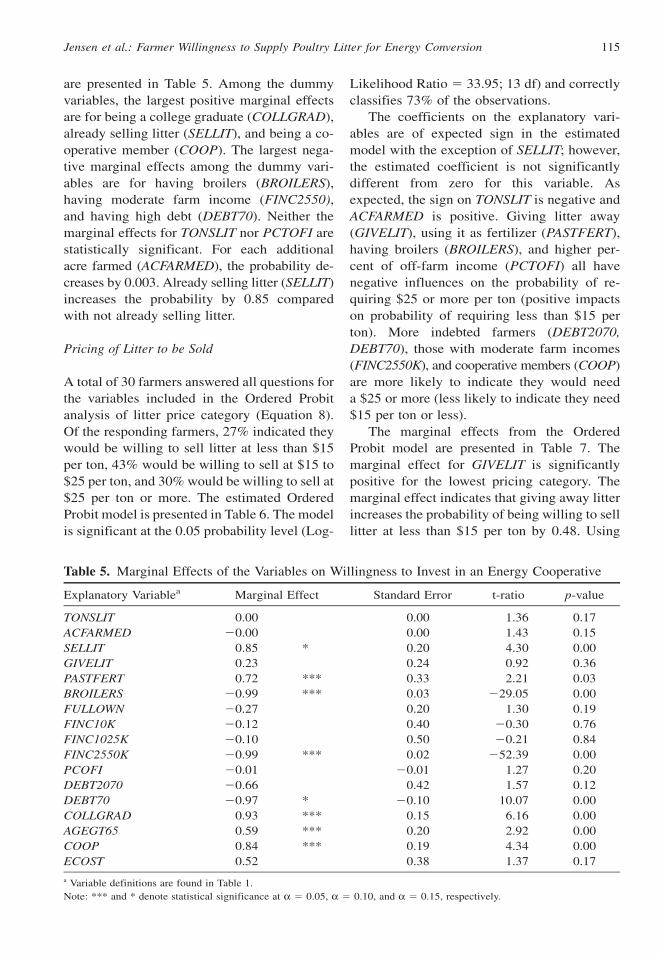
are presented in Table 5. Among the dummy
variables, the largest positive marginal effects
are for being a college graduate (COLLGRAD),
already selling litter (SELLIT), and being a co-
operative member (COOP). The largest nega-
tive marginal effects among the dummy vari-
ables are for having broilers (BROILERS),
having moderate farm income (FINC2550),
and having high debt (DEBT70). Neither the
marginal effects for TONSLIT nor PCTOFI are
statistically significant. For each additional
acre farmed (ACFARMED), the probability de-
creases by 0.003. Already selling litter (SELLIT)
increases the probability by 0.85 compared
with not already selling litter.
Pricing of Litter to be Sold
A total of 30 farmers answered all questions for
the variables included in the Ordered Probit
analysis of litter price category (Equation 8).
Of the responding farmers, 27% indicated they
would be willing to sell litter at less than $15
per ton, 43% would be willing to sell at $15 to
$25 per ton, and 30% would be willing to sell at
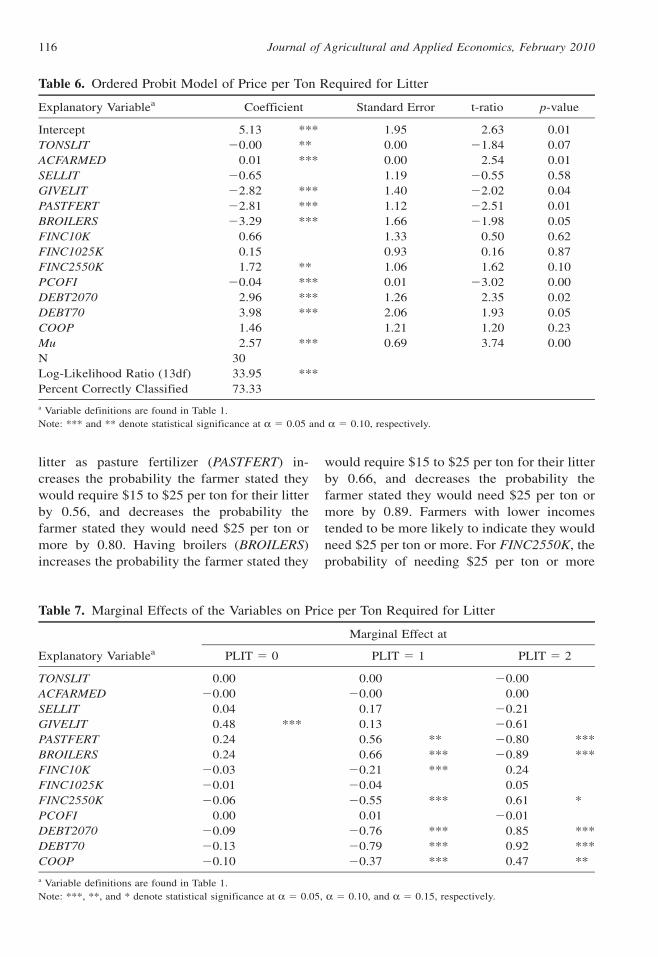
$25 per ton or more. The estimated Ordered
Probit model is presented in Table 6. The model
is significant at the 0.05 probability level (Log-
Likelihood Ratio 5 33.95; 13 df) and correctly
classifies 73% of the observations.
The coefficients on the explanatory vari-
ables are of expected sign in the estimated
model with the exception of SELLIT; however,
the estimated coefficient is not significantly
different from zero for this variable. As
expected, the sign on TONSLIT is negative and
ACFARMED is positive. Giving litter away
(GIVELIT), using it as fertilizer (PASTFERT),
having broilers (BROILERS), and higher per-
cent of off-farm income (PCTOFI) all have
negative influences on the probability of re-
quiring $25 or more per ton (positive impacts
on probability of requiring less than $15 per
ton). More indebted farmers (DEBT2070,
DEBT70), those with moderate farm incomes
(FINC2550K), and cooperative members (COOP)
are more likely to indicate they would need
a $25 or more (less likely to indicate they need
$15 per ton or less).
The marginal effects from the Ordered
Probit model are presented in Table 7. The
marginal effect for GIVELIT is significantly
positive for the lowest pricing category. The
marginal effect indicates that giving away litter
increases the probability of being willing to sell
litter at less than $15 per ton by 0.48. Using
Table 5. Marginal Effects of the Variables on Willingness to Invest in an Energy Cooperative
Explanatory Variablea Marginal Effect Standard Error t-ratio p-value
TONSLIT 0.00 0.00 1.36 0.17
ACFARMED 20.00 0.00 1.43 0.15
SELLIT 0.85 * 0.20 4.30 0.00
GIVELIT 0.23 0.24 0.92 0.36
PASTFERT 0.72 *** 0.33 2.21 0.03
BROILERS 20.99 *** 0.03 229.05 0.00
FULLOWN 20.27 0.20 1.30 0.19
FINC10K 20.12 0.40 20.30 0.76
FINC1025K 20.10 0.50 20.21 0.84
FINC2550K 20.99 *** 0.02 252.39 0.00
PCOFI 20.01 20.01 1.27 0.20
DEBT2070 20.66 0.42 1.57 0.12
DEBT70 20.97 * 20.10 10.07 0.00
COLLGRAD 0.93 *** 0.15 6.16 0.00
AGEGT65 0.59 *** 0.20 2.92 0.00
COOP 0.84 *** 0.19 4.34 0.00
ECOST 0.52 0.38 1.37 0.17
a Variable definitions are found in Table 1.
Note: *** and * denote statistical significance at a 5 0.05, a 5 0.10, and a 5 0.15, respectively.
Jensen et al.: Farmer Willingness to Supply Poultry Litter for Energy Conversion 115
litter as pasture fertilizer (PASTFERT) in-
creases the probability the farmer stated they
would require $15 to $25 per ton for their litter
by 0.56, and decreases the probability the
farmer stated they would need $25 per ton or
more by 0.80. Having broilers (BROILERS)
increases the probability the farmer stated they
would require $15 to $25 per ton for their litter
by 0.66, and decreases the probability the
farmer stated they would need $25 per ton or
more by 0.89. Farmers with lower incomes
tended to be more likely to indicate they would
need $25 per ton or more. For FINC2550K, the
probability of needing $25 per ton or more
Table 6. Ordered Probit Model of Price per Ton Required for Litter
Explanatory Variablea Coefficient Standard Error t-ratio p-value
Intercept 5.13 *** 1.95 2.63 0.01
TONSLIT 20.00 ** 0.00 21.84 0.07
ACFARMED 0.01 *** 0.00 2.54 0.01
SELLIT 20.65 1.19 20.55 0.58
GIVELIT 22.82 *** 1.40 22.02 0.04
PASTFERT 22.81 *** 1.12 22.51 0.01
BROILERS 23.29 *** 1.66 21.98 0.05
FINC10K 0.66 1.33 0.50 0.62
FINC1025K 0.15 0.93 0.16 0.87
FINC2550K 1.72 ** 1.06 1.62 0.10
PCOFI 20.04 *** 0.01 23.02 0.00
DEBT2070 2.96 *** 1.26 2.35 0.02
DEBT70 3.98 *** 2.06 1.93 0.05
COOP 1.46 1.21 1.20 0.23
Mu 2.57 *** 0.69 3.74 0.00
N 30
Log-Likelihood Ratio (13df) 33.95 ***
Percent Correctly Classified 73.33
a Variable definitions are found in Table 1.
Note: *** and ** denote statistical significance at a 5 0.05 and a 5 0.10, respectively.
Table 7. Marginal Effects of the Variables on Price per Ton Required for Litter
Marginal Effect at
Explanatory Variablea PLIT 5 0 PLIT 5 1 PLIT 5 2
TONSLIT 0.00 0.00 20.00
ACFARMED 20.00 20.00 0.00
SELLIT 0.04 0.17 20.21
GIVELIT 0.48 *** 0.13 20.61
PASTFERT 0.24 0.56 ** 20.80 ***
BROILERS 0.24 0.66 *** 20.89 ***
FINC10K 20.03 20.21 *** 0.24
FINC1025K 20.01 20.04 0.05
FINC2550K 20.06 20.55 *** 0.61 *
PCOFI 0.00 0.01 20.01
DEBT2070 20.09 20.76 *** 0.85 ***
DEBT70 20.13 20.79 *** 0.92 ***
COOP 20.10 20.37 *** 0.47 **
a Variable definitions are found in Table 1.
Note: ***, **, and * denote statistical significance at a 5 0.05, a 5 0.10, and a 5 0.15, respectively.
Journal of Agricultural and Applied Economics, February 2010116
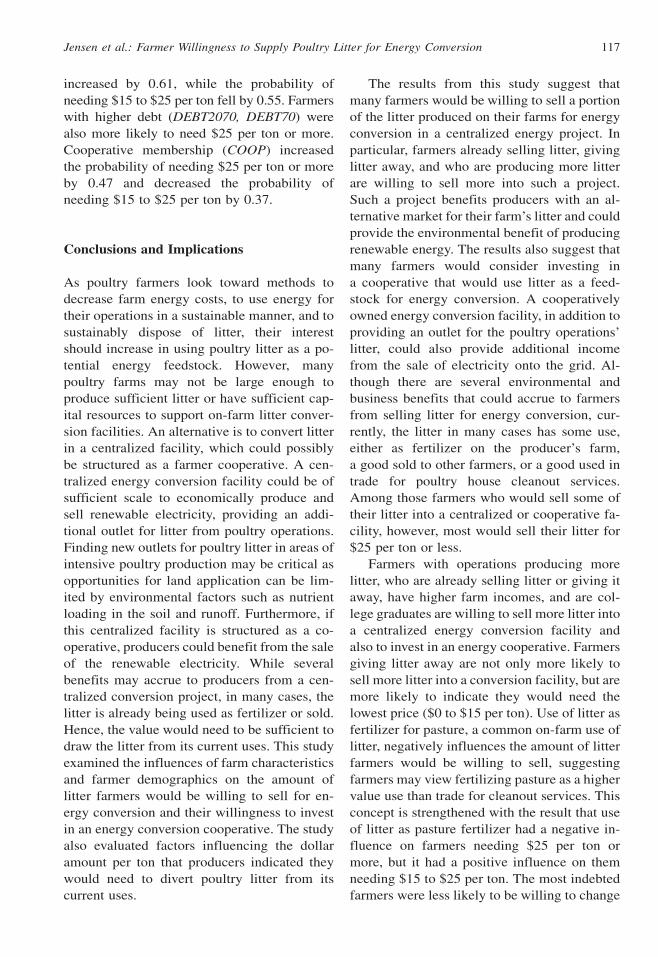
increased by 0.61, while the probability of
needing $15 to $25 per ton fell by 0.55. Farmers
with higher debt (DEBT2070, DEBT70) were
also more likely to need $25 per ton or more.
Cooperative membership (COOP) increased
the probability of needing $25 per ton or more
by 0.47 and decreased the probability of
needing $15 to $25 per ton by 0.37.
Conclusions and Implications
As poultry farmers look toward methods to
decrease farm energy costs, to use energy for
their operations in a sustainable manner, and to
sustainably dispose of litter, their interest
should increase in using poultry litter as a po-
tential energy feedstock. However, many
poultry farms may not be large enough to
produce sufficient litter or have sufficient cap-
ital resources to support on-farm litter conver-
sion facilities. An alternative is to convert litter
in a centralized facility, which could possibly
be structured as a farmer cooperative. A cen-
tralized energy conversion facility could be of
sufficient scale to economically produce and
sell renewable electricity, providing an addi-
tional outlet for litter from poultry operations.
Finding new outlets for poultry litter in areas of
intensive poultry production may be critical as
opportunities for land application can be lim-
ited by environmental factors such as nutrient
loading in the soil and runoff. Furthermore, if
this centralized facility is structured as a co-
operative, producers could benefit from the sale
of the renewable electricity. While several
benefits may accrue to producers from a cen-
tralized conversion project, in many cases, the
litter is already being used as fertilizer or sold.
Hence, the value would need to be sufficient to
draw the litter from its current uses. This study
examined the influences of farm characteristics
and farmer demographics on the amount of
litter farmers would be willing to sell for en-
ergy conversion and their willingness to invest
in an energy conversion cooperative. The study
also evaluated factors influencing the dollar
amount per ton that producers indicated they
would need to divert poultry litter from its
current uses.
The results from this study suggest that
many farmers would be willing to sell a portion
of the litter produced on their farms for energy
conversion in a centralized energy project. In
particular, farmers already selling litter, giving
litter away, and who are producing more litter
are willing to sell more into such a project.
Such a project benefits producers with an al-
ternative market for their farm’s litter and could
provide the environmental benefit of producing
renewable energy. The results also suggest that
many farmers would consider investing in
a cooperative that would use litter as a feed-
stock for energy conversion. A cooperatively
owned energy conversion facility, in addition to
providing an outlet for the poultry operations’
litter, could also provide additional income
from the sale of electricity onto the grid. Al-
though there are several environmental and
business benefits that could accrue to farmers
from selling litter for energy conversion, cur-
rently, the litter in many cases has some use,
either as fertilizer on the producer’s farm,
a good sold to other farmers, or a good used in
trade for poultry house cleanout services.
Among those farmers who would sell some of
their litter into a centralized or cooperative fa-
cility, however, most would sell their litter for
$25 per ton or less.
Farmers with operations producing more
litter, who are already selling litter or giving it
away, have higher farm incomes, and are col-
lege graduates are willing to sell more litter into
a centralized energy conversion facility and
also to invest in an energy cooperative. Farmers
giving litter away are not only more likely to
sell more litter into a conversion facility, but are
more likely to indicate they would need the
lowest price ($0 to $15 per ton). Use of litter as
fertilizer for pasture, a common on-farm use of
litter, negatively influences the amount of litter
farmers would be willing to sell, suggesting
farmers may view fertilizing pasture as a higher
value use than trade for cleanout services. This
concept is strengthened with the result that use
of litter as pasture fertilizer had a negative in-
fluence on farmers needing $25 per ton or
more, but it had a positive influence on them
needing $15 to $25 per ton. The most indebted
farmers were less likely to be willing to change
Jensen et al.: Farmer Willingness to Supply Poultry Litter for Energy Conversion 117
markets to sell into a centralized facility, less
likely to be willing to invest in an energy
conversion cooperative, and more likely to
want $25 or more for their litter. These results
suggest that most indebted farmers may be least
likely to take on a new market risk and require
the greatest premium to switch to a new market
for their litter. The negative sign on cooperative
membership in the model of tons to be sold to
a conversion facility coupled with the posi-
tive sign in the cooperative model suggests that
farmers who are cooperative members may view
selling through a farmer owned cooperative that
converts litter to energy as more desirable than
selling to a third party owned conversion
facility.
This study was conducted analyzing data
from poultry producers in a single state. Future
research should likely expand the study area to
other poultry producing regions. The fact that
college education has a positive influence both
on willingness to supply a centralized facility
and to invest in an energy conversion co-
operative hints that producers may factor envi-
ronmental benefits into their decisions about
poultry litter for energy conversion. However,
this concept was not investigated directly in this
study. Hence, future research might examine the
attitudes of farmers toward environmentally
sustainable disposal of litter and potential envi-
ronmental benefits of converting litter to energy.
[Received March 2009; Accepted September 2009.]
References
Armstrong, A., H. Goodwin, and S. Hamm. ‘‘Co-
processed Poultry Litter and Dewatered Mu-
nicipal Biosolids: Feasibility as an Alternative
Management Approach for Surplus Waste.’’
Paper presented at the Southern Agricultural
Economics Association Annual Meetings,
Mobile, AL, February 4–7, 2007.
Bachewe, F., W. Lazarus, P. Goodrich, M.
Drewitz, and B. Balk. ‘‘Review of the Litera-
ture on the Economics of Central Anaerobic
Digesters.’’ Staff Paper P08-09, University of
Minnesota, Department of Applied Economics,
October 2008.
Black, W. ‘‘Understanding the Cooperative
Member.’’ Farmer Cooperatives for the Future.
L. Schrader and W. Dobson, eds. pp. 143–51.
West Lafayette, Indiana: Purdue University, 1985.
Bravo-Ureta, B., and T. Lee. ‘‘Socioeconomic
and Technical Characteristics of New England
Dairy Cooperative Members and Non-
members.’’ Journal of Agricultural Co-
operation 3(1988):12–27.
Carreira, R., K. Young, H. Goodwin, and E.
Wailes. ‘‘How Far Can Poultry Litter Go? A
New Technology for Litter Transport.’’ Journal
of Agricultural and Applied Economics
39,03(2007):611–23.
Carreira, R., H. Goodwin, and S. Hamm. ‘‘How
Much Is Poultry Litter Worth?’’ Paper pre-
sented at the Southern Agricultural Economics
Association Annual Meetings, Orlando, FL,
February 4–8, 2006.
Cunningham, D. ‘‘Broiler Production Systems in
Georgia 2007–2008 Costs and Returns Analy-
sis’’ The University of Georgia. Department
of Poultry Science. Internet site: http://pubs.
caes.uga.edu/caespubs/pubs/PDF/B1240-3.pdf
(Accessed September 8, 2008).
Department of Energy (DOE). Bioenergy. Inter-
net site: http://www.energy.gov/energysources/
bioenergy.htm (Accessed August 11, 2009).
Environmental Protection Agency (EPA). ‘‘Fund-
ing On-Farm Biogas Recovery Systems: A
Guide to Federal and State Resources.’’ EPA
Report 430-F-04-002. K. Roos, H. Zygmunt,
and S. von Feck, eds. Internet site: http://www.
epa.gov/agstar/pdf/ag_fund_doc.pdf (Accessed
March 18, 2009).
Flora, J. and C. Riahi-Nezhad. ‘‘Availability of
Poultry Manure as a Potential Bio-Fuel Feed-
stock for Energy Production.’’ University of
South Carolina, Report to the South Carolina
Energy Office, August 2006.
Goan, C., L. Warren, B. Park, and R. Roberts.
‘‘Production and Utilization of Poultry Litter
in Tennessee.’’ Paper presented at the Poultry
Science Association 91st Annual Meeting,
Newark, DE, August 11–14, 2002.
Greene, W. Econometric Analysis. 6th ed. Upper
Saddle River, New Jersey: Prentice Hall,
2008.
Howry, S., A. Stoecker, D. Storm, and M. White.
‘‘Economic Analysis of Management Practices
to Reduce Phosphorus Load to Lake Eucha and
Spavinaw.’’ Paper presented at the Southern
Agricultural Economics Association Annual
Meetings, Dallas, TX, February 2–6, 2008.
Kemper, N., H. Goodwin, and M. Mozaffari. ‘‘The
Nitrogen Fertilizer Value of Baled Broiler Litter
for Cotton Production in the Arkansas Delta.’’
Journal of Agricultural and Applied Economics, February 2010118
Paper presented at the Southern Agricultural
Economics Association Annual Meetings, Dal-
las, TX, February 2–6, 2008.
Kubsch, K. ‘‘Cooperative Anaerobic Digestion as a
Manure Management Alternative in Northeastern
Wisconsin.’’ Research Study Summary. Uni-
versity of Wisconsin, Green Bay. September 5,
2003.
LaCapra Associates. ‘‘Analysis of a Renewable
Portfolio Standard for the State of North Car-
olina.’’ 2006. Internet site: http://www.lacapra.
com/downloads/NC_RPS_Report.pdf (Accessed
April 13, 2009).
Lewis, J. ‘‘Bio-Gas Plants and Hog Farming in
North Carolina.’’ Duke University, North Car-
olina, Spring 2001. Internet site: http://www.
econ.duke.edu/dje/2001/lewis.pdf (Accessed
March 18, 2009).
Myers, M.E., and C. Deisinger. ‘‘Developing a
Community Manure Digester Model for Wis-
consin.’’ Report by Cooperative Development
Services, USDA. June 2006.
Puaha, H. ‘‘Investment Decisions in New Gener-
ation Cooperatives: A Case Study of Value
Added Products (VAP) Cooperative in Alva,
Oklahoma.’’ Paper presented at the Southern
Agricultural Economics Association Annual
Meetings, Mobile, AL, February 1–5, 2003.
Stofferahn, C. ‘‘Individualism or Cooperation:
Preferences for Sharing Machinery and Labor.’’
Journal of Cooperatives 18(2004):1–17.
Wachenheim, C., R. deHillerin, and M. Dumler.
‘‘Producer Perceptions of Hog Marketing Co-
operatives.’’ Journal of Cooperatives 16(2001):
25–45.
Whittington, A. ‘‘Availability of Poultry Litter
as an Alternative Energy Feedstock: The Case
for Mississippi.’’ Paper presented at Southern
Agricultural Economics Association Annual
Meetings, Mobile, AL, February 4–7, 2007.
Jensen et al.: Farmer Willingness to Supply Poultry Litter for Energy Conversion 119