Embed Size (px)
Citation preview
FarmEcon LLCA source of information on global farming and food systems
Thomas E. Elam, PhDPresident
Livestock Outlook:∆Demand - ∆Supply ≈ ∆Price
Dr. Thomas E. ElamPresidentFarmEcon LLCMarch 7, 2009

FarmEcon LLCA source of information on global farming and food systemsThomas E. Elam, PhDPresident
2008 OUTLOOKBottom line: A deteriorating balance of higher costs, increasing production, and a more difficult demand growth scenario.
FarmEcon LLCA source of information on global farming and food systemsThomas E. Elam, PhDPresident
2009 OUTLOOKSummary: Declining production sets the stage for higher prices, feed costs likely to be less volatile, but export and U.S. demand remain a huge question mark.
FarmEcon LLCA source of information on global farming and food systemsThomas E. Elam, PhDPresident
Lower meat supplies chasing lower demand, costs still high and volatileGlobal contraction in GDP and income2008 meat export bright spot; fading in 2009Demand weakening
Declines concentrated in HRI and exportsRetail demand weakness in high end foods
Farm level prices not covering higher costsSupply continues to fall until price > cost
FarmEcon LLCA source of information on global farming and food systemsThomas E. Elam, PhDPresident
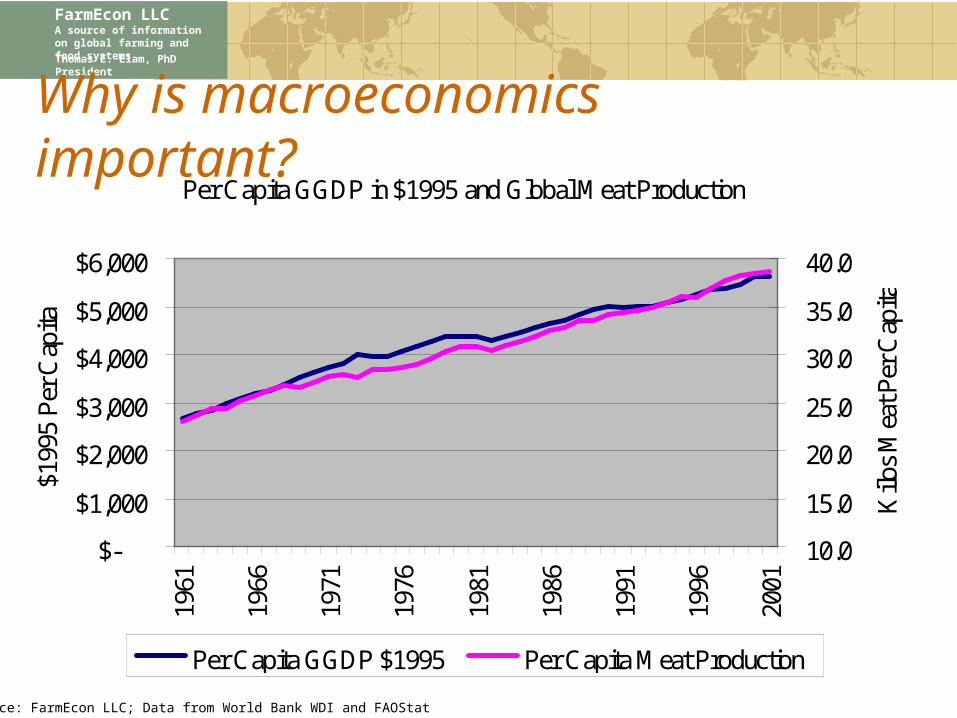
Why is macroeconomics important?Per Capita GGDP in $1995 and Global Meat Production
$-
$1,000
$2,000
$3,000
$4,000
$5,000
$6,000
1961
1966
1971
1976
1981
1986
1991
1996
2001
$199
5 P
er C
apita
10.0
15.0
20.0
25.0
30.0
35.0
40.0
Kilo
s M
eat P
er C
apita
Per Capita GGDP $1995 Per Capita Meat Production
Source: FarmEcon LLC; Data from World Bank WDI and FAOStat
FarmEcon LLCA source of information on global farming and food systemsThomas E. Elam, PhDPresident
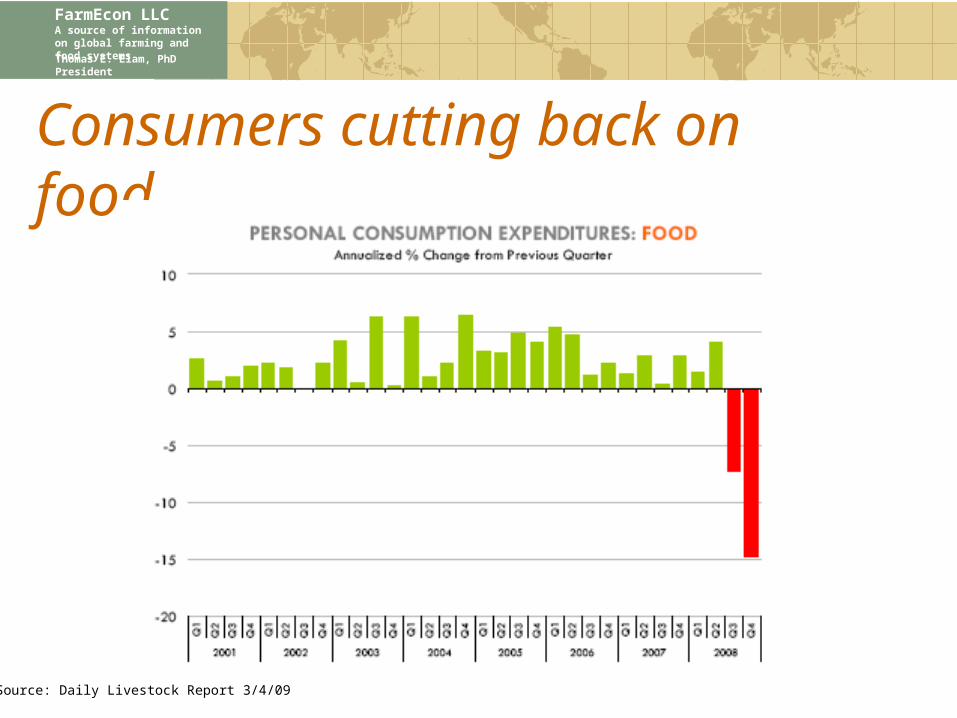
Consumers cutting back on food
Source: Daily Livestock Report 3/4/09

FarmEcon LLCA source of information on global farming and food systemsThomas E. Elam, PhDPresident
Meat exports exploded in 2008, outlook cloudy
0
2,000
4,000
6,000
8,000
10,000
12,000
14,000
16,000
Mill
ion
Pou
nds
2004 2005 2006 2007 2008 2009 f
TurkeyBroilersPorkBeef
FarmEcon LLCA source of information on global farming and food systemsThomas E. Elam, PhDPresident
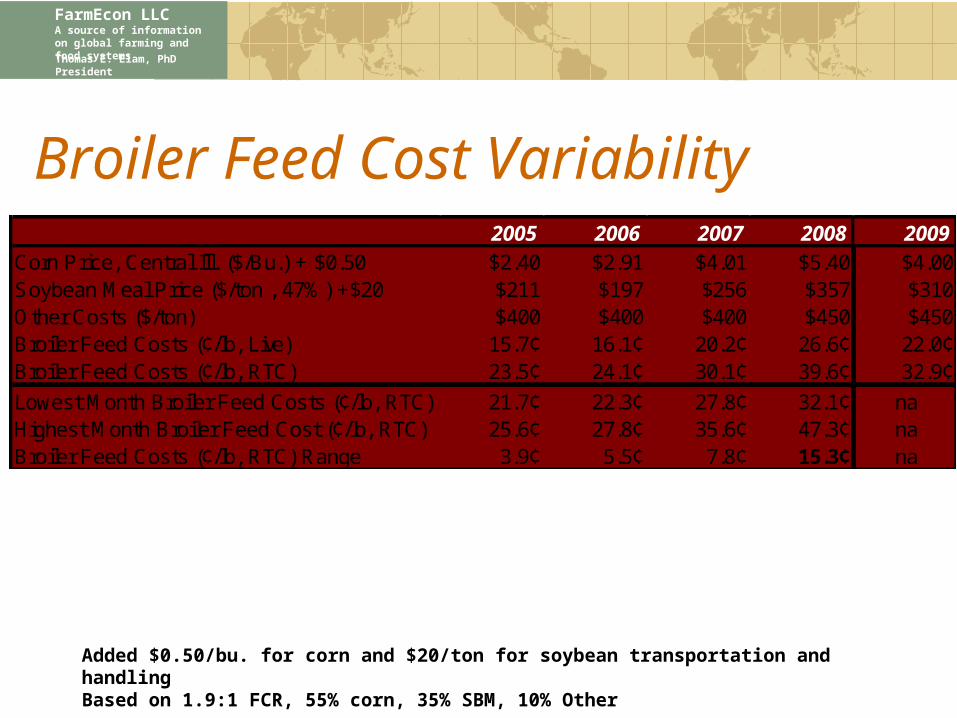
Broiler Feed Cost Variability
Added $0.50/bu. for corn and $20/ton for soybean transportation and handlingBased on 1.9:1 FCR, 55% corn, 35% SBM, 10% Other
2005 2006 2007 2008 2009Corn Price, Central Ill. ($/Bu.) + $0.50 $2.40 $2.91 $4.01 $5.40 $4.00Soybean Meal Price ($/ton , 47%) +$20 $211 $197 $256 $357 $310Other Costs ($/ton) $400 $400 $400 $450 $450Broiler Feed Costs (¢/lb, Live) 15.7¢ 16.1¢ 20.2¢ 26.6¢ 22.0¢Broiler Feed Costs (¢/lb, RTC) 23.5¢ 24.1¢ 30.1¢ 39.6¢ 32.9¢
Lowest Month Broiler Feed Costs (¢/lb, RTC) 21.7¢ 22.3¢ 27.8¢ 32.1¢ naHighest Month Broiler Feed Cost (¢/lb, RTC) 25.6¢ 27.8¢ 35.6¢ 47.3¢ naBroiler Feed Costs (¢/lb, RTC) Range 3.9¢ 5.5¢ 7.8¢ 15.3¢ na
FarmEcon LLCA source of information on global farming and food systemsThomas E. Elam, PhDPresident
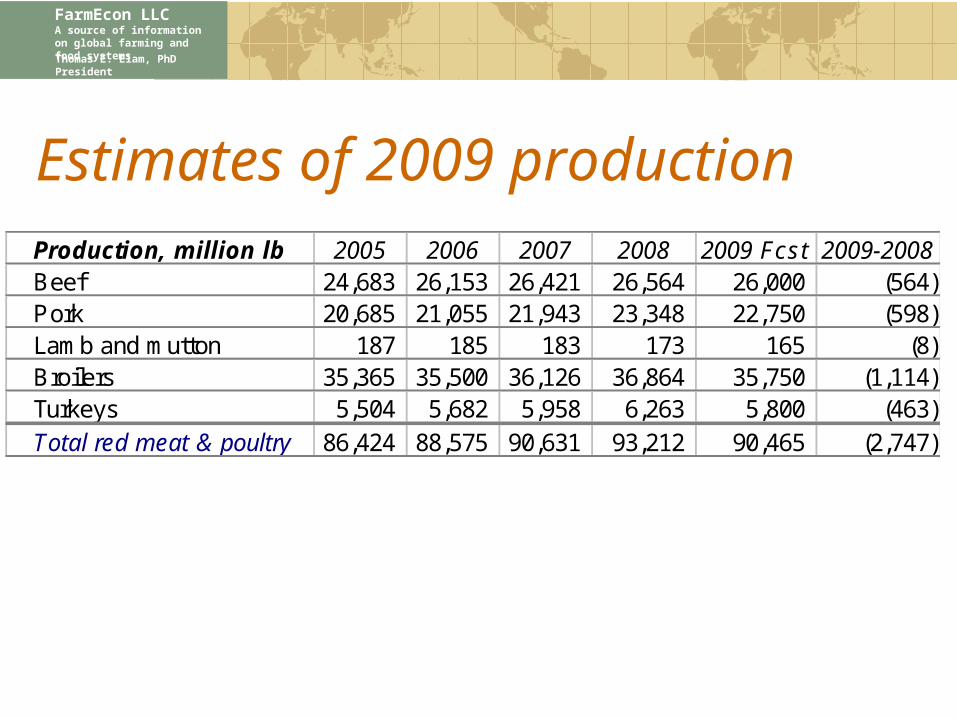
Estimates of 2009 productionProduction, million lb 2005 2006 2007 2008 2009 Fcst 2009-2008
Beef 24,683 26,153 26,421 26,564 26,000 (564) Pork 20,685 21,055 21,943 23,348 22,750 (598) Lamb and mutton 187 185 183 173 165 (8) Broilers 35,365 35,500 36,126 36,864 35,750 (1,114) Turkeys 5,504 5,682 5,958 6,263 5,800 (463) Total red meat & poultry 86,424 88,575 90,631 93,212 90,465 (2,747)

FarmEcon LLCA source of information on global farming and food systemsThomas E. Elam, PhDPresident
Hog Supply/Demand/Price
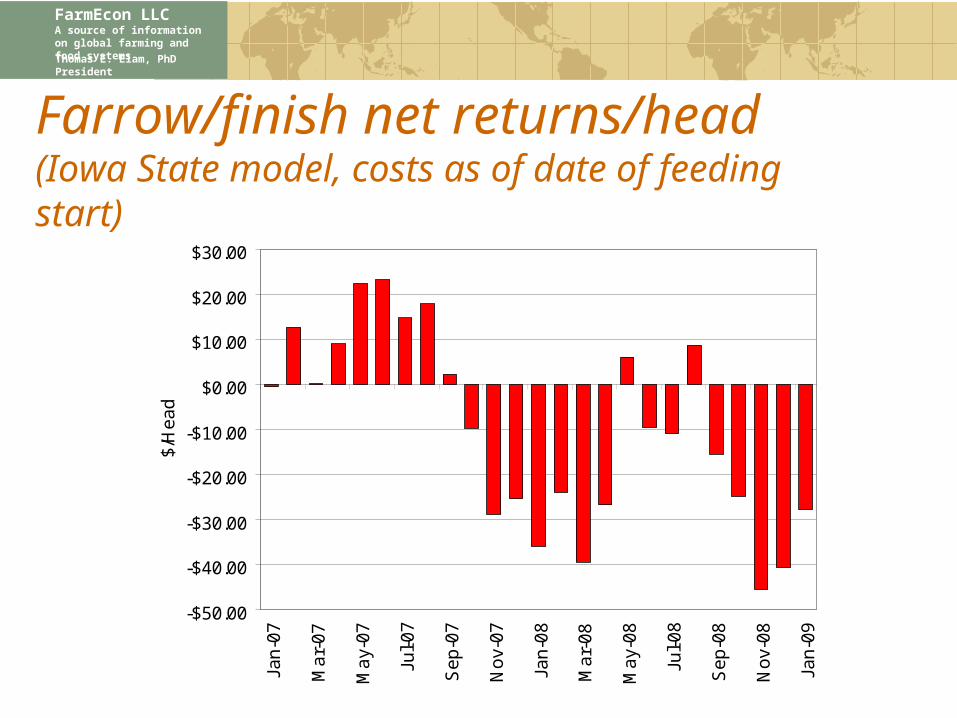
Production slow to adjustAre our budgets realistic?Contracting having a major effect?
Export demand will decline due to global recession and exchange ratesDomestic demand declining based on hog prices versus per capita consumption
FarmEcon LLCA source of information on global farming and food systemsThomas E. Elam, PhDPresident
Farrow/finish net returns/head(Iowa State model, costs as of date of feeding start)
-$50.00
-$40.00
-$30.00
-$20.00
-$10.00
$0.00
$10.00
$20.00
$30.00Ja
n-0
7
Ma
r-0
7
Ma
y-0
7
Jul-
07
Se
p-0
7
No
v-0
7
Jan
-08
Ma
r-0
8
Ma
y-0
8
Jul-
08
Se
p-0
8
No
v-0
8
Jan
-09
$/H
ea
d

FarmEcon LLCA source of information on global farming and food systemsThomas E. Elam, PhDPresident
2009 Outlook
Stated profitability improving as high cost grain moves through the budgetRetail pork prices still reflecting higher hog pricesCurrent b/e is about $56 (live) moving to about $50 by MayProduction decline unlikely to restore pre-2007 profitability levels this year

FarmEcon LLCA source of information on global farming and food systemsThomas E. Elam, PhDPresident
Cattle adjustment underway
On-feed number -6%Cow liquidation has started
U.S./Canadian beef cows -3%Dairy cow numbers declining
• Adding to short run beef supply
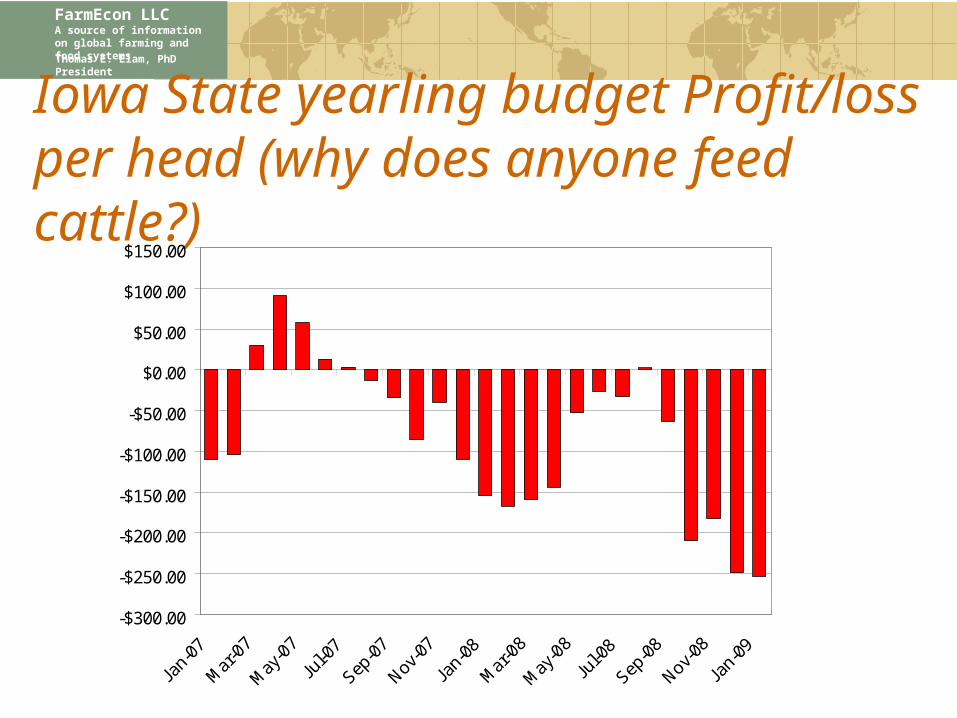
Modest 2009 beef production drop2010 beef production down 2-3%Continued pressure on feeder prices Long term production capacity declining
FarmEcon LLCA source of information on global farming and food systemsThomas E. Elam, PhDPresident
Iowa State yearling budget Profit/loss per head (why does anyone feed cattle?)
-$300.00
-$250.00
-$200.00
-$150.00
-$100.00
-$50.00
$0.00
$50.00
$100.00
$150.00
Jan-
07
Mar
-07
May
-07
Jul-0
7
Sep-0
7
Nov-0
7
Jan-
08
Mar
-08
May
-08
Jul-0
8
Sep-0
8
Nov-0
8
Jan-
09

FarmEcon LLCA source of information on global farming and food systemsThomas E. Elam, PhDPresident
OK City Feeder Steer/Panhandle Steer Ratio
100%
105%
110%
115%
120%
125%
130%
135%
140%
145%
150%
Jan Feb Mar Apr May Jun Jul Aug Sep Oct Nov Dec
2004 2005 2006 2007 2008
FarmEcon LLCA source of information on global farming and food systemsThomas E. Elam, PhDPresident
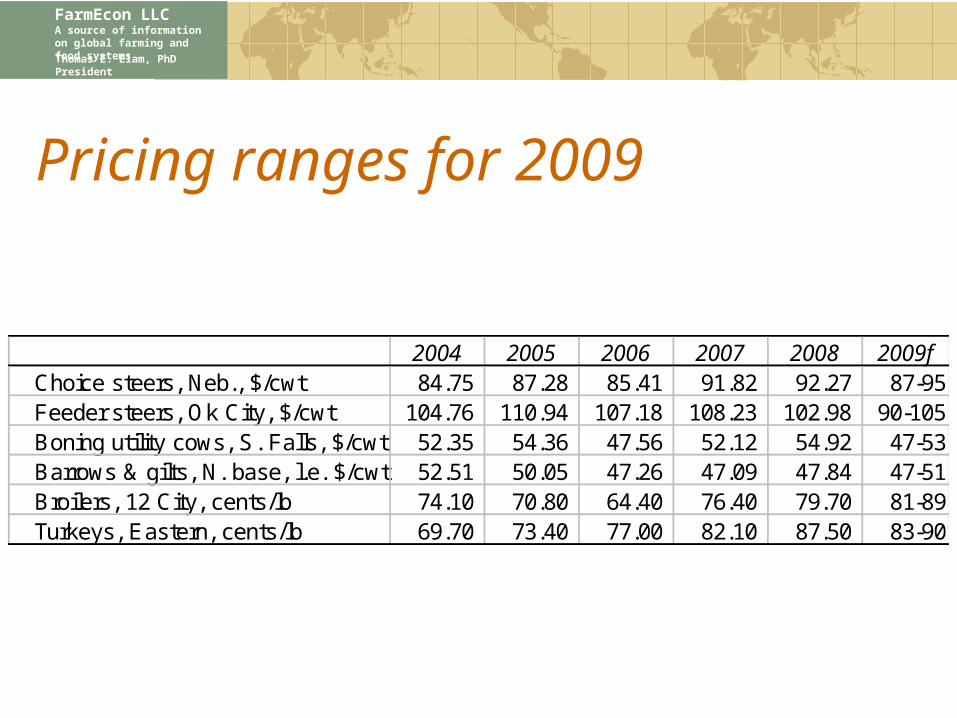
Pricing ranges for 2009
2004 2005 2006 2007 2008 2009f Choice steers, Neb., $/cwt 84.75 87.28 85.41 91.82 92.27 87-95 Feeder steers, Ok City, $/cwt 104.76 110.94 107.18 108.23 102.98 90-105 Boning utility cows, S. Falls, $/cwt 52.35 54.36 47.56 52.12 54.92 47-53 Barrows & gilts, N. base, l.e. $/cwt 52.51 50.05 47.26 47.09 47.84 47-51 Broilers, 12 City, cents/lb 74.10 70.80 64.40 76.40 79.70 81-89 Turkeys, Eastern, cents/lb 69.70 73.40 77.00 82.10 87.50 83-90

FarmEcon LLCA source of information on global farming and food systemsThomas E. Elam, PhDPresident
Feed Cost Outlook2009/2010

FarmEcon LLCA source of information on global farming and food systemsThomas E. Elam, PhDPresident
Ethanol Factoids
18% of completed ethanol capacity closed due to bankruptcy or poor margins
The cost of a commercial scale cellulosic ethanol plant is $10-20/gallon capacity
Burning corn to replace natural gas and using that gas to power vehicles would generate more net energy than ethanol made from corn
FarmEcon LLCA source of information on global farming and food systemsThomas E. Elam, PhDPresident
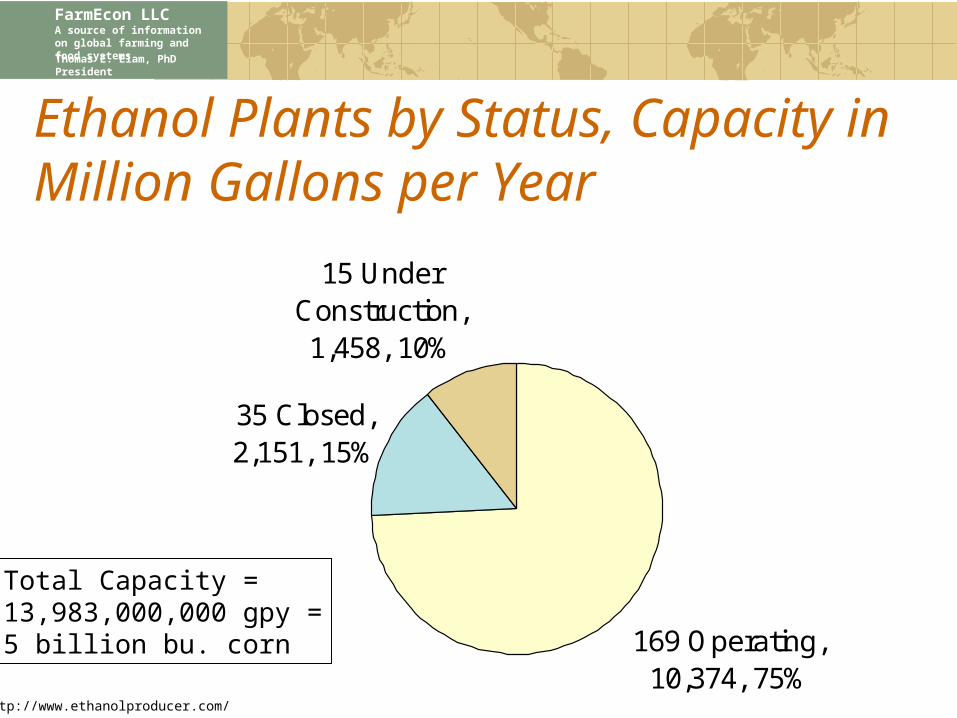
Ethanol Plants by Status, Capacity in Million Gallons per Year
http://www.ethanolproducer.com/
169 Operating, 10,374, 75%
35 Closed, 2,151, 15%
15 Under Construction, 1,458, 10%
Total Capacity =13,983,000,000 gpy =5 billion bu. corn
FarmEcon LLCA source of information on global farming and food systemsThomas E. Elam, PhDPresident
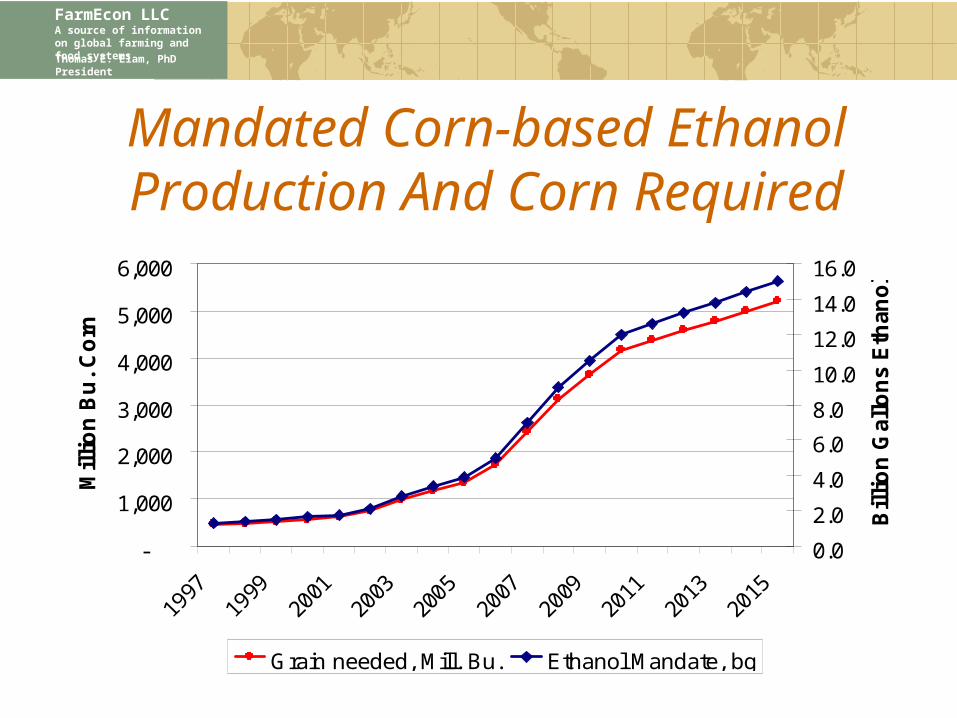
Mandated Corn-based Ethanol Production And Corn Required
-
1,000
2,000
3,000
4,000
5,000
6,000
Mil
lio
n B
u.
Co
rn
0.0
2.0
4.0
6.0
8.0
10.0
12.0
14.0
16.0
Bil
lio
n G
allo
ns
Eth
ano
l
Grain needed, Mill. Bu. Ethanol Mandate, bg
FarmEcon LLCA source of information on global farming and food systemsThomas E. Elam, PhDPresident

FarmEcon LLCA source of information on global farming and food systemsThomas E. Elam, PhDPresident
Gasoline and Corn Price Link
$-
$1.00
$2.00
$3.00
$4.00
$5.00
$6.00
$7.00
$8.00
$1.00 $1.50 $2.00 $2.50 $3.00 $3.50
Wholesale Gasoline, Omaha Rack, $/Gallon
SW
Iow
a C
orn
+ $
0.50
, $/
Bus
hel
Jan.-Sept. 2006
Ethanol Plant Breakeven Corn PriceIncluding $0.51 Federal Tax Credit
Ethanol Plant Breakeven Corn PriceExcluding $0.51 Federal Tax Credit
Oct-Dec 2008RFS Effect?
FarmEcon LLCA source of information on global farming and food systemsThomas E. Elam, PhDPresident
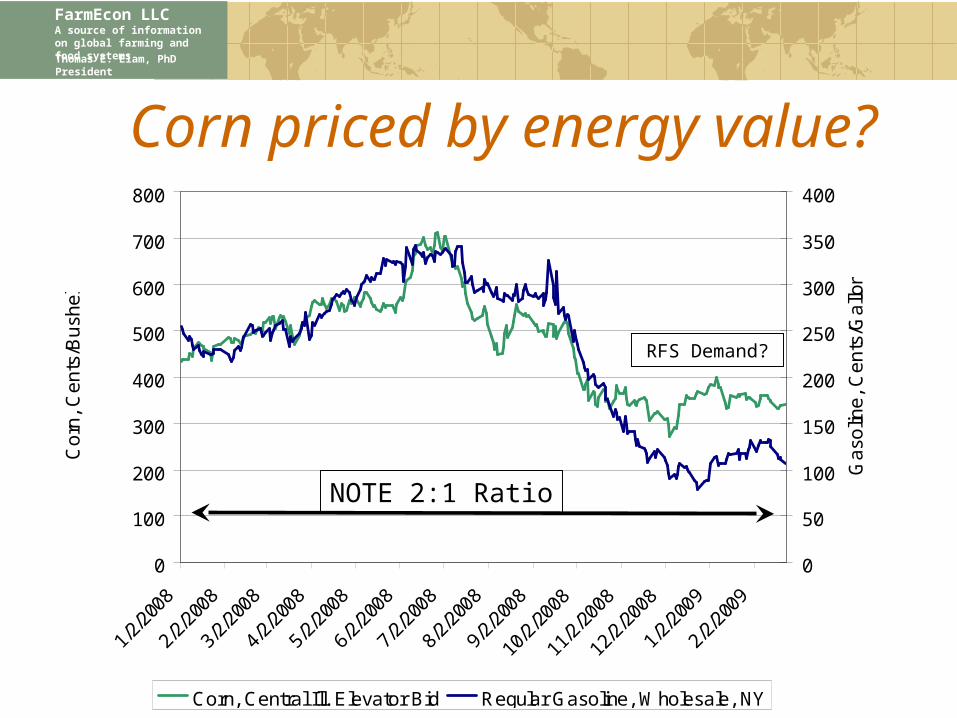
Corn priced by energy value?
NOTE 2:1 Ratio
0
100
200
300
400
500
600
700
800
1/2/
2008
2/2/
2008
3/2/
2008
4/2/
2008
5/2/
2008
6/2/
2008
7/2/
2008
8/2/
2008
9/2/
2008
10/2
/200
8
11/2
/200
8
12/2
/200
8
1/2/
2009
2/2/
2009
Co
rn,
Ce
nts
/Bu
she
l
0
50
100
150
200
250
300
350
400
Ga
solin
e,
Ce
nts
/Ga
llon
Corn, Central Ill. Elevator Bid Regular Gasoline, Wholesale, NY
RFS Demand?

FarmEcon LLCA source of information on global farming and food systemsThomas E. Elam, PhDPresident
What is corn worth if ethanol price = gasoline price?
$1.20 Gasoline/gallon $120.00 DDGS price/ton$0.45 +Tax credit $0.06 DDGS price/lb$1.65 =Ethanol value/gallon at blender 17 X Pounds DDGS/bu$0.25 -Blender/plant spread $1.02 =Corn value/bu of DDGS$1.40 =Net ethanol price to plant2.80 X Gallons ethanol/bu$3.92 =Corn value/bu of ethanol
$4.94 Gross value of corn/bu at plant$1.20 -Ethanol variable cost/bu$3.74 =Net value of corn at plant$0.50 -Elevator/plant basis$3.24 =Net value of corn at elevator
FarmEcon LLCA source of information on global farming and food systemsThomas E. Elam, PhDPresident
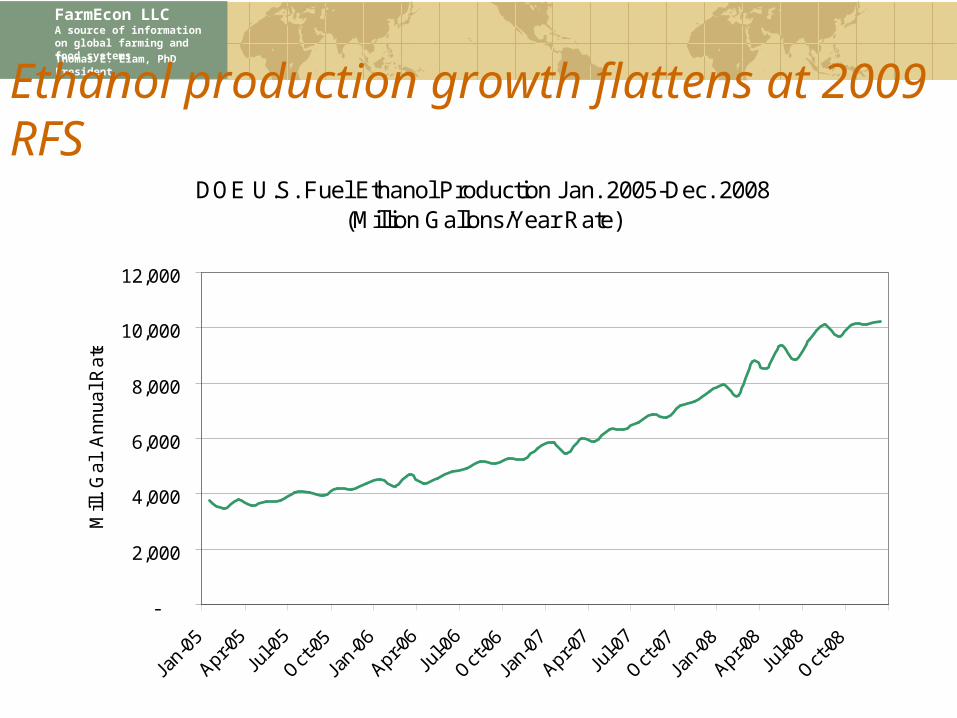
Ethanol production growth flattens at 2009 RFS
DOE U.S. Fuel Ethanol Production Jan. 2005-Dec. 2008 (Million Gallons/Year Rate)
-
2,000
4,000
6,000
8,000
10,000
12,000
Jan-
05
Apr-0
5
Jul-0
5
Oct-0
5
Jan-
06
Apr-0
6
Jul-0
6
Oct-0
6
Jan-
07
Apr-0
7
Jul-0
7
Oct-0
7
Jan-
08
Apr-0
8
Jul-0
8
Oct-0
8
Mill
. G
al.
An
nu
al R
ate
FarmEcon LLCA source of information on global farming and food systemsThomas E. Elam, PhDPresident
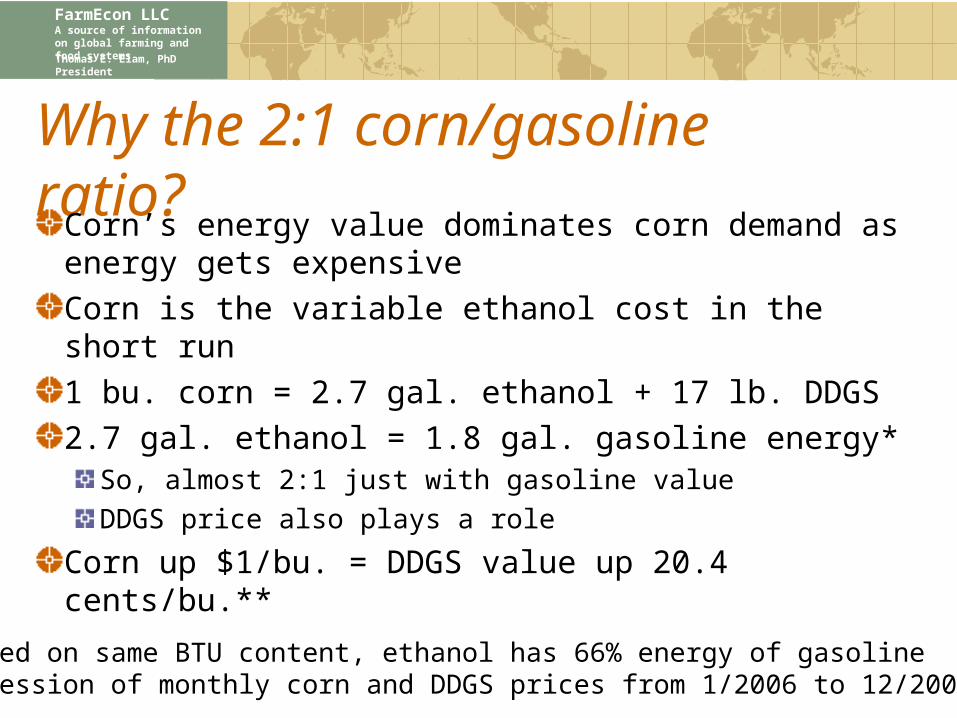
Why the 2:1 corn/gasoline ratio?Corn’s energy value dominates corn demand as energy gets expensiveCorn is the variable ethanol cost in the short run1 bu. corn = 2.7 gal. ethanol + 17 lb. DDGS 2.7 gal. ethanol = 1.8 gal. gasoline energy*
So, almost 2:1 just with gasoline valueDDGS price also plays a role
Corn up $1/bu. = DDGS value up 20.4 cents/bu.**
*Based on same BTU content, ethanol has 66% energy of gasoline**Regression of monthly corn and DDGS prices from 1/2006 to 12/2008

FarmEcon LLCA source of information on global farming and food systemsThomas E. Elam, PhDPresident
Why the 2:1 Ratio? Assume gasoline up by $1.00/gal.
Corn energy value up by $1.80/bushelDDGS price increases, adding to corn value
Adds another $0.37/bu.($1.80 corn price increase x $0.204 value/bu.)
Total corn value increase = $2.17Not statistically different from $2.00

FarmEcon LLCA source of information on global farming and food systemsThomas E. Elam, PhDPresident
Soyoil and Biodiesel Price Link
FarmEcon LLCA source of information on global farming and food systemsThomas E. Elam, PhDPresident

FarmEcon LLCA source of information on global farming and food systemsThomas E. Elam, PhDPresident
Corn Stocks/Price Curve Shifts Up
Source: Daily Livestock Report
FarmEcon LLCA source of information on global farming and food systemsThomas E. Elam, PhDPresident
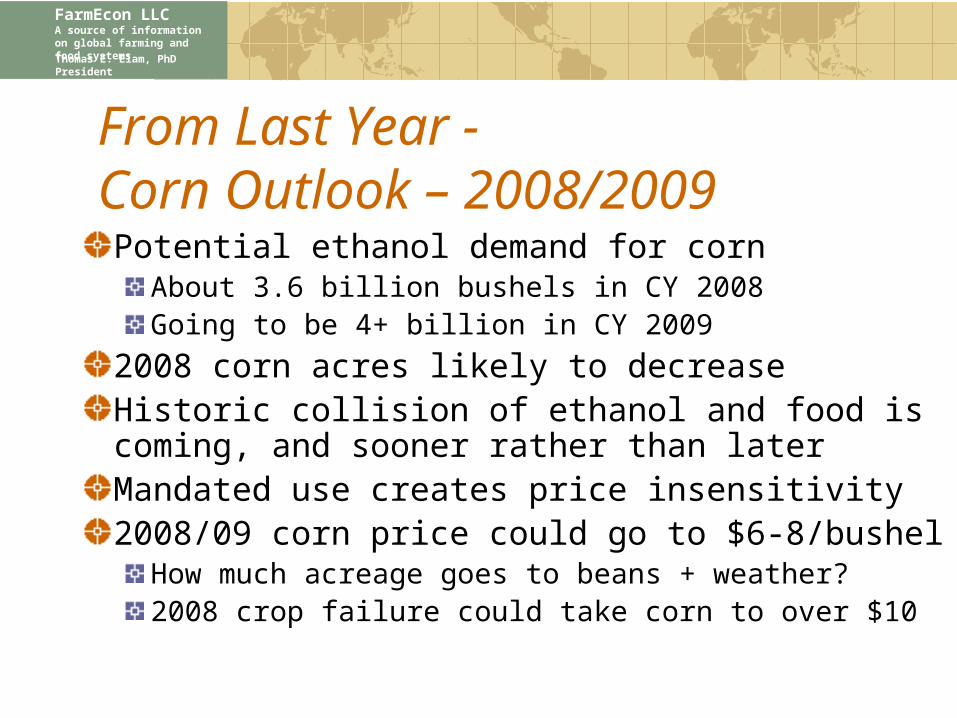
From Last Year - Corn Outlook – 2008/2009Potential ethanol demand for corn
About 3.6 billion bushels in CY 2008Going to be 4+ billion in CY 2009
2008 corn acres likely to decreaseHistoric collision of ethanol and food is coming, and sooner rather than laterMandated use creates price insensitivity2008/09 corn price could go to $6-8/bushel
How much acreage goes to beans + weather?2008 crop failure could take corn to over $10

FarmEcon LLCA source of information on global farming and food systemsThomas E. Elam, PhDPresident
Corn Overview – 2009/2010Potential ethanol demand for corn
About 3.6 billion bushels in CY 2009Going to be 4.0-4.2 billion in CY 2010
2009 corn acres about same as 2008Mandated use creates higher and more volatile corn price2009/10 corn price could go back to $6-8Where oil prices go, so goes corn and all other carbohydrates
FarmEcon LLCA source of information on global farming and food systemsThomas E. Elam, PhDPresident
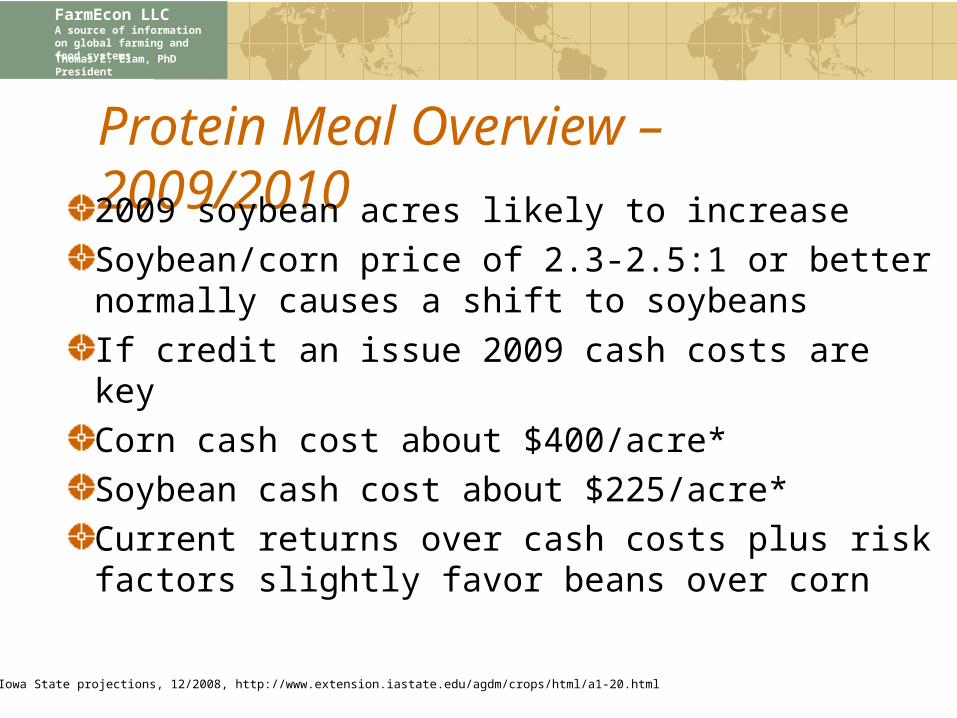
Protein Meal Overview – 2009/20102009 soybean acres likely to increaseSoybean/corn price of 2.3-2.5:1 or better normally causes a shift to soybeansIf credit an issue 2009 cash costs are keyCorn cash cost about $400/acre*Soybean cash cost about $225/acre*Current returns over cash costs plus risk factors slightly favor beans over corn
*Iowa State projections, 12/2008, http://www.extension.iastate.edu/agdm/crops/html/a1-20.html

FarmEcon LLCA source of information on global farming and food systemsThomas E. Elam, PhDPresident
Corn/Meal Price Outlook – 2008/2009
Corn prices remain at $3.25-$4.25, meal at $250-325, through May-JuneWeather and acres drive prices after that2009-2010 price outlook – some relief Biofuel production will grow due to RFS
Ethanol use mandate = ethanol price mandateVolatile energy prices are critical to outlookMore volatility in feed ingredients likely, but not as severe as 2008

FarmEcon LLCA source of information on global farming and food systemsThomas E. Elam, PhDPresident
#2 Yellow Corn, Central Illinois Elevator Truck Bid
$-
$1.00
$2.00
$3.00
$4.00
$5.00
$6.00
$7.00
$8.001/1
/2005
4/1
/2005
7/1
/2005
10/1
/2005
1/1
/2006
4/1
/2006
7/1
/2006
10/1
/2006
1/1
/2007
4/1
/2007
7/1
/2007
10/1
/2007
1/1
/2008
4/1
/2008
7/1
/2008
10/1
/2008
1/1
/2009
Average = $1.99, Standard Deviation = $0.16
Average = $3.32, Standard Deviation
= $0.48
Average = $4.41, Standard Deviation =
$1.07
Note increases in both average price and volatility!
FarmEcon LLCA source of information on global farming and food systemsThomas E. Elam, PhDPresident
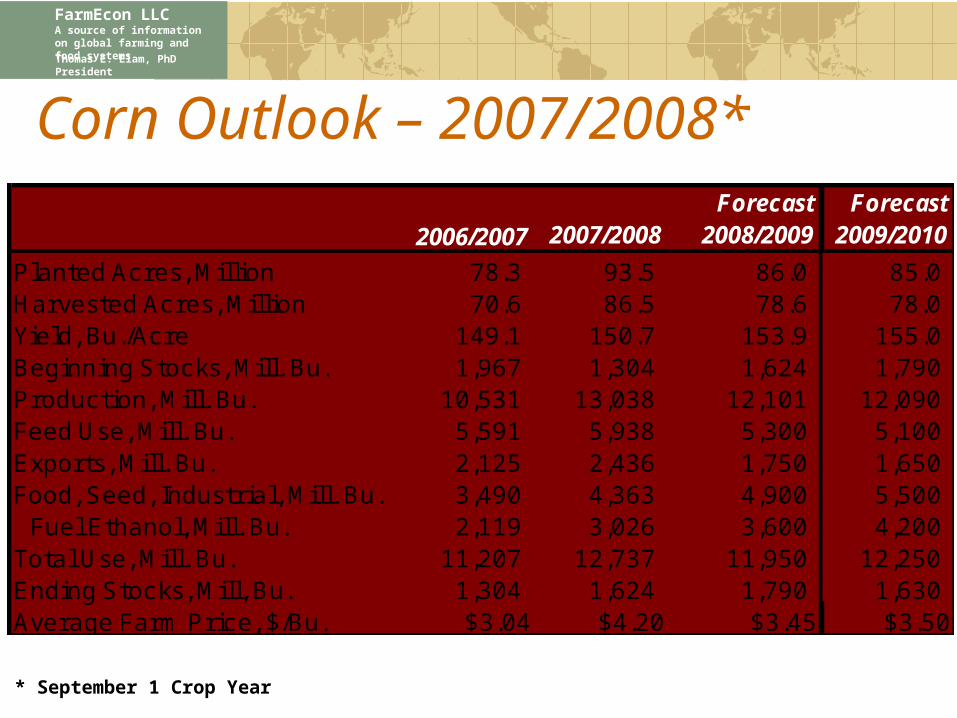
Corn Outlook – 2007/2008*
2006/2007 2007/2008Forecast
2008/2009Forecast
2009/2010
Planted Acres, Million 78.3 93.5 86.0 85.0 Harvested Acres, Million 70.6 86.5 78.6 78.0 Yield, Bu./Acre 149.1 150.7 153.9 155.0 Beginning Stocks, Mill. Bu. 1,967 1,304 1,624 1,790 Production, Mill. Bu. 10,531 13,038 12,101 12,090 Feed Use, Mill. Bu. 5,591 5,938 5,300 5,100 Exports, Mill. Bu. 2,125 2,436 1,750 1,650 Food, Seed, Industrial, Mill. Bu. 3,490 4,363 4,900 5,500 Fuel Ethanol, Mill. Bu. 2,119 3,026 3,600 4,200 Total Use, Mill. Bu. 11,207 12,737 11,950 12,250 Ending Stocks, Mill, Bu. 1,304 1,624 1,790 1,630 Average Farm Price, $/Bu. $3.04 $4.20 $3.45 $3.50
* September 1 Crop Year
FarmEcon LLCA source of information on global farming and food systemsThomas E. Elam, PhDPresident
FarmEcon LLCA source of information on global farming and food systemsThomas E. Elam, PhDPresident
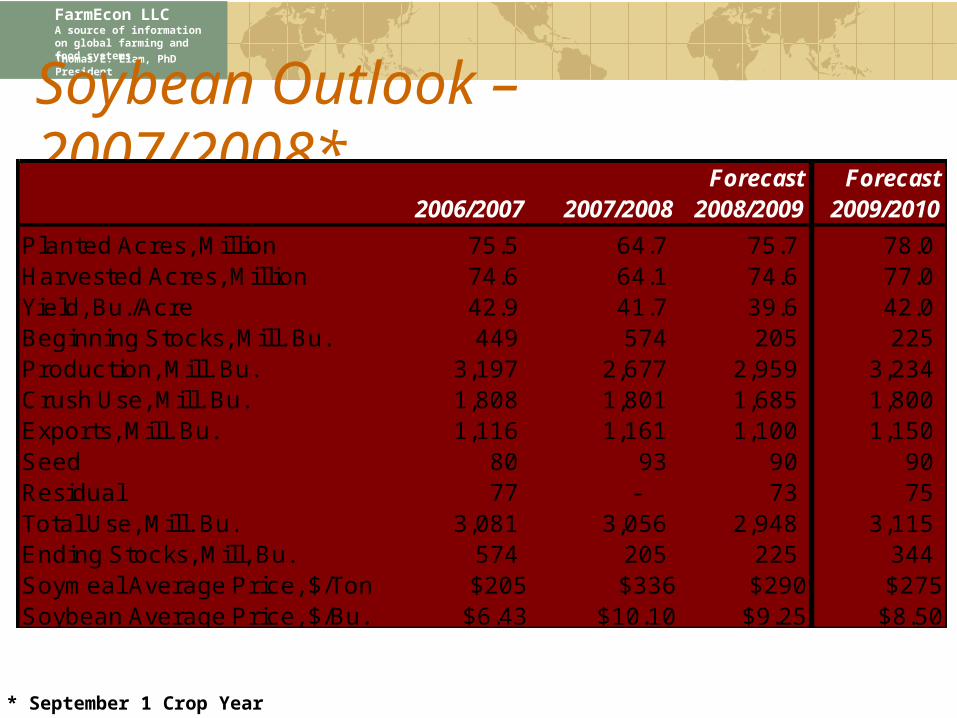
Soybean Outlook – 2007/2008*2006/2007 2007/2008
Forecast 2008/2009
Forecast 2009/2010
Planted Acres, Million 75.5 64.7 75.7 78.0 Harvested Acres, Million 74.6 64.1 74.6 77.0 Yield, Bu./Acre 42.9 41.7 39.6 42.0 Beginning Stocks, Mill. Bu. 449 574 205 225 Production, Mill. Bu. 3,197 2,677 2,959 3,234 Crush Use, Mill. Bu. 1,808 1,801 1,685 1,800 Exports, Mill. Bu. 1,116 1,161 1,100 1,150 Seed 80 93 90 90 Residual 77 - 73 75 Total Use, Mill. Bu. 3,081 3,056 2,948 3,115 Ending Stocks, Mill, Bu. 574 205 225 344 Soymeal Average Price, $/Ton $205 $336 $290 $275Soybean Average Price, $/Bu. $6.43 $10.10 $9.25 $8.50
* September 1 Crop Year

FarmEcon LLCA source of information on global farming and food systemsThomas E. Elam, PhDPresident
Questions?Comments?