Embed Size (px)
Citation preview
Business Process Variant Analysis: Survey and Classification
FARBOD TAYMOURI, The University of Melbourne, AUSTRALIAMARCELLO LA ROSA, The University of Melbourne, AUSTRALIAMARLON DUMAS, University of Tartu, ESTONIAFABRIZIO MARIA MAGGI, University of Tartu, ESTONIA
It is common for business processes to exhibit a high degree of internal heterogeneity, in the sense thatthe executions of the process differ widely from each other due to contextual factors, human factors, ordeliberate business decisions. For example, a quote-to-cash process in a multinational company is typicallyexecuted differently across different countries or even across different regions in the same country. Similarly,an insurance claims handling process might be executed differently across different claims handling centres oracross multiple teams within the same claims handling centre. A subset of executions of a business processthat can be distinguished from others based on a given predicate (e.g. the executions of a process in a givencountry) is called a process variant. Understanding differences between process variants helps analysts andmanagers to make informed decisions as to how to standardize or otherwise improve a business process, forexample by helping them find out what makes it that a given variant exhibits a higher performance thananother one. Process variant analysis is a family of techniques to analyze event logs produced during theexecution of a process, in order to identify and explain the differences between two or more process variants. Awide range of methods for process variant analysis have been proposed in the past decade. However, due to theinterdisciplinary nature of this field, the proposed methods and the types of differences they can identify varywidely, and there is a lack of a unifying view of the field. To close this gap, this article presents a systematicliterature review of methods for process variant analysis. The identified studies are classified according to theirinputs, outputs, analysis purpose, underpinning algorithms, and extra-functional characteristics. The papercloses with a broad classification of approaches into three categories based on the paradigm they employ tocompare multiple process variants.
CCS Concepts: • Applied computing→ Process mining.
Additional Key Words and Phrases: business process management, process mining, machine learning
ACM Reference Format:FARBOD TAYMOURI, MARCELLO LA ROSA, MARLON DUMAS, and FABRIZIO MARIA MAGGI. 2019.Business Process Variant Analysis: Survey and Classification. 1, 1 (December 2019), 29 pages. https://doi.org/10.1145/1122445.1122456
1 INTRODUCTIONProcess mining [62] is a body of methods and tools to analyze business process execution logs (calledevent logs), in order to extract insights about possible performance deficiencies and improvementopportunities. In this context, an event log is a collection of traces, each one consisting of thesequence of events recorded during the execution of one process instance (herein called a case).
Authors’ addresses: FARBOD TAYMOURI, The University of Melbourne, Melbourne, AUSTRALIA; MARCELLO LA ROSA,The University of Melbourne, Melbourne, AUSTRALIA; MARLON DUMAS, University of Tartu, Tartu, ESTONIA;FABRIZIO MARIA MAGGI, University of Tartu, Tartu, ESTONIA.
Permission to make digital or hard copies of all or part of this work for personal or classroom use is granted without feeprovided that copies are not made or distributed for profit or commercial advantage and that copies bear this notice and thefull citation on the first page. Copyrights for components of this work owned by others than the author(s) must be honored.Abstracting with credit is permitted. To copy otherwise, or republish, to post on servers or to redistribute to lists, requiresprior specific permission and/or a fee. Request permissions from [email protected].© 2019 Copyright held by the owner/author(s). Publication rights licensed to ACM.XXXX-XXXX/2019/12-ART $15.00https://doi.org/10.1145/1122445.1122456
, Vol. 1, No. 1, Article . Publication date: December 2019.
arX
iv:1
911.
0758
2v2
[cs
.OH
] 2
3 D
ec 2
019
Depending on their inputs and their outputs, the following categories of process mining tech-niques can be distinguished [23]:
• Automated process discovery techniques, which allow one to discover a business processmodel from an event log.
• Conformance checking techniques, which allow one to compare a process model against anevent log in order to qualify and quantify their differences.
• Performance mining techniques, which allow one to enhance a given process model withperformance information extracted from an event log.
• Variant analysis techniques, which allow one to compare two or more event logs correspond-ing to different variants of a business process, in order to qualify their differences.
This article deals with the latter category of techniques. The goal of business process variantanalysis is to help business analysts to understand why and how multiple variants of a processdiffer. In this setting, a process variant is a subset of executions of a business process that can bedistinguished from others based on some characteristic. For example, if a process is executed inthree countries, say C1, C2 and C3, we can distinguish three variants of this process: one for eachof these countries.Given an event log of a business process, a process variant takes the form of a set of traces
(herein called a cohort) that can be separated from others based on a predicate, i.e. a function thatmaps each trace in the log to a boolean variable. The first step in process variant analysis is to splitthe event log into cohorts using a trace filtering operation. In the above scenario, the predicatethat characterizes the first variant is “country = C1". By applying a log filter that retains only thosetraces for which this predicate holds, we can extract the cohort corresponding to the first processvariant, and similarly for the other two variants.
Given that an event log has been split into multiple cohorts, relevant questions that variantanalysis seeks to answer include: why do the executions of a given cohort take longer to complete, onaverage, than those of another cohort? Or what activities are often skipped in one cohort but are neveror seldom skipped in another cohort?
As hinted by these questions, variant analysis techniques may cover different perspectives of abusiness process, including the following ones:
• Control flow: Along this perspective, the variants are compared in terms of the occurrenceof activities in the execution traces and their relative execution order.
• Performance: Along this perspective, the variants are compared in terms of performancecharacteristics or performance measures.
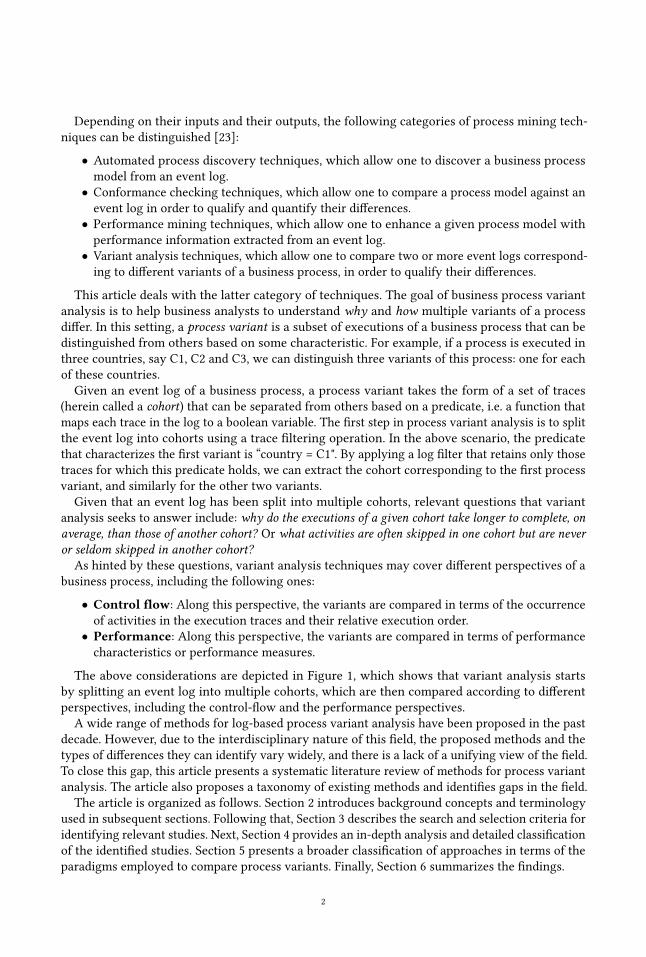
The above considerations are depicted in Figure 1, which shows that variant analysis startsby splitting an event log into multiple cohorts, which are then compared according to differentperspectives, including the control-flow and the performance perspectives.
A wide range of methods for log-based process variant analysis have been proposed in the pastdecade. However, due to the interdisciplinary nature of this field, the proposed methods and thetypes of differences they can identify vary widely, and there is a lack of a unifying view of the field.To close this gap, this article presents a systematic literature review of methods for process variantanalysis. The article also proposes a taxonomy of existing methods and identifies gaps in the field.The article is organized as follows. Section 2 introduces background concepts and terminology
used in subsequent sections. Following that, Section 3 describes the search and selection criteria foridentifying relevant studies. Next, Section 4 provides an in-depth analysis and detailed classificationof the identified studies. Section 5 presents a broader classification of approaches in terms of theparadigms employed to compare process variants. Finally, Section 6 summarizes the findings.
2
Fig. 1. A general framework for process variant analysis
2 PRELIMINARIES AND BACKGROUNDProcess variant analysis, as we will explain in the upcoming sections, has been tackled in twodifferent fields: process mining and machine learning. This section provides basic concepts thatwill help us to explain how process variant analysis has been approached in each of these the twofields.
2.1 Process miningProcess mining is a research area between Business Process Management (BPM) and data sciencethat is concerned with deriving useful insights from process execution data. Process miningtechniques can support various phases of the BPM life-cycle, such as process discovery, processanalysis and process monitoring [62]. In fact, it aims at discovering, monitoring and improving realprocesses by extracting knowledge from event logs readily available in today’s information systems[62]. The recent significant growth of event data available on the one side and the development ofmature process mining techniques on the other side are pushing companies and organizations toexploit process mining to analyze and improve their processes.The input artifacts for process mining are a process model and an event log. A process model
shows the expected behaviour of the process, and the event log shows the process executions, a.k.a.footprint or observed behavior. Process mining techniques can be classified into three types. Thefirst type, discovery, aims at discovering a process model from an event log without using anya-prior information. The second type, conformance checking, focuses on confronting an event logand a process model (discovered from an event log or manually designed). Conformance checkingis used to check if reality, as recorded in the log, conforms to the model and vice versa. Thethird type, Enhancement, intends to improve an existing process model by using the informationabout the actual process executions recorded in the event log, or the disconformities identified viaconformance checking.An event log consists of cases or traces, each capturing a particular execution of a business
process. Each case consists of a number of events and each event represents the execution of aparticular activity in the process. Each event has a range of attributes of which three are mandatory:i) the case identifier specifying which case generated this event, ii) the event class (or activityname) indicating which activity the event refers to, and iii) the timestamp indicating the completiontime of the activity. Note that, in process mining approaches, the completion time of each event
3
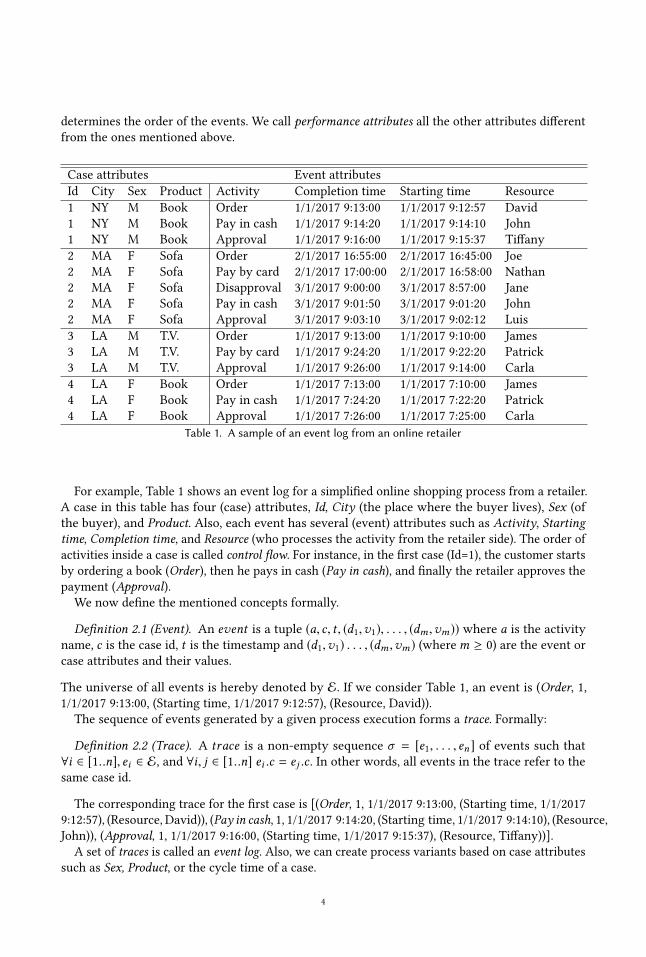
determines the order of the events. We call performance attributes all the other attributes differentfrom the ones mentioned above.
Case attributes Event attributesId City Sex Product Activity Completion time Starting time Resource1 NY M Book Order 1/1/2017 9:13:00 1/1/2017 9:12:57 David1 NY M Book Pay in cash 1/1/2017 9:14:20 1/1/2017 9:14:10 John1 NY M Book Approval 1/1/2017 9:16:00 1/1/2017 9:15:37 Tiffany2 MA F Sofa Order 2/1/2017 16:55:00 2/1/2017 16:45:00 Joe2 MA F Sofa Pay by card 2/1/2017 17:00:00 2/1/2017 16:58:00 Nathan2 MA F Sofa Disapproval 3/1/2017 9:00:00 3/1/2017 8:57:00 Jane2 MA F Sofa Pay in cash 3/1/2017 9:01:50 3/1/2017 9:01:20 John2 MA F Sofa Approval 3/1/2017 9:03:10 3/1/2017 9:02:12 Luis3 LA M T.V. Order 1/1/2017 9:13:00 1/1/2017 9:10:00 James3 LA M T.V. Pay by card 1/1/2017 9:24:20 1/1/2017 9:22:20 Patrick3 LA M T.V. Approval 1/1/2017 9:26:00 1/1/2017 9:14:00 Carla4 LA F Book Order 1/1/2017 7:13:00 1/1/2017 7:10:00 James4 LA F Book Pay in cash 1/1/2017 7:24:20 1/1/2017 7:22:20 Patrick4 LA F Book Approval 1/1/2017 7:26:00 1/1/2017 7:25:00 Carla
Table 1. A sample of an event log from an online retailer
For example, Table 1 shows an event log for a simplified online shopping process from a retailer.A case in this table has four (case) attributes, Id, City (the place where the buyer lives), Sex (ofthe buyer), and Product. Also, each event has several (event) attributes such as Activity, Startingtime, Completion time, and Resource (who processes the activity from the retailer side). The order ofactivities inside a case is called control flow. For instance, in the first case (Id=1), the customer startsby ordering a book (Order), then he pays in cash (Pay in cash), and finally the retailer approves thepayment (Approval).
We now define the mentioned concepts formally.
Definition 2.1 (Event). An event is a tuple (a, c, t , (d1,v1), . . . , (dm ,vm)) where a is the activityname, c is the case id, t is the timestamp and (d1,v1) . . . , (dm ,vm) (wherem ≥ 0) are the event orcase attributes and their values.
The universe of all events is hereby denoted by E. If we consider Table 1, an event is (Order, 1,1/1/2017 9:13:00, (Starting time, 1/1/2017 9:12:57), (Resource, David)).
The sequence of events generated by a given process execution forms a trace. Formally:
Definition 2.2 (Trace). A trace is a non-empty sequence σ = [e1, . . . , en] of events such that∀i ∈ [1..n], ei ∈ E, and ∀i, j ∈ [1..n] ei .c = ej .c . In other words, all events in the trace refer to thesame case id.
The corresponding trace for the first case is [(Order, 1, 1/1/2017 9:13:00, (Starting time, 1/1/20179:12:57), (Resource, David)), (Pay in cash, 1, 1/1/2017 9:14:20, (Starting time, 1/1/2017 9:14:10), (Resource,John)), (Approval, 1, 1/1/2017 9:16:00, (Starting time, 1/1/2017 9:15:37), (Resource, Tiffany))].
A set of traces is called an event log. Also, we can create process variants based on case attributessuch as Sex, Product, or the cycle time of a case.
4
Definition 2.3 (Process cohort (or Process variant)). An event log L can be partitioned into a finiteset of groups called process variants or process variants ς1, ς2, . . . , ςn , such that L = ς1 ∪ ς2 ∪ . . . ςn ,and ∀i, j, ςi ∩ ς j = ∅, and, ∃d such that ∀ ςk and ∀σi ,σj ∈ ςk , σi .d = σj .d .
The above definition of a process variant emphasizes that the process executions in the same groupmust share the same attribute value for a given attribute, and each process execution belongs onlyto one process variant.A process model is a graphical entity used to represent how a process is executed in an orga-
nization. In the business domain, a business process model is a collection of inter-related events,activities, and decision points that involve a number of actors and objects, which collectivelylead to an outcome that is of value for a customer [23]. Companies and organizations usuallyuse different notations to represent their business process models and each of them has differentcharacteristics. Thus, selecting an appropriate process modeling language is essential. However, itis worth mentioning that often one formalism can easily be translated to other notations [63]. Inthe following, we present a short introduction to Petri nets [43] and transition systems [62], themost used notations to formally represent business process models.A Petri net N = (P ,T , F ) is a directed graph with a set P of nodes called places and a set T of
transitions. Places are represented by circles and transitions by squares. The nodes are connectedvia directed arcs F ⊆ (P ×T ) ∪ (T × P). Connections between two nodes of the same type are notallowed. Given a transition t ∈ T , •t is used to indicate the set of input places of t , which are theplaces p with a directed arc from p to t (i.e., such that (p, t) ∈ F ). Similarly, t• indicates the set ofoutput places, namely the places p with a direct arc from t to p. At any time, a place can containzero or more tokens, drawn as black dots. The state of a Petri net, a.k.a. markingm, is determinedby the number of tokens in places, i.e.,m : P → N.In any run of a Petri net, the number of tokens in places (i.e., the marking) may change. A
transition t is enabled at a markingm iff each input place contains at least one token, i.e., ∀ p ∈ •t ,M(p) > 0. A transition t can fire at a markingm iff it is enabled. As result of firing a transition t ,one token is “consumed” from each input place and one is “produced” in each output place. This isdenoted asm
t−→m′.
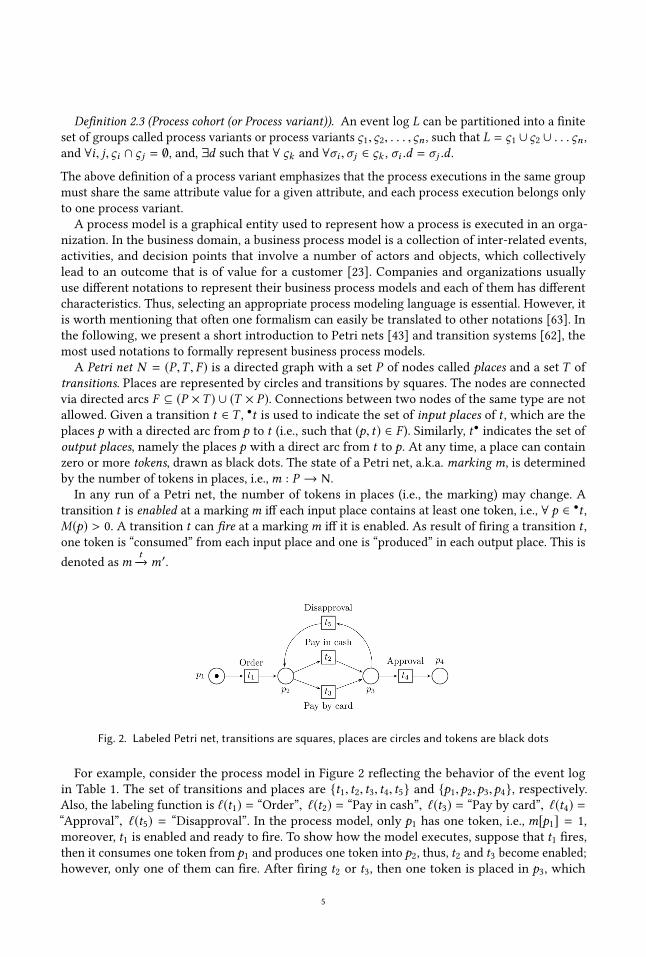
Fig. 2. Labeled Petri net, transitions are squares, places are circles and tokens are black dots
For example, consider the process model in Figure 2 reflecting the behavior of the event login Table 1. The set of transitions and places are {t1, t2, t3, t4, t5} and {p1,p2,p3,p4}, respectively.Also, the labeling function is ℓ(t1) = “Order”, ℓ(t2) = “Pay in cash”, ℓ(t3) = “Pay by card”, ℓ(t4) =“Approval”, ℓ(t5) = “Disapproval”. In the process model, only p1 has one token, i.e., m[p1] = 1,moreover, t1 is enabled and ready to fire. To show how the model executes, suppose that t1 fires,then it consumes one token from p1 and produces one token into p2, thus, t2 and t3 become enabled;however, only one of them can fire. After firing t2 or t3, then one token is placed in p3, which
5
enables t4 and t5. Finally, one of t5 or t4 is fired, where the former marks p2 and the executioncontinues, whereas the latter marks p4 and the execution terminates.
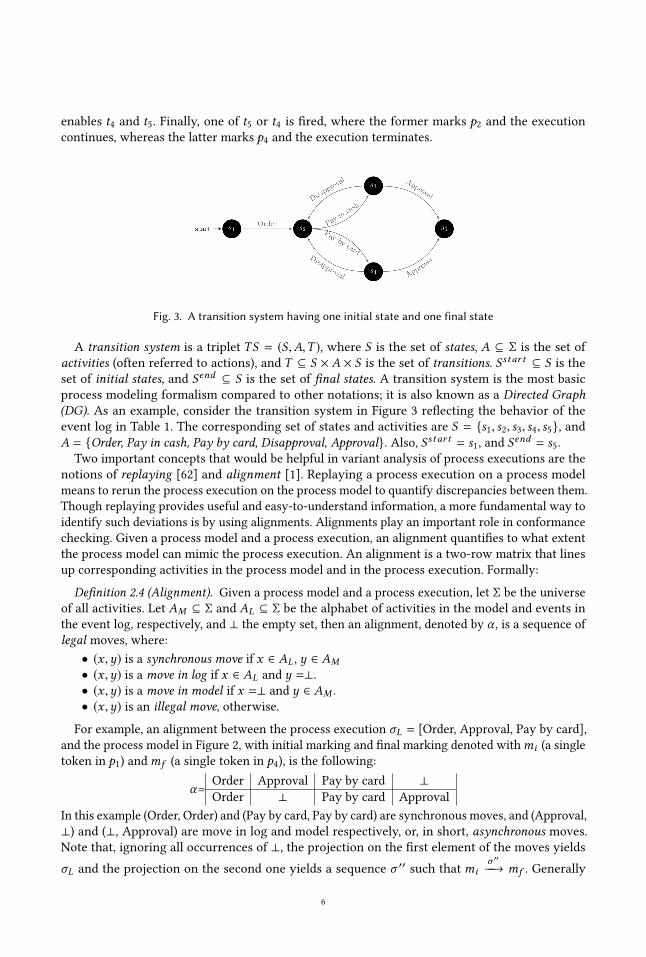
Fig. 3. A transition system having one initial state and one final state
A transition system is a triplet TS = (S,A,T ), where S is the set of states, A ⊆ Σ is the set ofactivities (often referred to actions), and T ⊆ S × A × S is the set of transitions. Sstar t ⊆ S is theset of initial states, and Send ⊆ S is the set of final states. A transition system is the most basicprocess modeling formalism compared to other notations; it is also known as a Directed Graph(DG). As an example, consider the transition system in Figure 3 reflecting the behavior of theevent log in Table 1. The corresponding set of states and activities are S = {s1, s2, s3, s4, s5}, andA = {Order, Pay in cash, Pay by card, Disapproval, Approval}. Also, Sstar t = s1, and Send = s5.
Two important concepts that would be helpful in variant analysis of process executions are thenotions of replaying [62] and alignment [1]. Replaying a process execution on a process modelmeans to rerun the process execution on the process model to quantify discrepancies between them.Though replaying provides useful and easy-to-understand information, a more fundamental way toidentify such deviations is by using alignments. Alignments play an important role in conformancechecking. Given a process model and a process execution, an alignment quantifies to what extentthe process model can mimic the process execution. An alignment is a two-row matrix that linesup corresponding activities in the process model and in the process execution. Formally:
Definition 2.4 (Alignment). Given a process model and a process execution, let Σ be the universeof all activities. Let AM ⊆ Σ and AL ⊆ Σ be the alphabet of activities in the model and events inthe event log, respectively, and ⊥ the empty set, then an alignment, denoted by α , is a sequence oflegal moves, where:
• (x ,y) is a synchronous move if x ∈ AL , y ∈ AM• (x ,y) is a move in log if x ∈ AL and y =⊥.• (x ,y) is a move in model if x =⊥ and y ∈ AM .• (x ,y) is an illegal move, otherwise.
For example, an alignment between the process execution σL = [Order, Approval, Pay by card],and the process model in Figure 2, with initial marking and final marking denoted withmi (a singletoken in p1) andmf (a single token in p4), is the following:
α= Order Approval Pay by card ⊥Order ⊥ Pay by card Approval
In this example (Order, Order) and (Pay by card, Pay by card) are synchronous moves, and (Approval,⊥) and (⊥, Approval) are move in log and model respectively, or, in short, asynchronous moves.Note that, ignoring all occurrences of ⊥, the projection on the first element of the moves yieldsσL and the projection on the second one yields a sequence σ ′′ such thatmi
σ ′′−−→ mf . Generally
6
speaking, a move in log for a transition t indicates that t occurred when not allowed; a move inmodel for a transition t indicates that t did not occur, when, conversely, expected. An alignmentusually is quantified with a fitness value, which, in the simplest case, is the number of synchronousmoves divided by the total number of moves. For the mentioned example, the fitness is 2
4 .
2.2 Machine learningMachine learning is the systematic design, analysis and study of algorithms and systems that learnfrom past experiences. Machine learning is inherently a multidisciplinary field. It draws on resultsfrom artificial intelligence, probability and statistics, computational complexity theory, control theory,information theory, philosophy, psychology, neurobiology, and other fields [42].Given a problem at hand, the first step in learning from data is to have related observations.
The raw observations comprise multidimensional data, event log data, graph data, and other typesof data. Moreover, for every type of data, several sophisticated machine learning algorithmshave been proposed by researchers. However, because of historical and technical reasons, mostof the developed algorithms use multidimensional data or encode other types of data into amultidimensional representation. In an n-dimensional representation, every entity is shown as avector of length n, and each dimension is called a feature or attribute. Thus, a group of observationsD can be shown as a multiset of vectors as follows:
D = {xi}m1 or {x1, x1, . . . , xm}, where ∀i ∈ [1..m], xi = (xi,1,xi,2, . . . ,xi,n) (1)
In the above representation, xi is a vector with n features xi,1,xi,2, . . . ,xi,n . A feature can be acomplex structured object, such as an image, a sentence, a time series, a molecular shape, a graph,a sequence prefix [44].
Broadly speaking, a machine learning task can be of two types:• In descriptive or unsupervised learning approaches, given a set of observations D, the objectiveis to find interesting patterns in the data. A canonical example of unsupervised learning isthe problem of clustering data observations into groups.
• In supervised learning or predictive approaches, each vector xi has an associate label yi , whichis called response variable. Response variables can be of different nature, but the most methodsassumes that it is categorical or real-valued. The set of labeled vectors, i.e., D = {(xi,yi )}m1 iscalled the training set, and the main objective of supervised learning algorithms is to estimatea mapping function from x to y, i.e., y = f (x). The estimated function or the trained modelis called a classification model for categorical response variables, and a regression model forreal-valued response variables.
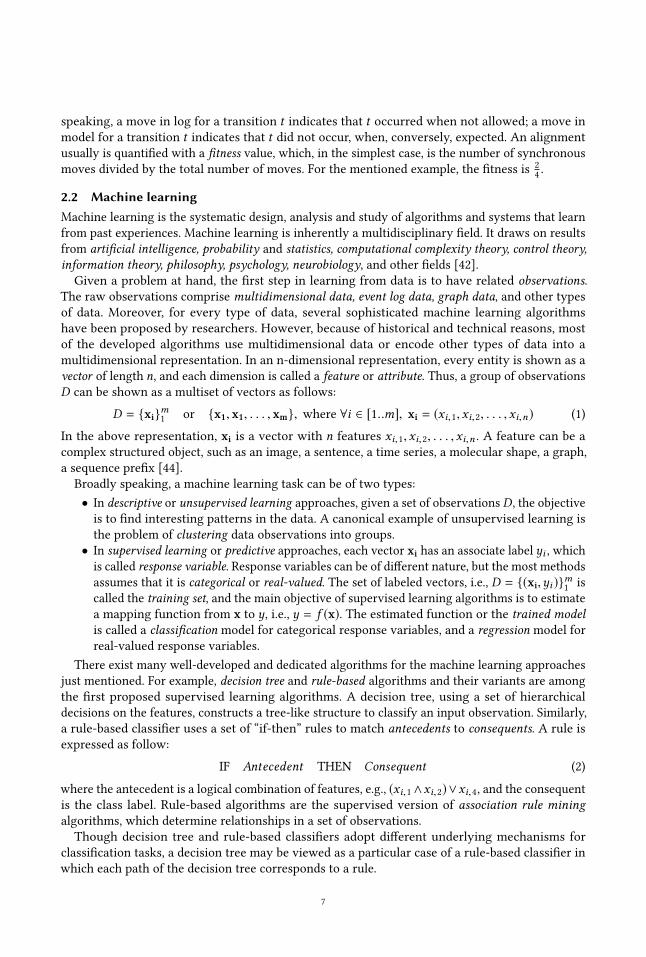
There exist many well-developed and dedicated algorithms for the machine learning approachesjust mentioned. For example, decision tree and rule-based algorithms and their variants are amongthe first proposed supervised learning algorithms. A decision tree, using a set of hierarchicaldecisions on the features, constructs a tree-like structure to classify an input observation. Similarly,a rule-based classifier uses a set of “if-then” rules to match antecedents to consequents. A rule isexpressed as follow:
IF Antecedent THEN Consequent (2)
where the antecedent is a logical combination of features, e.g., (xi,1∧xi,2)∨xi,4, and the consequentis the class label. Rule-based algorithms are the supervised version of association rule miningalgorithms, which determine relationships in a set of observations.Though decision tree and rule-based classifiers adopt different underlying mechanisms for
classification tasks, a decision tree may be viewed as a particular case of a rule-based classifier inwhich each path of the decision tree corresponds to a rule.
7
From the probabilistic perspective, despite the variety of proposed supervised and unsupervisedlearning algorithms, either try to approximate probability values. In particular, supervised learningalgorithms strive to approximate p(yi |xi), i.e., the probability of a class label given an input vector,whereas an unsupervised algorithm can be viewed as a density estimation, i.e., p(xi) [44]. Thedifferences among machine learning algorithms are in the way they compute these probabilities.The performance of a machine learning algorithm can be evaluated in different ways. For
unsupervised learning algorithms, the validation is often difficult since the problem is definedin a descriptive way. However, some validation criteria can be defined to evaluate the objectivefunction upon which observations are clustered together. In contrast, the predictive ability of asupervised learning algorithm can be evaluated using the input labels. For example, accuracy andArea Under Curve (AUC) can be used to evaluate a classification model. The former shows the ratioof the number of correct predictions to the total number of predictions, and the latter, for a binaryclassification model, provides the probability that a model ranks a random positive example morehighly than a random negative example.
A learning paradigm that has received much attention over the past few years is the learning bycommittee or ensemble learning [22]. Ensemble learning ismotivated by the fact that, given a problem,different learning algorithms might provide different results due to the specific characteristicsof the underlying learning algorithms, or their sensitivity to the random artifacts in the input.Therefore, the goal of ensemble learning is to combine the results from multiple learners to improvethe quality of the results. In unsupervised learning approaches, it is evident that there are manyalternative solutions, i.e., clustering models, alongside a large number of validation criteria, andno single model or validation criterion provides the optimal clustering. Thus, ensemble clustering,proposed by [55], combines many clustering models to create a more robust clustering approach.By the same token, in supervised learning, a set of base learners is created and trained in differentways, and then the results of base learners are combined to create the final prediction. A verysimple way to combine outputs of base learners, for real-valued outputs, is to average them:
f (x) = 1p
p∑j=1
fj (x) (3)
In the above expression, there are p base learners, and fj (x) is the output of the j-th base learner.
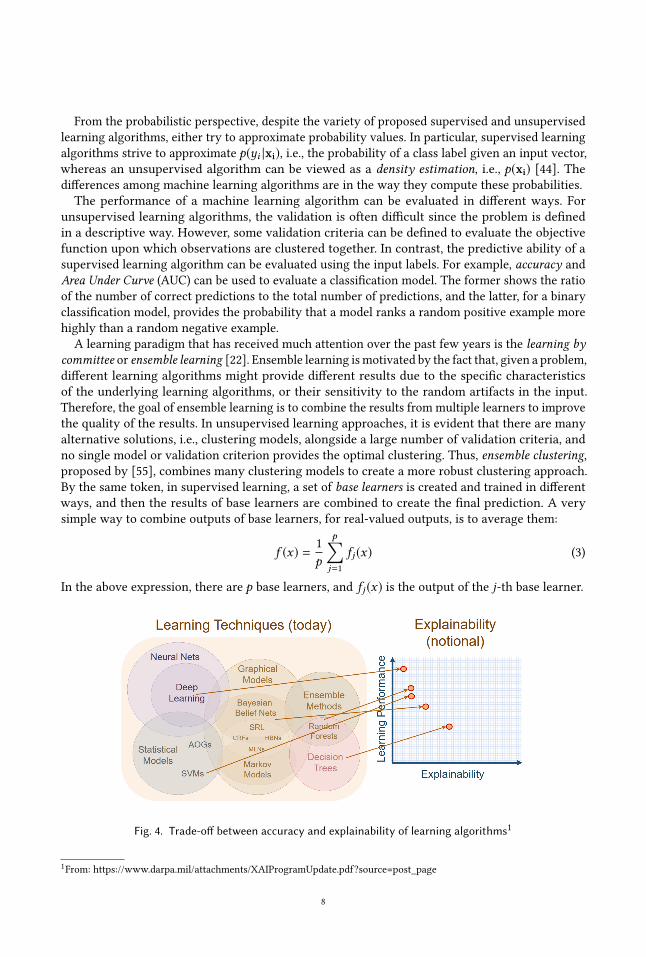
Fig. 4. Trade-off between accuracy and explainability of learning algorithms1
1From: https://www.darpa.mil/attachments/XAIProgramUpdate.pdf?source=post_page
8
Notwithstanding the importance of the accuracy of a machine learning algorithm, an algorithmcan also be evaluated from other perspectives. For example, in several situations, it is necessary tohave an explainable machine learning model. Explainability is defined as the science of compre-hending what a model did, or might have done [29]. More simply, explainability is the extent towhich the internal mechanics of a machine learning system can be explained in human terms. Theconcept of explainability can be applied to all supervised and unsupervised learning approaches. Forexample, decision tree and rule-based classifiers are highly explainable, i.e., the internal structureof a decision tree and a set of rules can be easily explained in human terms; on the other hand,the internal structure of ensemble models is very difficult to grasp in human terms. Althoughboth accuracy and explainability are two important aspects of a machine learning algorithm, theyinterfere with each other. Indeed, the internal structure of a sophisticated machine learning algo-rithm that comes up with very high accuracy is hardly explainable in human terms and it acts as ablack-box. In this sense, according to the no free lunch theorem, there is no universal best model[67]. Figure 4 presents the trade-off between accuracy and explainability aspects for well-knownmachine learning algorithms.
3 SEARCH METHODOLOGYWe conducted a Systematic Literature Review (SLR) of process variant analysis methods, by followingthe SLR guidelines in [36]. In line with these guidelines, we started by posing a research question toclarify the goals of the search. From the research question, a search string was derived for retrievingrelated documents from academic digital libraries. The following subsections detail the SLR stepsfollowed in this paper.
3.1 ResearchQuestionThe main aim of this paper is to review proposed methods for process variant analysis. Processvariant analysis is a rather broad topic. Therefore, to confine our search space, we defined thefollowing research question (RQ): Given a set of event logs of two or more variants of process, how toidentify and explain the differences among these variants?
3.2 Study Retrieval and SelectionTo retrieve relevant papers based on RQ, the following keywords were considered:
• “event log” - a relevant study must consider event logs as inputs;• “process variant analysis” - a relevant study should concern the analysis of the executions ofa process;
• “process variants comparison” - a relevant study should concern the comparison of sets ofprocess executions;
Though the aforementioned terms are the most related keywords, we realized that some worksrelated to process variant analysis use the term “deviance mining” to indicate this type of analysis;therefore, we included additional terms, namely, “process deviance mining” and “process deviancecomparison”, to cover such works.
Using these keywords we derived a search string that was submitted to Google Scholar. GoogleScholar is the world’s largest academic search engine, which encompasses other academic databaseslike ACM Digital Library and IEEE Xplore [32]. The retrieved documents are those that have atleast one of the above terms in their title, keywords or the main body of the paper.
The search resulted in 88 unique articles published between January 2000 and April 2019. Figure5 shows the number of publications per year according to the proposed search query. One can see
9
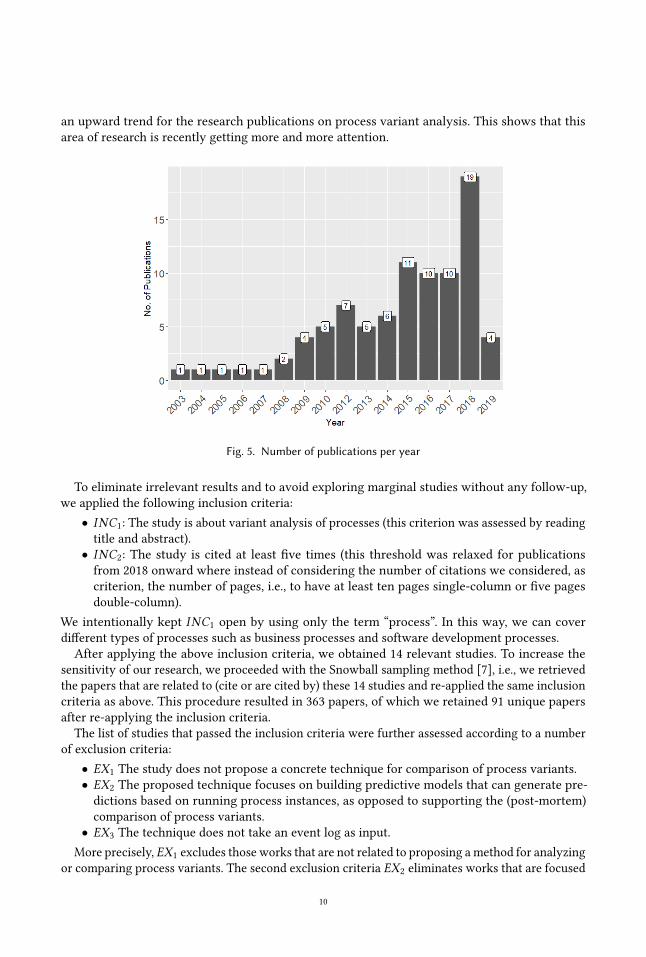
an upward trend for the research publications on process variant analysis. This shows that thisarea of research is recently getting more and more attention.
Fig. 5. Number of publications per year
To eliminate irrelevant results and to avoid exploring marginal studies without any follow-up,we applied the following inclusion criteria:
• INC1: The study is about variant analysis of processes (this criterion was assessed by readingtitle and abstract).
• INC2: The study is cited at least five times (this threshold was relaxed for publicationsfrom 2018 onward where instead of considering the number of citations we considered, ascriterion, the number of pages, i.e., to have at least ten pages single-column or five pagesdouble-column).
We intentionally kept INC1 open by using only the term “process”. In this way, we can coverdifferent types of processes such as business processes and software development processes.After applying the above inclusion criteria, we obtained 14 relevant studies. To increase the
sensitivity of our research, we proceeded with the Snowball sampling method [7], i.e., we retrievedthe papers that are related to (cite or are cited by) these 14 studies and re-applied the same inclusioncriteria as above. This procedure resulted in 363 papers, of which we retained 91 unique papersafter re-applying the inclusion criteria.
The list of studies that passed the inclusion criteria were further assessed according to a numberof exclusion criteria:
• EX1 The study does not propose a concrete technique for comparison of process variants.• EX2 The proposed technique focuses on building predictive models that can generate pre-dictions based on running process instances, as opposed to supporting the (post-mortem)comparison of process variants.
• EX3 The technique does not take an event log as input.More precisely, EX1 excludes those works that are not related to proposing amethod for analyzing
or comparing process variants. The second exclusion criteria EX2 eliminates works that are focused
10
on predictive process monitoring techniques. The main focus of these latter studies is on predictingfuture states of ongoing cases, rather than comparing characteristics of sets of completed cases. Inaddition, predictive monitoring techniques have been studied extensively in previous surveys [21,45, 60, 64]. The last exclusion criteria EX3 leaves out those studies that do not use event logs asinput. These might be studies that compare process models represented using different formalism.Though these approaches might be inspiring for process variant analysis, the scope of this paper islimited to review the current existing techniques that leverage process executions. The applicationof the exclusion criteria resulted in 29 relevant studies out of 91 works selected in the previousstep.2
4 ANALYSIS AND CLASSIFICATION OF METHODSResearch question RQ can be answered by categorizing the selected works using different dimen-sions specifying the typology of the existing methods and their characteristics. In particular, eachstudy can be decomposed into the following dimensions:
• Input data• Outcome• Process perspective (control flow, resources, data)• Family of algorithms (the main algorithm used in the study)• Evaluation data (real-life or artificial logs) and application domain (e.g., insurance, banking,healthcare)
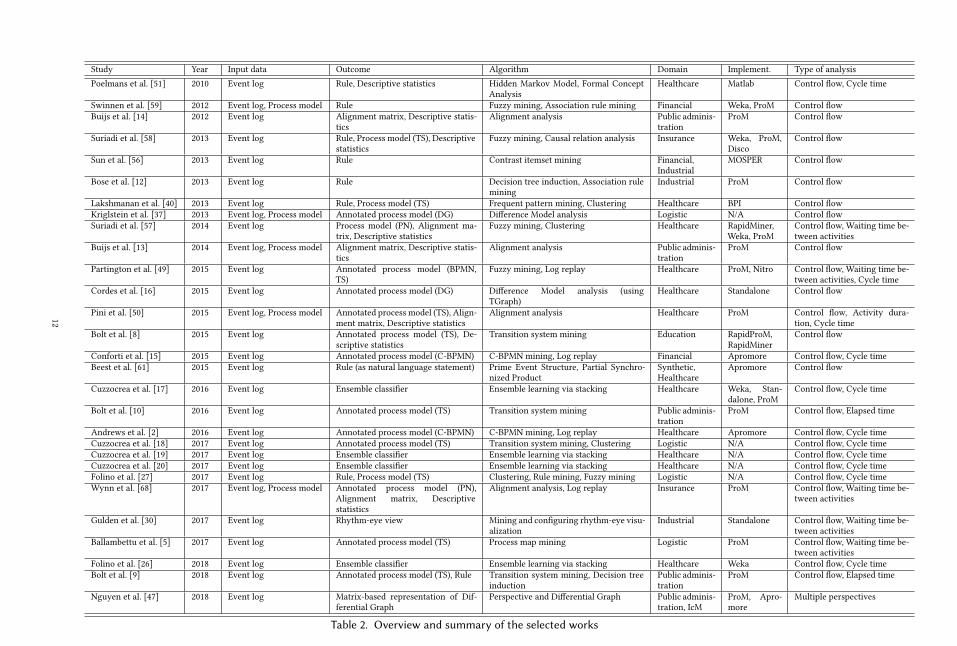
• Implementation (standalone or plug-in, and tool accessibility)Table 2 provides an overview of the identified studies according to the mentioned dimensions. In
the following, we provide an overview of each study and, then, more details about the classificationfor each dimension.
4.1 OverviewAccording to our results, the work in [51] is the first work that considers process variant analysisat the process execution level. A process execution, in this work, contains treatment activities thata hospital applies to breast cancer patients. This work aims at gaining a deeper understanding ofan existing breast cancer care process to discover process inefficiencies, exceptions and variations,and to find their root causes. To this end, Hidden Markov Models are used for process discoveryand Formal Concept Analysis [28] is employed to analyze clusters of patients identified in thediscovered processes.Similarly to this work, a series of interactive tools for extracting and visualizing clinical care
pathways is presented in [40]. The work considers a process execution as a sequence of clinicalactivities that patients receive in their care journeys. The main objective of the paper is to examinethe impact and correlation of clinical activities on the clinical care pathway of a patient for specificdiseases. Different techniques like frequent pattern mining and trace clustering are applied toaccomplish this goal. In this study, a tool for visualizing the results of the analysis is also presented.The tool discovers dependency graph models using the Heuristic Miner [66], and then the impactfulpatterns obtained from frequent pattern mining are superimposed to them to highlight differencesamong different variants.
2All the retrieved papers can be found at https://figshare.com/articles/Selected_articles/9999887
11
Study Year Input data Outcome Algorithm Domain Implement. Type of analysisPoelmans et al. [51] 2010 Event log Rule, Descriptive statistics Hidden Markov Model, Formal Concept
AnalysisHealthcare Matlab Control flow, Cycle time
Swinnen et al. [59] 2012 Event log, Process model Rule Fuzzy mining, Association rule mining Financial Weka, ProM Control flowBuijs et al. [14] 2012 Event log Alignment matrix, Descriptive statis-
ticsAlignment analysis Public adminis-
trationProM Control flow
Suriadi et al. [58] 2013 Event log Rule, Process model (TS), Descriptivestatistics
Fuzzy mining, Causal relation analysis Insurance Weka, ProM,Disco
Control flow
Sun et al. [56] 2013 Event log Rule Contrast itemset mining Financial,Industrial
MOSPER Control flow
Bose et al. [12] 2013 Event log Rule Decision tree induction, Association rulemining
Industrial ProM Control flow
Lakshmanan et al. [40] 2013 Event log Rule, Process model (TS) Frequent pattern mining, Clustering Healthcare BPI Control flowKriglstein et al. [37] 2013 Event log, Process model Annotated process model (DG) Difference Model analysis Logistic N/A Control flowSuriadi et al. [57] 2014 Event log Process model (PN), Alignment ma-
trix, Descriptive statisticsFuzzy mining, Clustering Healthcare RapidMiner,
Weka, ProMControl flow, Waiting time be-tween activities
Buijs et al. [13] 2014 Event log, Process model Alignment matrix, Descriptive statis-tics
Alignment analysis Public adminis-tration
ProM Control flow
Partington et al. [49] 2015 Event log Annotated process model (BPMN,TS)
Fuzzy mining, Log replay Healthcare ProM, Nitro Control flow, Waiting time be-tween activities, Cycle time
Cordes et al. [16] 2015 Event log Annotated process model (DG) Difference Model analysis (usingTGraph)
Healthcare Standalone Control flow
Pini et al. [50] 2015 Event log, Process model Annotated process model (TS), Align-ment matrix, Descriptive statistics
Alignment analysis Healthcare ProM Control flow, Activity dura-tion, Cycle time
Bolt et al. [8] 2015 Event log Annotated process model (TS), De-scriptive statistics
Transition system mining Education RapidProM,RapidMiner
Control flow
Conforti et al. [15] 2015 Event log Annotated process model (C-BPMN) C-BPMN mining, Log replay Financial Apromore Control flow, Cycle timeBeest et al. [61] 2015 Event log Rule (as natural language statement) Prime Event Structure, Partial Synchro-
nized ProductSynthetic,Healthcare
Apromore Control flow
Cuzzocrea et al. [17] 2016 Event log Ensemble classifier Ensemble learning via stacking Healthcare Weka, Stan-dalone, ProM
Control flow, Cycle time
Bolt et al. [10] 2016 Event log Annotated process model (TS) Transition system mining Public adminis-tration
ProM Control flow, Elapsed time
Andrews et al. [2] 2016 Event log Annotated process model (C-BPMN) C-BPMN mining, Log replay Healthcare Apromore Control flow, Cycle timeCuzzocrea et al. [18] 2017 Event log Annotated process model (TS) Transition system mining, Clustering Logistic N/A Control flow, Cycle timeCuzzocrea et al. [19] 2017 Event log Ensemble classifier Ensemble learning via stacking Healthcare N/A Control flow, Cycle timeCuzzocrea et al. [20] 2017 Event log Ensemble classifier Ensemble learning via stacking Healthcare N/A Control flow, Cycle timeFolino et al. [27] 2017 Event log Rule, Process model (TS) Clustering, Rule mining, Fuzzy mining Logistic N/A Control flow, Cycle timeWynn et al. [68] 2017 Event log, Process model Annotated process model (PN),
Alignment matrix, Descriptivestatistics
Alignment analysis, Log replay Insurance ProM Control flow, Waiting time be-tween activities
Gulden et al. [30] 2017 Event log Rhythm-eye view Mining and configuring rhythm-eye visu-alization
Industrial Standalone Control flow, Waiting time be-tween activities
Ballambettu et al. [5] 2017 Event log Annotated process model (TS) Process map mining Logistic ProM Control flow, Waiting time be-tween activities
Folino et al. [26] 2018 Event log Ensemble classifier Ensemble learning via stacking Healthcare Weka Control flow, Cycle timeBolt et al. [9] 2018 Event log Annotated process model (TS), Rule Transition system mining, Decision tree
inductionPublic adminis-tration
ProM Control flow, Elapsed time
Nguyen et al. [47] 2018 Event log Matrix-based representation of Dif-ferential Graph
Perspective and Differential Graph Public adminis-tration, IcM
ProM, Apro-more
Multiple perspectives
Table 2. Overview and summary of the selected works
12
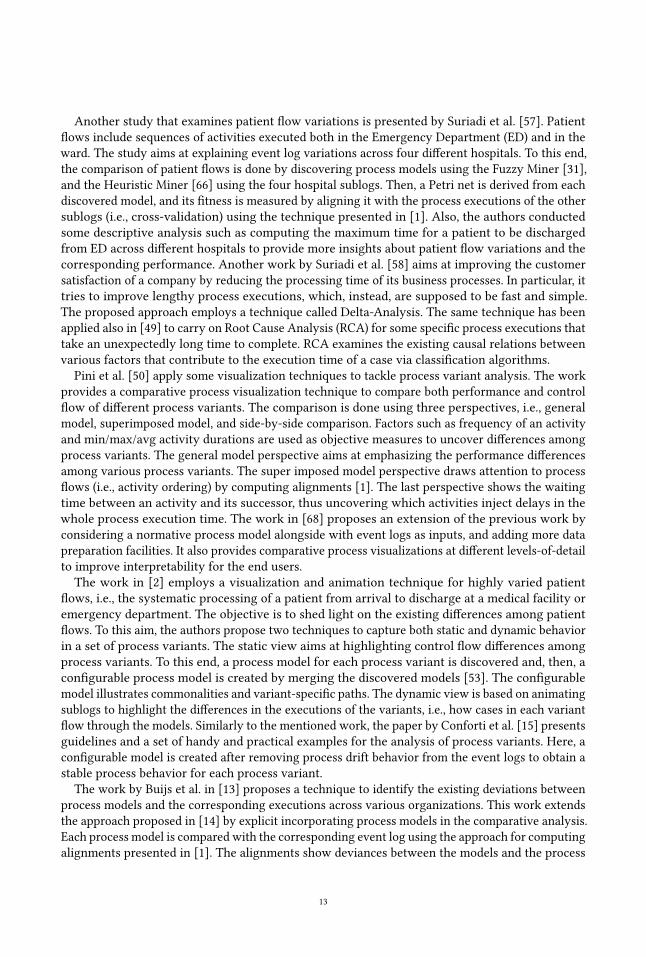
Another study that examines patient flow variations is presented by Suriadi et al. [57]. Patientflows include sequences of activities executed both in the Emergency Department (ED) and in theward. The study aims at explaining event log variations across four different hospitals. To this end,the comparison of patient flows is done by discovering process models using the Fuzzy Miner [31],and the Heuristic Miner [66] using the four hospital sublogs. Then, a Petri net is derived from eachdiscovered model, and its fitness is measured by aligning it with the process executions of the othersublogs (i.e., cross-validation) using the technique presented in [1]. Also, the authors conductedsome descriptive analysis such as computing the maximum time for a patient to be dischargedfrom ED across different hospitals to provide more insights about patient flow variations and thecorresponding performance. Another work by Suriadi et al. [58] aims at improving the customersatisfaction of a company by reducing the processing time of its business processes. In particular, ittries to improve lengthy process executions, which, instead, are supposed to be fast and simple.The proposed approach employs a technique called Delta-Analysis. The same technique has beenapplied also in [49] to carry on Root Cause Analysis (RCA) for some specific process executions thattake an unexpectedly long time to complete. RCA examines the existing causal relations betweenvarious factors that contribute to the execution time of a case via classification algorithms.
Pini et al. [50] apply some visualization techniques to tackle process variant analysis. The workprovides a comparative process visualization technique to compare both performance and controlflow of different process variants. The comparison is done using three perspectives, i.e., generalmodel, superimposed model, and side-by-side comparison. Factors such as frequency of an activityand min/max/avg activity durations are used as objective measures to uncover differences amongprocess variants. The general model perspective aims at emphasizing the performance differencesamong various process variants. The super imposed model perspective draws attention to processflows (i.e., activity ordering) by computing alignments [1]. The last perspective shows the waitingtime between an activity and its successor, thus uncovering which activities inject delays in thewhole process execution time. The work in [68] proposes an extension of the previous work byconsidering a normative process model alongside with event logs as inputs, and adding more datapreparation facilities. It also provides comparative process visualizations at different levels-of-detailto improve interpretability for the end users.The work in [2] employs a visualization and animation technique for highly varied patient
flows, i.e., the systematic processing of a patient from arrival to discharge at a medical facility oremergency department. The objective is to shed light on the existing differences among patientflows. To this aim, the authors propose two techniques to capture both static and dynamic behaviorin a set of process variants. The static view aims at highlighting control flow differences amongprocess variants. To this end, a process model for each process variant is discovered and, then, aconfigurable process model is created by merging the discovered models [53]. The configurablemodel illustrates commonalities and variant-specific paths. The dynamic view is based on animatingsublogs to highlight the differences in the executions of the variants, i.e., how cases in each variantflow through the models. Similarly to the mentioned work, the paper by Conforti et al. [15] presentsguidelines and a set of handy and practical examples for the analysis of process variants. Here, aconfigurable model is created after removing process drift behavior from the event logs to obtain astable process behavior for each process variant.
The work by Buijs et al. in [13] proposes a technique to identify the existing deviations betweenprocess models and the corresponding executions across various organizations. This work extendsthe approach proposed in [14] by explicit incorporating process models in the comparative analysis.Each process model is compared with the corresponding event log using the approach for computingalignments presented in [1]. The alignments show deviances between the models and the process
13
executions. In addition, cross-organizational process variants are compared using an alignment-matrix where columns and rows are process models and process variants, respectively. The matrixcontains the fitness values computed by aligning each process variant against the process models.The work by van Beest et al. [61] shows the behavioral distance between two sets of process
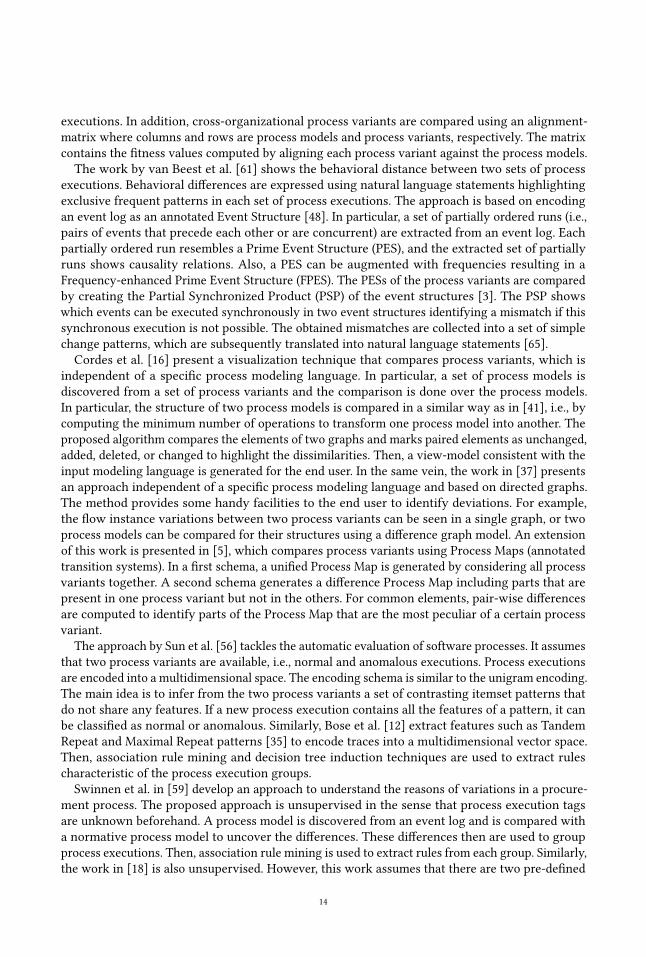
executions. Behavioral differences are expressed using natural language statements highlightingexclusive frequent patterns in each set of process executions. The approach is based on encodingan event log as an annotated Event Structure [48]. In particular, a set of partially ordered runs (i.e.,pairs of events that precede each other or are concurrent) are extracted from an event log. Eachpartially ordered run resembles a Prime Event Structure (PES), and the extracted set of partiallyruns shows causality relations. Also, a PES can be augmented with frequencies resulting in aFrequency-enhanced Prime Event Structure (FPES). The PESs of the process variants are comparedby creating the Partial Synchronized Product (PSP) of the event structures [3]. The PSP showswhich events can be executed synchronously in two event structures identifying a mismatch if thissynchronous execution is not possible. The obtained mismatches are collected into a set of simplechange patterns, which are subsequently translated into natural language statements [65].Cordes et al. [16] present a visualization technique that compares process variants, which is
independent of a specific process modeling language. In particular, a set of process models isdiscovered from a set of process variants and the comparison is done over the process models.In particular, the structure of two process models is compared in a similar way as in [41], i.e., bycomputing the minimum number of operations to transform one process model into another. Theproposed algorithm compares the elements of two graphs and marks paired elements as unchanged,added, deleted, or changed to highlight the dissimilarities. Then, a view-model consistent with theinput modeling language is generated for the end user. In the same vein, the work in [37] presentsan approach independent of a specific process modeling language and based on directed graphs.The method provides some handy facilities to the end user to identify deviations. For example,the flow instance variations between two process variants can be seen in a single graph, or twoprocess models can be compared for their structures using a difference graph model. An extensionof this work is presented in [5], which compares process variants using Process Maps (annotatedtransition systems). In a first schema, a unified Process Map is generated by considering all processvariants together. A second schema generates a difference Process Map including parts that arepresent in one process variant but not in the others. For common elements, pair-wise differencesare computed to identify parts of the Process Map that are the most peculiar of a certain processvariant.
The approach by Sun et al. [56] tackles the automatic evaluation of software processes. It assumesthat two process variants are available, i.e., normal and anomalous executions. Process executionsare encoded into a multidimensional space. The encoding schema is similar to the unigram encoding.The main idea is to infer from the two process variants a set of contrasting itemset patterns thatdo not share any features. If a new process execution contains all the features of a pattern, it canbe classified as normal or anomalous. Similarly, Bose et al. [12] extract features such as TandemRepeat and Maximal Repeat patterns [35] to encode traces into a multidimensional vector space.Then, association rule mining and decision tree induction techniques are used to extract rulescharacteristic of the process execution groups.
Swinnen et al. in [59] develop an approach to understand the reasons of variations in a procure-ment process. The proposed approach is unsupervised in the sense that process execution tagsare unknown beforehand. A process model is discovered from an event log and is compared witha normative process model to uncover the differences. These differences then are used to groupprocess executions. Then, association rule mining is used to extract rules from each group. Similarly,the work in [18] is also unsupervised. However, this work assumes that there are two pre-defined
14
process variants available. A model from the whole event log is discovered and is annotated withperformance metrics for each process variant. Folino et al. [27] extended this work by identifying aset of rules to explain the differences between the two clusters of process executions.
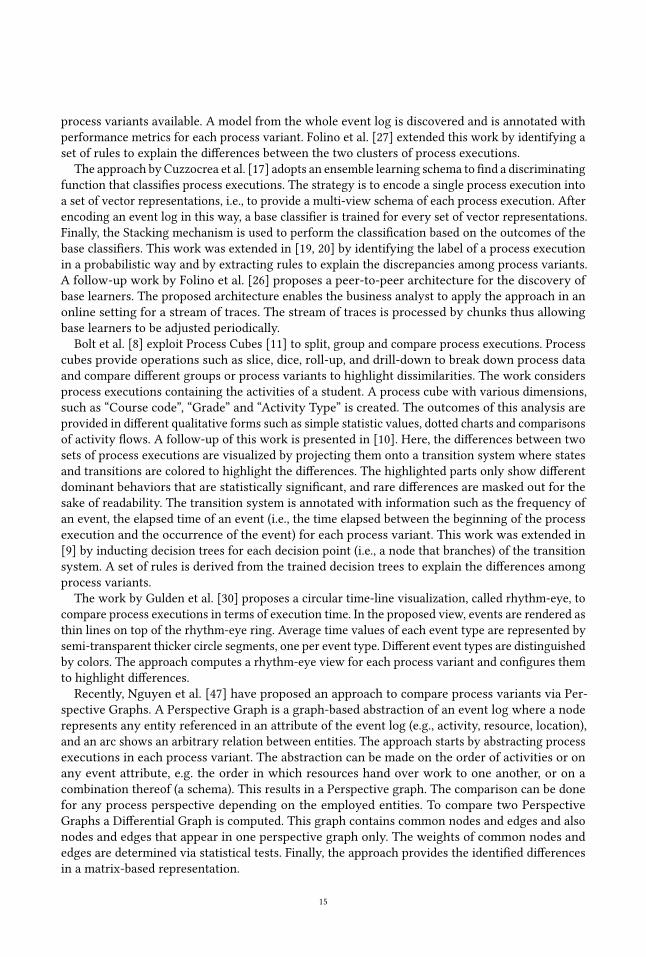
The approach by Cuzzocrea et al. [17] adopts an ensemble learning schema to find a discriminatingfunction that classifies process executions. The strategy is to encode a single process execution intoa set of vector representations, i.e., to provide a multi-view schema of each process execution. Afterencoding an event log in this way, a base classifier is trained for every set of vector representations.Finally, the Stacking mechanism is used to perform the classification based on the outcomes of thebase classifiers. This work was extended in [19, 20] by identifying the label of a process executionin a probabilistic way and by extracting rules to explain the discrepancies among process variants.A follow-up work by Folino et al. [26] proposes a peer-to-peer architecture for the discovery ofbase learners. The proposed architecture enables the business analyst to apply the approach in anonline setting for a stream of traces. The stream of traces is processed by chunks thus allowingbase learners to be adjusted periodically.
Bolt et al. [8] exploit Process Cubes [11] to split, group and compare process executions. Processcubes provide operations such as slice, dice, roll-up, and drill-down to break down process dataand compare different groups or process variants to highlight dissimilarities. The work considersprocess executions containing the activities of a student. A process cube with various dimensions,such as “Course code”, “Grade” and “Activity Type” is created. The outcomes of this analysis areprovided in different qualitative forms such as simple statistic values, dotted charts and comparisonsof activity flows. A follow-up of this work is presented in [10]. Here, the differences between twosets of process executions are visualized by projecting them onto a transition system where statesand transitions are colored to highlight the differences. The highlighted parts only show differentdominant behaviors that are statistically significant, and rare differences are masked out for thesake of readability. The transition system is annotated with information such as the frequency ofan event, the elapsed time of an event (i.e., the time elapsed between the beginning of the processexecution and the occurrence of the event) for each process variant. This work was extended in[9] by inducting decision trees for each decision point (i.e., a node that branches) of the transitionsystem. A set of rules is derived from the trained decision trees to explain the differences amongprocess variants.
The work by Gulden et al. [30] proposes a circular time-line visualization, called rhythm-eye, tocompare process executions in terms of execution time. In the proposed view, events are rendered asthin lines on top of the rhythm-eye ring. Average time values of each event type are represented bysemi-transparent thicker circle segments, one per event type. Different event types are distinguishedby colors. The approach computes a rhythm-eye view for each process variant and configures themto highlight differences.Recently, Nguyen et al. [47] have proposed an approach to compare process variants via Per-
spective Graphs. A Perspective Graph is a graph-based abstraction of an event log where a noderepresents any entity referenced in an attribute of the event log (e.g., activity, resource, location),and an arc shows an arbitrary relation between entities. The approach starts by abstracting processexecutions in each process variant. The abstraction can be made on the order of activities or onany event attribute, e.g. the order in which resources hand over work to one another, or on acombination thereof (a schema). This results in a Perspective graph. The comparison can be donefor any process perspective depending on the employed entities. To compare two PerspectiveGraphs a Differential Graph is computed. This graph contains common nodes and edges and alsonodes and edges that appear in one perspective graph only. The weights of common nodes andedges are determined via statistical tests. Finally, the approach provides the identified differencesin a matrix-based representation.
15
Primary study Subsumed studiesBolt et al. [9] Bolt et al. [8, 10]Ballambettu et al. [5] Kriglstein et al. [37]Cordes et al. [16]Poelmans et al. [51]Partington et al. [49] Suriadi et al. [57, 58]Swinnen et al. [59]Sun et al. [56]Bose et al. [12]Wynn et al. [68] Pini et al. [50], Andrews et al. [2],
Conforti et al. [15]Buijs et al. [13] Bujis et al. [14]van Beest et al. [61]Folino et al. [26] Cuzzocrea et al. [17–20], Folino et al. [27]Lakshmanan et al. [40]Gulden et al. [30]Nguyen et al. [47]
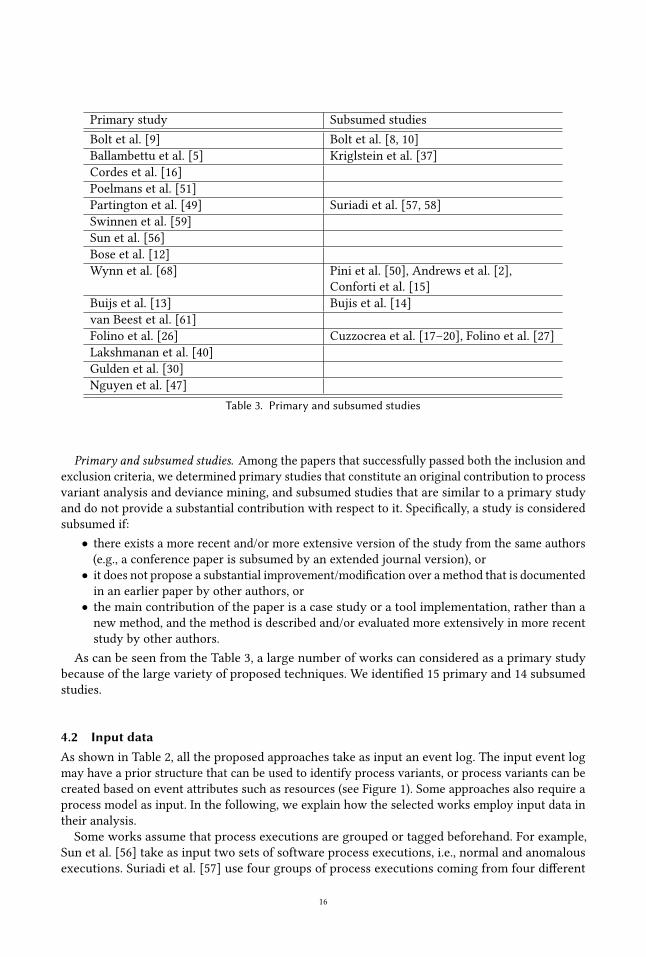
Table 3. Primary and subsumed studies
Primary and subsumed studies. Among the papers that successfully passed both the inclusion andexclusion criteria, we determined primary studies that constitute an original contribution to processvariant analysis and deviance mining, and subsumed studies that are similar to a primary studyand do not provide a substantial contribution with respect to it. Specifically, a study is consideredsubsumed if:
• there exists a more recent and/or more extensive version of the study from the same authors(e.g., a conference paper is subsumed by an extended journal version), or
• it does not propose a substantial improvement/modification over a method that is documentedin an earlier paper by other authors, or
• the main contribution of the paper is a case study or a tool implementation, rather than anew method, and the method is described and/or evaluated more extensively in more recentstudy by other authors.
As can be seen from the Table 3, a large number of works can considered as a primary studybecause of the large variety of proposed techniques. We identified 15 primary and 14 subsumedstudies.
4.2 Input dataAs shown in Table 2, all the proposed approaches take as input an event log. The input event logmay have a prior structure that can be used to identify process variants, or process variants can becreated based on event attributes such as resources (see Figure 1). Some approaches also require aprocess model as input. In the following, we explain how the selected works employ input data intheir analysis.Some works assume that process executions are grouped or tagged beforehand. For example,
Sun et al. [56] take as input two sets of software process executions, i.e., normal and anomalousexecutions. Suriadi et al. [57] use four groups of process executions coming from four different
16
hospitals. Similarly, the process variants in [2, 5, 9, 13, 14, 17, 19, 20, 26, 30, 61] are pre-defined.Although the input process executions in [47] are grouped beforehand, the approach can inherentlycreate process variants based on performance attributes.In other studies, process variants can be created based on performance data. The studies in
[50, 68] use min/max/avg activity durations as objective measures to characterize different processvariants. Cordes et al. [16], in their analysis, employ case attributes, such as the age or the regionof a customer, to group together process executions. Likewise, Suriadi at al. [58] use the cycle timeof a case to group process executions into cohorts. Bose et al. [12] group process executions ofa process to repair malfunctions in X-ray machines according to the mean-time-to-repair of theparts that must be replaced. The work by Bolt et al. [8] uses Process Cubes [11] to group processexecutions based on performance data of students.
The works in [18, 27, 59] neither take as input a categorized set of process executions nor groupthem based on event or case attribute values. Indeed, the main aim of such studies is to discoverprocess variants with no prior knowledge. However, the study in [18] assumes as prior knowledgethe percentage of deviant and non-deviant cases.Some approaches take as additional input a normative process model [13, 37, 68]. A normative
process model is used as a reference model for quantifying to what extent the process variants differfrom normative executions. The normative process model can be provided using different notations.The authors in [13] use BPMN, whereas the authors in [68] employ Petri nets. The approachpresented in [37] does not pose any specific restrictions on the process modeling language employed,but for special concepts of certain languages developing extensions could become necessary.
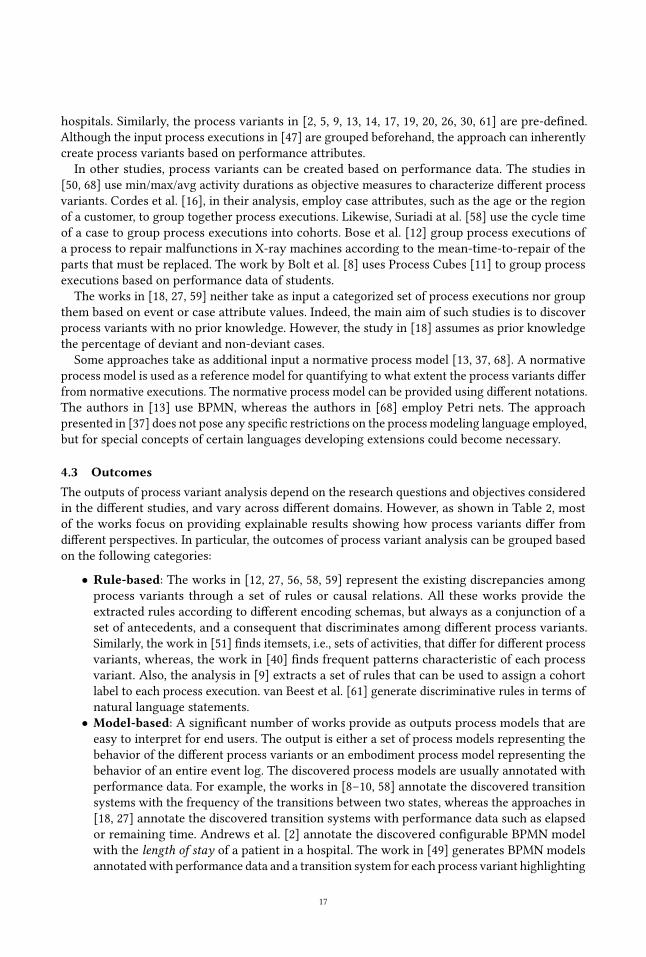
4.3 OutcomesThe outputs of process variant analysis depend on the research questions and objectives consideredin the different studies, and vary across different domains. However, as shown in Table 2, mostof the works focus on providing explainable results showing how process variants differ fromdifferent perspectives. In particular, the outcomes of process variant analysis can be grouped basedon the following categories:
• Rule-based: The works in [12, 27, 56, 58, 59] represent the existing discrepancies amongprocess variants through a set of rules or causal relations. All these works provide theextracted rules according to different encoding schemas, but always as a conjunction of aset of antecedents, and a consequent that discriminates among different process variants.Similarly, the work in [51] finds itemsets, i.e., sets of activities, that differ for different processvariants, whereas, the work in [40] finds frequent patterns characteristic of each processvariant. Also, the analysis in [9] extracts a set of rules that can be used to assign a cohortlabel to each process execution. van Beest et al. [61] generate discriminative rules in terms ofnatural language statements.
• Model-based: A significant number of works provide as outputs process models that areeasy to interpret for end users. The output is either a set of process models representing thebehavior of the different process variants or an embodiment process model representing thebehavior of an entire event log. The discovered process models are usually annotated withperformance data. For example, the works in [8–10, 58] annotate the discovered transitionsystems with the frequency of the transitions between two states, whereas the approaches in[18, 27] annotate the discovered transition systems with performance data such as elapsedor remaining time. Andrews et al. [2] annotate the discovered configurable BPMN modelwith the length of stay of a patient in a hospital. The work in [49] generates BPMN modelsannotatedwith performance data and a transition system for each process variant highlighting
17
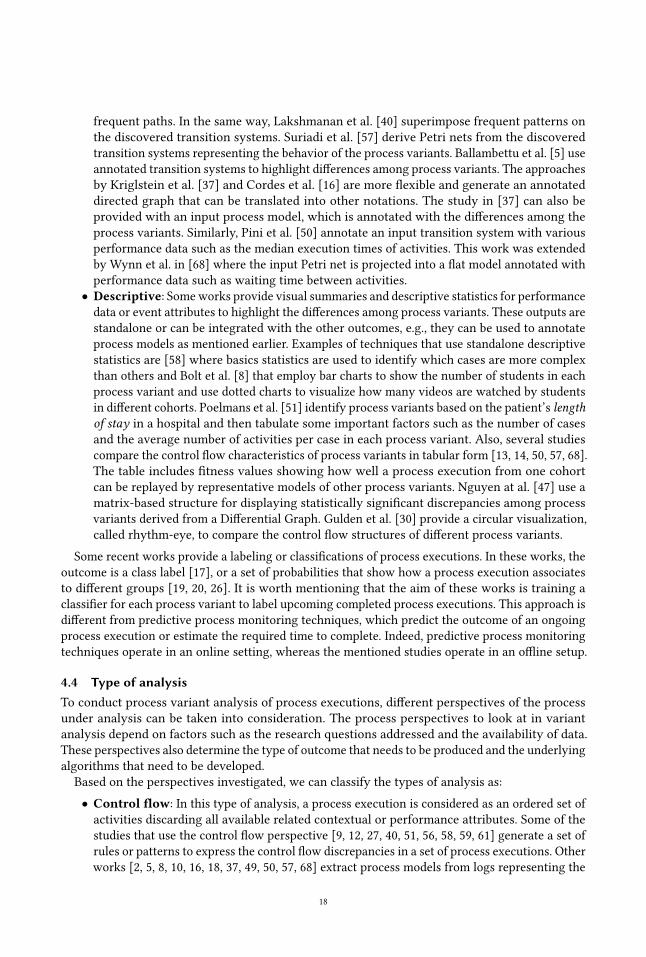
frequent paths. In the same way, Lakshmanan et al. [40] superimpose frequent patterns onthe discovered transition systems. Suriadi et al. [57] derive Petri nets from the discoveredtransition systems representing the behavior of the process variants. Ballambettu et al. [5] useannotated transition systems to highlight differences among process variants. The approachesby Kriglstein et al. [37] and Cordes et al. [16] are more flexible and generate an annotateddirected graph that can be translated into other notations. The study in [37] can also beprovided with an input process model, which is annotated with the differences among theprocess variants. Similarly, Pini et al. [50] annotate an input transition system with variousperformance data such as the median execution times of activities. This work was extendedby Wynn et al. in [68] where the input Petri net is projected into a flat model annotated withperformance data such as waiting time between activities.
• Descriptive: Someworks provide visual summaries and descriptive statistics for performancedata or event attributes to highlight the differences among process variants. These outputs arestandalone or can be integrated with the other outcomes, e.g., they can be used to annotateprocess models as mentioned earlier. Examples of techniques that use standalone descriptivestatistics are [58] where basics statistics are used to identify which cases are more complexthan others and Bolt et al. [8] that employ bar charts to show the number of students in eachprocess variant and use dotted charts to visualize how many videos are watched by studentsin different cohorts. Poelmans et al. [51] identify process variants based on the patient’s lengthof stay in a hospital and then tabulate some important factors such as the number of casesand the average number of activities per case in each process variant. Also, several studiescompare the control flow characteristics of process variants in tabular form [13, 14, 50, 57, 68].The table includes fitness values showing how well a process execution from one cohortcan be replayed by representative models of other process variants. Nguyen at al. [47] use amatrix-based structure for displaying statistically significant discrepancies among processvariants derived from a Differential Graph. Gulden et al. [30] provide a circular visualization,called rhythm-eye, to compare the control flow structures of different process variants.
Some recent works provide a labeling or classifications of process executions. In these works, theoutcome is a class label [17], or a set of probabilities that show how a process execution associatesto different groups [19, 20, 26]. It is worth mentioning that the aim of these works is training aclassifier for each process variant to label upcoming completed process executions. This approach isdifferent from predictive process monitoring techniques, which predict the outcome of an ongoingprocess execution or estimate the required time to complete. Indeed, predictive process monitoringtechniques operate in an online setting, whereas the mentioned studies operate in an offline setup.
4.4 Type of analysisTo conduct process variant analysis of process executions, different perspectives of the processunder analysis can be taken into consideration. The process perspectives to look at in variantanalysis depend on factors such as the research questions addressed and the availability of data.These perspectives also determine the type of outcome that needs to be produced and the underlyingalgorithms that need to be developed.
Based on the perspectives investigated, we can classify the types of analysis as:
• Control flow: In this type of analysis, a process execution is considered as an ordered set ofactivities discarding all available related contextual or performance attributes. Some of thestudies that use the control flow perspective [9, 12, 27, 40, 51, 56, 58, 59, 61] generate a set ofrules or patterns to express the control flow discrepancies in a set of process executions. Otherworks [2, 5, 8, 10, 16, 18, 37, 49, 50, 57, 68] extract process models from logs representing the
18

behaviors of different process variants. Some works provide a visual comparison to highlightdiscrepancies. For example, the work in [47] provides a compact matrix-based representationof statistically significant differences from a Differential Graph. Similarly, Gulden et al. [30]produces rhythm-eye views to compare process variants based on control flow. Finally, severalstudies [13, 14, 50, 57, 68] compare the control flow characteristics of process variants usingalignments.
• Performance analysis: Recent works have focused more on the analysis of contextual orperformance attributes. This perspective is important since a set of process executions withthe same control flow could have different cycle times or use different types of resources.Most of these works consider time-related performance data in their analysis. For example,Poelmans et al. [51] consider the length of stay of a patient for cycle time analysis to discoverdiscrepancies among patients with the same control flow structures. In [2, 18, 27, 49, 50, 57],the authors take into account the cycle time of process executions to separate processexecutions into groups and then find control flow characteristics of slow cases. In the samevein, the work by Nguyen et al. [47] discovers a control flow model for any combination oftime-based attribute values. The studies in [5, 30, 49, 57, 68] work with the waiting timesbetween activities across different process variants to understand the existing performancevariations, whereas Pini et al. [50] consider the median duration of each activity. Bolt et al.[9, 10] investigate the elapsed time, i.e., the time between the starting point of a processexecution and the occurrence of a certain event to identify performance deviations. Otherworks start from pre-defined groups of process executions and leverage both control flow andperformance data to characterize those groups. For example, in [17, 19, 20, 26], the authorsuse both control flow and cycle time of process executions to train an ensemble classifier.The classifier assigns an upcoming process execution to a process variant.
Except the work in [47], it is interesting to observe that none of the techniques we retrievedconsiders the possibility of comparing process variants along other perspectives besides the abovetwo. Yet, it is conceivable that two process variants may differ along the resource perspective (e.g.different resource pool), or along the data perspective.
4.5 Family of algorithmsWhen conducting process variant analysis, the underlying algorithms used are strongly influencedby the input data and by the accessibility of performance attributes. Nevertheless, the proposedalgorithms share the ability of providing explainable results. Broadly speaking, the algorithms usedin the selected papers belong to two main families:
• Process mining: This family of algorithms uses process mining techniques to uncoverdifferences among process variants. The majority of the proposed approaches discover aprocess model for every process variant, and then compare them to highlight the differences.In [8, 10, 58], the authors discover an annotated transition system where states and transitionsare colored to show different dominant behaviors (representing different process variants)that are statistically significant. Factors such as frequency and elapsed time of an eventare considered in the analysis. Similarly, in [18], a transition system is discovered from thewhole event log and annotated with performance metrics characterizing each process variant.Kriglstein et al. [37] compute a directed graph, called Difference model, to highlight theexisting differences between two process variants. In this work, a normative process modelrepresenting the expected process behavior can be provided as input. This work was extendedby Ballambettu et al. [5] where annotated transition systems are used (called process maps)to represent the behaviors of different process variants. Suriadi et al. [57] discover a Petri
19
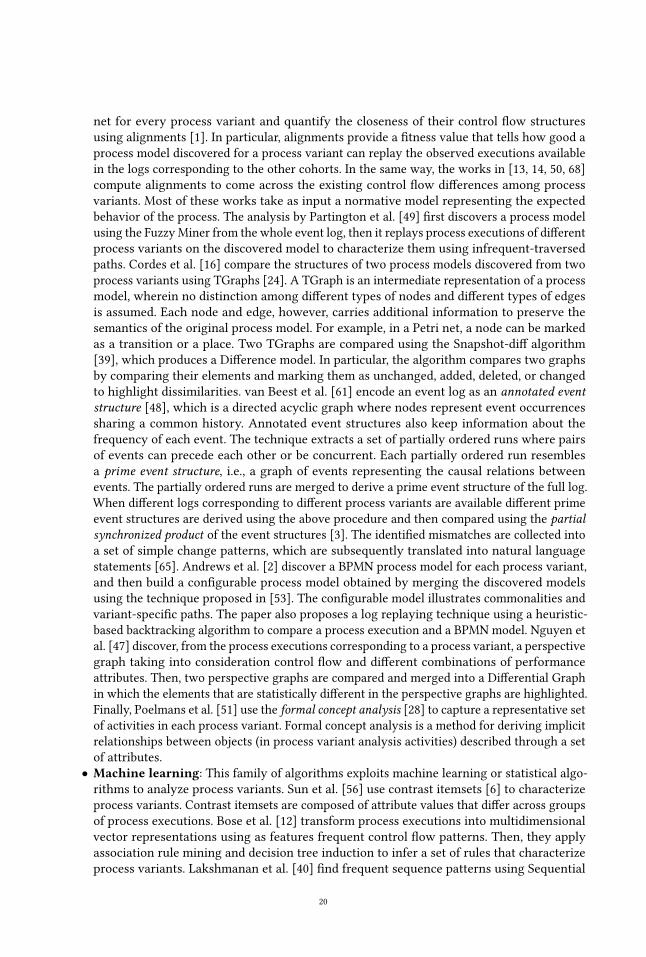
net for every process variant and quantify the closeness of their control flow structuresusing alignments [1]. In particular, alignments provide a fitness value that tells how good aprocess model discovered for a process variant can replay the observed executions availablein the logs corresponding to the other cohorts. In the same way, the works in [13, 14, 50, 68]compute alignments to come across the existing control flow differences among processvariants. Most of these works take as input a normative model representing the expectedbehavior of the process. The analysis by Partington et al. [49] first discovers a process modelusing the FuzzyMiner from the whole event log, then it replays process executions of differentprocess variants on the discovered model to characterize them using infrequent-traversedpaths. Cordes et al. [16] compare the structures of two process models discovered from twoprocess variants using TGraphs [24]. A TGraph is an intermediate representation of a processmodel, wherein no distinction among different types of nodes and different types of edgesis assumed. Each node and edge, however, carries additional information to preserve thesemantics of the original process model. For example, in a Petri net, a node can be markedas a transition or a place. Two TGraphs are compared using the Snapshot-diff algorithm[39], which produces a Difference model. In particular, the algorithm compares two graphsby comparing their elements and marking them as unchanged, added, deleted, or changedto highlight dissimilarities. van Beest et al. [61] encode an event log as an annotated eventstructure [48], which is a directed acyclic graph where nodes represent event occurrencessharing a common history. Annotated event structures also keep information about thefrequency of each event. The technique extracts a set of partially ordered runs where pairsof events can precede each other or be concurrent. Each partially ordered run resemblesa prime event structure, i.e., a graph of events representing the causal relations betweenevents. The partially ordered runs are merged to derive a prime event structure of the full log.When different logs corresponding to different process variants are available different primeevent structures are derived using the above procedure and then compared using the partialsynchronized product of the event structures [3]. The identified mismatches are collected intoa set of simple change patterns, which are subsequently translated into natural languagestatements [65]. Andrews et al. [2] discover a BPMN process model for each process variant,and then build a configurable process model obtained by merging the discovered modelsusing the technique proposed in [53]. The configurable model illustrates commonalities andvariant-specific paths. The paper also proposes a log replaying technique using a heuristic-based backtracking algorithm to compare a process execution and a BPMN model. Nguyen etal. [47] discover, from the process executions corresponding to a process variant, a perspectivegraph taking into consideration control flow and different combinations of performanceattributes. Then, two perspective graphs are compared and merged into a Differential Graphin which the elements that are statistically different in the perspective graphs are highlighted.Finally, Poelmans et al. [51] use the formal concept analysis [28] to capture a representative setof activities in each process variant. Formal concept analysis is a method for deriving implicitrelationships between objects (in process variant analysis activities) described through a setof attributes.
• Machine learning: This family of algorithms exploits machine learning or statistical algo-rithms to analyze process variants. Sun et al. [56] use contrast itemsets [6] to characterizeprocess variants. Contrast itemsets are composed of attribute values that differ across groupsof process executions. Bose et al. [12] transform process executions into multidimensionalvector representations using as features frequent control flow patterns. Then, they applyassociation rule mining and decision tree induction to infer a set of rules that characterizeprocess variants. Lakshmanan et al. [40] find frequent sequence patterns using Sequential
20
Pattern Mining with bitmap representation (SPAM) [4]. The patterns are used to representevery process execution as a Bag-of-Pattern (BoP). Then, Density-Based Spatial Clusteringof Applications with Noise (DBSCAN) [25] is used to cluster process executions in differentcohorts. The work in [17], after transforming process executions into multidimensionalfeature vectors, adopts an ensemble method (Bayesian Model Averaging) to learn a classifiervia stacking [22]. Stacking is a meta-learning task in machine learning where a classifieruses the output of other base classifiers to better classify or label a process execution. Inparticular, meta-learning allows a learner to not only learn from historical data, but alsofrom other learning tasks. The approaches in [19, 20] extend the previous work by adoptingthe Hidden Naive Bayes classifier [69] at the meta-learning level. This type of classifierprovides probabilistic outcomes. Folino et al. [26] extend the previous works by proposing apeer-to-peer computing architecture to speed up the training phase of base learners.
It is worth pointing out that, though we broke up the process variant analysis algorithms intotwo families, some works belong to both. For example, Swinnen et al. [59] first discover a processmodel using the Fuzzy Miner, and then find discrepancies between the discovered model and anormative model to assign process executions to different process variants. Then, the authors usethe Apriori algorithm [54] from association rule mining to find a set of rules characterizing eachprocess variant. Similarly, Folino et al. [27] propose an iterative optimization algorithm to infer aset of rules to group process executions into process variants. Then, a process model is discoveredfor each cohort using the Fuzzy Miner. Works that are in between the two families are the onepresented in [58] that infers a set of causal relation rules to characterize lengthy process executionsand the analysis presented in [57] that uses K-means clustering to group the input set of processexecutions. Finally, Bolt et al. [9] also use a typical process mining algorithm to create an annotatedtransition system starting from a log, and then, for every decision point in the transition system,train a classifier to distinguish different process variants.
4.6 Evaluation data and application domainAs reported in Table 2, most of the surveyed methods have been validated on at least one real-lifeevent log, and a few studies were additionally validated on simulated (synthetic) logs. Most of thereal-life logs employed are publicly available in the 4TU Center for Research Data3. Among themethods that use real-life logs, we observed a growing trend to use publicly available datasets, asopposed to private logs that hinder the reproducibility of the results.
Process variant analysis is attractive and beneficial in domains where a single process model isexecuted across different organizations. A good example is provided by SaaS applications, where asingle version of an application, with a single configuration, is used for different customers, suchas applications for logistics, Incidence Management (IcM), financial management and healthcaremanagement. From Table 2, we notice that most of the selected works pertain to healthcare (12studies), logistics (4 studies), public administration (5 studies), industrial and insurance organizations(5 studies), financial institutions (3 studies), education systems (1 study) and IcM systems (1 study).
4.7 ImplementationProviding publicly available implementations and experimental data facilitates the reproducibilityof the results and enables researchers to build on past works. According to Table 2, around half ofthe methods provide an implementation as a plug-in of the process mining tools ProM [52] andApromore [38]. Both the aforementioned frameworks are open-source and portable, which allows
3https://data.4tu.nl/repository/collection:event_logs_real
21
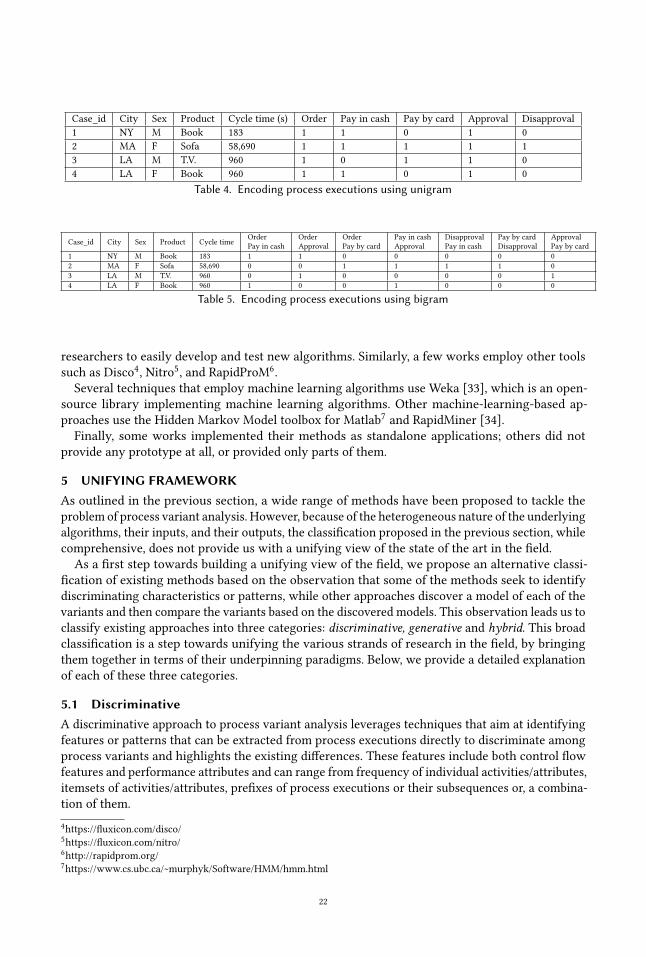
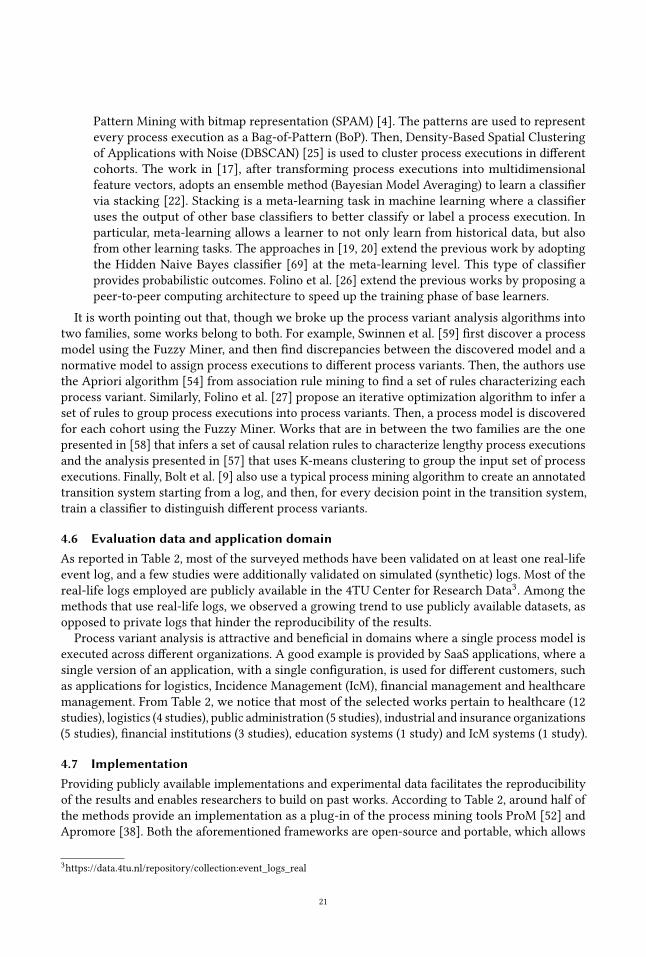
Case_id City Sex Product Cycle time (s) Order Pay in cash Pay by card Approval Disapproval1 NY M Book 183 1 1 0 1 02 MA F Sofa 58,690 1 1 1 1 13 LA M T.V. 960 1 0 1 1 04 LA F Book 960 1 1 0 1 0
Table 4. Encoding process executions using unigram
Case_id City Sex Product Cycle time OrderPay in cash
OrderApproval
OrderPay by card
Pay in cashApproval
DisapprovalPay in cash
Pay by cardDisapproval
ApprovalPay by card
1 NY M Book 183 1 1 0 0 0 0 02 MA F Sofa 58,690 0 0 1 1 1 1 03 LA M T.V. 960 0 1 0 0 0 0 14 LA F Book 960 1 0 0 1 0 0 0
Table 5. Encoding process executions using bigram
researchers to easily develop and test new algorithms. Similarly, a few works employ other toolssuch as Disco4, Nitro5, and RapidProM6.Several techniques that employ machine learning algorithms use Weka [33], which is an open-
source library implementing machine learning algorithms. Other machine-learning-based ap-proaches use the Hidden Markov Model toolbox for Matlab7 and RapidMiner [34].Finally, some works implemented their methods as standalone applications; others did not
provide any prototype at all, or provided only parts of them.
5 UNIFYING FRAMEWORKAs outlined in the previous section, a wide range of methods have been proposed to tackle theproblem of process variant analysis. However, because of the heterogeneous nature of the underlyingalgorithms, their inputs, and their outputs, the classification proposed in the previous section, whilecomprehensive, does not provide us with a unifying view of the state of the art in the field.As a first step towards building a unifying view of the field, we propose an alternative classi-
fication of existing methods based on the observation that some of the methods seek to identifydiscriminating characteristics or patterns, while other approaches discover a model of each of thevariants and then compare the variants based on the discovered models. This observation leads us toclassify existing approaches into three categories: discriminative, generative and hybrid. This broadclassification is a step towards unifying the various strands of research in the field, by bringingthem together in terms of their underpinning paradigms. Below, we provide a detailed explanationof each of these three categories.
5.1 DiscriminativeA discriminative approach to process variant analysis leverages techniques that aim at identifyingfeatures or patterns that can be extracted from process executions directly to discriminate amongprocess variants and highlights the existing differences. These features include both control flowfeatures and performance attributes and can range from frequency of individual activities/attributes,itemsets of activities/attributes, prefixes of process executions or their subsequences or, a combina-tion of them.4https://fluxicon.com/disco/5https://fluxicon.com/nitro/6http://rapidprom.org/7https://www.cs.ubc.ca/~murphyk/Software/HMM/hmm.html
22
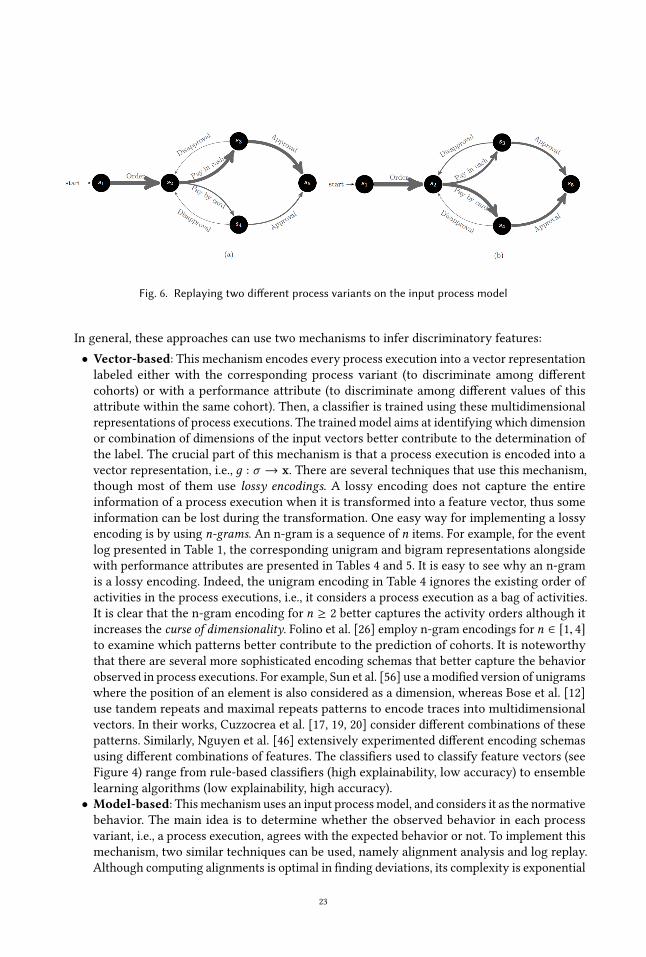
Fig. 6. Replaying two different process variants on the input process model
In general, these approaches can use two mechanisms to infer discriminatory features:• Vector-based: This mechanism encodes every process execution into a vector representationlabeled either with the corresponding process variant (to discriminate among differentcohorts) or with a performance attribute (to discriminate among different values of thisattribute within the same cohort). Then, a classifier is trained using these multidimensionalrepresentations of process executions. The trained model aims at identifying which dimensionor combination of dimensions of the input vectors better contribute to the determination ofthe label. The crucial part of this mechanism is that a process execution is encoded into avector representation, i.e., д : σ → x. There are several techniques that use this mechanism,though most of them use lossy encodings. A lossy encoding does not capture the entireinformation of a process execution when it is transformed into a feature vector, thus someinformation can be lost during the transformation. One easy way for implementing a lossyencoding is by using n-grams. An n-gram is a sequence of n items. For example, for the eventlog presented in Table 1, the corresponding unigram and bigram representations alongsidewith performance attributes are presented in Tables 4 and 5. It is easy to see why an n-gramis a lossy encoding. Indeed, the unigram encoding in Table 4 ignores the existing order ofactivities in the process executions, i.e., it considers a process execution as a bag of activities.It is clear that the n-gram encoding for n ≥ 2 better captures the activity orders although itincreases the curse of dimensionality. Folino et al. [26] employ n-gram encodings for n ∈ [1, 4]to examine which patterns better contribute to the prediction of cohorts. It is noteworthythat there are several more sophisticated encoding schemas that better capture the behaviorobserved in process executions. For example, Sun et al. [56] use amodified version of unigramswhere the position of an element is also considered as a dimension, whereas Bose et al. [12]use tandem repeats and maximal repeats patterns to encode traces into multidimensionalvectors. In their works, Cuzzocrea et al. [17, 19, 20] consider different combinations of thesepatterns. Similarly, Nguyen et al. [46] extensively experimented different encoding schemasusing different combinations of features. The classifiers used to classify feature vectors (seeFigure 4) range from rule-based classifiers (high explainability, low accuracy) to ensemblelearning algorithms (low explainability, high accuracy).
• Model-based: This mechanism uses an input process model, and considers it as the normativebehavior. The main idea is to determine whether the observed behavior in each processvariant, i.e., a process execution, agrees with the expected behavior or not. To implement thismechanism, two similar techniques can be used, namely alignment analysis and log replay.Although computing alignments is optimal in finding deviations, its complexity is exponential
23
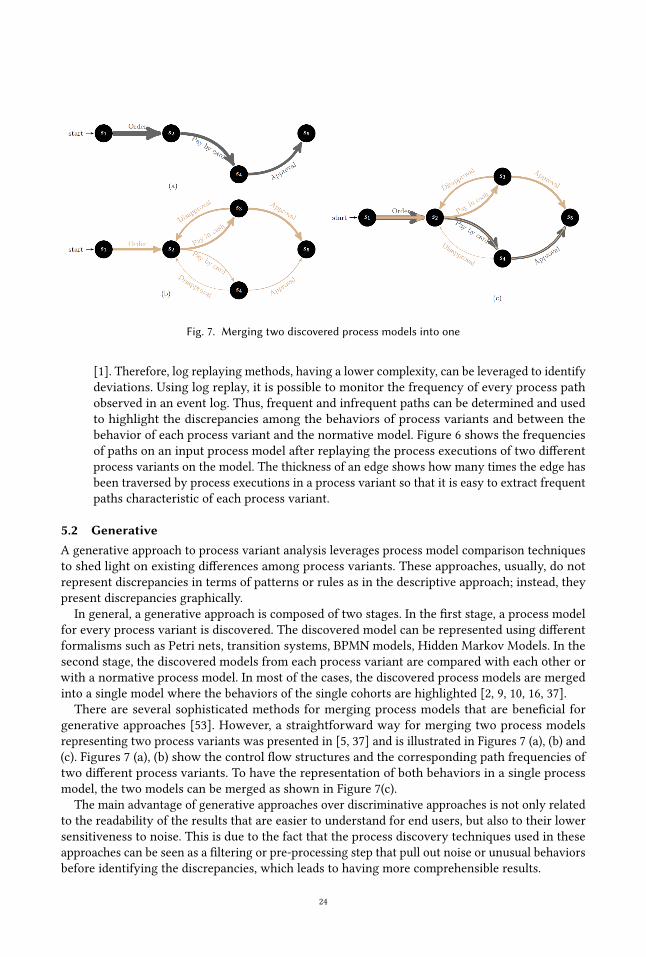
Fig. 7. Merging two discovered process models into one
[1]. Therefore, log replaying methods, having a lower complexity, can be leveraged to identifydeviations. Using log replay, it is possible to monitor the frequency of every process pathobserved in an event log. Thus, frequent and infrequent paths can be determined and usedto highlight the discrepancies among the behaviors of process variants and between thebehavior of each process variant and the normative model. Figure 6 shows the frequenciesof paths on an input process model after replaying the process executions of two differentprocess variants on the model. The thickness of an edge shows how many times the edge hasbeen traversed by process executions in a process variant so that it is easy to extract frequentpaths characteristic of each process variant.
5.2 GenerativeA generative approach to process variant analysis leverages process model comparison techniquesto shed light on existing differences among process variants. These approaches, usually, do notrepresent discrepancies in terms of patterns or rules as in the descriptive approach; instead, theypresent discrepancies graphically.
In general, a generative approach is composed of two stages. In the first stage, a process modelfor every process variant is discovered. The discovered model can be represented using differentformalisms such as Petri nets, transition systems, BPMN models, Hidden Markov Models. In thesecond stage, the discovered models from each process variant are compared with each other orwith a normative process model. In most of the cases, the discovered process models are mergedinto a single model where the behaviors of the single cohorts are highlighted [2, 9, 10, 16, 37].There are several sophisticated methods for merging process models that are beneficial for
generative approaches [53]. However, a straightforward way for merging two process modelsrepresenting two process variants was presented in [5, 37] and is illustrated in Figures 7 (a), (b) and(c). Figures 7 (a), (b) show the control flow structures and the corresponding path frequencies oftwo different process variants. To have the representation of both behaviors in a single processmodel, the two models can be merged as shown in Figure 7(c).
The main advantage of generative approaches over discriminative approaches is not only relatedto the readability of the results that are easier to understand for end users, but also to their lowersensitiveness to noise. This is due to the fact that the process discovery techniques used in theseapproaches can be seen as a filtering or pre-processing step that pull out noise or unusual behaviorsbefore identifying the discrepancies, which leads to having more comprehensible results.
24
5.3 HybridHybrid approaches are a combination of a generative phase and a discriminative phase. The ideabehind hybrid approaches is to discover discriminatory patterns or rules and project them ontoa process model. These approaches are usually composed of several stages. Usually a hybridapproach starts by discovering a process model from the log corresponding to a process variant and,then, discriminative patterns are discovered to characterize different process variants. Finally, thediscriminative patterns are superimposed on the discovered model to highlight discriminative parts.For example, the approach presented in [40] finds frequent sequence patterns using SequentialPattern Mining and project them onto the process model discovered from the process executions ofeach process variant.
One of the most straightforward hybrid approaches consists in discovering a process model forevery process variant and then applying cross-validation. Usually, cross-validation is accomplishedby computing alignments to quantify how similar control flow structures are across different processvariants [13, 50, 57]. For example, assume that there arem process variants, andm process modelsrepresenting them are discovered. Then, a process variant is selected, and its process executionsare aligned with the otherm − 1 process models. The procedure repeats for all process variants.The result is a matrix structure containing the average fitness values, which show the similaritiesin terms of control flow of the different process variants.
6 CONCLUSIONUnderstanding the differences between multiple process variants can help analysts and managersto make informed decisions as to how to standardize or otherwise improve a business process, forexample by helping them find out what factors lead to a given variant exhibiting better performancethan another one. Various methods for process variant analysis based on event logs have beenproposed in the past decade. However, to this date, the field remains rather fragmented.As a first step towards building up a unified view of the field, this article provided a survey
and a classification of existing methods for business process variant analysis. The relevant studieswere identified through a systematic literature review, which retrieved 29 studies. Out of these29 studies, 15 of them propose distinct methods (primary studies). Through further analysis ofthe primary studies, a taxonomy was proposed based on four aspects: (1) the type of input datarequired; (2) the provided outputs; (3) the type of analysis, and (4) the algorithms employed. Whileanalyzing the algorithms employed, we noticed that some of the methods rely on the identificationof characteristics or patterns that are frequently present in one variant and not in the other variants(discriminative approaches). Other approaches, in contrast, seek to discover a model for each of theprocess variants and then compare the discovered models (generative approaches). It was foundthat 8 out of the 15 primary studies employ a generative approach, while the remaining 9 employdiscriminative or hybrid generative-discriminative approaches.
The study shed light into research gaps in the field and corresponding avenues for future work.First, most of the studies consider time-related performance, thus ignoring other performancedimensions such as cost, quality, flexibility, or compliance. Second, while a large subset of existingapproaches focus on control-flow differences, the question of comparing process variants along thedata perspective or the resource perspective has not received attention. Finally, most of the proposedapproaches show the identified deviations in a descriptive way, without backing up the detecteddifferences between process variants with statistical tests or causal analysis, which could helpto generate recommendations for addressing deficiencies in one or more of the analyzed processvariants. In other words, this study calls for the development of multi-perspective approaches toprocess variant analysis, which would seek not only to identify differences between two or more
25
variants, but also, to conclusively determine which of these differences contribute to observeddifferences in the performance of the process variants. Such multi-perspective and statisticallygrounded approaches could help analysts and managers to obtain insights into how to improve theperformance of specific variants of a business process.
ACKNOWLEDGMENTSThis research is partly funded by the Australian Research Council (grant DP180102839) and theEuropean Research Council (PIX project).
REFERENCES[1] A. Adriansyah. 2014. Aligning observed and modeled behavior. Ph.D. Dissertation. Department of Mathematics and
Computer Science.[2] Robert Andrews, Suriadi Suriadi, Moe Thandar Wynn, Arthur H. M. ter Hofstede, Anastasiia Pika, Huang Huy Nguyen,
and Marcello La Rosa. 2016. Comparing static and dynamic aspects of patient flows via process model visualisations.Science & Engineering Faculty (2016).
[3] Abel Armas-Cervantes, Paolo Baldan, Marlon Dumas, and Luciano García-Bañuelos. 2014. Behavioral Comparison ofProcess Models Based on Canonically Reduced Event Structures. In Business Process Management, Shazia Sadiq, PninaSoffer, and Hagen Völzer (Eds.). Springer International Publishing, Cham, 267–282.
[4] Jay Ayres, Jason Flannick, Johannes Gehrke, and Tomi Yiu. 2002. Sequential PAttern Mining Using a Bitmap Represen-tation. In Proceedings of the Eighth ACM SIGKDD International Conference on Knowledge Discovery and Data Mining(KDD ’02). ACM, New York, NY, USA, 429–435. https://doi.org/10.1145/775047.775109
[5] Nithish Pai Ballambettu, Mahima Agumbe Suresh, and R. P. Jagadeesh Chandra Bose. 2017. Analyzing Process Variantsto Understand Differences in Key Performance Indices. In Advanced Information Systems Engineering, Eric Dubois andKlaus Pohl (Eds.). Springer International Publishing, Cham, 298–313.
[6] Stephen D. Bay and Michael J. Pazzani. 2001. Detecting Group Differences: Mining Contrast Sets. Data Mining andKnowledge Discovery 5, 3 (01 Jul 2001), 213–246. https://doi.org/10.1023/A:1011429418057
[7] Patrick Biernacki and Dan Waldorf. 1981. Snowball Sampling: Problems and Techniques of Chain Referral Sampling.Sociological Methods & amp Research 10 (11 1981).
[8] Alfredo Bolt, Massimiliano De Leoni, Wil M.P. van der Aalst, and Pierre Gorissen. 2015. Exploiting process cubes,analytic workflows and process mining for business process reporting: A case study in education. In Data-DrivenProcess Discovery and Analysis (SIMPDA 2015), December 9-11, 2015, Vienna, Austria (CEUR Workshop Proceedings),P. Ceravolo and S. Rinderle-Ma (Eds.). CEUR-WS.org, 33–47.
[9] Alfredo Bolt, Massimiliano de Leoni, and Wil M.P. van der Aalst. 2018. Process variant comparison: Using event logsto detect differences in behavior and business rules. Information Systems 74, Fundamenta Informaticae 94 3-4 2009(2018), 53–66. https://doi.org/10.1016/j.is.2017.12.006
[10] Alfredo Bolt, Massimiliano de Leoni, and Wil M. P. van der Aalst. 2016. A Visual Approach to Spot Statistically-Significant Differences in Event Logs Based on Process Metrics. In Advanced Information Systems Engineering, SelminNurcan, Pnina Soffer, Marko Bajec, and Johann Eder (Eds.). Springer International Publishing, Cham, 151–166.
[11] Alfredo Bolt and Wil M. P. van der Aalst. 2015. Multidimensional Process Mining Using Process Cubes. In Enterprise,Business-Process and Information Systems Modeling, Khaled Gaaloul, Rainer Schmidt, Selmin Nurcan, Sérgio Guerreiro,and Qin Ma (Eds.). Springer International Publishing, Cham, 102–116.
[12] R. P. J. C. Bose andW. M. P. van der Aalst. 2013. Discovering signature patterns from event logs. In 2013 IEEE Symposiumon Computational Intelligence and Data Mining (CIDM). 111–118.
[13] Joos C. A. M. Buijs and Hajo A. Reijers. 2014. Comparing Business Process Variants Using Models and Event Logs. InEnterprise, Business-Process and Information Systems Modeling, Ilia Bider, Khaled Gaaloul, John Krogstie, Selmin Nurcan,Henderik A. Proper, Rainer Schmidt, and Pnina Soffer (Eds.). Springer Berlin Heidelberg, Berlin, Heidelberg, 154–168.
[14] J. C. A. M. Buijs, Boudewijn F. van Dongen, and Wil M. P. van der Aalst. 2012. Towards Cross-Organizational ProcessMining in Collections of Process Models and Their Executions. In Business Process Management Workshops, FlorianDaniel, Kamel Barkaoui, and Schahram Dustdar (Eds.). Springer Berlin Heidelberg, Berlin, Heidelberg, 2–13.
[15] Raffaele Conforti, Marlon Dumas, Marcello La Rosa, Abderrahmane Maaradji, Hoang Nguyen, Alireza Ostovar, and SRaboczi. 2015. Analysis of business process variants in apromore. CEUR Workshop Proceedings 1418 (01 2015), 16–20.
[16] Carsten Cordes, Thomas Vogelgesang, and Hans-Jürgen Appelrath. 2015. A Generic Approach for Calculating andVisualizing Differences Between Process Models in Multidimensional Process Mining. In Business Process ManagementWorkshops, Fabiana Fournier and Jan Mendling (Eds.). Springer International Publishing, Cham, 383–394.
26
[17] Alfredo Cuzzocrea, Francesco Folino, Massimo Guarascio, and Luigi Pontieri. 2016. A Robust and Versatile Multi-ViewLearning Framework for the Detection of Deviant Business Process Instances. Int. J. Cooperative Inf. Syst. 25, 4 (2016),1–56.
[18] A. Cuzzocrea, F. Folino, M. Guarascio, and L. Pontieri. 2017. Deviance-Aware Discovery of High Quality ProcessModels. In 2017 IEEE 29th International Conference on Tools with Artificial Intelligence (ICTAI). 724–731.
[19] Alfredo Cuzzocrea, Francesco Folino, Massimo Guarascio, and Luigi Pontieri. 2017. Experimenting and Assessing aProbabilistic Business Process Deviance Mining Framework Based on Ensemble Learning. In Enterprise InformationSystems - 19th International Conference, ICEIS 2017, Porto, Portugal, April 26-29, 2017, Revised Selected Papers. 96–124.
[20] Alfredo Cuzzocrea, Francesco Folino, Massimo Guarascio, and Luigi Pontieri. 2017. Extensions, Analysis and Exper-imental Assessment of a Probabilistic Ensemble-learning Framework for Detecting Deviances in Business ProcessInstances. In ICEIS.
[21] Chiara Di Francescomarino, Chiara Ghidini, Fabrizio Maria Maggi, and Fredrik Milani. 2018. Predictive ProcessMonitoring Methods: Which One Suits Me Best?. In Business Process Management - 16th International Conference, BPM2018, Sydney, NSW, Australia, September 9-14, 2018, Proceedings. 462–479.
[22] Thomas G. Dietterich. 2000. Ensemble Methods in Machine Learning. In Proceedings of the First International Workshopon Multiple Classifier Systems (MCS ’00). Springer-Verlag, London, UK, UK, 1–15. http://dl.acm.org/citation.cfm?id=648054.743935
[23] MarlonDumas,Marcello La Rosa, JanMendling, andHajo A. Reijers. 2018. Fundamentals of Business ProcessManagement,Second Edition. Springer.
[24] Jürgen Ebert and Angelika Franzke. 1995. A declarative approach to graph based modeling. In Graph-Theoretic Conceptsin Computer Science, Ernst W. Mayr, Gunther Schmidt, and Gottfried Tinhofer (Eds.). Springer Berlin Heidelberg, Berlin,Heidelberg, 38–50.
[25] Martin Ester, Hans-Peter Kriegel, Jörg Sander, and Xiaowei Xu. 1996. A Density-based Algorithm for DiscoveringClusters a Density-based Algorithm for Discovering Clusters in Large Spatial Databases with Noise. In Proceedingsof the Second International Conference on Knowledge Discovery and Data Mining (KDD’96). AAAI Press, 226–231.http://dl.acm.org/citation.cfm?id=3001460.3001507
[26] F. Folino, G. Folino, and L. Pontieri. 2018. An Ensemble-Based P2P Framework for the Detection of Deviant BusinessProcess Instances. In 2018 International Conference on High Performance Computing Simulation (HPCS). 122–129.
[27] Francesco Folino, Massimo Guarascio, and Luigi Pontieri. 2017. A Descriptive Clustering Approach to the Analysis ofQuantitative Business-process Deviances. In Proceedings of the Symposium on Applied Computing (SAC ’17). ACM, NewYork, NY, USA, 765–770. https://doi.org/10.1145/3019612.3019660
[28] Bernhard Ganter and Rudolf Wille. 1997. Formal Concept Analysis: Mathematical Foundations (1st ed.). Springer-Verlag,Berlin, Heidelberg.
[29] Leilani H. Gilpin, David Bau, Ben Z. Yuan, Ayesha Bajwa, Michael Specter, and Lalana Kagal. 2018. Explaining Explana-tions: An Approach to Evaluating Interpretability of Machine Learning. CoRR abs/1806.00069 (2018). arXiv:1806.00069http://arxiv.org/abs/1806.00069
[30] Jens Gulden. 2017. Visually Comparing Process Dynamics with Rhythm-Eye Views. In Business Process ManagementWorkshops, Marlon Dumas and Marcelo Fantinato (Eds.). Springer International Publishing, Cham, 474–485.
[31] Christian W. Günther and Wil M. P. van der Aalst. 2007. Fuzzy Mining – Adaptive Process Simplification Based onMulti-perspective Metrics. In Business Process Management, Gustavo Alonso, Peter Dadam, and Michael Rosemann(Eds.). Springer Berlin Heidelberg, Berlin, Heidelberg, 328–343.
[32] Michael Gusenbauer. 2019. Google Scholar to overshadow them all? Comparing the sizes of 12 academic search enginesand bibliographic databases. Scientometrics 118, 1 (01 Jan 2019), 177–214.
[33] Mark Hall, Eibe Frank, Geoffrey Holmes, Bernhard Pfahringer, Peter Reutemann, and Ian H. Witten. 2009. The WEKAData Mining Software: An Update. SIGKDD Explor. Newsl. 11, 1 (Nov. 2009), 10–18. https://doi.org/10.1145/1656274.1656278
[34] Markus Hofmann and Ralf Klinkenberg. 2013. RapidMiner: Data Mining Use Cases and Business Analytics Applications.Chapman & Hall/CRC.
[35] R. P. Jagadeesh Chandra Bose and Wil M. P. van der Aalst. 2009. Abstractions in Process Mining: A Taxonomy ofPatterns. In Business Process Management, Umeshwar Dayal, Johann Eder, Jana Koehler, and Hajo A. Reijers (Eds.).Springer Berlin Heidelberg, Berlin, Heidelberg, 159–175.
[36] B. Kitchenham and S Charters. 2007. Guidelines for performing Systematic Literature Reviews in Software Engineering.[37] Simone Kriglstein, Günter Wallner, and Stefanie Rinderle-Ma. 2013. A Visualization Approach for Difference Analysis
of Process Models and Instance Traffic. In Business Process Management, Florian Daniel, Jianmin Wang, and BarbaraWeber (Eds.). Springer Berlin Heidelberg, Berlin, Heidelberg, 219–226.
[38] Marcello La Rosa, Hajo A. Reijers, Wil M.P. van der Aalst, Remco M. Dijkman, Jan Mendling, Marlon Dumas, andLuciano García-Bañuelos. 2011. APROMORE. Expert Syst. Appl. 38, 6 (June 2011), 7029–7040. https://doi.org/10.1016/j.
27
eswa.2010.12.012[39] Wilburt Juan Labio and Hector Garcia-molina. 1996. Efficient Snapshot Differential Algorithms for Data Warehousing.
In In Proceedings of the International Conference on Very Large Data Bases. 63–74.[40] Geetika T. Lakshmanan, Szabolcs Rozsnyai, and Fei Wang. 2013. Investigating Clinical Care Pathways Correlated with
Outcomes. In Proceedings of the 11th International Conference on Business Process Management (BPM’13). Springer-Verlag,Berlin, Heidelberg, 323–338. https://doi.org/10.1007/978-3-642-40176-3_27
[41] C. Li, M. Reichert, and A. Wombacher. 2008. Mining Process Variants: Goals and Issues. In 2008 IEEE InternationalConference on Services Computing, Vol. 2. 573–576. https://doi.org/10.1109/SCC.2008.103
[42] Thomas M. Mitchell. 1997. Machine Learning (1 ed.). McGraw-Hill, Inc., New York, NY, USA.[43] T. Murata. 1989. Petri Nets: Properties, Analysis and Applications. Proc. IEEE 77, 4 (April 1989), 541–574.[44] Kevin P. Murphy. 2012. Machine Learning: A Probabilistic Perspective. The MIT Press.[45] A. E. Márquez-Chamorro, M. Resinas, and A. Ruiz-Cortés. 2018. Predictive Monitoring of Business Processes: A Survey.
IEEE Transactions on Services Computing 11, 6 (Nov 2018), 962–977.[46] Hoang Nguyen, Marlon Dumas, Marcello La Rosa, Fabrizio Maria Maggi, and Suriadi Suriadi. 2016. Business Process
DevianceMining: Review and Evaluation. CoRR abs/1608.08252 (2016). arXiv:1608.08252 http://arxiv.org/abs/1608.08252[47] Hoang Huy Nguyen, Marlon Dumas, Marcello La Rosa, and Arthur H.M. ter Hofstede. 2018. Multi-Perspective
Comparison of Business Process Variants Based on Event Logs (Extended Paper). (April 2018). https://eprints.qut.edu.au/117962/
[48] Mogens Nielsen, Gordon D. Plotkin, and Glynn Winskel. 1981. Petri Nets, Event Structures and Domains, Part I. Theor.Comput. Sci. 13 (1981), 85–108.
[49] Andrew Partington, MoeWynn, Suriadi Suriadi, Chun Ouyang, and Jonathan Karnon. 2015. Process Mining for ClinicalProcesses: A Comparative Analysis of Four Australian Hospitals. ACM Trans. Manage. Inf. Syst. 5, 4, Article 19 (Jan.2015), 18 pages.
[50] A. Pini, R. Brown, and M. T. Wynn. 2015. Process Visualization Techniques for Multi-perspective Process Comparisons.In Asia Pacific Business Process Management, Joonsoo Bae, Suriadi Suriadi, and Lijie Wen (Eds.). Springer InternationalPublishing, Cham, 183–197.
[51] Jonas Poelmans, Guido Dedene, Gerda Verheyden, Herman Van der Mussele, Stijn Viaene, and Edward Peters. 2010.Combining Business Process and Data Discovery Techniques for Analyzing and Improving Integrated Care Pathways.In Advances in Data Mining. Applications and Theoretical Aspects, Petra Perner (Ed.). Springer Berlin Heidelberg, Berlin,Heidelberg, 505–517.
[52] Eindhoven Technical University Process Mining Group. 2019. ProM Framework. http://www.promtools.org/doku.php[53] Marcello La Rosa. 2009. Managing variability in process-aware information systems.[54] Tobias Scheffer. 2001. Finding Association Rules That Trade Support Optimally against Confidence. In Principles
of Data Mining and Knowledge Discovery, Luc De Raedt and Arno Siebes (Eds.). Springer Berlin Heidelberg, Berlin,Heidelberg, 424–435.
[55] Alexander Strehl and Joydeep Ghosh. 2003. Cluster Ensembles — a Knowledge Reuse Framework for CombiningMultiple Partitions. J. Mach. Learn. Res. 3 (March 2003), 583–617. https://doi.org/10.1162/153244303321897735
[56] Chengnian Sun, Jing Du, Ning Chen, Siau-Cheng Khoo, and Ye Yang. 2013. Mining Explicit Rules for Software ProcessEvaluation. In Proceedings of the 2013 International Conference on Software and System Process (ICSSP 2013). ACM, NewYork, NY, USA, 118–125. https://doi.org/10.1145/2486046.2486067
[57] Suriadi Suriadi, Ronny S. Mans, Moe T. Wynn, Andrew Partington, and Jonathan Karnon. 2014. Measuring PatientFlow Variations: A Cross-Organisational Process Mining Approach. In Asia Pacific Business Process Management, ChunOuyang and Jae-Yoon Jung (Eds.). Springer International Publishing, Cham, 43–58.
[58] Suriadi Suriadi, Moe T. Wynn, Chun Ouyang, Arthur H. M. ter Hofstede, and Nienke J. van Dijk. 2013. UnderstandingProcess Behaviours in a Large Insurance Company in Australia: A Case Study. In Advanced Information SystemsEngineering, Camille Salinesi, Moira C. Norrie, and Óscar Pastor (Eds.). Springer Berlin Heidelberg, Berlin, Heidelberg,449–464.
[59] Jo Swinnen, Benoît Depaire, Mieke J. Jans, and Koen Vanhoof. 2012. A Process Deviation Analysis – A Case Study.In Business Process Management Workshops, Florian Daniel, Kamel Barkaoui, and Schahram Dustdar (Eds.). SpringerBerlin Heidelberg, Berlin, Heidelberg, 87–98.
[60] Irene Teinemaa, Marlon Dumas, Marcello La Rosa, and Fabrizio Maria Maggi. 2017. Outcome-Oriented PredictiveProcess Monitoring: Review and Benchmark. CoRR abs/1707.06766 (2017). arXiv:1707.06766
[61] Nick R. T. P. van Beest, Marlon Dumas, Luciano García-Bañuelos, and Marcello La Rosa. 2015. Log Delta Analysis:Interpretable Differencing of Business Process Event Logs. In Business Process Management, Hamid Reza Motahari-Nezhad, Jan Recker, and Matthias Weidlich (Eds.). Springer International Publishing, Cham, 386–405.
[62] Wil van der Aalst. 2016. Process Mining: Data Science in Action (2nd ed.). Springer Publishing Company, Incorporated.
28

[63] W.M.P. van der Aalst, A.H.M. ter Hofstede, B. Kiepuszewski, and A.P. Barros. 2003. Workflow Patterns. Distributedand Parallel Databases 14, 1 (01 Jul 2003), 5–51.
[64] Ilya Verenich, Marlon Dumas, Marcello La Rosa, Fabrizio Maria Maggi, and Irene Teinemaa. 2018. Survey and cross-benchmark comparison of remaining time prediction methods in business process monitoring. CoRR abs/1805.02896(2018).
[65] Barbara Weber, Manfred Reichert, and Stefanie Rinderle-Ma. 2008. Change Patterns and Change Support Features -Enhancing Flexibility in Process-aware Information Systems. Data Knowl. Eng. 66, 3 (Sept. 2008), 438–466.
[66] A Weijters, Wil M. P. Aalst, and Alves A K Medeiros. 2006. Process Mining with the Heuristics Miner-algorithm. Vol. 166.[67] D. H. Wolpert and W. G. Macready. 1997. No Free Lunch Theorems for Optimization. Trans. Evol. Comp 1, 1 (April
1997), 67–82. https://doi.org/10.1109/4235.585893[68] M.T. Wynn, E. Poppe, J. Xu, A.H.M. ter Hofstede, R. Brown, A. Pini, and W.M.P. van der Aalst. 2017. ProcessProfiler3D:
A visualisation framework for log-based process performance comparison. Decision Support Systems 100 (2017), 93 –108. Smart Business Process Management.
[69] Harry Zhang, Liangxiao Jiang, and Jiang Su. 2005. Hidden Naive Bayes. In Proceedings of the 20th National Conference onArtificial Intelligence - Volume 2 (AAAI’05). AAAI Press, 919–924. http://dl.acm.org/citation.cfm?id=1619410.1619480
29


![Untitled-1 [] · CHOCOMILO; Bouillon - MAGGI CUBE, MAGGI CHICKEN, MAGGI CRAYFISH, MAGGI MIX'PY; and table water ... and marketing company](https://img.pdfslide.us/doc/110x75/5aedc9577f8b9a6625906f43/untitled-1-bouillon-maggi-cube-maggi-chicken-maggi-crayfish-maggi-mixpy.jpg)