Embed Size (px)
Citation preview

Fanglin Yang
IMSG -- Environmental Model CenterNCEP/NWS/NOAA
World Weather Open Science ConferenceAugust 16 - 21, 2014, Montréal, Québec, Canada
Sensitivity of NCEP GFS Forecast of Hurricane Sandy to Model Configuration
and Supplemental Radiosondes
Acknowledgment: I’d like to thank Kate Howard for preparing supplementary radiosonde data and for running part of the data denial experiment, John Derber for guiding the data denial experiment, Jiayi Peng for making ensemble track verification, and Shrinivas Moorthi and
Jongil Han for helpful discussion.

Topics
1. A Few Facts about Hurricane Sandy
2. Forecasts of Hurricane Sandy by Major International NWP Models and NCEP Global Ensemble Forecast Systems
3. Impact of Supplementary Radiosondes on NCEP GFS’s Forecasts of Hurricane Sandy
4. Sensitivity of GFS Forecasts to Physics Parameterizations, Boundary Condition, and Model Resolution etc.
5. Discussion
2
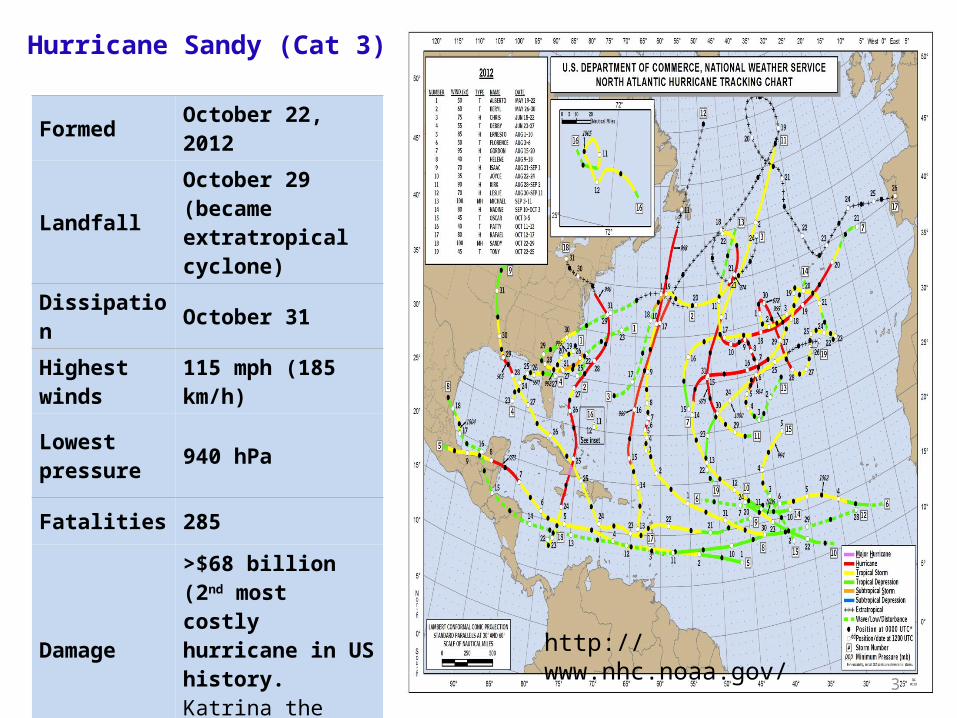
Hurricane Sandy (Cat 3)
Formed October 22, 2012
Landfall October 29 (became extratropical cyclone)
Dissipation October 31
Highest winds 115 mph (185 km/h)
Lowest pressure 940 hPa
Fatalities 285
Damage>$68 billion (2nd most costly hurricane in US history. Katrina the 1st)
http://www.nhc.noaa.gov/
3

Destruction By Sandy
Sandy caused storm surge along the entire east coast of the United States. The highest storm surge measured in New York reached 12.65 ft.
David Roth, WPC tropical cyclone rainfall data
New Jersey Pier
Statue Of Liberty In Hurricane Sandy Nadine DeNinno
4

Forecasts of Hurricane Sandy by
Major High-Res Deterministic NWP Models and
NCEP Global Ensemble Forecast Systems (GEFS)
5

Sandy Mean Track Errors by Deterministic NWP Models
GFS
ECMWF
Forecast Hour
• GFS and ECMWF both made very good forecast for lead time shorter than 72 hours.
• GFS forecast was much worse than ECMWF forecast for leads longer than 72 hours.
6
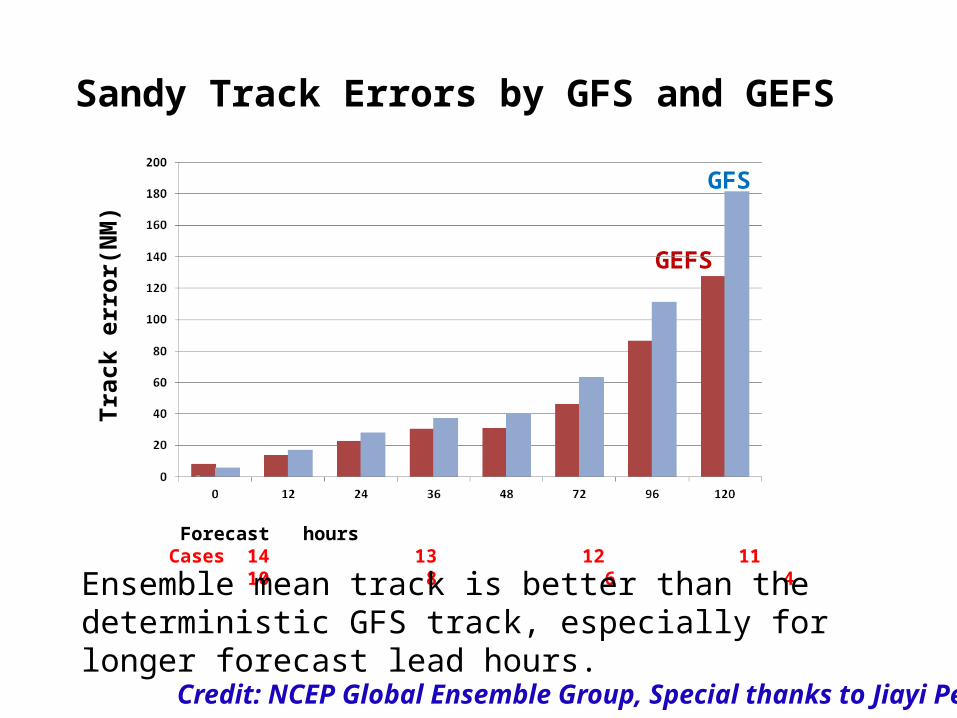
Sandy Track Errors by GFS and GEFSTr
ack
erro
r(N
M)
Forecast hoursCases 14 13 12 11 10 8 6 4
GFS
GEFS
Ensemble mean track is better than the deterministic GFS track, especially for longer forecast lead hours.
Credit: NCEP Global Ensemble Group, Special thanks to Jiayi Peng

6 days Before Landfall, 20121023 00Z Cycle
GFS
ECMWF
ECMWF predicted almost 6 days in advance that Sandy would turn northwest and hit US east coast, while GFS predicted Sandy would keep move northeastward. 8
GEFS mean track is similar to the deterministic GFS track, moving the storm northeastward. A few ensemble members followed the observed track.
Deterministic Ensemble GEFS
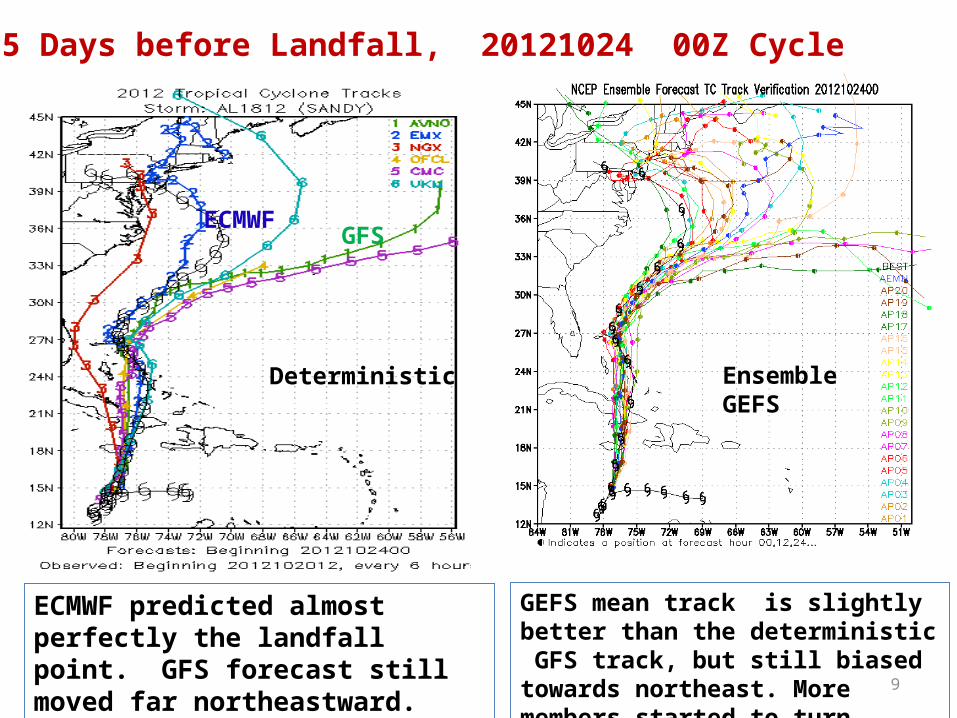
5 Days before Landfall, 20121024 00Z Cycle
GFSECMWF
ECMWF predicted almost perfectly the landfall point. GFS forecast still moved far northeastward.
9
GEFS mean track is slightly better than the deterministic GFS track, but still biased towards northeast. More members started to turn northwestward.
Deterministic Ensemble GEFS

4 Days before Landfall, 20121025 00Z Cycle
ECMWF forecast was too close to the coast and shifted to the south. GFS forecast was still too far east and north.
GFSECMWF
10
GEFS mean track was better than the deterministic GFS track.
Deterministic Ensemble GEFS

3 Days before Landfall, 20121026 00Z Cycle
ECMWF and CMC both made very good forecasts. GFS predicted a landfall in New York, too far north. 11
GEFS was slightly better than GFS, although both predicted a landfall in New York, too far north.
GFSECMWF
Deterministic
Ensemble GEFS

2 days before Landfall, 20121027 00Z Cycle
The solutions from all models started to converge, although ECMWF biased to the south and GFS biased to the north. 12
GFSECMWF
Deterministic
Ensemble GEFS
Solutions from all members also started to converge. GEFS mean track was better than the deterministic GFS track.

One Day before Landfall, 20121028 00Z Cycle
All models predicted a landfall in New Jersey.
13
GEFS was slightly worse than the GFS, biased toward the north.
GFSECMWF
Deterministic
Ensemble GEFS

GFS and ECMWF Analyses for 00Z 29Oct2012
GFS and ECMWF 6-day Forecasts valid at 00Z 29Oct2012
Upstream trough predicted by the GFS is too shallow compared to both analyses and ECMWF forecast. GFS northeast flow in front of the trough steered the storm off the coast.

• GFS and ECMWF both made very good forecast for lead time shorter than 72 hours.
• GFS forecast was much worse than ECMWF forecast for lead time longer than 72 hours.
• The mid-latitude trough predicted by GFS 6 days in advance is too shallow compared to analyses and ECMWF forecast.
• Ensemble mean track is better than the deterministic GFS track, especially for longer forecast lead hours.
15

Impact of 06 and 18UTC Radiosondes on GFS Forecasts of
Hurricane Sandy
16

Experimental Design
• Radiosondes were launched at 06Z and 18Z at all CONUS stations during the period 18Z 25 Oct 2012 through 12Z 30 Oct 2012
• The supplemental radiosondes were assimilated in the operational GDAS/GFS 06 and 18Z cycles
• A data denial experiment was carried out using the operational configuration of the NCEP GDAS/GFS:– Excluding the 06 and 18Z CONUS radiosonde data – Initialized using the operational GFS initial conditions at 18Z 25 Oct 2012 – Last cycle executed was 12Z 30Oct2012 – Fully cycled with data assimilation
17

Supplemental Data Ingested by GDAS/GFS
24-0
6
24-1
8
25-0
6
25-1
8
26-0
6
26-1
8
27-0
6
27-1
8
28-0
6
28-1
8
29-0
6
29-1
8
30-0
6
30-1
8
31-0
6
31-1
80
10
20
30
40
50
60
70
80
Counts of Off-Time CONUS Radiosonde Soundings
GFS GDAS
Day in October 2012 - Cycle
Soun
ding
Cou
nts
Total Count: GFS 615 GDAS 617
By Kate Howard

19
Supplementary Radiosondes data made no significant impact on mean track error statistics

20
Without the supplementary Radiosondes intensity forecast appeared to be slightly worse

Forecasts of 24-hr rainfall accumulation ending at 12Z 30Oct2012 from different cycles
and
forecasts of tracks from the corresponding cycles
21

2012102600 cycle
22
Without the supplementary radiosondes, the experiment prsandy has even larger track errors than the operational GFS. The extra data did help the forecast !

2012102606 cycle
23The extra data did help the forecast !

2012102612 cycle
24The extra radiosondes did not help much.

2012102700 cycle
25The extra radiosondes did not make any impact
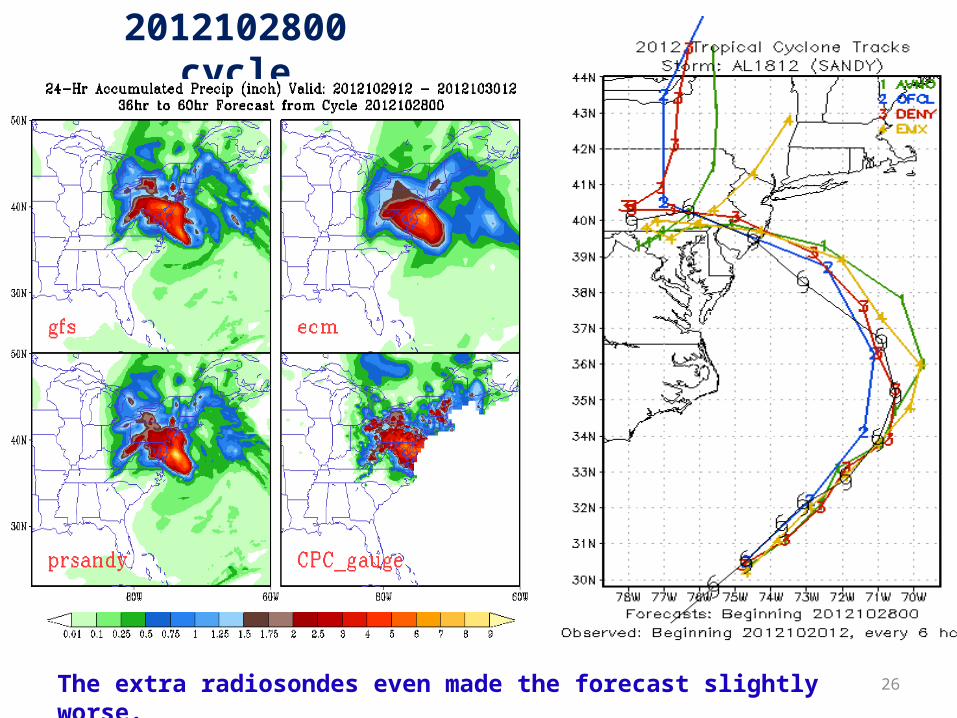
2012102800 cycle
26The extra radiosondes even made the forecast slightly worse.
Supplementary radiosondes were launched at 06Z and 18Z at all CONUS stations during the period 18Z 25 Oct 2012 through 12Z 30 Oct 2012. The results of these experiments did not show a statistically significant impact of supplementary radiosondes on the quality of the model forecasts. The first few forecasts were slightly improved by the addition of the radiosondes, but after that, both degradation and improvement were noted, giving the overall neutral results. This lack of a significant impact from the additional radiosondes may have resulted from several factors, including:
1. the additional radiosondes were only launched once agreement was beginning to occur among the forecasts from different models,
2. the mid-latitude blocking system was already well established in the assimilation system,
3. the location of the additional radiosondes (upstream of the storm).
The GFS long-lead forecast might have been further improved should more supplementary radiosondes have been launched a few days earlier and placed in the upstream locations.
27

Sensitivity of GFS Forecasts of Hurricane Sandy to Model Resolution, SST and Physical
Parameterizations etc
Note: the sameT574 operational GFS analyses were used to initialize all experiments.
28

T574L64 (~23km): Sensitivity to SST and Physics
29
prsandy574b: use observed SST instead of relaxed SSTsprsandy574c: use RAS convection scheme
Using observed SST and switching convection from SAS to RAS did not affect track forecast !
Using real-time SST slightly improved track.
Obs Ops GFS
Obs SST
RAS

Sensitivity to Model Resolution and Dynamics
30
prsandy878: operational GFS, rerun at T878 Eulerian resolution 9~15km)prsandy1534: T1534 semi-lag GFS (~13km)prsandy1534b: T1534 semi-lag GFS, radiation dt=450s instead of 3600sprsandy1534c: T1534 semi-lag GFS, use obs SST instead of relaxed SSTs
Obs
Ops GFS
T878 GFST1534 SL-GFS
T1534 SL-GFSobs SST
Increasing model resolution did not improve track forecast !

31
Large difference in initial conditions between EMCWF and GFS was found over the central northern Pacific region.
Needs to improved analyses in this region?
Differences of 500-hPa Height between GFS and ECMWF

Summary and Discussion
• GFS and ECMWF both made very good forecast for lead time shorter than 72 hours. GFS forecast was much worse than ECMWF forecast for lead time longer than 72 hours. The mid-latitude trough predicted by GFS 6 days in advance was much shallower than analyses and ECMWF forecast. The study suggests that errors in mid-latitude large-scale flow steered the GFS track off the coast.
• Supplementary radiosondes were launched at 06Z and 18Z for 25-30 Oct 2012. Data denial experiments indicate that the extra sonde data did not show a statistically significant impact on the quality of the model forecasts. It is argued that more supplementary radiosondes should have been launched a few days earlier and placed in the upstream locations.
• Sensitivity experiments showed that using observed real-time SST, switching physical parameterizations and increasing model horizontal resolution did not improve GFS forecast of Sandy path.
• It remains to be understood why GFS failed to forecast Sandy path one week before the landfall while ECMWF was successful. Bias in mid-latitude large-scale flow is likely the key factor. Cycled T1534 GFS experiment is underway to test the sensitivity to initial conditions.

Extra slides
33
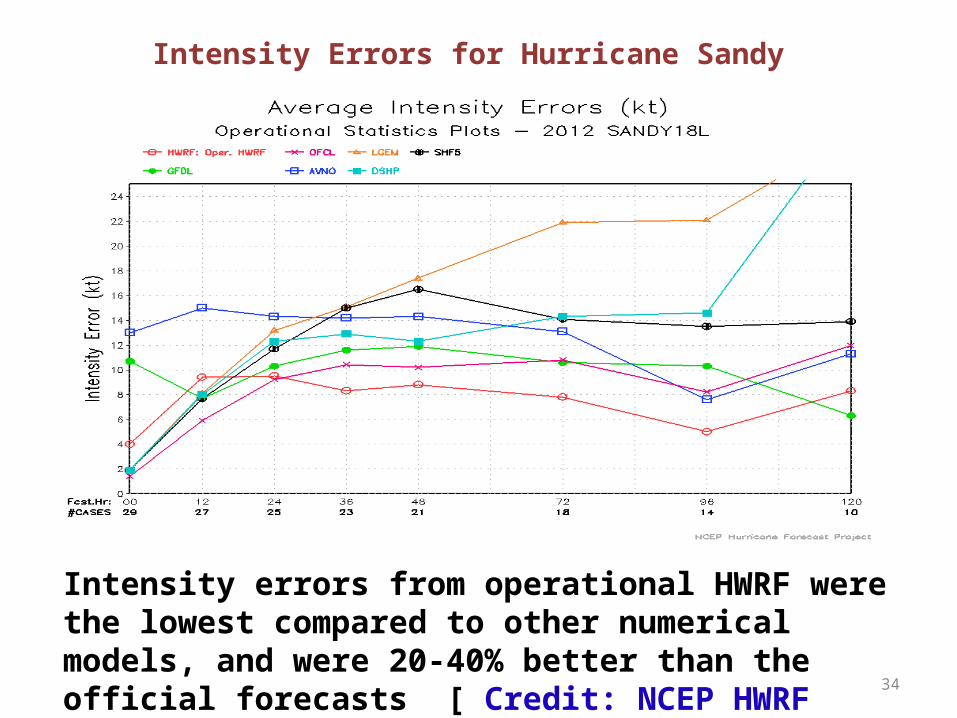
Intensity Errors for Hurricane Sandy
34
Intensity errors from operational HWRF were the lowest compared to other numerical models, and were 20-40% better than the official forecasts [ Credit: NCEP HWRF Group]