Embed Size (px)
Citation preview
1
Family structure and poverty in the UK:
An evidence and policy review
Report to Joseph Rowntree Foundation
Martin Culliney, Tina Haux and Stephen McKay
University of Lincoln
April 2014
2
Contents 1 Introduction .......................................................................................................... 5
1.1 Background to this report .............................................................................. 5
1.2 Research on family structures and poverty ................................................... 6
2 Methodology and definitions ................................................................................ 8
2.1 Methodology .................................................................................................. 8
2.2 Definitions ...................................................................................................... 9
2.2.1 The ‘two-person’ definition of family ........................................................ 9
2.2.2 Diverse family structures ....................................................................... 10
2.2.3 Measuring poverty ................................................................................ 12
2.2.4 Equivalence scales ............................................................................... 13
3 Families and poverty ......................................................................................... 16
3.1 Introduction .................................................................................................. 16
3.2 Who is in poverty now? ............................................................................... 17
3.2.1 Same-sex couples and employment ..................................................... 20
3.2.2 Children in low income groups .............................................................. 22
3.2.3 Material deprivation ............................................................................... 23
3.3 Trends over time .......................................................................................... 25
3.4 Child poverty across the EU and OECD ...................................................... 28
3.5 Insights from a meeting organised by the Poverty Alliance with people
experiencing poverty ............................................................................................. 31
4 Policies that affect the links between family structure and poverty .................... 34
4.1 Introduction: ................................................................................................. 34
4.2 Incentivising particular family forms ............................................................. 35
4.3 The rise of behavioural policies - Conditional cash transfers ....................... 38
4.3.1 CCTs: international examples ............................................................... 39
4.4 Child maintenance ....................................................................................... 41
4.4.1 The (in)effectiveness of child maintenance in Britain ............................ 41
4.4.2 The effectiveness of child maintenance in reducing poverty – lessons
from other countries........................................................................................... 44
4.5 Moving (lone) parents into and supporting employment .............................. 47
4.5.1 In-work poverty and in-work benefits .................................................... 52
5 Conclusions ....................................................................................................... 54
References ............................................................................................................... 57

3
List of Tables
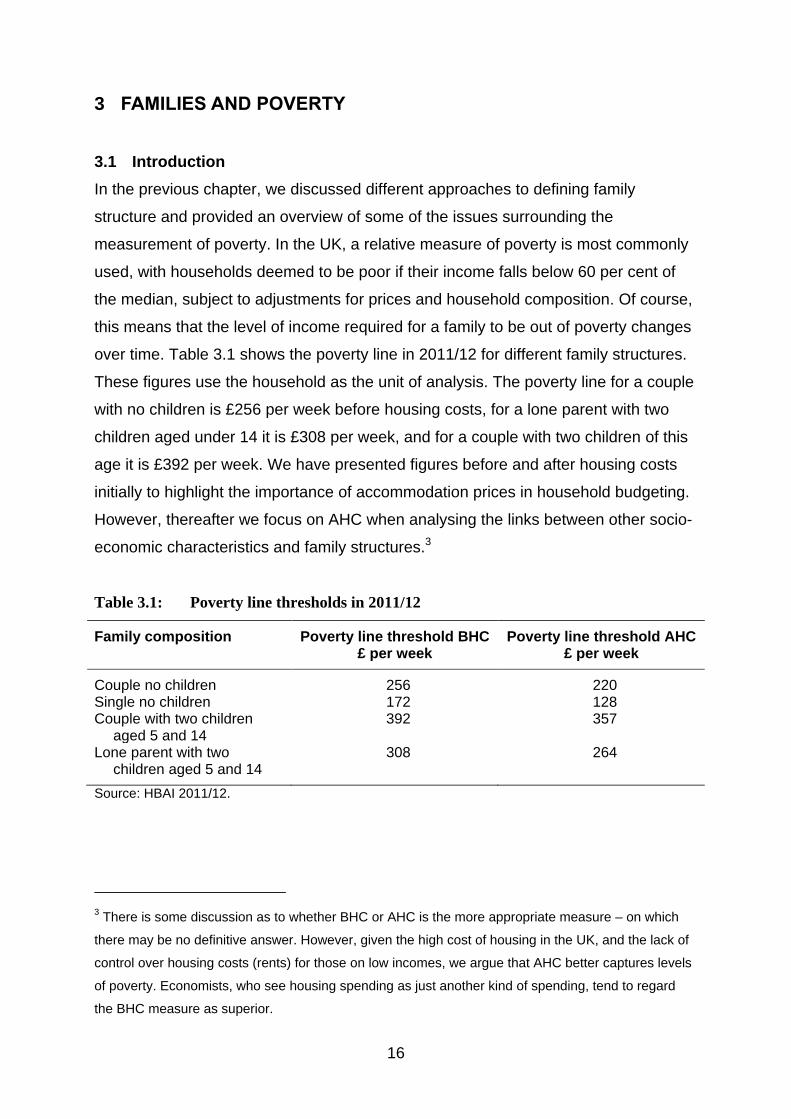
Table 3.1: Poverty line thresholds in 2011/12 ........................................................ 16
Table 3.2 Quintile distribution of income for individuals by various family and
household characteristics, United Kingdom (before housing costs) .................. 18
Table 3.3 Quintile distribution of income for individuals by various family and
household characteristics, United Kingdom (after housing costs) ..................... 19
Table 4.1: Examples of large-scale cash transfer programmes in operation ............ 39
Table 4.2 Employment requirements of lone parents in OECD countries ............. 48
List of Figures
Figure 3.1 Poverty risk by family type, over time. ................................................... 26
Figure 3.2 Composition of people in low income households, by family type......... 27

4
5
1 INTRODUCTION
1.1 Background to this report
This report, commissioned by the Joseph Rowntree Foundation as part of devising its
anti-poverty strategy for the UK, reviews the evidence around the relationship
between family structure and poverty. This Chapter outlines the background to the
review while Chapter 2 discusses the definitions used and the methodology adopted.
Chapter 3 looks at the risks of different types of families being in poverty in the UK.
Chapter 4 considers policies, which can affect the relationship between family
structure and policy, and Chapter 5 concludes. The remit of this review was to supply
an account of poverty in the UK, but we also draw on international evidence to
enable illuminating comparisons and to highlight possibilities for good practice that
could inform domestic policy.
This review has been carried out at the same time as several others, each exploring
the links between poverty and topics that are closely related. These include gender,
employment, childcare, demography and relationships. Where possible, we have
drawn on the findings of these reviews. The various aspects of family structure and
poverty have been the subject of much research (for example, Holtermann et al.
1999, Millar and Ridge 2001 and Haux 2013). To avoid overlap and duplication the
empirical focus is on the past 15 years. The policy areas selected for this review
have been chosen on the basis that they directly affect family structure and poverty.
These include policies such as child maintenance and married couples tax
allowances. However, we have not discussed aspects such as childcare availability
and costs in any details, as whilst this is clearly relevant, this area is covered in a
separate review. Where possible, cross-reference has been made to other reviews
conducted alongside this one.
Hence, the aims of this review are as follows:
To identify the relationship between the different family structures and the
experiences of poverty based on secondary data analysis.

6
To review policy interventions for ameliorating the experience of poverty in the
UK and internationally and establish the efficacy and, where possible, the
cost-effectiveness of these interventions.
To identify the precise role, impact and potential of poverty interventions within
a wider anti-poverty agenda and under conditions of ‘austerity’.
To identify examples of policy transfer and place them in the context of the
wider anti-poverty agenda.
To identify gaps in the evidence base.
1.2 Research on family structures and poverty
Families have long been the subject of sociological research. Feminist and Marxist
researchers have highlighted the imbalance of power between men and women, and
between those with different levels of material resources, both in the private and the
public sphere. Since then family research has increasingly explored other aspects
such as emphasising the relational rather than biological bonds, e.g. by looking at
families of choice, intimacy, personal lives and friendships and the effect of
individualisation on the formation, nature and duration of relationships. Other topics
and approaches in current family sociology focus on the different experiences of
childhood, the possibility and challenges of reproductive technologies and the
interlinking of globalisation and migration on intimate relationships and families (see
Chambers, 2012).
The links between family structures and poverty in the UK are well established. The
most recent release of the Households Below Average Income (HBAI) statistics
confirms the persistence of strong correlations between family structures and relative
income poverty in the UK (DWP 2013a). According to the latest HBAI figures for
2011/12 (DWP 2013a), families particularly at risk of poverty in Britain include lone
parent families, workless households (plus those with only one adult in paid work)
and those with three or more children.
Numerous factors have been shown to mediate the connection between family
structure and poverty. For example, the links between family structures, poverty and
gender are also well researched (for example, Scott 2008) and are particularly
evident with regard to lone parent families, the vast majority of whom are headed by
7
women (ONS 2012). Interlinked with family structures and poverty is the level of
economic activity of the adults in the households, with the poverty risk declining as
the number of adults in (full-time) employment in the family increases (DWP 2013a).
At the same time, the nature and extent of these links is continually changing as a
result of broader demographic, socio-economic and policy developments (see
Falkingham et al. forthcoming).
A range of theories has been put forward to explain the links between family
structures and poverty. These can be divided into three groups: individual/
pathological, cultural or structural/institutional, or a combination of the above (see
Corlyon et al., forthcoming). For example, some of these theories highlight the
importance of (local/intergenerational) culture and values, which in turn form an
‘underclass’ while others emphasise the importance of rational, economic decisions
in responding to the incentive structures of tax and benefit systems (see also
Harkness et al. 2012). A number of studies have explored the concept of
intergenerational transmission of poverty (Hirsch, 2008; Shildrick et al., 2013) and
suggested that there is no evidence of it on the ground (in the strongest formulation
of intergenerational worklessness across multiple generations). However there are
still important correlations between hat poverty and insecurity between generations of
the same family. Yet, a recent review of the evidence on the causal link between
family structures and poverty based predominantly on evidence from the US and the
UK and from within the field of economics (Stafford and Roberts 2009), suggested
that a conclusive, causal link between family structures and poverty could not be
established and instead differences in the socio-economic characteristics of the
(potential) family members played a substantial role (see also Bhrolcháin and Sigle-
Rushton 2005; Bhrolcháin et al. 2002; Crawford et al. 2011).

8
2 METHODOLOGY AND DEFINITIONS
2.1 Methodology
This report is based on a review of current evidence on family structure and poverty,
which is supplemented by original research. We conducted a literature search based
on the usual steps of identifying, evaluating, synthesising and extracting information
from a wide range of sources. Members of the project team took responsibility for
individual policy areas and we used the reference organiser software Mendeley to
build a literature base, check for duplication and identify key papers. Additional
analyses of survey data are also provided and information from a focus group of
people with experience of living in poverty, to fill gaps in the literature. The
quantitative data analysis included in this report is facilitated by our extensive
experience of interrogating high quality secondary datasets. We focus on key results,
rather than providing more in-depth analysis – as seems appropriate within a project
based around reviewing the extant literature.
The following data sources are used for the secondary analysis:
The Family Resources Survey (DWP, NatCen, ONS 2013) is the main
government-led vehicle for measuring people’s incomes and benefits. It is
conducted annually, with a sample size of around 24,000 households (though
was somewhat larger until 2011/12). Data on higher incomes from outside the
survey, using a consistent set of processes, are used to generate statistics on
the proportions of the population on lower incomes. This data is presented in
the annual Households Below Average Income reports (DWP 2013a).
The Annual Population Survey (ONS 2014) is a large cross-sectional survey of
the UK population, which also takes place on a rolling basis. It is most useful
for looking at small sub-groups, who are generally only found in small numbers
in most surveys – such as civil partnerships, larger families and members of
some ethnic minority groups.
Finally, the Poverty Alliance organised a focus group of people with experience of
living in poverty in Scotland in November 2013 in connection with JRF and this
project. The researchers explored a broad range of issues relating the experience of
poverty, aiming to draw out the most important challenges for policy-makers to
address.

9
2.2 Definitions
2.2.1 The ‘two-person’ definition of family
A number of definitions of ‘family’ are possible for this report. According to Bruce and
Yearly (2006: 103), ‘At its simplest the family is an intimate domestic group of people
related to each other by blood and legal ties and social relations, in which adults are
responsible for the care and raising of their children (natural or adopted)’. The Office
for National Statistics (ONS) (2012) defines a family as either a couple - married,
cohabiting or in a civil partnership, with or without children - or a lone parent with one
or more children, dependent or non-dependent. The ONS definition is similar to that
used by the US Census Bureau (2011), which regards as a family any household in
which two or more people related by blood, marriage or adoption are residing.
According to the US Census definition, families do not necessarily include children
and couples do not need to be married, but the individuals concerned must live at the
same address. However, as is the case for the other definitions mentioned above,
singles living alone do not count as families. This is an important principled exclusion.
However, we should acknowledge that there is an increasing number of UK people
living in single adult households (ONS 2013:2):
“The proportion of adults living alone almost doubled between 1973 and 2011 (9% and 16%), with the increase occurring in the first thirty years (between 1973 and 1998). … The increase in single adult households has been among adults aged 25-44 – adults in this age group were five times more likely to live alone in 2011 (10%) than in 1973 (2%), again this increase occurred between 1973 and 1998 and then remained stable.”
For the purpose of this report we have decided to adopt a ‘two-person’ definition, in
that families are defined as households comprising at least two people who are either
related by blood, marriage or civil partnership, or in a cohabiting relationship. A
household in which one or more dependent children live with a lone adult is classed
as a family under this definition. Therefore, couples without children, including same
sex couples, and lone-parents with children are all counted as families. As such our
usage is in line with that of the US Census Bureau and ONS, as outlined above.
Much academic research in the UK implicitly uses the presence of children as a
criterion for being classed as a family, yet does nothing to interrogate or even discuss
the definition itself. We include couples without children in our working definition.

10
ONS (2012) figures suggest an increase in this type of family over recent years, and
including such families creates greater scope for comparisons with other types of
family structure. This will help to develop a more comprehensive account of the
relationship between poverty and the many different family structures of today. As
outlined in Falkingham et al.’s review, family structures are often dynamic, with rates
of partnership dissolution mostly rising over time – albeit with perhaps a reduction in
the youngest cohorts.
2.2.2 Diverse family structures
Before discussing the measurement of poverty, we want to acknowledge the
increasingly diverse family structures found in the UK today. As far back as 1989,
eight per cent of live births were to women who had been married previously (De’Ath
1994:94). Within five years of separation and divorce, up to half of parents will have
remarried. This results in a range of different care arrangements, some of which can
lead to children effectively being members of two households (De’Ath 1994:93). It
follows that categorising families according to adult relationship history is increasingly
complex. While the majority of data presented in this report draws on the annual
HBAI survey, which does not distinguish (in its published reports) between the
manifold family formations created by breakups and subsequent relationships, formal
or informal, it is worth providing a brief overview of some family structures that remain
in the minority but are growing in number.
One of the fastest growing family types in Britain is the stepfamily (Ferri and Smith
1997, Beaumont 2011). In 2007, 86 per cent of stepfamilies comprised a mother and
stepfather, ten per cent were formed of a natural father and stepmother, while four
per cent consisted of two adults both of whom had stepchildren living with them
(ONS 2010). Ermisch and Francesconi (2000) found that around 30 per cent of
mothers would spend time in a stepfamily before the age of 45. As research rarely
focuses on this type of family, analysis of the likelihood of them being in poverty is
scarce. Collishaw et al. (2007: 2581) used longitudinal data from 1974, 1986 and
1999 to argue that fewer stepfamilies were in deprived socioeconomic circumstances
than single parent families. They also found that the proportion of stepfamilies on low
incomes, the main measure of poverty used in existing studies and throughout this
report, were only slightly lower than for ‘intact’ families. This is unsurprising as it

11
echoes one of the main messages emerging from this review: that families with two
adults are rather less likely to be poor than lone parent families.
Extended families and children living with grandparents as opposed to their mother or
father are relatively uncommon overall but their frequency varies according to
ethnicity. More than one quarter of Indian families live with their children’s paternal
grandparents (Grandparents Plus 2009:34), and over 30 per cent of Indian
grandparents live in a multigenerational household (Griggs 2010:4). One in ten black
Caribbean families live with their maternal grandparents (Grandparents Plus
2009:34). Analysis of the Millennium Cohort Survey revealed that in 6.2 per cent of
UK families, a grandparent was residing in the household. This rose to 18.6 per cent
in wards with high minority ethnic populations. Grandparents were also more likely to
live with families in disadvantaged wards than in advantaged wards, whether this is
the family residing with the grandparent or the other way round (Dex and Hawkes
2004:25). Again this demonstrates how significant complexity is uncovered by
looking beyond typologies defining families solely by the number of adults and
children present. Adult working class women are twice as likely to be grandmothers
compared to middle class counterparts. The proportion of all grandparents with
grandchildren aged under 16 and living on a very low household income grew by a
third from 1998 (18%) to 2007 (26%), so grandparents are becoming poorer (Griggs
2009:10-11).
Another important issue is the role grandparents play in supplying informal childcare
and therefore enabling mothers to work. Some 20 per cent of mothers with children
aged under four years, who also have mothers, work full-time compared with six per
cent of those without mothers. This rises to 25 per cent and 16 per cent where
children are under 13 (Griggs 2009:16). However, this still does not tell us about the
incidence of poverty among those who are living in extended family households, or
acting as primary carers for grandchildren. Previous research does not provide
answers to these questions.
We use HBAI data for the detailed information it provides on poverty in relation to
family structure, as per the project brief. A major limitation of this source is that
families are defined by the number of adults and children, without further

12
consideration of the precise nature of these relationships (in the published reports).
However, we felt it necessary at this stage to show recognition that family structures
are more variable than simple counts of adults and children might suggest.
2.2.3 Measuring poverty
We assume that many readers will be familiar with the measurement and calculation
of poverty in the UK, so we provide only a brief recap. Fuller details are available in
the annual publications of DWP (2013a), and in the external commentaries that are
regularly produced (including by JRF itself, for example MacInnes et al. 2013). The
Joseph Rowntree Foundation defines poverty as when a person’s resources (mainly
their material resources) are not sufficient to meet their minimum needs (including
social participation). Measuring resources and needs can be complex, so income is
normally used as a proxy.
Poverty in the UK context is generally measured by individuals living in a household
with an income below 60 per cent of median equivalised income. This measure is
used by the annual government Households Below Average Incomes (HBAI) report
and is known as relative poverty, as the threshold for being classed as poor is set
according to the midpoint of incomes in the population overall1. While there are
problems with this income-based definition, it is one useful indicator, especially when
comparing different countries.
The Child Poverty Act 2010 also introduced three other measures:
1 The HBAI is based on the OECD equivalent scales and the series adjusts for Retail Price Index
(RPI), despite benefits now being indexed to Consumer Price Index (CPI) in the welfare reforms
implemented in 2010-11 (DWP, 2013a).The RPI measure of inflation is retained to allow for continued
comparisons with data from previous years, when RPI was also used, as opposed to switching to CPI
which would make retrospective and longitudinal analysis more difficult (DWP 2013a:15).

13
Combined low income and material deprivation2: children who experience
material deprivation, defined as lacking the basic goods and services needed, and
living in households with incomes below 70 per cent of median.
Absolute low income: household income below 60 per cent of 2010/11 median
income adjusted for prices.
Persistent poverty: household income below 60 per cent of current median
income for at least three out of the previous four years (HM Government
2012:14).
Updates on how government is performing against those measures are reported
annually by the Social Mobility and Child Poverty Commission (see 2013 report).
A recent government consultation on measuring child poverty was premised on the
putative need to ‘develop a better way of measuring child poverty which reflects the
reality of growing up experiencing poverty in the UK today’ (HM Government
2012:12). Whilst the report from this consultation has been strongly criticised for
confusing measures of poverty with factors that are more like characteristics or
predictors of being poor, and for adducing questionable evidence (see Bradshaw
2013), it does raise questions over whether such emphasis on income produces a
more narrow account that needed. However, the HBAI series also publishes data on
material deprivation, defined as a whether people lack certain goods and services
(which differ for children, working-age adults and pensioners – see DWP 2013a:268-
271, 276-277 for a more detailed discussion), suggesting that the importance of
including other indicators has already been acknowledged.
2.2.4 Equivalence scales
Where measures of poverty rely on income lines, as they generally do in part or
wholly, a judgement must be made about the level of income equating to the poverty
line for families with different numbers of adults and children. If £X implies poverty for
a childless couple, what income level is equivalent for a lone parent with one child, or
2 We also report data from HBAI on ‘severe low income and material deprivation’, referring to
individuals living in households lacking basic goods and services and with income below 50 per cent
of median.

14
a couple with three? This process of comparing incomes is generally known as
‘equivalisation’. The approach of simply taking per capita income (income/persons)
ignores economies of scale in consumption, and differences between different people
(e.g. adults and children).
There are a number of different ways of coming up with values for equivalence
scales. One might consult expert judgement, or survey the views of the general
population. Often equivalence scales are constructed after analysis of patterns of
household spending. In the early work on this topic, families were regarded as having
similar living standards when they spent the same proportions of their incomes on
food. Thus models of food spending were derived, and based on family type (the
Engel approach). An alternative approach sought to compare spending on adult
goods, in families that did and did not contain children (the Rothbart approach). Later
research has turned to looking at the full range of spending, to help measure the
indirect economic concept of utility – though there remain technical limitations
(Deaton 1997).
Current UK publications on poverty and low incomes use the ‘modified OECD’
equivalence scale, in which an adult couple with no dependent children is taken as
the benchmark with an equivalence scale of one. The equivalence scales for other
types of households can be calculated by adding together the numbers for each
household member from the list below:
Head of household 0.67
Subsequent adults 0.33
Each child aged 0-13 0.20
Each child aged 14-18 0.33
For example, a single adult household adult will have an equivalence scale of 0.67.
This means that we assume he or she can attain the same standard of living as a
childless couple on 67 percent of their income. For a couple with one child aged 13
or younger, the head of the household counts as 0.67, the spouse 0.33, and the child
0.20, for a total equivalence scale of 1.20. This household needs an income 20
percent higher than a childless couple to have the same standard of living. No
weights are attached to disability (whether of the adult or child), nor to older ages in

15
general. Using this scale, the addition of a third or fourth child has the same kind of
magnitude of change to the income needs of the household as adding the first child.
The choice of equivalence scale may do little to affect the overall proportion of a
population that is poor, but it will affect the composition of those who are poor. A
systematic comparison of different approaches appeared in the 2001 HBAI report
(DWP 2002), with Appendix 2 showing that the number of poor lone parents, in
particular, was strongly affected by the choice of scale. It seems sensible to keep the
selection of a particular equivalence scale under review. The current system seems
to be very firmly entrenched in current UK (and much OECD) poverty research,
although other scales (such as ) are also used.
Definitions
Family is defined as a household containing two adults that are related by blood,
marriage or civil partnership, or in a cohabiting relationship.
Poverty has been defined as below 60 per cent of the median equivalised income for
most of the empirical data presented here.
16
3 FAMILIES AND POVERTY
3.1 Introduction
In the previous chapter, we discussed different approaches to defining family
structure and provided an overview of some of the issues surrounding the
measurement of poverty. In the UK, a relative measure of poverty is most commonly
used, with households deemed to be poor if their income falls below 60 per cent of
the median, subject to adjustments for prices and household composition. Of course,
this means that the level of income required for a family to be out of poverty changes
over time. Table 3.1 shows the poverty line in 2011/12 for different family structures.
These figures use the household as the unit of analysis. The poverty line for a couple
with no children is £256 per week before housing costs, for a lone parent with two
children aged under 14 it is £308 per week, and for a couple with two children of this
age it is £392 per week. We have presented figures before and after housing costs
initially to highlight the importance of accommodation prices in household budgeting.
However, thereafter we focus on AHC when analysing the links between other socio-
economic characteristics and family structures.3
Table 3.1: Poverty line thresholds in 2011/12
Family composition Poverty line threshold BHC £ per week
Poverty line threshold AHC £ per week
Couple no children 256 220 Single no children 172 128 Couple with two children
aged 5 and 14 392 357
Lone parent with two children aged 5 and 14
308 264
Source: HBAI 2011/12.
3 There is some discussion as to whether BHC or AHC is the more appropriate measure – on which
there may be no definitive answer. However, given the high cost of housing in the UK, and the lack of
control over housing costs (rents) for those on low incomes, we argue that AHC better captures levels
of poverty. Economists, who see housing spending as just another kind of spending, tend to regard
the BHC measure as superior.

17
3.2 Who is in poverty now?
In this section, we provide data on poverty in the UK using the most recent figures
available. We use data from the Family Resources Survey (FRS) as presented in the
HBAI series, which is a comprehensive annual government report on poverty in the
UK. In addition, we have included original analysis using the Annual Population
Study and the FRS.
To begin, we discuss the representation of individuals across the income distribution
according to family type and household characteristics. We then look at the picture
once economic and marital status of family members is taken into account. Next, we
discuss the proportion of various family types in poverty using different income
thresholds, and with material deprivation also included. The final section documents
trends over time.
Before housing costs, only 18 per cent of pensioner couples are in the lowest income
quintile, compared to 26 per cent of pensioner couples. Singles have been included
in these tables to demonstrate their greater chance of being in poverty relative to
couples. Among single pensioners, 21 per cent of males are in the bottom quintile,
while 28 per cent of females are in this poorest group (Table 3.2). Table 3.3 shows
that pensioners fare better after housing costs, with only 11 per cent of couples and
16 per cent of singles in the lowest income quintile. This is likely to be the result of
older people being more likely to have bought houses for lower prices, and /or own
their property outright.

18
Table 3.2 Quintile distribution of income for individuals by various family and
household characteristics, United Kingdom (before housing costs)
Family type Bottom quintile
Second quintile
Middle quintile
Fourth quintile
Top quintile
Individuals (million)
Pensioner couple 18 23 21 20 18 8.3 Single pensioner (all) 26 30 20 16 7 4.5 Single pensioner (male) 21 32 21 16 10 1.2 Single pensioner (female) 28 29 20 16 6 3.3 Couple with children 19 21 21 20 20 21.8 Couple without children 13 9 16 27 35 11.0 Single with children 31 35 22 9 3 4.9 Single without children (all) 24 17 20 20 20 11.0 Single male 24 16 19 20 21 6.8 Single female 23 18 21 20 18 4.2 Taken from HBAI 1994/5-2011-2, page 62, table 3.1db (Source: FRS 2011/12)
The comparison between family types is based on the equivalence scales used, as
discussed in section 2.2.4. It is also worth noting that the composition of income is, of
course, quite different between these groups, with varying proportions of earnings
and state benefits.
A greater proportion of lone parents are in the bottom income quintile than any other
group featuring in this data. Before housing costs, 31 per cent of lone parents are in
the poorest fifth, compared to 19 per cent of couples with children, and 24 per cent of
singles without children. After housing costs, 40 per cent of lone parents are in the
lowest quintile, as are 20 per cent of couples with children, and 27 per cent of singles
without children, with all of these groups faring worse once accommodation costs are
accounted for.

19
Table 3.3 Quintile distribution of income for individuals by various family and
household characteristics, United Kingdom (after housing costs)
Family type Bottom quintile
Second quintile
Middle quintile
Fourth quintile
Top quintile
Individuals (million)
Pensioner couple 11 21 24 23 21 8.3 Single pensioner (all) 16 29 24 20 11 4.5 Single pensioner (male) 15 27 23 21 14 1.2 Single pensioner (female) 16 30 24 19 10 3.3 Couple with children 20 21 21 19 19 21.8 Couple without children 13 11 16 26 34 11.0 Single with children 40 31 19 7 3 4.9 Single without children (all) 27 16 18 20 19 11.0 Single male 27 15 18 20 20 6.8 Single female 27 17 19 20 17 4.2 Taken from HBAI 1994/5-2011-2, page 62, table 3.1db (Source: FRS 2011/12)
Table 3.4 looks at the income distribution of working age adults according to family
type. Overall, 19 per cent of couples with children are in the lowest income quintile.
The percentage of married or civil partnered couples with children in the poorest fifth
is 17 per cent, yet for cohabiting couples the figure is 27 per cent and for singles it is
40 per cent. Regardless of their marital status, individuals without children are less
likely to be in poverty and also substantially more likely to be in the top income
quintile. This applies particularly to cohabiting couples and singles/ single parents.

20
Table 3.4 Quintile distribution of income for working-age adults by family type and
marital status, United Kingdom (AHC)
Family type and marital status AHC
Bottom quintile
Second quintile
Middle quintile
Fourth quintile
Top quintile
All individuals (millions)
All couples 16 16 19 23 27 23.9 Married or civil partnered 15 15 19 23 28 18.1 Cohabiting 19 18 19 22 22 5.8 Singles 29 18 18 18 16 12.9 All working age adults
with children 22 22 21 18 17 13.7
Couple (all) 19 21 21 20 19 11.8 : Married or civil partnered 17 19 21 21 22 9.4 : Cohabiting 27 26 22 16 9 2.4 Single with children 40 30 19 8 3 1.9 All working age adults
without children 20 14 17 23 27 23.2
Couple (all) 13 12 17 26 34 12.1 : Married or civil partnered 12 11 16 25 35 8.7 : Cohabiting 14 12 17 26 31 3.5 Singles (all) 27 16 18 20 19 11.0 : Male 27 15 18 20 20 6.8 : Female 27 17 19 20 17 4.2 All working age adults 21 17 19 21 23 36.9 Source: HBAI 1994/5-2011-2, page 165, table 5.1db
3.2.1 Same-sex couples and employment
In most published analysis same-sex and opposite sex couples are grouped
together. Therefore, the tables below are a rare comparison between the two groups.
The analysis of the most recent Annual Population Survey shows that employment
rates for same sex couples tend to be similar to those of opposite sex couples,
whether in formal partnerships or not (Table 3.5). If anything, rates of employment
are higher for women in same sex couples than in opposite sex couples. This may, of
course, be related to other factors such as differential qualifications, or the presence
of children. Rates for men are relatively similar, and somewhat more similar when
looking at those of the same ages.

21
Table 3.5: Proportion in work by family type and gender
Family Type Percentage in paid work Unweighted base Men Women Men Women In formal unions Married 90 74 39,197 43,657
Civil partnership 87 82 234 293
Not in formal
unions
Cohabiting (opposite sex)
86 77 11,649 12,090
Same sex couple 89 81 349 304
Source: Annual Population Survey October 2012-September 2013. Base: those aged 16-60. Weighted by PWTA11.
It is also worth noting that the same sex couples are somewhat more likely to be
cohabiting than in a civil partnership, whereas most of the opposite sex couples are
married. It is only with very large sources of data, like the Annual Population Survey,
that it is even possible to look at same sex couples as a group. Even then, sample
numbers remain relatively small, particularly when broken down by gender. This
makes it difficult to conduct more detailed analysis taking account of other
characteristics, such as age (same sex couples are 41 on average, younger than the
median age of 44 for other couples, in this age-restricted sample) and location (17
per cent of same sex couples were living in London, compared with 9 per cent of
other couples).
Using home ownership as a proxy for income, the following table shows the
proportion of individuals in opposite or same sex unions (Table 3.6). Overall, the
rates of home-ownership are high for those in formal unions and less so for those in
informal unions, but quite similar for both groups in both cases. In other words, the
differences between marital statuses are greater than differences between sexual
orientations. However, individuals in same sex couples were more likely to be a
home owner if they were not in a formal union than opposite sex couples but less so
if they were in formal unions.
22
Table 3.6: Proportion in owner-occupation by family type and gender
Family Type Percentage home-owners Unweighted base
Men Women Men Women
In formal unions Married 76 77 39,197 43,657
Civil partnership 72 68 234 293
Not in formal
unions
Cohabiting (opposite sex)
49 50 11,649 12,090
Same sex couple 57 54 349 304
Source: Annual Population Survey October 2012-September 2013. Base: those aged 16-60. Weighted by PWTA11.
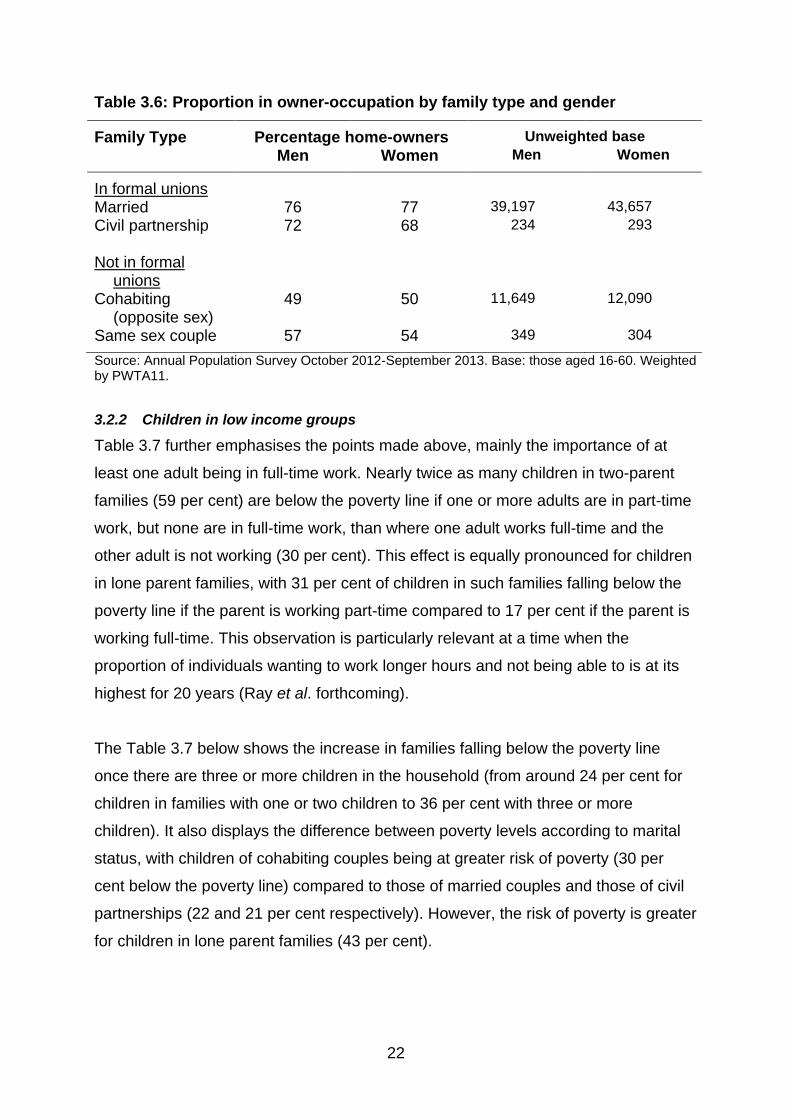
3.2.2 Children in low income groups
Table 3.7 further emphasises the points made above, mainly the importance of at
least one adult being in full-time work. Nearly twice as many children in two-parent
families (59 per cent) are below the poverty line if one or more adults are in part-time
work, but none are in full-time work, than where one adult works full-time and the
other adult is not working (30 per cent). This effect is equally pronounced for children
in lone parent families, with 31 per cent of children in such families falling below the
poverty line if the parent is working part-time compared to 17 per cent if the parent is
working full-time. This observation is particularly relevant at a time when the
proportion of individuals wanting to work longer hours and not being able to is at its
highest for 20 years (Ray et al. forthcoming).
The Table 3.7 below shows the increase in families falling below the poverty line
once there are three or more children in the household (from around 24 per cent for
children in families with one or two children to 36 per cent with three or more
children). It also displays the difference between poverty levels according to marital
status, with children of cohabiting couples being at greater risk of poverty (30 per
cent below the poverty line) compared to those of married couples and those of civil
partnerships (22 and 21 per cent respectively). However, the risk of poverty is greater
for children in lone parent families (43 per cent).

23
Table 3.7 Percentage of children in low-income groups by various family and
household characteristics, United Kingdom
Economic status of the family Material
deprivation and low income
Material deprivation
and severe low income
Below 60% of median (AHC)
All children (millions)
At least one adult in work 7 2 20 11.1 Workless families 42 11 67 2.0 Economic status of family and family type
Lone parent: 23 6 43 3.0 In full-time work 6 2 17 0.8 In part-time work 14 5 31 0.8 Not working 39 9 65 1.4 Couple with children 8 3 22 10.1 Self-employed 6 3 29 1.5 Both in full-time work 1 1 5 2.3 One in FT work, one in PT work 1 - 10 3.0 One in FT work, one not working 10 3 30 2.1 One of more in PT work 29 7 59 0.6 Both not in work 48 15 69 0.6 Marital status Couple 8 3 22 10.1 Married/civil partner 7 2 21 8.3 Cohabiting 14 4 30 1.9 Single 23 6 43 3.0 No. of children in family One 10 3 25 3.9 Two 9 3 24 6.0 Three or more 19 5 36 3.3 Source: HBAI 1994/5-2011-2, page 114, table 4.5db
3.2.3 Material deprivation
The poorest category represented in Table 3.8 is those living in material deprivation
(defined as lacking the goods and services needed for a decent standard of living,
see chapter 2) and severe low income. Eleven per cent of children in workless
families fall into this group, compared to only two per cent of children in families with
at least one adult working. In two-parent families where both adults are in full-time
employment, only one per cent of children live in material deprivation combined with
severe low income. For families where one adult works full-time and the other part-
time, less than one per cent of children are in this group. This is probably a reflection
of greater income from the main earner reducing the need for the second adult to
work longer hours. By way of contrast, in families where both adults are not in work,
15 per cent of children live in materially deprived households with severe low income,
and almost half (48 per cent) are materially deprived in a low income household.

24
The effect of employment for lone parents is also noticeable. Only two per cent of
children in lone parent families are in the most deprived category if the adult is
working full-time. This increases to five per cent if the adult is employed part-time,
and nine per cent if the adult is not working at all. It should be noted that, as
mentioned above, the figure for children in two- parent families where neither adult is
working are worse, with 15 per cent of this group materially deprived and in a severe
low income household. However, 39 per cent of children in lone parent families
where the adult is not working are in material deprivation and in low income
households, as are six per cent of children with lone parents working full-time, and 14
per cent of those whose lone-parents are in part-time jobs.
Children in families where the parents are married are less likely to be both materially
deprived and in low (seven per cent) or severe low (two per cent) families than
children with cohabiting parents (14 per cent low income, and four per cent severe
low income) or lone parents (23 per cent and six per cent). There appears to be little
difference between having one or two children, but having three or more children
increases the risk of them living in material deprivation and on low or severe low
income.

25
Table 3.8 Percentage of children in low-income groups by various family and
household characteristics, United Kingdom
Economic status of the family
Material deprivation and low income
Material deprivation and severe low income
All children
(millions) At least one adult in work
7 2 11.1
Workless families 42 11 2.0 Economic status of family and family type Lone parent: 23 6 3.0 In full-time work 6 2 0.8 In part-time work 14 5 0.8 Not working 39 9 1.4 Couple with children 8 3 10.1 Self-employed 6 3 1.5 Both in full-time work 1 1 2.3 One in FT work, one in PT work
1 - 3.0
One in FT work, one not working
10 3 2.1
One of more in PT work
29 7 0.6
Both not in work 48 15 0.6 Marital status Couple 8 3 10.1 Married/civil partner 7 2 8.3 Cohabiting 14 4 1.9 Single 23 6 3.0 No. of children in family One 10 3 3.9 Two 9 3 6.0 Three or more 19 5 3.3 Source: HBAI 1994/5-2011-2, page 114, table 4.5db
3.3 Trends over time
One of the key trends over the last couple of decades has been a convergence of
poverty risks between different family types (see Figure 3.1). Whilst at the start of this
period (1994/95) there were significant differences in the poverty risks of the family
types shown, by the most recent time period (2011/12) these risks have become
more similar. Overall the proportion of individuals living in low income household fell
from 19 per cent to 16 per cent. Between 1994/95 and 2011/12, the risk of lone
parents having a low income fell from 41 per cent to 22 per cent. This is related to the
increasing levels of lone parents in work, and the increased levels of support for both

26
working lone parents and for children more generally. That may also be expressed as
a shift from being some 22 percentage points above the population average, to only
six percentage points above average. There was also a large reduction in rates of
poverty, though not of the same magnitude as for lone parents, for another group
with above-average risks of low income, single female pensioners. That is likely to be
related to increased resources going to Pension Credit. Conversely the proportion of
couples without children, the group least likely to be poor, who were in low income
households increased from eight per cent to 11 per cent. The greatest increases in
risks of low income, in terms of percentage point rises, were among single people
without children. This group experienced little or no real increases in levels of out of
work benefits, unlike most other groups of benefit recipients. Overall, then, risks of
poverty fell among older people and within families with children, whilst rising for
working age adults without children. As a result the rather diverse risks of poverty
within each group at the start of this time period were somewhat attenuated by the
end.
Figure 3.1 Poverty risk by family type, over time.
Source: Households Below Average Income 1994/95 – 2011/12.
As a result of these trends, and changes in the demography of families in the UK, the
composition of those in low income households has also changed (see Figure 3.2). In

27
1994/95 around one in six individuals living in poverty was in a lone parent family,
this rose to 20 per cent by 1999/2000, but by 2011/12 had dropped back to 11 per
cent. There was also a reduction in the proportion of couples with children in the low
income figures, from 38 to 33 per cent. These two sets of figures attest to the
strategy adopted by New Labour of having a particular emphasis on child poverty.
Over this period, the proportion of poor individuals who were children dropped from
31 per cent to 23 per cent. Since these figures show the composition of low income
individuals, these reductions are by definition offset by increases elsewhere. The
reduction in the proportion of children in poverty has occurred whilst more of the poor
population consists of working age adults without children. In particular in 1994/95
only nine per cent of the poor were single men without children; by 2011/12 this had
reached 14 per cent.
Figure 3.2 Composition of people in low income households, by family type
Source: Households Below Average Income 1994/95 – 2011/12.
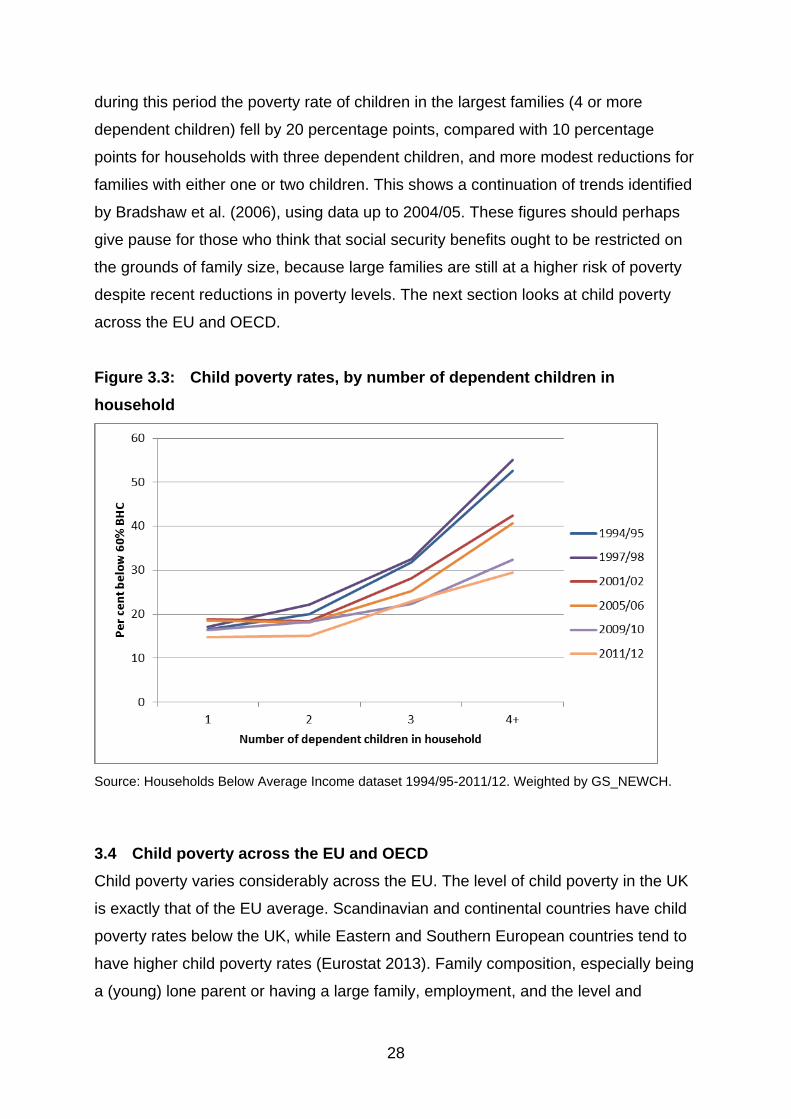
Over time, the differentially high poverty rate among larger families seems to have
been greatly reduced. In 1994/95, more than half of children in households with four
or more children were living on a low income (below 60% median, before housing
costs) (see figure 3.3). By the time of the most recent data (2011/12), the poverty
rate for households with 4 or more children had fallen to around 30 per cent. Overall,
28
during this period the poverty rate of children in the largest families (4 or more
dependent children) fell by 20 percentage points, compared with 10 percentage
points for households with three dependent children, and more modest reductions for
families with either one or two children. This shows a continuation of trends identified
by Bradshaw et al. (2006), using data up to 2004/05. These figures should perhaps
give pause for those who think that social security benefits ought to be restricted on
the grounds of family size, because large families are still at a higher risk of poverty
despite recent reductions in poverty levels. The next section looks at child poverty
across the EU and OECD.
Figure 3.3: Child poverty rates, by number of dependent children in
household
Source: Households Below Average Income dataset 1994/95-2011/12. Weighted by GS_NEWCH.
3.4 Child poverty across the EU and OECD
Child poverty varies considerably across the EU. The level of child poverty in the UK
is exactly that of the EU average. Scandinavian and continental countries have child
poverty rates below the UK, while Eastern and Southern European countries tend to
have higher child poverty rates (Eurostat 2013). Family composition, especially being
a (young) lone parent or having a large family, employment, and the level and

29
composition of social transfers are the three major determinants of the risk of being in
poverty for families in EU countries (Eurostat 2013). In nearly all OECD countries,
poverty rates for lone parents not in employment are at least double the rates for
those in paid work. Poverty rates for two-adult families with children where neither
parent is working are, at least, three times greater on average than for families where
one parent is employed (Whiteford and Adema 2007).
There are significant cross-country differences in lone parent employment rates
(Chzhen and Bradshaw 2013; OECD 2007). Just over 50 per cent of lone parents in
the UK are working, compared to more than 70 per cent in Canada and Finland, and
82 per cent in Sweden, according to the OECD (2005:161). The poverty rate for non-
employed lone parent families in Canada was 90 per cent compared to 28 per cent
for working lone parent families. Poverty rates for non-employed lone parent families
in Finland (25 per cent) and Sweden (34 per cent) are much lower, as the level of
benefits paid in those two countries are higher. This is a result of gross social
expenditure and net spending on family benefits being higher in both countries.
Employment further reduces the risk of poverty for one-parent families to seven per
cent in Finland and six per cent in Sweden (OECD 2005:135).
However, high proportions of children living in lone-parent households or large
families do not always lead to greater risks of child poverty. If the labour market and
social policies are sufficiently supportive, with access to affordable childcare, decent
wages for reasonable hours, and generous benefit payments, such family structures
do not necessarily increase the chance of being in poverty. For instance, Denmark
and Sweden have child poverty rates among the lowest in the EU. They also have
high shares of children living in one-parent households - 17 per cent and 19 per cent
respectively, against the EU average of 13 per cent - and in large families - 26 per
cent and 28 per cent, against the EU average of 21 per cent (European Commission
2008:22). This is due to high levels of spending on social transfers, which reduce the
risk of poverty for children by over 60 per cent in both nations, compared with an EU
average of 44 per cent (European Commission 2008:39). Investment in welfare can
clearly be successful at removing families from poverty.

30
The composition of social transfers is important. For example, Bradshaw and Finch
found that the UK treats one-child families more generously than large families when
the total package of taxes and benefits is taken into account (2002:152). This is due
to child benefit in the UK being paid at a higher rate for the first child than for
subsequent children. This is relatively unusual and in many other countries included
in their research, larger families received more than those with only one child, usually
as a result of child-related benefits being higher or, at least, the same value rather
than lower for the second child.
For families with only one low-earner (with pay at half of average male earnings),
France, Austria and Luxembourg are particularly generous to larger families. In
Austria, a couple with three children receives more than double the amount given to
a two-parent family with two children, and almost five times more than a couple with
one child. In Luxembourg, a lone parent on earnings amounting to half of male
average pay receives more than four times as much for two children as for one child.
Two-parent families with three children receive over four times more than couples
with one child. France pays almost 25 times more to families with three children than
to those with only one child. Payment levels remain the same if family income
increases from half of average male earnings to average male earnings. Austria and
Luxembourg pay less when income rises in this way, yet still pay more for second
and third children than for the first child. All three countries continue to pay more to
families with two and three children even when family income is equivalent to
average male earnings plus half of average female earnings (Bradshaw and Finch
2002:59-62).
The age of the mother when giving birth to her first child is a significant predictor of
being in poverty, with those aged 14 to 19 at the time of their baby’s birth almost
seven times likelier to experience poverty than older mothers (Bradshaw 2005:38).
This also applies beyond the UK, as poor children in EU are more likely to have
young parents overall (European Commission 2008:25). A number of countries have
therefore introduced policies to reduce teenage pregnancy and to enable young
parents to stay in education.
31
3.5 Insights from a meeting organised by the Poverty Alliance with people
experiencing poverty
The sections in this chapter so far have been based on statistics to present the
overall picture and draw out the links between family structures, characteristics and
different welfare settings. In addition to this analysis of secondary data, we
collaborated with The Poverty Alliance to participate in a focus group with people
who have experience of living in poverty to explore the complexities and challenges
in more depth. The findings from this focus group are presented in box 1 below.
Box 1: The experience of being in poverty – what matters
A range of interesting points were made at the meeting and some clear parallels
emerged between people with substantial disabilities and lone parents looking for
work. However, three points are most relevant in this context:
The first point made is not new but remains a big stumbling block: the cost of
childcare. The practice of many private nurseries to charge for a full-day when
parents are using part of the morning and part of the afternoon session to work
around their shift patterns or school hours of older children means that it is often not
an option. The issues surrounding childcare in the UK are discussed in more detail in
another review. However, it is important to highlight the central role formal childcare
plays in facilitating or hindering lone parents in finding and staying in employment.
The second point concerns the motivation of lone parents to move into work. It was
argued that it was difficult to be motivated to apply for jobs for which the lone parents
usually were not qualified, especially when they would not have earned much more
money than from benefits4. Perhaps in these straitened times, there is less sympathy
for jobseekers wanting to be better off in work than on the dole. However, in the case
of lone parents it would mean doing a job (often with limited career prospects) for the
same amount as staying on JSA while their own children are being looked after by
4 It is rare for paid work to provide less income than benefits, and the comment may be based on
misconceptions about how much they would be better off in work. Nevertheless it may be the
perceptions rather than the reality that drives behavior.

32
other people. The desire to undertake training that would enable lone parents to
enter professions such as nursing or social work has been expressed in many
studies. And yet in the UK since 2013, once lone parents are moved onto JSA when
their youngest child reaches the age of five, they are not allowed to partake in full-
time training and any part-time training has to be compatible with their work search
and work availability obligations.
However, the point that resonated most strongly with all those attending the event
was the increasing levels of insecure work and under-employment. It was felt that the
current social security system is not designed to cope with such employment and
income patterns that often change from week to week. Universal Credit is designed
to deal with precisely these changes in a more reliable and time-efficient manner.
However, it remains to be seen whether this ambitious reform will be able to meet
these aims.

33
Summary: Family structure and poverty empirical trends
Three main trends emerge when looking at poverty levels of families over time.
Firstly, in general poverty rates for families with children have decreased and, in
particular, for lone parent families and families with three or more children over the
past 15 years. However, these two groups are still most at risk of being in poverty
together with households from minority ethnic groups and with one disabled adult.
Secondly, the rise of in-work poverty raises questions over whether employment is a
certain route out of poverty. The decline in income security among people with
experience of poverty should be better addressed by Universal Credit than by current
policy arrangements as long as the responsive element of Universal Credit functions
properly. Finally, our analysis suggests cohabiting couples are more likely to be poor
than both married couples and those in civil partnerships. This last result is likely to
be reflecting the different kinds of people who opt for informal rather than formal
arrangements (i.e. a ‘selection effect’.
34
4 POLICIES THAT AFFECT THE LINKS BETWEEN FAMILY
STRUCTURE AND POVERTY
4.1 Introduction:
The relationship between family structures and poverty is complex and multifaceted.
Key issues are the degree of the state involvement, in terms of the nature and extent
of financial redistribution between families, and also behavioural policies.
Demographic changes such as separation and re-partnering add to the complexity of
this policy area (see results in the reviews covering demography and family
relationships). A number of these issues are also addressed in other reviews, such
as the reviews on employment and poverty, childcare and poverty, and gender and
poverty.
In chapter two, some of the key links between family structure and poverty in the UK
today were discussed. As outlined in the previous chapter, the risk of poverty in the
UK increases substantially if one or more of the following factors come together:
Workless household
Lone parent families
Having three or more children
Being from particular minority ethnic background
One or more members of the family with health impairments
Only one adult in (part-time) work
In 1999, the then Prime Minister Tony Blair pledged to end child poverty within 20
years (Bradshaw 2005:36). In order to meet this target, the previous Labour
government (1997 to 2010) introduced a range of measures including a National
Childcare Strategy, Sure Start, the New Deals, tax credits and later Lone Parent
Obligation (hereafter LPO), and improvements to work-life balance policies, as well
as above-inflation increases to child related benefits (see Waldfogel 2013). Child
poverty fell substantially during these years due to a combination of positive
economic growth and policy interventions (Brewer et al., 2012). However, slow wage

35
growth, increasing living costs and austerity measures caused it to rise again. As
such, it is forecast that child poverty will continue to rise until 2020 (ibid).
However, the phased introduction of a major reform, namely Universal Credit,
combining six existing benefits into a single monthly payment makes forecasting child
poverty over the medium term more difficult, not least because of the phased
implementation. The effect of launching Universal Credit with no transitional
protection or phase-in period in 2014 would be to reduce relative child poverty by
450,000 and relative poverty among adults of working-age by 600,000 (Brewer et al
2011:13-14). In other words, once Universal Credit is fully operational it should
reduce the overall poverty levels of families. Despite this, child poverty is expected to
rise due to the effects of other policies. It has been suggested that the most
significant of these is the decision to index benefits in line with the Consumer Prices
Index (CPI), which replaced the Retail Prices Index in April 2013 as the inflation
measure used to calculate benefit levels (Brewer et al. 2011:18).
4.2 Incentivising particular family forms
With the evidence that relationships between family structures and poverty do exist,
albeit in varying forms according to policy and historical context, it follows that the
impact of policy on family structure itself is of interest. If lone parents in the UK have
a greater chance of being in poverty, can policy affect the likelihood of partnership
formation or dissolution? This then raises the question of how far it is desirable for
politicians and policy-makers to get involved in this issue, which tends to be regarded
as belonging to the private sphere.
Stafford and Roberts (2009), in a review of international literature, found ‘no
consistent and robust evidence to support claims that the welfare system has a
significant impact upon family structure’ (Stafford and Roberts 2009: 6). The review
focused on welfare policies affecting union formation, union dissolution and lone
parenthood/ additional children. The research base for the UK is small; research is
mostly observational rather than based on experimental designs (with greater
problems of disentangling causal relationships). One of the factors that seemed to
emerge is that couples where the male partner has low earnings power are more
vulnerable to dissolution if income is higher up for the female partner (ibid).

36
Conversely, increasing financial incentives to have more children seems to have had
the desired effect of raising the birth rate in France (Laroque and Salanie 2008),
whilst the US retains high fertility (including among the white population) despite
having very low financial support for families with children.
As an example of inconclusiveness concerning one policy initiative, the Canadian
Self-Sufficiency Project, an earnings supplement paid to single parents in receipt of
benefits upon entering full-time employment, decreased the probability of being ever
married or cohabitating in British Columbia by 2.5 percentage points, a 16 per cent
decline, but increased the chance of being ever married or cohabitating in New
Brunswick by 4.3 percentage points, a 22 per cent rise (Stafford and Roberts
2009:3). This proves how policy effects can be subject to regional or international
variation, as the effects of the same policy seem to vary across different provinces
within the same country.
Stafford and Roberts (2009) found that following the introduction of WFTC, single
parents were less likely (by 2.4 percentage points) to form a union than single
childless women. This effect was greater for women with younger children (two to
three percentage points). In contrast, recipients of the predecessor of WFTC, Family
Credit, (hereafter FC), were more likely to marry or begin cohabitating than non-
recipients. The difference in UK findings might be due to WFTC being more generous
than FC, reducing the opportunity cost of being a single parent (ibid), or to
unobserved factors.
Anderberg (2008b:9), analysed data from the Family Resources Survey to determine
the effect of couple penalties - defined as the net loss from tax and benefit changes
due to being in a couple, as opposed to a couple subsidy, which represents a net
gain - on family structure. He looked at benefit entitlements for couples, using
descriptive analysis, which included simulating separations to enable comparisons of
these couples while living together with the hypothetical situation if separated. A
couple penalty of £100 per week was found to reduce the probability of a woman
living with a partner by up to seven percentage points, compared to no couple
penalty. The effects were weaker for more highly educated women or those with
children. Anderberg points out that ‘a decade of benefit reforms has had the same

37
impact on the aggregate partnership rate as other exogenous trends have had
annually’ (2008b:9). The role of welfare benefits in shaping structural changes in
society therefore appears quite small. While a corollary of WFTC, which was primarily
intended to encourage employment, was to incentivise partnership formation, most of
the effect has been reversed by subsequent reform, namely the introduction of WTC
and CTC as separate benefits (albeit subject to the same means-testing) to replace
WFTC in 2003 (ibid).
A policy to limit child benefit payments to two children for families on benefits has
been mooted in the UK. A similar policy, called the family cap, has been introduced in
the US. Under such a policy, families receive no increases in benefits for any children
that they have whilst receiving benefits. However, the findings from a number of
studies either show no effects or contradictory effects over time on the rate of births,
including across particular characteristics such as age and minority ethnic group
(Kearney 2004; Stafford and Roberts, 2009).
Similarly, the discourse around ‘broken families’ and the effects on child outcomes
and society has gained currency under the Coalition government and a DWP review
looking at family stability is now in progress. The re-introduction of the Married
Couple Allowance (in revised form) by the Coalition government ostensibly supports
couples staying together. However, the rather complicated policy design suggests
that only a minority of married couples will be able to actually receive money as a
result of the Married Couple Allowance and that the majority of those will be older
people. A recent in-depth study of the difference between cohabiting and married
couples in the UK suggests that cohabiting couples have different characteristics,
supporting the hypothesis that couples who get married are different from cohabiting
couples. This casts doubt over whether those unions would be more stable if those
currently cohabiting were to marry (Crawford et al. 2013).

38
Summary: incentivising family forms
Overall, we agree with Stafford and Roberts’ (2009) conclusion that the evidence
base is patchy and inconclusive, making it difficult to say definitively how different
welfare systems affect family structure in terms of both the formal status of the couple
and the number of children. We therefore suggest that policy proposals currently
under discussion, such as (re-) introducing a married couple tax allowance or limiting
the number of children that child benefit is paid for, are unlikely to have a major
impact.
4.3 The rise of behavioural policies - Conditional cash transfers
In recent years, policies explicitly linking the receipt of benefits to behavioural
changes have been introduced in numerous countries. Conditional Cash Transfers
(CCTs) aim to alleviate poverty in the short-term by giving financial support to
families, and to encourage longer-term improvements by making cash support
conditional upon certain behaviours. These are usually centred on employment,
education or health.
CCTs offer immediate assistance in the form of cash payments, which can pull
recipients out of poverty or at least temporarily improve their circumstances.
However, the main priority of these initiatives is to promote an end goal of
sustainable self-sufficiency by incentivising behaviours that in theory would help
beneficiaries remain out of poverty in the longer-term. Despite this, CCTs have also
faced criticism for neglecting supply-side difficulties. Programme participants are
rewarded for engaging in employment, for example, but without investment in job
creation it can be difficult to find work (Aber et al. 2012:14). Such structural issues
are an important part of the overall picture. CCTs can be viewed as part of a broader
trend toward extending conditionality in welfare, which has been the subject of
analysis by several commentators in the UK (Dwyer 2004, Barker and Lamble 2009,
Grabham and Smith 2010), which we discuss further in section 4.4. Here, we outline
some international examples of CCT schemes, which combine cash support for
families with various behavioural stipulations.

39
4.3.1 CCTs: international examples
CCTs have ordinarily been operated in less affluent countries (see table 4.1 below).
Here, we briefly outline the Oportunidades programme in Mexico as an example of
those programmes. However, the reason for including CCTs here is not solely for
their apparent effectiveness in poorer countries, as such schemes are also being
introduced in OECD nations. New York recently ran its own programme, discussed
below, and the Troubled Families programme in England operates on similar
premises.
Table 4.1: Examples of large-scale cash transfer programmes in operation
Country Scheme Scale China Minimum Living Standard Scheme 22 million (2006)
Mexico Oportunidades (began in 1997) 5 million households
Brazil Bolsa Família 12 million households
Brazil Old Age Pension 2.4 million households (2008)
South Africa
Child Support Grant Expected to reach 10 million children by end 2009
South Africa
Old Age Pension 2.4 million households (2009)
Indonesia Safety Net Scheme Expected to reach 15 million households
India National Rural Employment Guarantee Scheme
48 million households (2008)
Ethiopia Productive Safety Nets Programme (PSNP)
1.5 million households (est. 8 million people)
Source: Arnold et al (2011:11), table 2
In Mexico, the Oportunidades programme (then called Progresa) began in 1997. The
aim was to replace the array of existing subsidies with a single, simplified support
scheme. At the outset, Oportunidades gave around 300,000 families conditional cash
transfers for commitment to certain behaviours concerning health and education
(Fiszbein and Schady, 2009:31). A set of benefits put into a savings account was
later added to the cash payments (ibid). There were around 5 million households
engaged with the scheme by 2008. It reduced the poverty gap by 30 per cent among
beneficiaries after two years of operation (Arnold et al., 2011:15). Oportunidades
increased payments by M$120 (about $10) per household in 2008 to compensate for

40
losses in purchasing power during the economic downturn (Johannsen et al.,
2009:19).
Another example of a major conditional cash transfer scheme is the Opportunity
NYC: Family Rewards programme in New York City, which ran from 2007-2010.
Payments were offered for behavioural changes such as better school attendance,
weight loss and moving into employment or participating in training programmes.
Family Rewards transferred an average of over $8,700 to families over its three year
lifespan. It lowered poverty and material hardship, increased saving among parents
and reduced the need for informal loans. It increased the likelihood of self-reported
full-time employment but did not increase employment in (or earnings from) jobs
covered by the unemployment insurance system. Interestingly, participants were
more likely to divorce, which is possibly a product of their improved financial security
(Riccio et al., 2013a: 85-7). The programme therefore had some impact on family
structure.
The effects of participation in the programme also varied according to family
structure. Limited data is available, but some conclusions can be drawn. The
proportion of two parent families at or below the federal poverty level (with payments
from Family Rewards taken into account) was 17 per cent lower for those partaking in
the scheme compared to the control group. Household income for two-parent families
was also higher for participating households with programme payments excluded,
suggesting that their involvement in the initiative led to increased earnings from
employment, although the difference is not statistically significant at the p<.05 level.
For lone-parent families, the proportion at or below the federal poverty level was 11
per cent less than the control group with Family Rewards transfers factored in. The
analysis indicates that non-programme earnings also improved although the
difference was again not statistically significant (Riccio et al., 2013b; 3). This shows
how the effects of the intervention differed according to the structure of participating
families.

41
Summary
This section has shown that cash transfers to families are used in numerous
countries, with programmes running for various durations and targeted at different
groups. It has also shown that these transfer schemes have made tangible
improvements to poverty by increasing incomes and promoting employment, along
with other health and educational behaviours. These programmes have operated in a
range of settings, although it should be noted that the Family Rewards programme in
New York was the first comprehensive CCT initiative in a developed country.
4.4 Child maintenance
The financial responsibility of absent parents after couples with children have
separated is a matter of continuous and contentious debate with clear implications for
policy (see Bryson et al. 2013). For the purpose of this review, we focus on collection
methods, costs and success, in terms of both coverage and impact on household
income levels. Broader issues such as the potential link between child maintenance
and child contact, whether shared care arrangements are taken into account
adequately, and of fairness to new families and new family members of separated
parents, are beyond the remit of this review.
4.4.1 The (in)effectiveness of child maintenance in Britain
Around 300,000 families break up each year in Britain. Parents are separated in an
estimated 2.5 million families. Around one quarter of all dependent children live in
one-parent households (NAO 2012:12). Child maintenance is one method of
ensuring that lone parents receive money from former partners to support dependent
children. However, only 1 in 3 lone parents currently receive maintenance payments
in the UK (see table 4.1 below).
In 1991, the Child Support Agency was introduced in order to increase the
maintenance collected from non-resident parents and in turn reduce the amount of
benefits paid to lone parents, as any child maintenance paid to those lone parents
would only be passed on to the lone parent if above the rate of Income Support. The
CSA was beset with problems from the start. Respective governments failed to
establish an effective or efficient system of collecting maintenance (for further detail
42
on the development and problems of the CSA, see McKay 2013; Bryson et al. 2013).
Thus, from November 2013 the Child Support Agency ceased to exist. Responsibility
for child maintenance is now with the Department for Work and Pensions. Parents
can still make private arrangements or obtain a court order to grant use of the Child
Maintenance Service. The latter option will require paying a fee of £20 as of April
2014, and a percentage of the amount collected will be kept by the service (see
Gov.UK 2013 and Gingerbread 2013). The latest reform strongly encourages private
arrangements (McKay 2013), indicating that the department itself is hoping to raise
revenue from this source (Bryson et al. 2013).
In line with other recent policy changes, lone parents on benefits do not have to use
the Child Maintenance Service but can make private arrangements. Then, the full
amount of child maintenance can be kept even when receiving IS/JSA or, in future,
Universal Credit, thereby strengthening the work incentive for parents receiving
maintenance (Gov.UK 2013 and CPAG 2013). There are concerns that the time of
separation is not always ideal for negotiating terms with former partners, and that
maintenance arrangements do not necessarily last (see Bryson et al. 2013). Even
where parents agree on maintenance arrangements at the time of separation, this
agreement may not hold over the years, for instance when one or both re-partners
and/or additional children enter the households.
It is surprisingly difficult to ascertain how many parents are receiving child
maintenance (Chalabi 2013). The most recent estimates suggest that between 36
and 52 per cent of lone parents are in receipt of payments (DWP 2012; Bryson et al
2013: 36-37). In other words, between half and two thirds of lone parents are not. A
small proportion of those are likely not to be entitled due to having shared care
arrangements with their former partner. However, while estimates for the incidence of
shared care in the UK vary as well (Fehlberg et al. 2011), it is likely to affect less than
ten per cent of parents. Conversely, DWP claim that 70 per cent of maintenance due
has been collected (DWP 2013b). The median amount paid is around £23 (Bryson et
al. 2013).
The Family Resources Survey (FRS) asks about people both paying and receiving
maintenance. Whilst the accounts of absent parents and those eligible for their

43
support often differ, in the FRS around 750,000 people report paying maintenance,
with a similar number in receipt. Figures for the last four years show fairly constant
numbers of people receiving maintenance (with some reduction, if anything), and
somewhat fewer people saying that they pay maintenance.
The numbers receiving maintenance in different ways (whether through voluntary
agreements or more formally) have also remained rather similar over time at around
36/37 per cent, albeit with a long-term decline in the numbers who mention
maintenance being received through court orders.
The proportion of self-identified non-resident parents who say that they pay
maintenance has been relatively consistent over time, at around six in ten – though
fewer people in the survey are identified as being non-resident parents. The number
of lone parents who are receiving child maintenance has also remained stable, at just
over one in three.
Table 4 .1: Numbers paying and receiving maintenance
2008-09 2009-10 2010-11 2011-12
Whether receiving maintenance 800,000 790,000 790,000 770,000 : CMEC 280,000 270,000 290,000 260,000 : Court order 70,000 50,000 50,000 40,000 : Voluntary agreement 430,000 430,000 420,000 430,000 : Other 20,000 30,000 20,000 20,000 As % of lone parents 36.3 37.2 36.7 37.0 Whether paying maintenance 850,000 810,000 800,000 740,000 Among NRPs (as %) 61.5 62.7 62.8 61.9 Source: own analysis of Family Resources Surveys 2008/09-2011/12. Weighted by GROSS3.
Audited accounts for the Child Maintenance and Enforcement Commission, from
March 2010, showed that arrears from non-resident parents had reached £3.7 billion,
although a financial audit of these arrears identified weaknesses in the underlying
data. The Commission estimates that it may be possible to collect around £1 billion of
the outstanding arrears, although it only expects to collect £488 million (NAO
2012:5). It is estimated that Britain spent approximately 56 pence for each £1
collected on behalf of parents (DWP 2013c). To compound the challenges the Child

44
Maintenance Service, in light of the incoming policy changes, their funding is being
cut from £560 million in 2010-11 to £399 million in 2014-15 (NAO 2012:5). These
figures convey the difficulty of administering child maintenance, and the scale of the
costs involved.
In summary then, the policy problem in the UK seems clear: Only 37 per cent of lone
parents receive maintenance at all and even fewer are likely to receive the full
amount regularly. This is important for those in constrained financial circumstances.
Furthermore, maintenance collection has been a rather expensive exercise to date.
The current Coalition government has therefore attempted to shift the responsibility
toward individuals, encouraging private arrangements by making the alternative
routes more expensive.
4.4.2 The effectiveness of child maintenance in reducing poverty – lessons from
other countries
The extent to which child maintenance reduces child poverty depends on whether or
not actual receipt is taken into account. Hakovirta (2011) compares child
maintenance across eight countries using 2004 and 2005 data from the Luxembourg
Income Study. She finds that the overall poverty gap - defined as the amount of
income needed to bring families level with the poverty line, thereby eliminating
poverty - is reduced by 5 per cent in the UK but that this number would increase to
30 per cent if all eligible lone parents received maintenance (2011:258). This
corroborates findings from earlier studies by Bradshaw (2006) and Skinner and
Davidson (2009). Hakovirta also finds significant variation in the proportion of lone
mothers receiving child maintenance between different nations. The figure varies
from 22 per cent in the UK, which has the lowest rate of child maintenance reaching
lone mothers, to 100 per cent in Sweden (Hakovirta 2011:253). This is due to very
different arrangements in the two countries. Sweden, like a number of other
continental countries, has a guaranteed maintenance system where the state covers
payments in instances where the liable parent does not, hence the 100 per cent
receipt rate.
There are significant differences in the maintenance arrangements in the UK and
elsewhere (for a review, see Skinner and Davidson 2009). In some countries,

45
payment of child maintenance is a legal obligation of the non-resident parent or,
conversely, receipt is a right of the child (Skinner and Davidson 2009). In line with
such legislation, efforts to collect child maintenance tend to be more concerted.
Some countries guarantee child maintenance if the non-resident parent does not or
cannot pay (Hakovitra 2011). In Denmark, Finland and Norway support is guaranteed
regardless of parental income. Support is only guaranteed for those with low income
in Belgium and Sweden, and to those who have financial difficulties in Luxembourg
(Bradshaw and Finch 2002:55). In addition, some governments/ child maintenance
agencies have greater powers for recovering unpaid maintenance. These include
making deductions from earnings, tax rebates or even accessing bank accounts
(NAO 2012).
The Responsible Fatherhood project in the US has taken a rather different approach
to increasing maintenance payments. It focussed in improving the employment
outcomes of non-resident parents, which in turn increased their ability to pay. In
contrast, there is insufficient evidence that media campaigns have been successful in
increasing child maintenance payments (Center for the Study of Social Policy 2012).
Another possibility for making collection of child maintenance easier is administration
through the tax system. This is current practice in New Zealand, where 89 per cent of
all child support assessments made since 1992 have been collected, including
through the reciprocal arrangement with Australia (Dunne 2010:57). HM Revenue &
Customs have expressed doubts about the viability of assuming responsibility for this
function (NAO 2012:40), yet there is clear rationale due to the potential effectiveness
in collecting monies and access to earnings and tax records.
The extent to which child maintenance payments reduce poverty levels in different
countries depends on factors such as the overall income of lone parents prior to
receiving maintenance, in terms of both government transfers and earnings, and the
relative level of child maintenance. Unfortunately, data on the cost of collecting
maintenance is not available for many countries (Skinner and Davidson 2009),
therefore making it impossible to recommend the most cost-effective system.

46
Moving the obligation for arranging child maintenance from the state to parents is
likely to be the most cost-effective option in terms of government expenditure. This
shift must be considered alongside recent cuts to legal aid, effectively prohibiting
many poorer parents from accessing the courts. These changes are likely to relieve
pressure on the system and reduce costs. However, they are also likely to reduce the
effectiveness of child maintenance on ameliorating child poverty in the UK.
Child maintenance clearly has the potential to substantially reduce child poverty with
more effective collection of payments. Removing the charges for using the Child
Maintenance Service would be helpful, as these fees are likely to act as a deterrent
to applicants. The effectiveness of maintenance collection could be improved by
giving the Child Maintenance Service greater powers, such as deducting child
maintenance due from earnings, as seen in other countries. However, any
government serious about reducing child poverty should look at guaranteed child
maintenance schemes as they provide financial security to lone parents in poverty.
Summary child maintenance
Rates of collection and receipt of maintenance in the UK compare
unfavourably to other countries.
However, where families do receive child maintenance in the UK there is a
significant positive effect, with the poverty gap reduced by 30 per cent as a
result of payments.
Recent approaches to reform have made child maintenance a more
voluntary/agreed process. Given the potential to reduce child poverty, the
effects of this approach should be closely monitored.
Maintenance collection must become more effective; there are examples of
good practice from overseas.
A return to a system with a free to use state system. Since the upfront fee for
lone parents is £20, this should not be too costly but could be funded through
a combination of taxation and fees. The most recent reform is pushing
separating parents to make private arrangements.
A comparative analysis of the respective cost benefit aspects of the different
child maintenance systems is a major gap in the existing evidence.
47
4.5 Moving (lone) parents into and supporting employment
Work has become the preferred route of policy makers for moving lone-parent
families out of poverty. There has been an international trend towards increasing
conditionality for lone parents, along with sanctions for non-compliance. The range
and generosity of policies to support parents once in work has increased over the
past decades. In this section, we begin by detailing the connections between
employment status and family poverty, reviewing research and policies from the UK
and abroad. We then revisit the notion of conditionality, first mentioned in section 4.2,
with specific reference to the policy initiatives implemented in the UK throughout
recent years. The following section considers in-work benefits, which are integral to
the rights and responsibilities welfare agenda. Finally, we look briefly at childcare
costs and policies. Whilst an in-depth examination of this issue, which is inextricably
linked to family structure, poverty and employment, is beyond the scope of this
paper, it must be mentioned here due to its relevance to the remit of this review.
Employment is a key determinant of income, which is in turn the main criterion by
which poverty is defined. Gregg et al (2009) note that the prevalence of poverty
among lone parent families is largely explained by low employment rates, although
entering work is often not enough for families to exit poverty, as discussed below.
Therefore, the international trend to increase in the levels of conditionality for lone
parents over the past two decades is not surprising. The most recent countries to
introduce stricter work requirements have been Australia and the UK, with Ireland
about to follow suit (Haux 2013 - see Table 4.2 below outlining the employment
requirements for lone parents in the OECD countries).

48
Table 4.2 Employment requirements of lone parents in OECD countries
Approach Countries
General activation
Greece, Hungary, Italy, Korea, Mexico,
Poland, Portugal, Slovakia, Slovenia,
Spain and Turkey.
Activation based on conditions
Belgium, Denmark, Finland,
Netherlands, New Zealand, Sweden
Post maternity leave Some US states and parts of Canada
Early years education Austria, Czech Republic, Germany,
Norway, France, Switzerland
Primary school Australia, Ireland (from 2014),
Luxembourg, UK
Source: Haux, 2013.
A number of reviews of developments in a range of countries have been carried out
recently (see Haux 2013; Finn and Gloster 2010 and Carcillo and Grubb 2006) The
study by Finn and Gloster5 (2010) is in some ways the most interesting as the
authors have included a discussion of success criteria in different countries and
linked those to the focus and availability of evaluations. The authors identify the
following success criteria/ factors, namely ‘caseload and employment impacts,
anticipation and signalling effects, employment quality and retention, earnings, family
income and poverty, effective employment assistance, sanctions, exemptions and
‘disconnected’ families, changes in welfare caseloads, children and family life and
implementation and devolution’ (Finn and Gloster 2010:3-8).
Many of these factors apply to the UK context and have been discussed extensively
elsewhere. Nevertheless, some expected and unexpected factors are worth
highlighting, namely:
5 The Finn and Gloster (2010) report had been commissioned by the Department for Work and
Pensions as part of a broader programme of evaluating the introduction of the 2008 welfare reform (see Kennedy, 2010). All six reports have now been published (Avram et al., 2013; Coleman and Lanceley, 2011; Lane et al., 2011; Casebourne et al., 2010; Gloster et al., 2010).
49
Econometric evaluations: The majority of econometric evaluations are still
carried out in the UK and the US and thus, discussions about the overall
effectiveness of policies are still dominated by policy and literature from those
two countries.
The role of the economy: Research from the US suggests that ‘welfare
reforms that promote employment magnify the impact of the economy when it
is strong and soften its impact during its contractions’ (Finn and Gloster, 2010,
p. 4). This being the case, the introduction of LPO during the recession may
have mitigated the effects of the downturn.
Anticipation and signalling effects: The authors distinguish between an
‘anticipation effect’, i.e. work-ready/able lone parents moving into work before
encountering the reform, and the ‘signalling effect’, which refers to a more
general sense of expectation. There is support for both effects taking place in
some of the evaluation studies (e.g. Avram et al 2013, Haux et al 2012).
Employment retention: Increasing employment obligations tend to lead to an
increase in employment turnover, something that has not been investigated in
the UK since the recent reforms even though labour market churn had been
traditionally high or lone parents in the UK (see Evans et al 2004),
Effect of sanctions: Unsurprisingly, the effect of sanctions has moved up the
political and research agenda (see recent work by Griggs and Evans 2010,
and the new research project by Dwyer 2013). Evidence from the US suggests
that it tends to be the most disadvantaged groups that are likely to be
sanctioned. ‘Positive’ outcomes from this, such as reductions in benefit
caseload, can mask other effects such as an increase in working in the
informal economy and people taking low-paid/ low-skilled jobs, often of short
duration.
Support for those who cannot work: The demographic profile of the welfare
caseload is likely to change over time, as will their service needs. Lone
parents who are furthest away from the labour market likely to constitute the
majority of those on JSA in future.
Impact of reforms on the well-being of children: this aspect has remained
relatively under-researched, though there is suggestion that the negative

50
consequences of the reforms mainly affects adults rather than their children.
However, the qualitative, longitudinal research of Ridge and Millar (2009) does
highlight a certain trade-off for children between more money but less time
with the parent, once a lone parent moved into work.
Better off: policy-makers and researchers have traditionally paid attention to
whether lone parents are better off financially once they have moved into
work.
‘Best approach’: not dissimilar to Carcillo and Grubbs (2006), the authors
suggest ‘the cumulative evidence from the studies reviewed points towards
the effectiveness of a strong employment-focussed ‘message’ delivered
through well-trained case managers, with the flexibility to tailor assistance and
support services, including work-focussed education and training’ (Finn and
Gloster, 2010: 6).
The transfer of lone parents from Income Support to Jobseeker’s Allowance since
2008 has increased lone parents’ economic activity, with estimates that lone parent
Working Tax Credit rates are up by around four percentage points between 2007 and
2011 as a result of the JSA transfers (Avram et al. 2013). Whilst higher labour market
participation is arguably a positive outcome, Whitworth (2012:841-2) highlights three
areas of concern:
1) Transferring lone parents with older children from Income Support to JSA as part
of the LPO has increased lone parent employment, but unemployment has also risen
among this group. Although this is partly technical, as lone parents’ status officially
changed from inactive to active, in the current economic context means much of this
lone parent unemployment may be long-term. Being labelled as unemployed and
pressured to move into paid work in the current labour market and policy context may
result in longer-term unemployment, to the detriment of confidence and motivation.
2) Structural factors remain crucial to lone parent un/employment outcomes,
especially job availability and childcare costs. Behavioural and attitudinal issues are
far less significant, but government policy still downplays geographically situated
structural issues, despite evidence of their importance. Welfare-to-Work helping lone
parents to overcome barriers to employment is welcome, yet where policy problems
51
focus erroneously on behaviour, and conditionality is prescribed as a policy solution
in response, this serves as a diversion from the real causal factors and does little to
help lone parents.
3) Paid work often does not improve the well-being, income levels or security and
stability of lone parents and their families. In the UK, 55 per cent of children currently
in poverty have at least one working parent (see also Jin et al 2011). Dorsett and
Oswald (2014) analysed data from a subsample of 3,500 single mothers who took
part in the Employment and Retention Demonstration, a Randomised Control Trial
constituting the largest social experiment conducted in Britain. Participants were
given in-work support in addition to financial rewards for being in employment.
Compared with the control group, they were found to have lower levels of self-
reported well-being after the intervention finished, despite their incomes exceeding
those of non-participants as a result of their involvement in the programme. Dorsett
and Oswald suggest that benefitting from in-work support and reward payments
could have fostered unrealistic expectations among the treatment group.
Demonstration programmes to improve job retention and advancement for lone
parents have been introduced on both sides of the Atlantic recently. The Employment
Retention and Advancement programme, introduced in the UK under the previous
Labour government, increased the proportion of lone parents working full-time by ten
percentage points and therefore, raised their earnings (Riccio 2013:79).
Furthermore, based on qualitative interviews with benefit recipients, Rolfe (2012)
found that sanctions clearly caused hardship, but this did not seem likely to result in
changed behaviour in the future. By prompting people into work, sanctions may
shorten spells of unemployment, but the longer-term negative effects on job and
earnings progression counteract any gains. Inefficiency in administering sanctions is
also a problem, and while sanctions can reduce benefits expenditure, factors like
spill-over effects on crime rates and higher spending on in-work benefits, offset the
savings (Griggs and Evans 2010).

52
Finally, the relatively poor performance of the Work Programme, launched in 2011,
has not helped to increase the employment rate of lone parents who are further from
the labour market (Whitworth and Griggs 2013:128).
Summary: Lone parents and conditionality
Whiteford and Adema argue that employment needs to be combined with effective
redistribution in order to achieve low child poverty rates. Thus, they propose that
successful anti-poverty strategies should seek a balanced approach combining
improved benefits where necessary and improved incentives to work (2007:4). The
introduction of increased conditionality for lone parents with older children seems to
have had a positive effect on employment despite the difficult economic
circumstances. However, there are indications that those lone parents who have
moved into work are those closest to the labour market and the policies in place to
enable those further away from the labour market, such as the Work Programme,
have been much less effective. Furthermore, the impact of LPO on employment
retention and progression is less clear.
4.5.1 In-work poverty and in-work benefits
Employment cannot guarantee an escape from poverty unless job security, pay and
prospects for progression make work sustainable. These issues are less well-
researched, perhaps as the implications are, politically, anathema to governments
wishing to eschew market regulation and avoid imposing constraints on employers
(Newman 2011:105). Over half of people living in poverty in the UK are now in
families where at least one member is employed (MacInnes et al 2013:26). Most poor
children in the UK live with a working adult and a third of transitions from benefits into
paid employment do not lead to increases in income sufficient to raise the family
above the poverty threshold. Two-thirds of lone parents entering the labour market
take jobs on low pay; their average wages are only marginally higher than the
National Minimum Wage. In-work progression tends to be limited while financial
instability and debt are also problems. 21 per cent of lone parents working full-time
and 27 per cent of those working part-time remain poor (Whitworth and Griggs
2013:132-3).
53
The majority of research on in-work benefits in the UK has focussed on in-work tax
credits. This policy has been reformed on numerous occasions. From 1988 to 1999,
it was known as Family Credit (FC), before being re-launched as the Working
Families' Tax Credit (WFTC). The policy was restructured again in April 2003 (along
with Income Support) as two separate components: the Working Tax Credit (WTC)
and the Child Tax Credit (CTC) (Anderberg 2008b:7). The main aim of these policies
was to incentivise employment among parents by offering tax credits to those in work
with incomes below a certain level, which differs according to the circumstances of
the claimant(s). The amount payable varies by age, family structure and disability,
and there is an additional payment for parents with children in approved childcare.
Money is paid into recipients’ bank accounts every week or four weeks.
Francesconi and van der Klaauw (2008) found that WFTC led to a five per cent
increase in lone mothers working 16 or more hours per week (see also Gregg et al.
2009), most of which was accounted for by full-time employment. This was due to
both labour market entry and retention. The strongest effects observed were for
mothers with one child under the age of five. Lone mothers were less likely to get
married or have children as a result of the reform. WFTC also led to a 35 per cent
increase in the use of paid childcare, again as a result of more mothers being in
employment (Francesconi and van der Klaauw 2008:28-9). Brewer et al (2006:699)
found that without any form of in-work benefit, labour force participation of lone
mothers in the UK would be around 45 per cent, rather than the actual level of 55 per
cent.
Summary
Providing financial incentives to finding and staying in employment, by topping up
otherwise low wages and making childcare both more available and more affordable,
has been successful in increasing the employment rate of lone parents in the UK.
These measures have also had negative consequences for well-being, as seen from
the Employment Retention and Advancement Demonstration study. The effects of
such policies on family structure have been fairly minor. However, evidence on how
these measures have affected poverty rates among lone-parent families remains
scarce.
54
5 CONCLUSIONS
Our investigation has considered links between poverty and family structure, drawing
on international evidence but with a focus on the UK. We have used a ‘two-person’
definition of families, including all households comprising at least two people, related
by blood, marriage or in a cohabiting relationship. As has been reported elsewhere,
the child poverty target for 2020 will be missed (Brewer et al. 2011).
The potential to affect family formation through financial incentives is, at best, limited.
Stafford and Roberts (2009) suggest that evidence is inconclusive, making it
impossible to say whether different welfare systems impact on family structure. The
UK seems to be moving towards introducing more policies affecting family
composition. The married couple allowance has recently been re-introduced and
‘family cap’, limiting the number of children for whom child benefit is paid, been
discussed. The evidence to date suggests that both these interventions are unlikely
to be successful in affecting behaviour.
When looking at poverty levels of families over time, three main patterns emerge.
Firstly, Poverty rates for families with children have decreased over the past 15
years, particularly for lone-parent families and families with three or more children.
However, these two groups are still at greater risk of being in poverty, together with
households from minority ethnic groups and with one disabled adult.
Secondly, the expansion of in-work poverty casts doubts over whether employment is
the panacea. The decline in income security among low income groups has become
more noticeable in recent years. This will be better addressed by Universal Credit
than by current policy arrangements provided that the responsive element of
Universal Credit is effective.
Thirdly, while there is little prior evidence on poverty rates according to sexual
orientation, our analysis has found that marital status seems to have a larger
association with poverty, as cohabiting couples (whether same-sex or opposite-sex)
are more likely to be poor than both married couples and those in civil partnerships.

55
Child maintenance in the UK has a troubled history. Rates of collection and receipt
compare are below those achieved in other countries. However, where families do
receive child maintenance in the UK there is a significant positive effect in terms of
poverty reduction (see Skinner and Davidson 2009; Hakovitra 2011). We therefore
suggest that investing in this form of support for families would greatly assist the fight
against poverty, and have cited examples of good practice for giving the new Child
Maintenance Service additional powers to collect monies owed. Recent reforms have
made child maintenance a more voluntary process, encouraging agreement between
the two parties. The government is shifting responsibility for reaching settlements to
the individuals in question. In this context, it will be hard to pull child maintenance up
the policy agenda. Nevertheless, we advocate a return to a free to use state system,
and a review of methods to improve efficiency.
The final area considered in the report was that of lone parents and employment.
Increased conditionality for lone parents with older children seems to have had a
positive effect on employment despite difficult economic circumstances. However,
there are indications that lone parents who have entered work were already close to
the labour market. Policies aimed at finding employment for those further away from
the labour market, such as the Work Programme, have been much less effective.
Furthermore, the impact of LPO on employment retention and progression is less
clear. Providing a financial incentive to employment by topping up low wages and
making childcare both more available and more affordable could be successful in
further increasing the employment rate of lone parents in the UK. For more specific
policy proposals of employment and childcare, we direct readers to the relevant
reviews.
In conclusion, the following policy areas are critical factors in the relationship
between family structure and poverty:
Relative value of child-related benefits
Child Maintenance receipt
Pay progression for (lone) parents in work, and ALMP for lone parents out of
paid work.
56
Cost and availability of childcare
Employment security and (in)stability of incomes
Policies aiming to change the composition of families are less likely to be effective,
or, at least, have not been reliably demonstrate to be effective.
Measures to make child maintenance arrangements more personal will lead to
untapped anti-poverty potential. However extending access to free childcare, and the
introduction of Universal Credit should to some extent address issues of increasing
income insecurity.

57
REFERENCES
Aber, L., Morris, P. and Raver, C. (2012) ‘Children, Families and Poverty: Definitions,
Trends, Emerging Science and Implications for Poverty’ Social Policy Report
Vol. 26 [3].
Anderberg, D. (2008a) ‘Tax Credits, Income Support, and Partnership Decisions’,
International Tax and Public Finance 15: 499-526.
Anderberg, D. (2008b) ‘Welfare reform: The impact on partnership formation’.
Research in Public Policy 7, pp7-9.
Anderberg, D., Kondylis, F. and Walker, I. (2008) ‘Partnership Penalties and Bonuses
Created by UK Welfare Programs’, CESifo Economic Studies 54 pp 1-21.
Arnold, C., Conway, T. and Greenslade, M. (2011) Cash transfers: Literature Review.
London: Department for International Development.
Avram, S., Brewer, M., Salvatori, A. (2013) Lone Parent Obligations: an impact
assessment: report, DWP research report 845, Leeds: CDS.
Barker, N. and Lamble, S. (2009) ‘From social security to individual responsibility:
sanctions, conditionality and Punitiveness in the Welfare Reform Bill 2009
(Part One)’ Journal of Social Welfare & Family Law Vol. 31 [3] pp321–332.
Beaumont, J. (2011) Households and families: Social trends 41. Office for National
Statistics
Bhrolcháin, M. N., and Sigle-Rushton, W (2005) ‘Partner Supply in Britain and the
US.’ Population, vol. 60 [1] pp. 37-64.
Bhrolcháin, M.N., Wilson, T. and Sigle-Rushton, W. (2002) ‘Local marriage markets
in Great Britain: how diverse?’ Population Trends, vol. 109, pp. 27-35.
Bradshaw, J. (2005) ‘Child poverty and deprivation’ in J. Bradshaw and E. Mayhew
(eds.) The Well-being of Children in the UK. London: Save the Children, pp
35-64.
Bradshaw, J. (2006) ‘Child support and child poverty’ Benefits Vol. 14 [3] pp199–208.
Bradshaw, J. (2013) Consultation on Child Poverty Measurement. PSE policy
response working paper, No. 8.

58
Bradshaw, J. and Finch, N. (2002) A comparison of child benefit packages in 22
countries. DWP research report 174. Leeds: CDS.
Bradshaw, J. and Tokoro, M. (2013) ‘Child benefit Packages in the United Kingdom
and Japan’ Social Policy and Society.
Brewer, M., Browne, J. and Joyce, R. (2011) Child and Working-Age Poverty from
2010 to 2020, IFS Commentary C121, London: Institute for Fiscal Studies.
Brewer, M., Duncan, A., Shephard, A. and Jose Suarez, M. (2006) ‘Did working
families’ tax credit work? The impact of in-work support on labour supply in
Great Britain’ Labour Economics Vol. 13 [6] pp699-720
Bruce, S. and Yearly, S. (eds) (2006) Sage Dictionary of Sociology, Sage: London.
Bryson, C., Skipp, A., Albeson, J., Poole, E., Ireland, E and Marsh, V. (2013) Kids
aren’t free: The child maintenance arrangements of single parents on benefit
in 2012, London: Nuffield Foundation, Gingerbread, BrysonPurdon Social
Research and NatCen.
Carcillo, S. and Grubb, D. (2006) ‘From inactivity to work: the role of active labour
market policies’ OECD Social Employment and Migration Working Papers, no.
6. Paris: Organisation for Economic Co-operation and Development.
Casebourne, J., Davis, M., Foster, S., Lane, P., Purvis, A. and Whitehurst, D. (2010)
Lone Parent Obligation: destinations of single parents after Income Support,
Department for Work and Pensions Research report no710, London: DWP.
Center for the Study of Social Policy (2012) Encouraging Strong Family
Relationships, Brief No. 6.
Chalabi, M. (2013) ‘How many parents are really paying child maintenance?’ The
Guardian, 16th May 2013. Available at:
http://www.theguardian.com/news/datablog/2013/may/16/parents-paying-child-
maintenance-csa-statistics [accessed on 25.1.2014].
Chambers, D. (2012) A sociology of family life: Change and diversity in intimate
relationships, Cambridge: Polity.
Chzhen, Y. and Bradshaw, J. (2012) ‘Lone parents, poverty and policy in the
European Union’ Journal of European Social Policy Vol. 22 [5] pp487-506
59
Coleman, N. and Lanceley, L. (2011). Lone Parent Obligations: supporting the
journey into work. Department for Work and Pensions Research report no 736,
London: DWP.
Collishaw, S., Goodman, R., Pickles, A., and Maughan, B. (2007) ‘Modelling the
contribution of changes in family life to time trends in adolescent conduct
problems’ Social Science and Medicine Vol. 65 [12] pp2576–2587
Corlyon, J., Stock, L., Gieve, M. and Castellanos Serrano, C. (forthcoming) Personal
relationships and poverty: An evidence and policy review, York: JRF.
CPAG (2013) Universal Credit: What you need to know, London: Child Poverty
Action Group.
Crawford, C., Goodman, A., and Greaves, E. (2013) ‘Cohabitation, marriage, relationship
stability and child outcomes: final report’, IFS report R87, London, IFS.
Crawford, C., Goodman, A., Greaves, E., and Joyce, R. (2011). Cohabitation,
marriage, relationship stability and child outcomes: an update. IFS
Commentary C120, London, IFS.
De’ath, E. (1994) ‘When parents separate – having two homes’ in T. David (ed.)
Working Together for Young Children: Multi-professionalism in action.
London: Routledge, pp93-103
Deaton, A. (1997). The analysis of household surveys: a microeconometric approach
to development policy. World Bank Publications.
Department for Work and Pensions (2002), Households Below Average Income
1994/95-2000/01. Leeds: Corporate Document Services.
Department for Work and Pensions (2012) Separated families and child maintenance
arrangements, Great Britain 2011, London: DWP.
Department for Work and Pensions (2013a) Households Below Average Income.
London: DWP
Department for Work and Pensions (2013b) Percentage of child maintenance
collected over time, London: DWP.
Department for Work and Pensions (2013c) Preparing for the future, tackling the
past: Child maintenance – Arrears and Compliance. London: DWP
60
Dex, S. and Hawkes, D. (2004) ‘Household Structure and Characteristics’ in S. Dex
and H. Joshi (eds.) Millennium Cohort Study First Survey: A User’s Guide to
Initial Findings. London: Centre for Longitudinal Studies, Institute of Education,
pp19-34
Dorsett, R. and Oswald, P. (2014) Human Well-being and in-work benefits: A
randomised control trial. London: National Institute of Economic and Social
Research, Discussion Paper No. 424
Dunne, P. (2010) Supporting Children: A Government discussion on updating the
child support scheme. Wellington: Inland Revenue
Dwyer, P. (2004) ‘Creeping Conditionality in the UK: From Welfare Rights to
Conditional Entitlements?’ Canadian Journal of Sociology Vol. 29 [2] pp265-
287
Dwyer, P. (2013) Sanctions, support and behaviour change: understanding the role
and impact of welfare conditionality, ESRC grant announcement. Available at:
http://www.esrc.ac.uk/my-esrc/grants/ES.K002163.1/read [accessed on
25.1.2014]
Ermisch, J. and Francesconi, M. (2000) ‘The increasing complexity of family
relationships: lifetime experience of lone motherhood and stepfamilies in Great
Britain’. European Journal of Population, 16, 235-249
European Commission (2008) Child poverty and the well-being of children in the EU.
Eurostat (2013) Children were the age group at the highest risk of poverty or social
exclusion in 2011. Available
at:http://epp.eurostat.ec.europa.eu/cache/ITY_OFFPUB/KS-SF-13-004/EN/KS-SF-
13-004-EN.PDF [accessed on 10.11.2013]
Falkingham, J., Evandrou, M and Vlachantoni, A. (forthcoming) Exploring the link between
demographic change and poverty in the UK, York: JRF.
Fehlberg, B., and Smyth, B. with Maclean, M. and Roberts, C. (2011) Caring for children
after parental separation: would legislation for shared parenting time help children?
Family Policy Briefing 7, Oxford: University of Oxford.
Ferri, E. and Smith, K. (1997) Family Breakdown and Family Conflict: The NCDS cohort as
parents. NCDS User Group Working Paper 49

61
Finn, D. and Gloster, R. (2010) Lone parent obligations: Early findings of
implementation as well as experiences of the Income Support and Jobseeker’s
Allowances regimes, DWP research report no. 645, Leeds: CDS
Fiszbein, A. and Schady, N. (2009) Conditional cash transfers: reducing present and
future poverty. Washington DC: World Bank
Francesconi, M. and van der Klaauw, W. (2007) ‘The Socioeconomic Consequences
of "In-Work" Benefit Reform for British Lone Mothers’ Journal of Human
Resources Vol. 42 [1] pp1-31
Gloster, R., Casebourne, J., Culshaw, S., Marva, L., O’Donnell, A. and Purvis, A.
(2010) Single Parent Obligations: early findings of implementation as well as
experiences of the Income Support and Jobseeker’s Allowances regimes,
Department for Work and Pensions research report no. 645, London: DWP.
Goulden, C. (2012) Work is the Best Route Out of Poverty – Half the Time. Available
online at http://www.jrf.org.uk/blog/2012/10/work-best-route-out-poverty
Gov.uk (2013) Arrange child maintenance: the Child Maintenance Service and Child
Support Agency. Available at: https://www.gov.uk/child-maintenance/overview
[Accessed on 2.1.2014]
Grabham, E. and Smith, J. (2010) ‘From social security to individual responsibility:
Writing off poor women’s work in the Welfare Reform Act 2009 (Part Two)’
Journal of Social Welfare & Family Law Vol. 32 [1] pp81-93
Grandparents Plus (2009) Rethinking family life.
Gregg, P., Harkness, S. and Smith, S. (2009), ‘Welfare Reform and Lone Parents in
the UK’. The Economic Journal vol. 119: F38–F65.
Griggs, J. (2009) The Poor Relation? Grandparental care: where older people’s
poverty and child poverty meet. London: Grandparents Plus
Griggs, J. (2010) Protect, Support, Provide: Examining the role of grandparents in
families at risk of poverty. London: Grandparents Plus
Griggs, J. and Evans, M. (2010) Sanctions within conditional benefit systems: a
review of evidence. York: JRF

62
Hakovirta, M. (2011) ‘Child maintenance and child poverty: a comparative analysis’
Journal of Poverty and Social Justice Vol. 19 [3] pp249–62
Harkness, S., Gregg, P. and MacMillan, L. (2012) Poverty: The role of institutions,
behaviours and culture. York: JRF
Haux, T. (2013) ‘Understanding employment barriers for lone parents in Great Britain:
Research gaps and missed opportunities’ in I. Greener and B. Greve (eds)
Evidence and evaluation in Social Policy. Oxford: Wiley Blackwell.
Hirsch, D. (2008) What Is Needed To End Child Poverty in 2020? York: JRF.
HM Government (2012) Measuring Child Poverty: A consultation on better measures
of child poverty. London: The Stationery Office
Holtermann, S., Brannen, J., Moss, P. and Owen, C. (1999) Lone Parents and the
Labour Market: Results from the 1997 Labour Force Survey and Review of
Research, Employment Service Research Report no. 23, Sheffield.
Jin, W., Joyce, R., Phillips, D. and Sibieta, L. (2011), Poverty and Inequality in the
UK: 2011, Commentary 118, London: Institute for Fiscal Studies
Johannsen, J., Tejerina, L. and Glassman, A. (2009) Conditional Cash Transfers in
Latin America: Problems and Opportunities. Washington DC: Inter-American
Kearney, M. (2004) Is There an Effect of Incremental Welfare Benefits on Fertility
Behavior?: A Look at the Family Cap. Journal of Human Resources XXXIX:
295-325; doi:10.3368/jhr.XXXIX.2.295.
Knijn, T., Martin, C., and Millar, J. (2007). Activation as a common framework for
social policies towards lone parents. Social Policy & Administration, 41(6),
638-652.
Lane, P., Casebourne, J., Lanceley, L. and Davis, M. (2011) Lone Parent Obligation:
childcare and the Jobseeker’s regime, Department for Work and Pensions
research report no. 782, London: DWP.
Laroque, G. and Salanie, B. (2008) Does Fertility Respond to Financial Incentives?
Discussion Paper No. 3575. Bonn: Ideas
MacInnes, T., Aldridge, H. Bushe, S., Kenway, P. and Tinson, A. (2013) Monitoring
Poverty and Social Exclusion 2013. York: Joseph Rowntree Foundation

63
McKay, S. (2013) ‘Policy Briefing: Agency and the Child Support Agency’ Discover
Society, Issue 2. Available at: http://www.discoversociety.org/policy-briefing-
agency-and-the-child-support-agency/ [accessed on 25.1.2014]
Millar, J. (2001) ‘Work-related activity requirements and labour market programmes
for lone parents’, in Millar, J. and Rowlingson, K. (eds.) Lone parents,
employment and social policy, Bristol: Policy Press, chapter 10, pp. 189 – 210.
Millar, J, and Rowlingson, K. (eds) (2001) Lone parents, employment and social
policy. Bristol: Policy Press.
Millar, J. and Ridge, T. (2001) Families, poverty, work and care: A review of the
literature on lone parents and low income couple families with children,
Department for Work and Pensions research report no. 153, Leeds: CDS.
Millar, J., and Ridge, T. (2009). Relationships of Care: Working Lone Mothers, their
Children and Employment Sustainability. Journal of Social Policy, 38(01), 103-
121.
Mutual Learning Programme (2010) Pathways to Work for Lone Parents. Available
at: http://www.mutual-learning-
employment.net/index.php?mact=PeerReviews,cntnt01,detail,0&cntnt01option
s=105&cntnt01orderby=start_date%20DESC&cntnt01returnid=59&cntnt01item
_id=80&cntnt01returnid=59 [accessed on 8.4.2013]
National Audit Office (2012) Department for Work and Pensions: Child Maintenance
and Enforcement Commission: Cost Reduction. London.
Newman, I. (2011) ‘Work as a route out of poverty: a critical evaluation of the UK
welfare to work policy’ Policy Studies Vol. 32 [2] pp.91-108
O’Connor, H. and Goodwin, J. (2013) ‘Beyond ‘average’ family life: a secondary
analysis of atypicality in 1960s families’ Families, Relationships and Societies
vol. 2 [2] pp299–308
OECD (2001) Employment Outlook 2001. Paris: OECD
OECD (2002) Babies and bosses: reconciling work and family life: Volume 1:
Australia, Denmark and The Netherlands, Paris: OECD.
OECD (2003) Babies and bosses: reconciling work and family life: Volume 2: Austria,
Ireland and Japan, Paris: OECD.
64
OECD (2004) Babies and bosses: reconciling work and family life: Volume 3: New
Zealand, Portugal and Switzerland, Paris: OECD.
OECD (2005) Babies and bosses: reconciling work and family life: Volume 4:
Canada, Finland, Sweden and the UK, Paris: OECD.
OECD (2007) Babies and bosses: reconciling work and family life: A synthesis of
findings for OECD countries, Paris: OECD.
OECD (2011) Doing better for families, Paris: OECD.
Office for National Statistics (2010) Social Trends 40.
Office for National Statistics (2012) Lone parents with dependent children. Available
at: http://www.ons.gov.uk/ons/dcp171780_251303.pdf [accessed on
1.11.2013]
Office for National Statistics (2012) Statistical Bulletin: Families and Households.
Available online at: http://www.ons.gov.uk/ons/rel/family-demography/families-
and-households/2012/stb-families-households.html
Office for National Statistics (2013) An overview of 40 years of data (General
Lifestyle Survey Overview - a report on the 2011 General Lifestyle Survey).
Available at: http://www.ons.gov.uk/ons/dcp171776_302655.pdf (accessed
11.04.2014)
Ray, K., Sissons, P., Jones, K. and Vegeris, S. (forthcoming) Employment, pay and
poverty: Evidence and policy review. York: JRF.
Riccio, J. (2013) ‘New evidence and new directions for promoting labour market
advancement for low and modest earners’ The squeezed middle: The
pressure on ordinary workers in America and Britain. Bristol: Policy Press.
Riccio, J., Dechausay, N., Miller, C., Nuñez, S., Verma, N., Yang, E. (2013a)
Conditional Cash Transfers in New York City: The Continuing Story of the
Opportunity NYC−Family Rewards Demonstration. New York: MDRC
Riccio, J., Dechausay, N., Miller, C., Nuñez, S., Verma, N., Yang, E. (2013b)
Conditional Cash Transfers in New York City: The Continuing Story of the
Opportunity NYC−Family Rewards Demonstration, Supplementary
Appendices. New York: MDRC

65
Rolfe, H. (2012) ‘Requiring The Long-Term Unemployed to Train: Is Benefit
Conditionality Effective?’ National Institute Economic Review Vol. 219 [1] R65-
R76
Scott, G. (2008) 'Gender, poverty and wealth', in Ridge, T. and Wright, S. (eds)
Understanding Inequality, poverty and wealth, Bristol: Policy Press.
Selwyn, J. and Nandy, S. (2012) ‘Sibling kinship carers in England: Evidence from
the 2001 UK population census’ Children and Youth Services Review Vol. 34
[1] pp194–199
Shildrick T; MacDonald R; Webster C; Garthwaite K (2012) Poverty and Insecurity:
Life in low-pay, no-pay Britain. Bristol: Policy Press.
Skinner, C. and Davidson, J. (2009) ‘Recent Trends in Child Maintenance Schemes
in 14 Countries’ International Journal of Law, Policy and the Family Vol. 23 [1]
pp25-52
Social Mobility and Child Poverty Commission (2013) State of the Nation 2013:
Social Mobility and Child Poverty in Great Britain, London.
Social Protection Committee (2013) Social policy reforms for growth and cohesion:
Review of recent structural reforms 2013. Luxembourg: Publications Office of
the European Union
Stafford, B. and Roberts, S. (2009) The impact of financial incentives in welfare
systems on family structure. DWP Research Report No. 569. London:
Department for Work and Pensions
US Census Bureau (2011) Available online at:
http://www.census.gov/hhes/www/income/about/faqs.html
Waldfogel, J. (2013) Britain’s War on Poverty, London: Russell Sage Foundation.
Whiteford, P. and Adema, W. (2007) What Works Best in Reducing Child Poverty: A
Benefit or Work Strategy? OECD Social, Employment and Migration Working
Papers No. 51. Paris: OECD
Whitworth, A. (2012) ‘Lone Parents and Welfare-to-Work in England: A Spatial
Analysis of Outcomes and Drivers’ Social Policy & Administration Vol. 47 [7]
pp826–845
66
Whitworth, A. and Griggs, J. (2013) ‘Lone Parents and Welfare-to-work
Conditionality: Necessary, Just, Effective?’ Ethics and Social Welfare Vol. 7 [2]
pp124-140