Embed Size (px)
Citation preview

Loyola University Chicago Loyola University Chicago
Loyola eCommons Loyola eCommons
Dissertations Theses and Dissertations
1989
Family Characteristics, Subjective Daily Experience and Academic Family Characteristics, Subjective Daily Experience and Academic
Performance in Early Adolescence Performance in Early Adolescence
Carla M. Leone Loyola University Chicago
Follow this and additional works at: https://ecommons.luc.edu/luc_diss
Part of the Psychology Commons
Recommended Citation Recommended Citation Leone, Carla M., "Family Characteristics, Subjective Daily Experience and Academic Performance in Early Adolescence" (1989). Dissertations. 2647. https://ecommons.luc.edu/luc_diss/2647
This Dissertation is brought to you for free and open access by the Theses and Dissertations at Loyola eCommons. It has been accepted for inclusion in Dissertations by an authorized administrator of Loyola eCommons. For more information, please contact [email protected].
This work is licensed under a Creative Commons Attribution-Noncommercial-No Derivative Works 3.0 License. Copyright © 1989 Carla M. Leone

FAMILY CHARACTERISTICS, SUBJECTIVE DAILY EXPERIENCE
AND ACADEMIC PERFORMANCE IN EARLY ADOLESCENCE
by
Carla M. Leone
A Dissertation Submitted to the Faculty of the Graduate School
of Loyola University of Chicago in Partial Fulfillment
of the Requirements for the Degree of
Doctor of Philosophy
August
1989

ACKNOWLEDGEMENTS
Completing this dissertation represents the ful
fillment of a very special and important goal for me.
The people who helped me do so are therefore special and
important to me as well; their contributions are per
manently reflected in the final manuscript, in my per
sonal and professional identity, and in my memory.
Most of all, I would like to thank Dr. Joseph
Durlak, the chairperson of my dissertation committee, my
academic advisor, professional mentor, and friend. His
commitment to community psychology and to the scientist
practitioner model of clinical psychology, as well as
his talent for teaching, have had a major impact on my
development as a psychologist. As dissertation chair,
he provided valuable scholarly guidance in all aspects
of the project, from the big picture to the minutia,
along with liberal amounts of energy, patience, humor,
and confidence in me, all of which I greatly appreciate.
I would also like to thank committee members Dr.
Reed Larson and Dr. Maryse Richards, for access to their
rich and fascinating data set and for their considerable
help in making sense of it. I am especially grateful to
Dr. Larson for his creative conceptual and statistical
guidance and for his very generous commitment of time,
ii

energy, patience and emotional support, which extended
far beyond the call of committee-member duties. I also
especially thank Dr. Richards for her helpful scholarly
comments, for providing me with an impressive female
psychologist role model, and for her inspiring energy
and enthusiasm. In addition, thanks are extended to the
schools and students who participated in the project, to
or. Bernard Dugoni for statistical consultation, and to
the other members of the Young Adolescent Study (YAS)
research team for their contributions both to the over
all project and to my mental health.
Finally, I greatly appreciate the support and
patience of my family and friends, especially disserta
tion-mate Shelly Tucker, who shared the dissertation
journey with me from start to finish. Last but far from
least, special thanks to Denise Lensky for the friend
ship and laughter that helped get me through all five
years of graduate school, up to and including this final
step.
iii

VITA
The author, Carla Marie Leone, is the daughter of
Ms. Carla Connell and Mr. Richard R. Leone. She was
born on July 9, 1960, in Weymouth, Massachusetts.
Ms. Leone's elementary and secondary education was
obtained in the public schools of Weymouth, Massachu
setts; she graduated from Weymouth North High School in
June, 1978. Her first two years of undergraduate educa
tion were completed at Shenandoah Conservatory of Music
in Winchester, Virginia, where she majored in Music
Therapy. Her remaining undergraduate work was completed
at Lesley College in Cambridge, Massachusetts, where she
earned the Bachelor of Science degree in Education in
May, 1982.
Prior to graduate school, Ms. Leone was employed
for two years as a high school special education
teacher. In August of 1984 she entered the doctoral
program in clinical psychology at Loyola University of
Chicago, where she earned the Master of Arts degree in
Psychology in May, 1987. She was granted a Schmitt
Dissertation Fellowship for the following year, enabling
her to complete the dissertation in September of 1988.
After completing a clinical internship during 1988-89,
she earned the doctorate degree in August of 1989.
iv
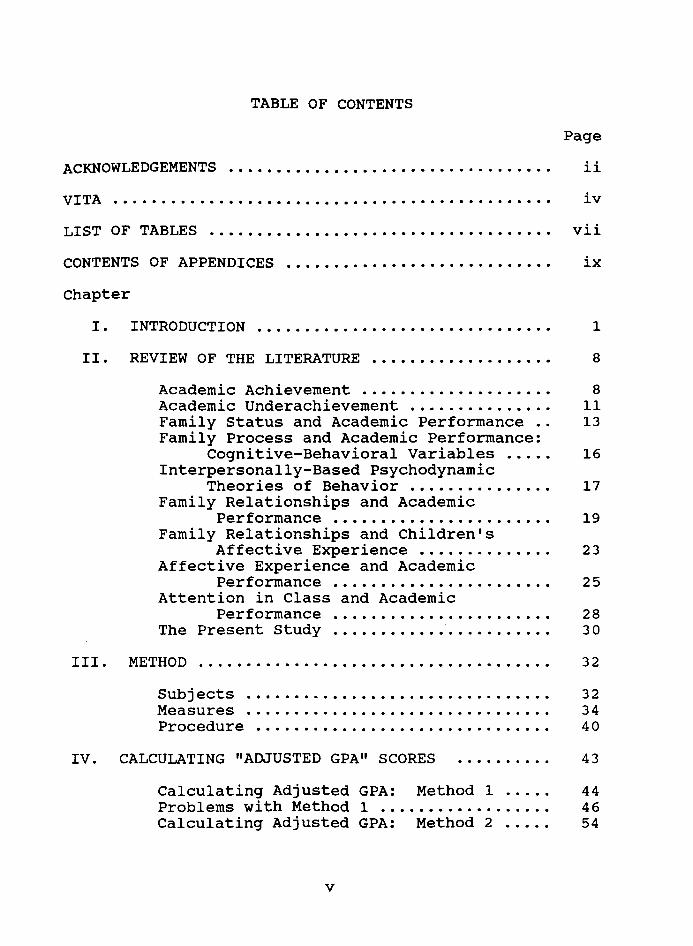
TABLE OF CONTENTS
Page
ACKN'OWLEDGEMENTS • • • • • • • • • • • • • • • • • • • • • • • • • • • • • • • • • • ii
VITA . . . . . . . . . . . . . . . . . . . . . . . . . . . . . . . . . . . . . . . . . . . . . . iv
LIST OF TABLES ..............................•..... vii
CONTENTS OF APPENDICES ............••.............. ix
Chapter
I. INTRODUCTION . . . . . . . . . . . . . . . . . . . . . . . . . . . . . . . 1
II. REVIEW OF THE LITERATURE ................... 8
III.
Academic Achievement .................... 8 Academic Underachievement............... 11 Family Status and Academic Performance.. 13 Family Process and Academic Performance:
Cognitive-Behavioral Variables ..... 16 Interpersonally-Based Psychodynamic
Theories of Behavior............... 17 Family Relationships and Academic
Performance . . . . . . . . . . . . . . . . . . . . . . . 19 Family Relationships and Children's
Affective Experience.............. 23 Affective Experience and Academic
Performance . . . . . . . . . . . . . . . . . . . . . . . 2 5 Attention in Class and Academic
Performance . . . . . . . . . . . . . . . . . . . . . . . 28 The Present Study....................... 30
METHOD 32
Subjects . . . . . . . . . . . . . . . . . . . . . . . . . . . . . . . . 3 2 Measures . . . . . . . . . . . . . . . . . • . . . . . . . . . . . . . . 3 4 Procedure . . . . . . . . . . . . . . . . . . . . . . . . . . . . . . . 4 o
IV. CALCULATING "ADJUSTED GPA" SCORES 43
Calculating Adjusted GPA: Method 1 ..... 44 Problems with Method 1 .....•............ 46 Calculating Adjusted GPA: Method 2 ..... 54
v
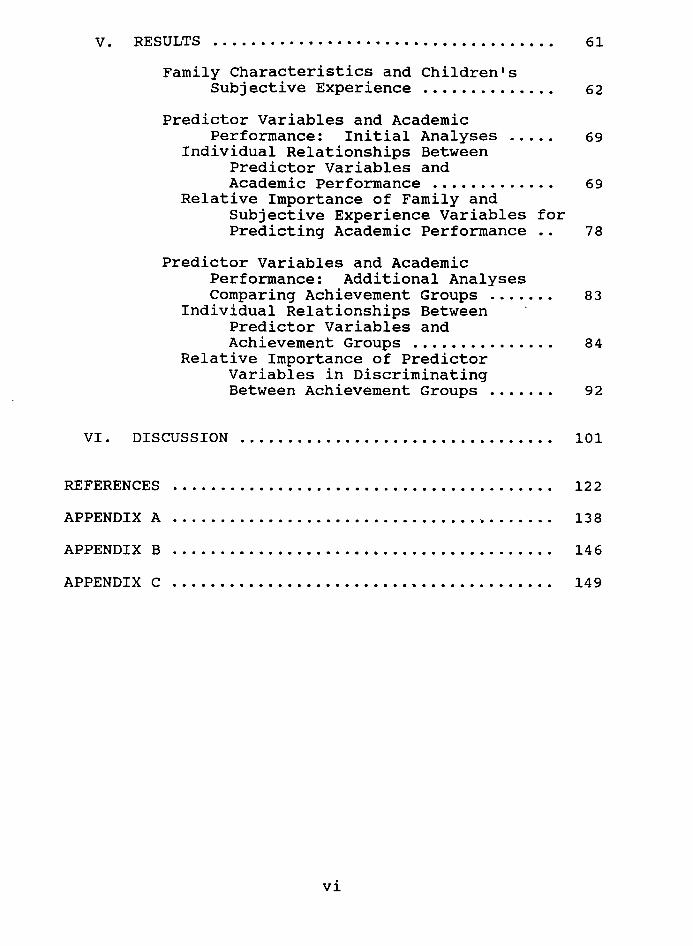
V. RESULTS ....... · · • • · · · · · · · · · . . . . . . . . . . . . . . . . 61
Family Characteristics and Children's Subjective Experience.............. 62
Predictor Variables and Academic Performance: Initial Analyses ..... 69
Individual Relationships Between Predictor Variables and Academic Performance ............. 69
Relative Importance of Family and Subjective Experience Variables for Predicting Academic Performance 78
Predictor Variables and Academic Performance: Additional Analyses Comparing Achievement Groups....... 83
Individual Relationships Between Predictor Variables and Achievement Groups ............... 84
Relative Importance of Predictor Variables in Discriminating Between Achievement Groups ....... 92
VI. DISCUSSION . . . . . . . • . . . . . . . . . . . . . . . . . . . . . . . . . 101
REFERENCES 122
APPENDIX A 138
APPENDIX B 146
APPENDIX C 149
vi

LIST OF TABLES
Table Page
1. Regression of Achievement Test Scores on Actual GPA (Method 1) . . . . . . . . . . . . . . . . . . . . . . . . 4 5
2. Actual GPA, Achievement Test Scores, and Adjusted GPA (Method 1) Scores by Gender 48
3. Actual GPA, Achievement Test Scores, and ·Adjusted GPA (Method 1) Scores by Grade..... 49
4. Actual GPA, Achievement Test Scores, and Adjusted GPA (Method 1) Scores by School 50
5. Regression of Achievement Test Scores, Grade, Sex, and School on Actual GPA (Method 2) 56
6. Frequency Distribution of Adjusted GPA (Method 2) Group by Achievement Test Quartile . . . . . . . . . . . . . . . . . . . . . . . . . . . . . . . . . . . . 58
7. Frequency Distribution of Adjusted GPA (Method 2) Group by Actual GPA Group........ 60
8. Correlations Between Parental Education and Children's Subjective Experience ........ 63
9. Children's Subjective Experience by Parental Marital Status ..................... 64
10. Correlations Between Family Relationships and Children's Subjective Experience........ 65
11. Correlations Between Predictor Variables and Achievement Variables by Gender......... 71
12. Children's Actual and Adjusted GPAs by Gender and Parental Marital Status .......... 72
13. Step-wise Regression of Family Variables, Subjective Experience Variables and Control Variables on Girls' Actual GPA.............. 80
vii

14. Step-wise Regression of Family Variables, subjective Experience Variables and Control variables on Boys' Actual GPA............... 81
15. Parental Education by Children's Adjusted GPA Group . . . . . . . . . . . . . . . . . . . . . . . . . . 86
16. Family Relationships by Children's Adjusted GPA Group . . . . . . . . . . . . . . . . . . . . . . . . . . 88
17. Subjective Experience by Adjusted GPA Group • . . . . . • . . • . • . • . . . . • • • . . . . • . . . . . • . . • 91
18. Results of Discriminant Analysis Using Family and Subjective Experience Variables to Predict Boys' Adjusted GPA Groups ........ 94
19. Classification Results Using Above Equation to Predict Boys' Adjusted GPA Groups . . . . . . . • . . • • . . • • . • . • . . . . . . . . . . . . . • 95
20. Results of Discriminant Analysis Using Family and Subjective Experience Variables to Predict Girls' Adjusted GPA Groups ....... 96
21. Classification Results Using Above Equation to Predict Girls' Adjusted GPA Groups . . . . . . . . . . . . . . . . . . . . . . . . . . . . . . . . . . 9 7
viii

CONTENTS FOR APPENDICES Page
APPENDIX A Copies of Measures 138
I. Parent Questionnaire ..................... 139
II. Family Environment Scale: Cohesion, Conflict and Expressiveness Subscales 143
III. Experience Sampling Method Self-report Questionnaire .•.............. 145
APPENDIX B Means and Standard Deviations of Study Variables .................... 147
APPENDIX C Correlations Between Achievement Variables and Subjective Experience With Different Companions ............. 150
ix
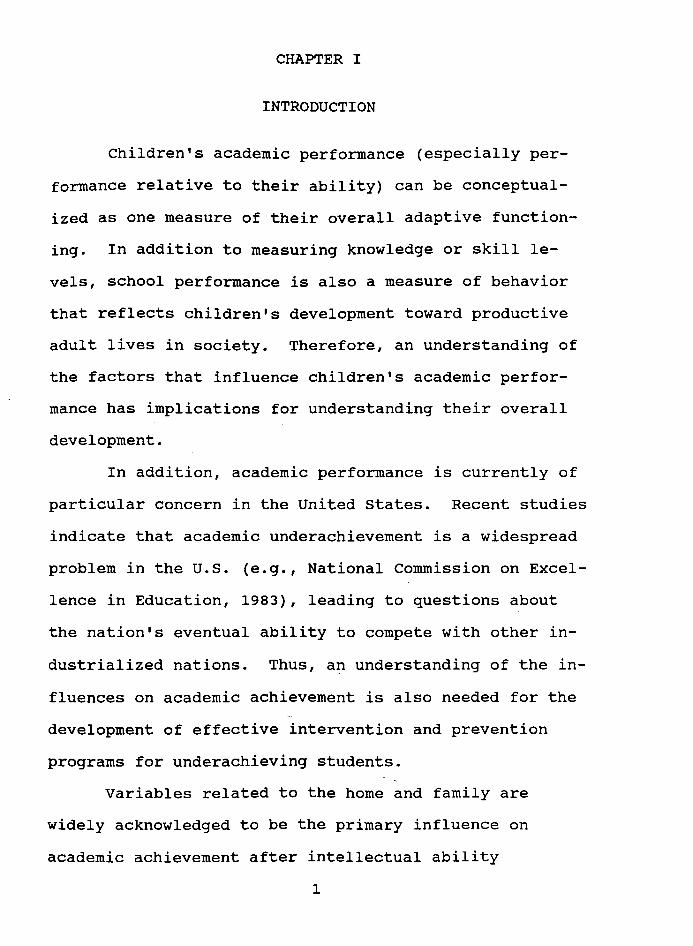
CHAPTER I
INTRODUCTION
Children's academic performance (especially per
formance relative to their ability) can be conceptual
ized as one measure of their overall adaptive function
ing. In addition to measuring knowledge or skill le
vels, school performance is also a measure of behavior
that reflects children's development toward productive
adult lives in society. Therefore, an understanding of
the factors that influence children's academic perfor
mance has implications for understanding their overall
development.
In addition, academic performance is currently of
particular concern in the United States. Recent studies
indicate that academic underachievement is a widespread
problem in the U.S. (e.g., National Commission on Excel
lence in Education, 1983), leading to questions about
the nation's eventual ability to compete with other in
dustrialized nations. Thus, an understanding of the in
fluences on academic achievement is also needed for the
development of effective intervention and prevention
programs for underachieving students.
Variables related to the home and family are
widely acknowledged to be the primary influence on
academic achievement after intellectual ability
1

(Coleman, 1966; Parkerson, Lomax, Schiller & Wahlberg,
1984). However, despite several decades of research on
the relationship between the home and school perf or
mance, the specific nature of this relationship remains
un-clear, leaving appropriate interventions for under
achieving students unclear as well.
2
Research in this area has recently begun to move
beyond the study of family "status" variables
(Bronfenbrenner, 1986), such as family socioeconomic
status or parental marital status, to identifying speci
fic aspects of family interaction or "process" that may
influence achievement more directly. While recent
studies of family process variables are promising
(Fotheringham & Creal, 1980; Hess, Holloway, Dickson, &
Price, 1984), a number of questions remain regarding the
potential influence of various aspects of family inter
action on children's performance.
First, many studies have focused only on aspects
of family process that are overtly relevant to achieve
ment, such as the "educational environment of the home"
(Fotheringham & Creal, 1980), parental school-related
attitudes and expectations (Eccles, 1983), "achievement
press" (Marjoribanks, 1979a), etc., most of which are
based on cognitive or cognitive-behavioral theories of
development. In contrast, less is known about the po
tential influence of the aspects of family interaction

emphasized by psychodynamic theories (Kohut, 1977;
winnicott, 1965), such as the affective.quality of
family relationships.
Moreover, the few studies of the latter variables
have typically focused specifically on the parent-child
relationship. However, interpersonally-based psycho
dynamic theories predict that other significant rela
tionships also influence children as they grow older
(Kohut, 1980). Therefore, the affective quality of re
lationships in the family as a whole would also be ex
pected to influence children's development and thus
their academic performance; however, this prediction
has rarely been empirically investigated.
3
Second, while previous literature has documented a
relationship between family process variables and aca
demic performance, the specific mechanisms through which
this link operates remain unclear. Specifically, how do
family relationships affect children so as to then af
fect their grades or achievement test scores? In a re
cent review of the literature, Emery (1982) concluded
that little evidence exists regarding this question and
called for additional investigation in this area.
Recent developments in psychodynamic theory (e.g.,
Kohut, 1977) appear to hold promise for better under
standing the link between family relationships and
children's behavior. Interpersonally-based theories
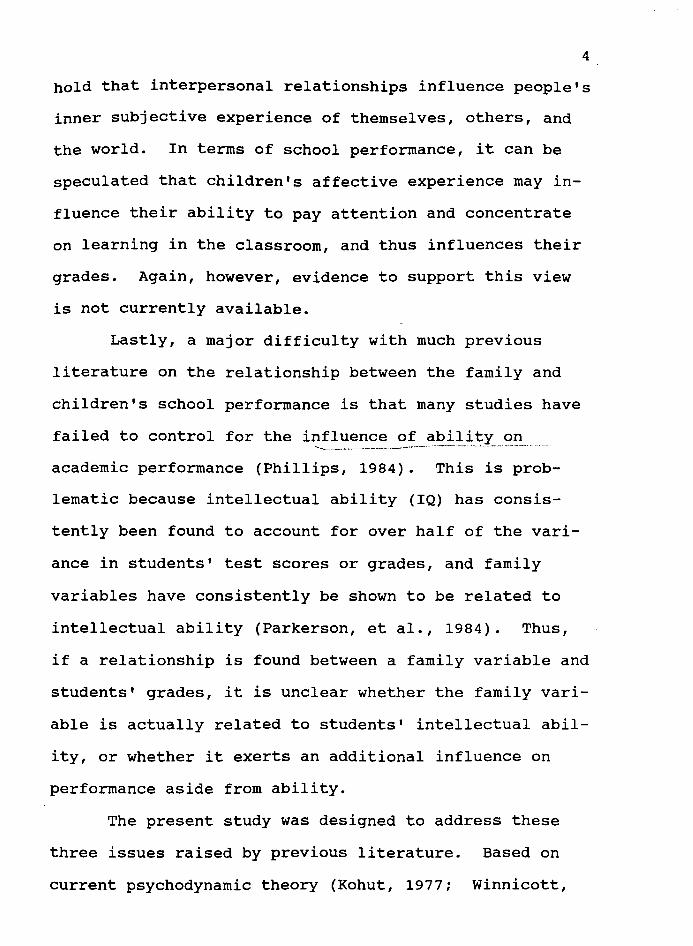
4
hold that interpersonal relationships influence people's
inner subjective experience of themselves, others, and
the world. In terms of school performance, it can be
speculated that children's affective experience may in-
fluence their ability to pay attention and concentrate
on learning in the classroom, and thus influences their
grades. Again, however, evidence to support this view
is not currently available.
Lastly, a major difficulty with much previous
literature on the relationship between the family and
children's school performance is that many studies have
failed to control for the influence of ability on ---------·- -•••v .• --·--~-~ -·~·-·-·---·--· - ~ -~-- ~~-·-•--~•-
academic performance (Phillips, 1984). This is prob
lematic because intellectual ability (IQ) has consis-
tently been found to account for over half of the vari-
ance in students' test scores or grades, and family
variables have consistently be shown to be related to
intellectual ability (Parkerson, et al., 1984). Thus,
if a relationship is found between a family variable and
students' grades, it is unclear whether the family vari-
able is actually related to students' intellectual abil-
ity, or whether it exerts an additional influence on
performance aside from ability.
The present study was designed to address these
three issues raised by previous literature. Based on
current psychodynamic theory (Kohut, 1977; Winnicott,

5
1965), the relationships between children's family re
lationships, their inner subjective experience (includ
ing mood, motivation and attention), and their academic
performance were examined, after controlling for the ef
fects of intellectual ability. In addition, the study
investigated the view that process variables (such as
family relationships and children's affective experi
ence) are more important predictors of achievement than
family status variables (such as socioeconomic status
and parental marital status).
To do so, the study utilized an innovative method
of assessing inner experience, the Experience Sampling
Method (Larson & Csikszentmihalyi, 1983). This method
involves having subjects carry electronic pagers and
complete brief questionnaires about their subjective
state (including mood, attention, and motivation) when
signaled at various times in their daily lives. Thus,
the method allows an immediate assessment of students'
experience in the moment as opposed to in retrospect or
in a laboratory setting.
In addition, the study examined family relation
ships, subjective experience and academic performance at
a particularly important stage of human development:
the transition from childhood to adolescence. This
period is of particular concern in the study of under
achievement, since school difficulties have been found

6
to increase significantly during early adolescence
(Galloway, Ball, Bloomfield & Syed, 1982; Safer, 1986).
In addition, relationships with family members are
thought to change considerably during this period, as
children begin the process of separating from the family
and forming stronger relationships with peers (Blos,
1961). Thus, the potential relationship between the
quality of family relationships and academic performance
during appears particularly relevant during this age
period.
Based on the above-described tenets of recent
psychodynamic theory, the present study predicted that
the quality of family relationships would be related to
young adolescents' subjective experience, and that both
variables would be related to the adolescents' academic
performance, after controlling for the effects of their
ability. In addition, the quality of family relation
ships was expected to be a more important predictor of
academic performance than parental education or marital
status.
In sum, the present study was designed to extend
previous literature on the relationship between family
process and children's academic performance. A clearer
understanding of how the home influences children's
academic performance has implications for understanding
of development in general, as well as for the

development of more effective intervention and preven
tion programs for underachieving students.
7

CHAPTER II
REVIEW OF THE LITERATURE
Before the specific hypotheses of the present
study are detailed, previous research on the relation
ship between family characteristics and children's
academic performance will be reviewed. Issues relevant
to the study of academic achievement will first be dis
cussed, followed by a discussion of the definition and
diagnosis of underachievement in particular. Previous
studies of family status variables will then be des
cribed, along with findings regarding behavioral or
cognitive-behavioral family "process" variables. The
contrasting tenets of interpersonally-based psycho
dynamic theory will be outlined, and previous studies of
family relationships, children's affective experience,
and academic performance will be discussed.
Academic Achievement
Numerous potential influences on children's acad
emic achievement have been proposed and studied, but an
overall model that successfully predicts achievement has
yet to emerge. However, a recent meta-analysis of over
250 studies of achievement (Parkerson, et al., 1984) in
dicated that the eight most important predictors of
achievement are ability, motivation, quantity and
8
quality of instruction, peer group, home environment,
classroom environment and media, in that order.
Parkerson and her colleagues (1984) tested sev
eral causal models of interrelationships among these
variables, and concluded that ability, motivation, and
quality of instruction are the primary predictors of
achievement, accounting for 72%, 12%, and 6% of the
overall variance, respectively. The home environment
was found to affect achievement indirectly, through its
influence on both intellectual ability and motivation.
9
The notion that the family thus influences chil
dren's performance in two different ways - by affecting
their intellectual ability and by affecting their moti
vation - is of particular significance for the present
study. Intellectual ability is conceptualized as a
fairly stable trait related to learning capability or
efficiency in a number of different areas. It is gener
ally considered to develop primarily in the first few
years of life, presumably through some combination of
genetic factors and early environmental factors
(Fotheringham & Creal, 1980). In contrast, motivational
variables are considered to be less stable, environmen-
tally-influenced factors related to the individual's
effort on academic tasks.
As ability is thus considered to be already estab
lished in school-age children and adolescents,

10
interventions designed to increase or improve the aca
demic performance of these students must necessarily
focus on factors other than intellectual ability. Thus,
while studies of the family influences on IQ may have
implications for interventions targeting very young
children, other studies must identify family variables
that influence achievement above and beyond the influ
ence of ability.
However, many studies of the relationship between
family variables and academic performance have neglected
to distinguish between ability and achievement. Most
have simply demonstrated a relationship between a family
variable and children's grades or test scores, leaving
it unclear whether the family variable was actually re
lated to children's ability or whether the relationship
exists independent of children's ability.
To demonstrate the latter relationships, studies
must include controls for the influence of ability on
performance, either by matching subjects by ability, or
by statistically removing or "partialling out'' variance
due to the effects of ability. Recent studies using
multivariate analyses have controlled for ability by
entering it first in a step-wise multiple regression,
followed by the predictor variables of interest (e.g.,
Hess, et al., 1984; Jordan, 1984).
Ability is typically assessed with measures of

11
intellectual ability (IQ) or aptitude. However, in a
more general sense, ability can be conceptualized as
including other variables related to children's capacity
to learn currently presented academic material. For
example, the presence of a learning disability and/or
previously-developed specific skill deficits in academic
areas also influence children's performance, but are not
typically reflected in measures of IQ. Therefore,
measures of children's previous achievement (which
presumably also reflect the influence of intellectual
ability) can also be utilized as a method of controlling
for ability (Wood, 1984).
While the assessment of academic achievement in
relation to ability has only recently been applied to
studying the academic performance of entire normative
samples of students, it has long been used by clinicians
and educators to identify "underachieving" students.
Literature relevant to the study of underachievement in
particular will therefore be briefly presented.
Academic Underachievement
students who are not performing academically at a
level consistent with their measured intellectual abil
ity have been termed underachievers. Approximately
twenty-five percent of school children are estimated to
be underachieving (Weiner, 1979). In addition, over 10%
of adolescents in the United States fail to complete
high school (National Commission on Excellence in
Education, 1983), although at least half of these stu
dents are estimated to possess at least average intel
ligence (Havigurst, Graham, & Eberly, 1972).
12
It is important to note that underachievement is
considered to be distinct from low achievement. Specif
ically, low achievement can be due exclusively to low
intellectual ability, while underachievement can not.
As underachievement is a measure of academic performance
with intellectual ability taken into account, it is by
definition due to an influence other than low intellec
tual ability.
Underachievement is typically diagnosed based on
the difference between the achievement level predicted
by intelligence tests and the child's actual performance
on achievement tests (Thorndike, 1963; Yule, Lansdown &
Urbanowitz, 1982). However, as noted above, it can also
be diagnosed based on the discrepancy between the grades
predicted by the child's achievement test scores and his
or her actual grades (Neeper & Lahey, 1983).
In either system, a regression equation is com
puted based on the overall relationship between the in
dependent and dependent achievement measures for a large
population (Thorndike, 1963). This equation is then
used to compute expected individual scores on the
dependent measure, which are then compared to the
child's actual scores. Due to the potential for mea-
surement error inherent in using discrepancy scores, a
number of authors have emphasized the need to consider
13
only relatively large discrepancies as indicative of
underachievement. Accordingly, a child pe:r:!g_l'.}ll!:rt9 _!1).S';"~- •
than . one standa.rd. Q..~Yiatian bel.aw the .level predict~d is - '•A·- -·-··-~-·----~·
generally considered to be underachieving.
students diagnosed as underachieving using this
method have been found to differ significantly from low
achieving students (diagnosed regardless of ability) on
a number of measures (Yule, 1973). In addition, the
latter study also reported that discrepancies between
ability and performance have been found to be reliable
over time.
Family Status and Academic Performance
Song (1982, as cited in Song & Hattie, 1984) has
conceptualized the home environment as consisting of
three components: family structure (or composition),
family status (socioeconomic variables), and family
psychological characteristics. Bronfenbrenner (1986)
has referred to both of the former variables as "social
address" variables, as contrasted with family "process"
variables such as psychological, cultural or social
factors.

14
Earlier literature on the relationship between the
family and academic performance focused primarily on the
former aspects of the family, such as socioeconomic
status (SES) and family composition (father absence,
parental divorce). Socioeconomic status, in particular,
has been described as the most commonly investigated
family characteristic (Fotheringham and Creal, 1980).
Socioeconomic status has long been found to be
related to both achievement and intellectual ability
(Fotheringham & Creal, 1980; Trotman, 1977; White,
1982). In a recent review of the literature,
Fotheringham & Creal concluded that the degree of this
association varied from .35 to .5, depending on the
measures used. However, it is unclear how well SES
predicts academic performance after the effects of
ability on performance are controlled.
Parental marital status has also generally been
found to be related to children's academic performance,
although some conflicting findings exist (e.g., Nye,
1957). Parental divorce has been found to be related to
children's intellectual ability (Hetherington, Cox, &
Cox, 1979b), school "work effectiveness'' (Hess & Camara,
1979) and academic achievement (Crescimbeni, 1965;
Kinard & Reinherz, 1986; Wallerstein & Kelley, 1976),
even when socioeconomic status is controlled. The
Wallerstein and Kelly (1976) study examined changes in

academic performance over the year post-divorce, thus
providing a control for ability, a procedure rarely
utilized in the remaining literature in the area.
15
Interestingly, research has rarely examined the
effects of remarriage on children's achievement.
Burchinal (1964) found no differences in the grade point
averages of adolescents from intact vs. reconstituted
families, while other studies have suggested that re
marriage tends to attenuate some of the negative effects
of father absence on cognitive functioning (Chapman,
1977; Santrock, 1972; Santrock, Warshak, Lindberg, &
Meadows, 1982). However, no other evidence appears to
be available.
Thus, overall it is clear that children from lower
income homes and children from divorced homes are at
risk for underachieving in school, as well as for other
difficulties. This is especially alarming in light of
the fact that these groups involve a large and increas
ing number of children. An estimated 12.5 million
children were living in poverty-level homes in 1986
(U.S. Bureau of the Census, 1988). In addition, one to
two percent of children under eighteen are estimated to
experience parental divorce each year (U.S. Bureau of
the Census, 1980), and it has been estimated that over
the next few decades at least one third of all children
will be directly affected by divorce (Glick, 1979).
However, before effective intervention and prevention
programs can be developed for these children, further
investigation is needed to identify to the family pro
cess variables that may accompany SES and divorce but
influence children more directly.
Family Process and Academic Performance: Cognitive
Behavioral Variables
16
As noted earlier, many studies of family process
variables have emerged from a cognitive or cognitive
behavioral view of human behavior. These studies can be
divided into two types: those that focused on the
"educational environment" of the home, and those that
focused on parents' achievement-related perceptions,
attitudes, or beliefs.
Educational environment variables include the
opportunities for learning provided in the home, the
educational atmosphere of the home, opportunities for
development of communication skills (Fotheringham &
Creal, 1980) and degree of verbal interaction (Hess, et
al., 1984). These variables have consistently been
found to contribute significantly to the prediction of
achievement (Fotheringham & Creal, 1980; Majoribanks,
1979b;). They have also been found to account for as
much or more variance in school performance than have
socioeconomic status (Fotheringham & Creal, 1980; Hess,

17
et al. , 1984) .
Attitude-related variables include parents' per
ceptions of the value of education, their perception of
their children's abilities, and their expectations for
their children's performance. Eccles and her colleagues
(e.g. Eccles, 1983) have demonstrated that these vari
ables significantly predicted both children's own be
liefs and the children's academic performance. Similar,
though less specific findings have been reported by
others (Crandall, 1969; Hess, et al., 1984;
Marjoribanks, 1979b).
While this work represents an improvement over
research that has investigated only family status vari
ables, it is unlikely that educational stimulation and
parental attitudes are the only aspects of family inter
action that influence children's performance. In par
ticular, interpersonally-based psychodynamic theories
(Kohut, 1977; Winnicott, 1965) propose that the affec
tive quality of family relationships exerts a pervasive
influence on development. However, the potential influ
ence of the latter aspect of the family on children's
school performance has been investigated much less
frequently.
Interpersonally-Based Psychodynamic Theories of Behavior
In their recent comparison of various

psychodynamic theories, Greenberg & Mitchell (1983)
contend that these theories can be divided into drive
based theories such as those of Freud, Jung, and more
recently, Kernberg, and interpersonally-based theories
such as the work of Fairbairn, Winnicott, and Kohut.
The latter theories propose that the structure of the
personality is developed through relationships with
other people, particularly the primary caretakers.
18
Interpersonally-based theories can then be further
subdivided into two types, although this division is not
particularly relevant for the present study. Object re
lations theorists such as Fairbairn and Winnicott pre
dict that relationships with others lead to the develop
ment of mental representations of the self and of other
people, which then affect feeling states and behavior.
In contrast, self psychologists such as Kohut view re
lationships as influencing the development of the self,
which is seen as responsible for affective regulation
and thus behavior. In both cases, however, interper
sonal relationships are seen as influencing the quality
of inner affective experience, which then affects be
havior.
While the early relationship with the primary
caretaker is seen as the most important influence on
development, a number of theorists (Erikson, 1975;
Fairbairn, 1952; Kohut, 1977) have postulated that
19
relationships with significant others continue to foster
further development throughout childhood, adolescence,
and adulthood. It is suggested that people of all ages
have a continuing need to feel safe, loved, and compe
tent (Goldstein, Freud & Solnit, 1973). Adolescence, in
particular, is thought to involve the development of
increasingly complex, integrated, and abstract self and
other representations (Guidano & Liotti, 1985; Wolf,
Gedo, & Terman, 1972). As noted, these self and other
perceptions are then thought to influence feelings and
behavior.
Family Relationships and Academic Performance
Consistent with the basic tenets of interperson
ally-based psychodynamic theory, several measures of
interpersonal relationships have been found to influence
children's functioning. These include parent-child re
lationships, interparental relationships, and family
relationships in general. Previous studies in each area
will be discussed in turn.
A recent longitudinal study (Estrada, Arsenio,
Hess, & Holloway, 1987) found that the affective or
emotional quality of the mother-child relationship at
age four was significantly related to children's "mental
ability" at age four, IQ at age 6, and achievement test
scores at age twelve(~ =.40). Notably, the
20
parent-child relationship was found to enter first in a
multiple regression analysis predicting age twelve
achievement, before other process variables such as
maternal expectations, communication skill, and attribu
tions for success (Hess, et al., 1984). Moreover, the
relationship variable remained the primary predictor of
achievement after a measure of age five "school readi
ness" was entered first to control for previous ability.
Similar relationships between the quality of the
parent-child relationship and children's school perfor
mance have also been found in correlational (non-longi
tudinal) studies (Forehand, Long, Brody & Fauber, 1987).
several studies on the effects of divorce and conflict
on children have found that good parent-child relation
ships are associated with fewer problems in children,
including children from divorced, intact-conflictual and
intact non-conflictual homes (Hess & Camara, 1979;
Hetherington, Cox, & Cox, 1979b; Petersen & Zill, 1986;
Rutter, 1971). In particular, Hess & Camara found that
the quality of parent-child relationships significantly
predicted children's work habits at school, although the
effect of ability was not controlled.
Other studies have examined the potential effects
of other aspects of the parent-child relationship on
cognitive functioning. Children who are "securely
attached" (Bowlby, 1977) as infants have been found to
21
demonstrate better social and problem-solving skills as
preschoolers (Bretherton, 1985). In addition, studies
of parental discipline styles have also demonstrated a
relationship between discipline style and children's
academic performance (Hess & McDevitt, 1984; Dornbusch,
Ritter, Leiderman, Roberts, & Fraleigh, 1987).
While the studies just described have assessed the
relationship between the parent and child in particular,
recent interpersonal theory (e.g., Kohut, 1977) proposes
that other significant relationships should also influ
ence development, especially among older children.
Thus, parent-parent relationships and sibling relation
ships should also influence children's functioning.
Consistent with this view, interparental conflict
has consistently been found to be related to children's
adjustment (Emery, 1982). In a recent review of the
literature on interparental conflict, Emery concluded
that evidence from five different research approaches
supports the conclusion that it is interparental con
flict, not divorce or separation, that accounts for the
relationship between divorce and childhood problems. He
notes that several studies have found that children from
conflictual, intact homes were more likely to have
problems than were children from broken but conflict
free homes (Gibson, 1969; Nye, 1957; Petersen & Zill,
1986; Power, Ash, Schoenberg, & Sorey, 1974).

22
surprisingly, however, the one available study on inter
parental conflict and school performance (Hess & Camara,
1979) found that the relationship between interparental
conflict and work habits at school (preparedness, con
centration, attentiveness, tolerance of delay) did not
attain significance.
Lastly, researchers have recently begun to assess
the overall quality of relationships in the family as a
whole. A multidimensional measure, the Family Environ
ment Scale (Moos & Moos, 1981), has been developed for
this purpose and has been found to differentiate between
various types of families (Moos & Moos, 1976; Soresby &
Christensen, 1976). Three of the measures' ten sub
scales, labeled Cohesion, Expressiveness, and Conflict,
assess family relationships.
One study has specifically investigated the rela
tionship between such overall family relationships and
academic performance. Nelson (1984) recently reported
that all three relationship subscales of the FES signif
icantly predicted children's self-concept and satisfac
tion with school, and that the Conflict subscale was
significantly negatively correlated with students'
grades. Again, however, this study did not control for
the influence of ability on grades, leaving the rela
tionship between family relationships and grades un
clear. Additional research is thus needed to further
investigate the potential influence of overall family
relationships on children's academic performance.
23
Family Relationships and Children's Affective Experience
The studies described above have generally demon
strated a link between relationships and children's
academic performance without addressing the question of
how relationships influence children so as to then in
fluence their performance. Emery (1982) has identified
several possible mechanisms through which interparental
conflict may affect children, which appear to be appli
cable to family relationships in general. He proposes
that interparental conflict affects children by: 1)
disrupting attachment bonds, instinctively leading to
anxiety and distress (Bowlby, 1980); 2) providing
maladaptive parental models for children (Bandura,
1973); 3) leading to disrupted parental discipline
styles; and 4) functioning as a general "stressor" on
children, thereby eliciting anxiety or distress.
The former view (Bowlby, 1980) is rooted in
psychodynamic theory and is similar to the explanation
investigated by the present study. Bowlby emphasizes a
biological/evolutionary cause of anxiety, while other
interpersonal theories (e.g., Winnicott, 1965, Kohut,
1977) propose that relationships influence children's
feelings by affecting their inner representational world

24
or their sense of self. Both views propose that inad
equate family relationships affect children's feelings,
causing distress or anxiety, and thus affect their be
havior.
In addition, while the remaining explanations of
fered by Emery (1982) do not directly concern the qual
ity of parent-child relationships, a significant simi
larity can be noted among all but one of these explana
tions. Specifically, like relationship-based theories,
all of the proposed explanations except for the one
regarding modeling predict that some aspect of inter
parental conflict leads to anxiety and distress in
children.
Little evidence regarding this prediction is
available. Wallerstein and Kelly (1976) found that
children and adolescents reported considerable negative
emotion following parental divorce and another study
found that the quality of family relationships was
related to children's self-esteem (Nelson, 1984). How
ever, no studies on overall family relationships and
children's affect appear to be available. The absence
of investigations of affective experience is likely due
to the difficulty adequately measuring feeling states.
The development of the Experience Sampling Method,
utilized in the present study, allows assessment of
previously unavailable information about inner affective

25
experience.
Affective Experience and Academic Performance
As noted, the final prediction of interpersonal
theories of behavior is that inner affective experience
then influences behavior or 'adaptive functioning;
school performance is seen as one measure of behavior.
Most previous research on the relationship between
affect and students• school performance has focused on
three general areas: interest in school or enjoyment of
school, school-related anxiety, and depression.
Interest in and enjoyment of school has consis
tently been found to predict achievement (Bloom, 1976;
Eccles, 1983; Richards, Gaver, & Golicz, 1984). How
ever, this construct does not adequately capture the
variety of emotional states that students can experience
which may influence their performance. For example, it
can be speculated that an individual could be interested
in math or enjoy learning math, in general, but still
experience feelings of depression or anger which could
negatively influence his or her performance.
A fairly extensive literature has investigated the
influence of anxiety on school performance, particularly
performance in math or on tests in general (e.g.,
Sarason, 1972; Tobias, 1978). Although this literature
is somewhat inconsistent (e.g. Felson, 1984), overall it

appears that anxiety is moderately related to achieve
ment (Gaudry & Spielberger, 1971).
26
Finally, given the extensive literature on depres
sion, it is surprising that so little research has in
vestigated the relationship between academic performance
and depression in children. A number of studies have
shown a relationship between academic performance and
cognitive styles typically associated with depression,
such as learned helplessness (Butkovsky & Willows,
1980), and "explanatory style" (Nolen-Hoeksma, Girgus &
Seligman, 1985), but only the latter study also reported
a correlation between achievement and depressive symp
toms (~ =-.20).
Studies of information-processing have also sug
gested that positive moods facilitate learning (Hettena
& Ballif, 1981; Izard, Nagler, Randall, & Fox, 1965;
Izard, Wehmer, Livsey, & Jennings, 1965), while even low
levels of negative affect have been found to impair per
formance on cognitive tasks (Kaslow, Rehm, & Siegel,
1984; Masters, Barden & Ford, 1979). Notably, Hettena
and Ballif reported a correlation of ~=.20 between mood
and sentence recall, remarkably similar to the correla
tion between achievement and depressive symptoms, re
ported above.
Overall, these results consistently indicate that
emotions or feelings are related to achievement.

27
However, their usefulness is limited by the fact that
the studies have used one-time or dispositional measures
of affect that assess only one main dimension of emo
tion, such as enjoyment, anxiety, or depression. In
contrast, a relatively new method of assessing emotional
states, the Experience Sampling Method (Larson &
csikszentmihalyi, 1983), allows for a more detailed,
immediate and comprehensive assessment of subjective or
affective state.
The Experience Sampling Method involves having
subjects carry a pager for one week and complete self
reports when signaled at several random times per day.
The self-reports completed at these times assess sub
jects' activity, companions, thoughts, and feelings.
The latter items assess subjects' affect, activation,
and motivation. A number of studies have been conducted
using this method, and the measure has been found to
have acceptable psychometric properties (Larson &
Csikszentmihalyi, 1983).
Three previous studies (Larson, Csikszentmihalyi &
Graef, 1980; Lorek, 1987; Mayers, 1976) have examined
the relationship between moods and achievement using
this method. The former study found that the variabil
ity of students' moods was significantly related to
teachers' ratings of their intellectual involvement, but
not to their grades. However, a study of the same data

28
set (Mayers, 1976) found that grades were significantly
correlated with the degree to which students reported
feeling involved, active and sociable in class and with
the degree to which they reported that they wanted to be
in the class.
In addition, using somewhat different self-report
items, Lorek (1987) found that gifted adolescents from
divorced families reported more negative feelings while
engaged in productive activities (school or work) and
more positive feelings when with friends than did stu
dents from intact families. Although the relationship
between moods and performance was not directly examined,
children of divorced families were also rated by their
teachers as being lower achievers than were students
from intact families.
Thus, initial studies of the relationship between
achievement and mood states assessed using the Experien
ce Sampling Method have revealed encouraging results.
Further investigation appears to be indicated in order
to more clearly establish the relationship between moods
and achievement and to examine the relationship between
family relationships and children's moods.
Attention in Class and Academic Performance
Finally, if moods in classes are related to stu
dents' academic performance, this again raises the

29
question of how moods affect children so as to affect
their performance. Presumably, their inner affective
experience influences their ability to learn optimally
and/or to work to capacity, but how this occurs remains
unclear.
Hess and Camara (1979) reported that children of
divorced families had poorer "work effectiveness" than
children from intact homes, as assessed from teacher
ratings of children's preparedness, concentration, at
tentiveness, task completion, and tolerance of delay.
Moreover, studies of information processing (Hettena &
Ballif, 1981; Izard, Nagler, Randall, & Fox, 1965;
Izard, Wehmer, Livsey, & Jennings, 1965) described
above, suggest that mood influences the manner in which
information is encoded and the ability to memorize and
recall information.
Finally, a number of recent studies (Karweit,
1984; Mcintyre, Copenhagen, Byrd & Norris, 1983) have
demonstrated a relationship between the amount of time
students are "on-task" (paying attention, participating,
complying with demands, etc.) in the classroom and their
academic performance. It can be speculated that child
ren's affective experience is related to their atten
tiveness, which then affects their learning and academic
performance. The present study therefore also investi
gated the relationship between family relationships,

30
children's attention in class, and their academic per
formance, using the Experience Sampling Method to assess
subjects' attention to what they were doing when signal
ed.
The Present study
The present study was designed to move beyond the
previously-established link between family status vari
ables and achievement, to identifying the variables that
may mediate this relationship or influence achievement
more directly. In addition, rather than focusing on a
single mediating variable, the present study proposed a
sequence of mediating variables that have not been
carefully studied in the past.
Based on current interpersonally-based theories of
behavior, the study investigated the prediction that
family relationships influence children's moods and
attention, and that these variables influence children's
academic performance (after ability is controlled). In
addition, the prediction that family relationships and
children's affect and attention would be more predictive
of academic performance than family "status" variables
was also investigated.
Specific hypotheses were as follows:
1) The quality of family relationships was expected to
be significantly related to childrens' subjective
affective experience.
2 ) The following variables were expected to be sig
nificantly related to subjects• academic achievement
after controlling for the effect of ability: family
status (parental education and marital status); family
relationships; affective experience; and attention in
class.
31
3) Family relationships and affective experience were
expected to be more important predictors of academic
achievement (after controlling for ability) than paren
tal education and marital status.

CHAPTER III
METHOD
subiects
Subjects were randomly selected from the entire
public school student populations (N=approximately 2000)
of fifth through ninth graders in two suburban commun
ities. Selection was stratified by grade, sex and
community and designed to yield a representative sample
of slightly over 500 students, or approximately 25% of
the student populations.
Selected students who did not participate (N=157)
were replaced with additional randomly selected students
from the same cell of the grade by sex by community
stratification. Accordingly, to obtain a sample of 531
participants, a total of 688 students were selected,
yielding a participation rate of 77%. Of the students
who were selected but did not participate, 84 (12.2% of
the 688 selected students) chose not to participate, 46
(7%) were not permitted to take part by parents, four
(0.6%) were denied teacher's permission to participate,
one (0.1%) was absent and therefore never invited, and
31 students (4.5%) declined without identifying a rea
son.
Of the 531 students who did participate, 39 stu
dents (5.7% of the selected students) were excluded from
32

33
final analyses due to incomplete or invalid data. The
final sample for the present study thus consisted of 483
students, 70.2% of the randomly selected students.
Preliminary analyses indicated that there were no
significant differences in participation rates by grade,
sex, school or wave of participation. Students who de
clined to participate also did not differ from those who
agreed in terms of parental occupation or self-esteem.
However, students from "reconstituted" homes (parents
remarried) had a significantly lower participation rate
(57%) than did the overall sample (73%). In addition,
subjects who were dropped from the final analyses were
found to have lower grade point averages (t=7.46,
p<.001) than students who completed the study's require
ments adequately.
The final sample of 483 consisted of 102 students
in grade five, 52 boys and 50 girls; 107 students in
grade six, 53 boys and 54 girls; 104 students in grade
seven, 51 boys and 53 girls; 97 students in grade
eight, 49 boys and 48 girls; and 72 students in grade
nine, 36 boys and 37 girls, for a total of 241 boys and
242 girls.
Subjects were drawn equally from two suburban
communities: one an urbanized, working class, blue
collar community (N=237) and the other an outlying,
middle to upper-middle class, white collar community

34
(li=246), as identified from 1980 census data. They were
from a total of six schools: two elementary schools and
one high school in each community.
Preliminary analyses indicated that the mean edu
cation level of parents of subjects in the study was 13
years, or one year past high school. Only 9.6% of
mothers and 12.1% of fathers had less than a high school
education, while 17.6% of mothers and 23.5% of fathers
had a college degree or beyond.
In addition, initial analyses indicated that 372
or 77.2% of the subjects' parents were married, while 6
or 1.2% of the parents were separated, 48 or 10% were
divorced (time since divorce or separation: M = 8
years, SD= 3.4 years, range= 3 months to 10+ years), 28
or 5.8% were remarried, 9 or 1.9% were widowed, 2 or
0.2% had never been married, and 17 or 3.5% did not
indicate their marital status. As the national norm
indicates that one of five children is from a single
parent family (U.S. Bureau of the Census, 1988), it
appears that children from intact families were over
represented in the current sample.
Measures
Academic Grade Point Average (Academic GPA).
Academic performance was assessed using academic grade
point averages computed from report card grades for the

35
current academic quarter and the previous three quar
ters. Grades from nonacademic classes such as music,
art, vocational classes, and P.E. were not included in
this grade point average. GPA was computed on a thir
teen point scale, with 13 equal to a letter grade of A+
and 1 equal to a letter grade of F.
Each student's GPA was translated into an "Adjust
ed GPA" score, representing their GPA after controlling
for the influence of ability and other variables. The
specific method of computing this variable will be
described in the following chapter.
Standardized Achievement Test Scores. Composite
scores on standardized achievement tests were used as
the measure of ability. Although a group-administered
measure of IQ was also available as a measure of abil
ity, achievement test scores were chosen as the measure
of ability for several reasons.
First, achievement test scores presumably reflect
the influence of IQ, as the two measures are highly
correlated (~=.70 for the present sample). In addition,
consistent with Wood's (1984) arguments against using
the WISC-R to predict achievement, achievement tests
scores were more highly correlated with grade point
averages than were IQ scores (~=.69 and .51, respec
tively). Since achievement tests assess developed
skills or previous learning, using achievement test
36
scores as the measure of ability can be seen as con
trolling for the influence of both developed skills and
learning aptitude or IQ. Lastly, achievement test
scores were also chosen because they were available on
more students than were IQ scores.
Achievement tests had been administered by the
schools within one year of the present study. Composite
percentile scores on the survey of Basic Skills (SBS)
(Science Research Associates (SRA), 1985) were used for
fifth through eighth graders, while the Comprehensive
Test of Basic Skills (CTBS) (McGraw-Hill, 1983) was used
for ninth graders. Both are nationally normed, widely
used achievement tests. Norms for both tests were
obtained during twice yearly national standardizations.
Parent Questionnaire. Parental education and
family composition (intact, divorced, remarried, etc.)
were assessed using parents' responses to a four page
demographics questionnaire developed for the larger
study. A copy of the questionnaire is included in
Appendix A.
Family Environment Scale (FES). Scores on three
of the ten subscales of the Family Environment Scale
(Moos & Moos, 1981) - Cohesion, Expressiveness and
Conflict -were used to assess family relationships. A
copy of these three scales is included in Appendix A.
(The remaining subscales assess educational
characteristics and organizational structure of the
family and were not included in the present study.)
37
The three relationship subscales are designed to
assess the extent to which the family fosters a sense of
belonging and pride in the family, allows open expres
sion, and engages in conflictual interactions, (Moos &
Moos, 1976). Higher scores reflect endorsement of more
items in each scale, such that high conflict scores
indicate a more conflictual family than low conflict
scores.
Previous studies have demonstrated that the mea
sure possesses adequate psychometric properties. Ade
quate internal consistency (~ = .64 to .79) and test
retest reliability (~ = .68 to .86) of the subscales has
been demonstrated (Moos & Moos, 1981). In addition, the
FES has been found to discriminate between clinic and
control group families and between alcoholic and control
families (Moos & Moos, 1976). Lastly, although a recent
study of the measure's factor structure (Robertson &
Hyde, 1982) reported that seven factors emerged instead
of ten, the Cohesion and Conflict subscales did emerge
as predicted, for two different samples. However, the
predicted Expressiveness subscale was not supported by
the factor analysis.
In the present study, the Cohesion and Conflict
subscales were found to have adequate internal

38
consistency(~= .72 and .68, respectively), but the
internal consistency of the Expressiveness subscale was
found to be unacceptably low (~=.32). Inspection of the
inter-item correlations of the latter scale revealed
that the consistency was not adequately improved by
deleting problematic items from the scale. Therefore,
the Expressiveness subscale was dropped from all remain
ing analyses.
Experience Sampling Method (ESM). This relatively
new measure (Larson & Csikszentmihalyi, 1983) was used
to assess subjects• feelings, motivation and attention.
The measure involves having subjects carry an electronic
pager for one week and fill out self-reports when cued
at random times during the day.
The self-report measure (a copy of which is in
cluded in Appendix A) was designed to assess several
aspects of the subjects' experience at the moment they
are signaled, including their location, companions,
mood, attention and motivation, as well as additional
items not included in the present study. Locations and
companions were assessed with single open-ended items
("Where were you when you were signaled?" "Who were you
with?") which were later categorized by trained coders.
Mood was assessed using six seven-point semantic
differential mood items, with three assessing affect
(e.g., happy - sad) and three assessing activation (e.g.

39
drowsy - alert). Ratings for the three items were
averaged to obtain affect and activation scores for each
signal. Previous studies (e.g., Russell & Ridgeway,
1983) have identified arousal and activation as the two
major factors in people's mood ratings. The measure
also included six additional mood items that were not
included in the present study.
Lastly, attention and motivation were assessed
with one item each. The first asks students to rate how
well they were paying attention on a ten point scale
(O="not at all" to lO="very well''), referring to their
attention to their activity at the moment they were
signaled. The motivation item asks "How much did you
want to be doing the activity?", using the same ten
point scale.
Mean affect, activation, attention and motivation
scores were then computed for each subject by averaging
their ratings across signals. For each of the four
variables, mean scores were computed both by averaging
across all responses to obtain overall scores and by
averaging separately across responses in four different
situations: alone, in class, with family and with
friends.
Subjects were signaled seven times per day for
seven days. Signals occurred at a random time within
every two hour block between 7:30 AM and 9:30 PM.

40
Pagers can be set to either an auditory or vibrating
signal, with the latter used when auditory signals would
be disruptive.
Subjects responded to 82% of the signals, with
some variation due to subjects forgetting the pager or
turning it off for privacy or while asleep. An average
of 38 self-reports were collected from each of the
subjects in this sample, for a total of 18,052 reports.
Preliminary analyses indicated that girls completed more
self-reports than boys (Mean=40 for girls and 37 for
boys, ~=12.5, p<.000). However, there were no sig
nificant differences in response rate based on grade,
community, or family composition.
The Experience Sampling measure has been success
fully used in several previous studies and found to have
adequate psychometric properties (Larson &
Csikzsentmihalyi, 1983). In particular, the pattern of
individual subjects' responses has been found to be
relatively stable over both a weekly (~ = .66 to .75)
and two year period(~= .56).
Procedure
Data for the present study were collected as part
of a larger study of early adolescence, being conducted
through Michael Reese Hospital in Chicago. Data collec
tion took place in eight waves over two years, with four

41
waves in each year, each three months apart and sched
uled to coincide with the seasons of the year. Data
were collected from fifth through eighth grade students
during all eight waves, and from ninth grade students
during only two waves.
Selected students were invited to participate and
were given letters for their parents explaining the
study, along with parental consent forms. Researchers
were available to answer any questions about the study.
After consent forms were obtained, an interview
was held with each student to explain the ESM procedure
and self-report forms. Students then carried the pager
for one week, and a debriefing interview was held after
the week of paging to review and clarify the subjects•
responses.
After completing the ESM procedure, students were
asked to complete a number of questionnaire measures,
including the Family Environment Scale and several other
measures not included in the present study. In addi
tion, one parent, usually the student's mother, was
asked to complete the Family Structure Questionnaire and
several other measures also not included in the current
study. students were then paid eight dollars for their
participation.
At the end of the school term in which the data
were collected, students' grades for that term and for

42
the previous three terms were obtained from students'
records, along with their most recent composite achieve
ment test scores. Of the sample of 483 subjects, grades
were unavailable for 16 subjects, and achievement test
scores were unavailable for 103 subjects, leaving com
plete data for 364 subjects.

CHAPTER IV
CALCULATING "ADJUSTED GPA" SCORES
As noted earlier, merely correlating potential
predictor variables with students' academic achievement
may be misleading, due to the influence of students'
ability levels on achievement. Thus, any obtained
correlation between a predictor variable and achievement
might be due to a relationship between the predictor
variable and ability, rather than to a direct relation
ship with achievement.
For example, a positive correlation between moods
and grades could be due to higher-ability children
experiencing better moods, with the grades actually due
to their ability, not to their mood. Moreover, if low
achieving children are found to experience lower moods
but are working at a level.consistent with their abil
ity, then interventions designed to improve moods may be
of little use in increasing their achievement.
Therefore, as noted by others (e.g., Hess, et al.,
1984), it is important to control for the effects of
ability on the relationship between predictor variables
and achievement. This is commonly done statistically by
either including ability as a covariate or by entering
ability first in a regression equation predicting
achievement, followed by the predictor variables of
43

44
interest.
In the present study, a modified version of the
latter method was used. Rather than repeatedly entering
ability first in regressions, "Adjusted GPA" scores were
calculated for each subject, based on an initial regres
sion of ability on achievement. This ability-controlled
GPA variable was then used in all remaining analyses.
Initially, Adjusted GPA scores were computed based
on the discrepancy between students' Actual GPA and the
GPA that would be expected based on their achievement
test score, a commonly used procedure. However, prelim
inary analyses of the resulting variable then suggested
the need for a modified procedure, to be detailed below.
Results of both methods of calculating relative achieve
ment will be presented, after which the latter method
will be used for all remaining analyses.
Calculating Adjusted GPA: Method 1
Consistent with the procedure recommended by
Thorndike (1963), a regression equation was constructed
using achievement test scores to predict grade point
averages. Results of this regression are presented in
Table 1. As shown, achievement test scores were found
to account for 47% of the variance in grades. The
resulting regression equation was then used to calculate
the residual variance in GPA for each subject, or the

Table 1
Regression of Achievement Test Scores on Actual GPA
_(Method 1)
variable
Achievement Test Scores .69 .47 .688 18.30
45
.ooo

46
remaining variance in grades that was not explained by
achievement test scores. In other words, these residual
values reflect the distance students' Actual GPAs were
from the regression line, or from their "expected GPA"
as predicted by their test scores.
The distribution of the resulting residual vari
ance variable ranged from -6.859 to +5.088, and was
found to have a mean of o and a standard deviation of
1.47. Negative values indicate actual grades were lower
than predicted by the regression equation, while posi
tive values indicate actual grades were higher than
would be expected based on test scores.
Problems with Method 1
Preliminary analyses were then conducted on the
initial Adjusted GPA variable to identify any systematic
differences in Adjusted GPA based on grade, sex, or
school. Similar analyses were also conducted on Actual
GPA and achievement test scores to allow comparison with
the Adjusted GPA variable.
An overall 5 X 2 X 6 (grade by sex by school)
analysis of variance (ANOVA) could not be conducted
because the two high schools had subjects in only one
grade (grade nine) and thus in the same cell of the
matrix. Therefore, a 4 X 2 X 4 (grade by sex by
school) ANOVA was conducted using only fifth through

47
eighth grade students, followed by 6 X 2 (school by sex)
and 5 X 2 (grade by sex) ANOVAs.
Results revealed a significant school by sex
interaction {E(5,455) = 2.71, R<.02} for Actual GPA but
not for Adjusted GPA or achievement test scores. There
were no other significant interactions. There were,
however, a number of significant main effects for grade,
sex and school. Means, standard deviations and E values
of these main effects are presented in Tables 2, 3, and
4.
As shown in Table 2, there were significant sex
differences in Adjusted GPA {E(l,362)= 19.16, R<.000},
as well as in Actual GPA {E(l,455) = 37.20, R<.000} and,
to a lesser extent, achievement test scores {E(l,362) =
6.53, R<.01}. For all three variables, boys were found
to perform more poorly than girls.
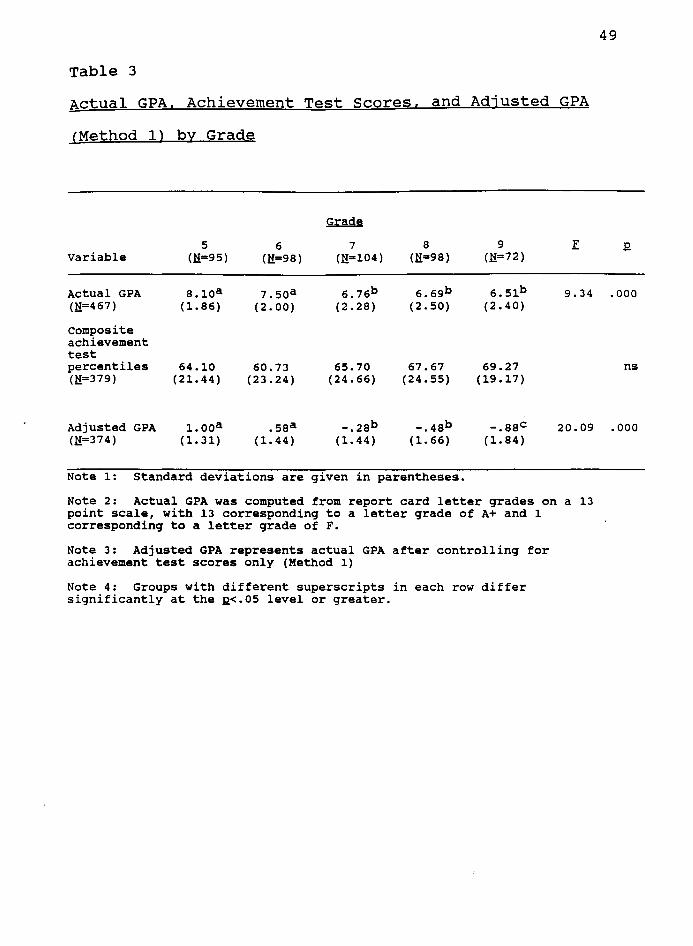
Significant main effects for grade (Table 3) were
found in Actual GPA {E(4,466) = 9.34, R<.000} and Ad
justed GPA scores {E(4,364) = 20.03, R<.000}, while
achievement test scores did not differ by grade. Post
hoc Duncan's multiple range tests following the signif
icant E's revealed that with students in grades seven
through nine performed significantly more poorly than
students in grades five and six.
Lastly, significant differences by school (Table 4)
were found in all three variables: Actual GPA {E(5,455)

Table 2
Actual GPA, Achievement Test Scores, and Adjusted GPA
(Method 1) by Gender
Achievement Boys Girls Variables (!f:a241) {N=242)
Actual GPA 6.54 7.73 37.20 .ooo {li=467) (2.34) (2.06)
Composite achievement test 62.53 68.18 6.53 .01 percentiles {H.•379) (23.56) (21.98)
Adjusted GPA -.35 .35 21.95 • 000 (lf:a374) (1. 74) { 1. 53)
Note 1: Standard deviations are given in parentheses.
Note 2: Actual GPA was computed from report card letter grades on a 13 point scale, with 13 corresponding to a letter grade of A+ and 1 corresponding to a letter grade of z. Note 3: Adjusted GPA represents actual GPA after controlling for achievement test scores only {Method 1).
48
49
Table 3
Actual GPA. Achievement Test Scores. and Adjusted GPA
(Method ll by Grade
~
5 6 7 8 9 .E variable U!:=95) (li=98) (li=l04) (li=98) (li=72)
Actual GPA 8.1oa 7.5oa 6.76b 6.69b 6.51b 9.34 .ooo (N:=467) ( 1. 86) (2.00) (2.28) (2.50) (2.40)
Composite achievement test percentiles 64.10 60.73 65.70 67.67 69.27 ns (N:=379) (21.44) (23.24) (24.66) (24.55) (19.17)
Adjusted GPA (li=37 4)
i.ooa ( 1. 31)
.58a (1. 44)
-.28b ( 1. 44)
-.48b ( 1. 66)
-.8ac ( 1. 84)
20.09 .ooo
Note 1: Standard deviations are given in parentheses.
Note 2: Actual GPA was computed from report card letter grades on a 13 point scale, with 13 corresponding to a letter grade of A+ and 1 corresponding to a letter grade of F.
Note 3: Adjusted GPA represents actual GPA after controlling for achievement test scores only (Method 1)
Note 4: Groups with different superscripts in each row differ significantly at the R<.05 level or greater.
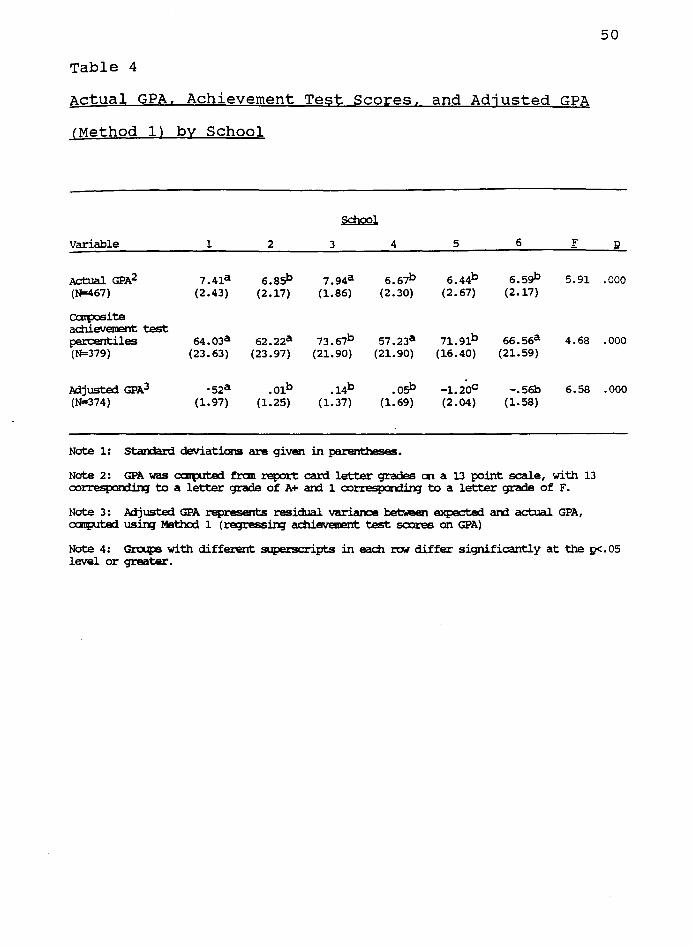
Table 4
Actual GPA. Achievement Test Scores, and Adjusted GPA
(Method 1) by School
~
Variable 1 2 3 4 5 6 r
Actual GPA2 7.4la 6.8sb 7.94a 6.67b 6.44b 6.5gb 5.91 (N=467) (2.43) (2.17) (1.86) (2.30) (2. 67) (2.17)
catp:JSite achievement test percentiles 64.03a 62.22a 73.67b 57.23a 71.9lb 66.56a 4.68 (N=379) (23. 63) (23.97) (21. 90) (21.90) (16.40) (21.59)
Adjusted GPA3 ·52a .01b .14b .osb -l.20C -.56b 6.58 (N=374) (1.97) (1.25) (1.37) (1.69) (2.04) (1.58)
Note 1: standarc1 deviations are given in parentheses.
Note 2: GPA was catprt:ed fran report card letter grades an a 13 point scale, with 13 correspondinq to a letter grade of A+ an:i 1 correspondinq to a letter grade of F.
Note 3: hijusted GPA represents residual variance between expected an:i actual GPA, catpJted usin;J Method 1 (regressin;J achievement test scores on GPA)
50
12
.000
.000
.000
Note 4: G.rcupl with different superscripts in each n:N differ significantly at the :g<.05 level or greater.

51
= 5.91, 2<.000}, achievement test scores {E(5,362) =
4.69, 2<.000} and Adjusted GPA {F(5,362) = 6.58,
p<.000}. Duncan's comparisons revealed that students in
the elementary and junior high schools (Schools 1 and 3)
of the upper middle class community had significantly
higher Actual GPAs than the remaining students. In
addition, students in the junior high and high schools
(Schools 3 and 5) of the same community had significant
ly higher test scores than did students from the other
schools. Lastly, subjects from both high schools (ninth
graders) (Schools 5 and 6) also had significantly lower
Adjusted GPA scores than did students from the remaining
schools, but there were no differences in Adjusted GPA
among the elementary and junior high schools.
Overall, boys and older students had earned sig
nificantly lower grades than would be expected based on
their test scores (i.e., had more negative Adjusted
GPAs). The age-related difference is consistent with
previous studies, which have consistently found that
serious academic difficulties (grade retention, absen
teeism, suspensions) increase significantly at the
junior high level (Galloway, Ball, Bloomfield, & Syed,
1982; Safer, 1986; Rose, Medway, Cantrell, & Marus,
1983). This shift has often been attributed to the to
the decreased structure and teacher supervision of
junior high schools (Safer, 1986).

52
In contrast, the sex differences in achievement
were less consistent with previous literature. In a
review of the literature, Eccles (1984) reports that sex
differences in achievement test scores are common, but
states that sex differences in course grades "are not
evident ... at any level including college" (Eccles,
1984, p.98). On standardized achievement tests girls
are typically found to score higher than boys on reading
and verbally-oriented tests, while boys score higher on
quantitative tests (Maccoby & Jacklin, 1976). As the
present composite achievement test score is based on
combined scores on reading, language and math subtests,
the overall composite scores may be weighted toward the
verbal tests, thus accounting for girls' higher scores.
It is unclear how best to interpret these grade,
sex and school differences. Clearly, boys and older
students differ from girls, younger students, etc., on
some other significant variable that is causing them to
underachieve. However, a comparison of Adjusted and
Actual GPA scores with achievement test scores suggests
another potential explanation.
Specifically, it is notable that the differences
in Actual and Adjusted GPA do not reflect similar dif
ferences in standardized achievement test scores. As
noted above, there were no significant grade differences
and only a slight sex difference in standardized test

53
scores. Thus, while boys and girls and students in
grades 5-9 earned similar achievement test scores, boys
and older students earned considerably lower grades. In
addition, high school students from the upper middle
class community had the highest test scores but the
lowest Actual GPA, a rather surprising pattern.
These conflicting findings raise questions as to
whether the lower Actual and Adjusted GPAs earned by
boys and older students are due to Actual differences in
their performance or to more subjective differences in
grading practices between grades, schools or based on
gender. For example, grading standards may become
stricter as students get older, one school may have a
more stringent grading scale, or boys may be graded more
strictly than girls (perhaps due to differences in
behavior).
It appears that research beyond the scope of the
present study is needed to determine whether the present
finding that boys and older students earn lower grades
than would be expected based on their achievement test
scores is best attributed to differences in grading or
to some other causal factor(s). Support for the latter
explanation would suggest the need for interventions
targeting these populations.
For the purposes of the present study, however,
these systematic differences by grade, sex and school

54
remain of concern. As noted, it is unclear whether
these findings reflect Actual performance differences or
merely grading differences. Moreover, while demographic
differences identify groups of students who may be at
risk for underachieving, they reveal little about why
one child within one of these high-risk groups may be
underachieving, while another child in the same group is
not. The present study was therefore designed to look
beyond the demographic differences to additional, poten
tially more significant variables.
However, as originally calculated, Adjusted GPA
scores would contain an inherent bias or confound based
on the grade, sex and school differences. As with the
influence of ability, if a correlation was found between
moods and Adjusted GPA as originally calculated, it
would be unclear whether the relationship was actually
due to the effects of sex, grade or school on achieve
ment, rather to the effect of moods. Therefore, in
order to focus more clearly on the variables of interest
to the present study, it appeared necessary to control
for the influence of grade, sex, and school on Adjusted
GPA scores.
Calculating Adjusted GPA: Method 2
Thus, Adjusted GPA was recalculated so as to refer
to underachievement within a given group and to control

55
for the effect of grade, sex, and school on grades. As
with ability, rather than statistically controlling for
these variables in every analysis, grades were "ad
justed" for the influence of these variables as well as
for the influence of ability. To do so, grade, sex and
school were entered into the regression equation along
with achievement test scores as predictors of grade
point average. Because sex, grade and school are not
linear variables, "dummy variables" were created to
enter each grade and school as separate dichotomous
variables.
Results of the second multiple regression are
shown in Table 5. As shown, the resulting equation
accounted for 58% of the variance in grade point aver
ages. The second Adjusted GPA variable ranged from
-4.16 to +6.93 and was found to be normally distributed,
with a mean of O and a standard deviation of 1.47.
Lastly, one concern in using the regression method
to control for ability is the possibility of ceiling
effects. Specifically, it is possible for students with
high ability (high achievement test scores, in this
case) to have an "A" GPA but earn a negative Adjusted
GPA score. This could happen if is impossible to earn a
GPA as high as the test scores predict.
To check for ceiling effects in the present study,
frequency distributions were conducted to identify the

Table 5
Regression of Achievement Test scores, Grade, Sex, and
School on Actual GPA (Method 2)
variable &2
Achievement test scores .69 .47 .68 390.45 .000
Grade 5 .72 .52 .26 55.34 .000
Grade 6 .74 .56 .18 26.83 .000
sex .76 .58 .16 22.98 .ooo
School 1 .76 .59 .10 8.12 .005
School 3 .77 • 59 .07 3.87 .05
Note: The remaining variables (Grades 7-9, Schools 2 and 4-6) did not significantly enter into the equation.
56
57
number of subjects with high achievement test scores and
high GPAs but significantly negative Adjusted GPAs.
subjects were therefore first divided into three groups
based on their Adjusted GPAs. Those with Adjusted GPAs
of more than one standard deviation below the mean were
in the lowest group (underachievers), those whose Ad
j~sted GPAs were within one standard deviation of the
mean were in the middle group (adequate achievers), and
those are with Adjusted GPAs more than one standard
deviation above the mean constituted the highest group
(overachievers). Subjects were then also grouped into
quartiles by achievement test scores, and the distribu
tion of students in the resulting Adjusted GPA by
achievement test cells was examined.
Results (shown in Table 6) indicated that in all
four achievement test quartiles, approximately similar
numbers of subjects were in each Adjusted GPA group.
The distribution for subjects in the highest quartile of
test scores was very similar to the distributions for
the other quartiles, except that fewer students in the
highest quartile were classified as underachievers. The
presence of a significant ceiling effect for Adjusted
GPA scores would have resulted in a different distri
bution of Adjusted GPA scores for students in the high
est quartile of achievement test scores, as compared to
the remaining three quartiles. Thus, present Adjusted

58
Table 6
Frequency Distribution Matrix of Adjusted GPA (Method 2)
Group by Achievement Test Quartile
Adjusted GPA Groups
Under Adequate Over Achievement Achievers Achievers Achievers Test Score (!!=57) (!!=272) (!!=45) Quartiles
Lowest quartile 12 64 15
Second quartile 16 66 12
Third quartile 20 69 5
Highest quartile 9 73 13

GPA scores do not appear to be influenced by a ceiling
effect.
59
To provide a similar check, subjects were also
grouped by their Actual GPAs and the distribution of
Adjusted GPA scores was again examined. Rather than
using quartiles, Actual GPA was divided into five groups
by the commonly used letter grades A, B; C, D, and F.
Results (shown in Table 7) indicated that there no
"A" students were classified as underachievers, although
a significant ceiling effect on Actual grades would have
resulted in some A students being classified as under
achievers. However, results did indicate that a con
siderable percentage of "A" students (N=20) were not
classified in the highest Adjusted GPA group (over
achievers), however. Thus, the ceiling of the grading
scale may have depressed the Adjusted GPA scores of
these students. However, given that this students
reflect a very small percentage of the overall sample,
it appears that the potential ceiling effect of the
regression method is of little significance in the
present study.

60
Table 7
Frequency Distribution Matrix of Adjusted GPA (Method 2)
Group by Actual GPA Group
Adjusted GPA Groups
Under Adequate over Achievers Achievers Achievers
Actu~l GfA (N=57) (N=253) (N=45) (Letter grades)
A 20 12
B 7 143 28
c 27 90 5
D 19 19
F 4

CHAPTER V
RESULTS
The present study was designed to address the
following questions: 1) Are family variables related to
chidlren's daily subjective experience?; 2) Are family
variables and children's subjective experience related
to the children's academic performance?; and 3) Are
family relationships and students' subjective experience
more important predictors of academic performance than
are family "status'' variables (parental education,
marital status)?
The first question was addressed by computing
zero-order correlations between the subjective experi
ence variables (affect, arousal, attention, motivation)
and the Cohesion and Conflict subscales of the Family
Environment Scale (FES). The latter two questions were
then investigated in two different ways. First, the
ability of the family and subjective experience vari
ables to predict children's academic performance was
investigated, using correlations and multiple regression
analyses. Second, to extend these initial results,
underachievers were identified and compared to the
remaining students on family and subjective experience
variables, again using both univariate and multivariate
analyses.
61

62
Means and standard deviations of all variables are
presented in Appendix A. All variables were found to be
normally distributed.
Family characteristics and children's subjective
experience
Family characteristics were expected to be related
not only to children's academic performance, but also to
their day-to-day subjective experience. Relationships
between the family variables (parental education, mari
tal status and family relationships) and the subjective
experience variables (affect, activation, motivation and
attention) were therefore examined. For parental educa
tion and family relationships, correlations with the
subjective experience variables were computed; for
marital status, 3 X 2 (marital status by sex) analyses
of variance was conducted on the four subjective ex
perience variables. Results are presented in Tables 8,
9 and 10.
In Tables 8 and 10, correlations with overall
subjective experience ratings are shown first, followed
by separate correlations with experience under different
conditions, such as during classes, while with family
members, etc. In addition, correlations were found to
differ for girls and boys, so results are presented
separately by sex.

63
Table 8
correlations Between Parental Education and Children's
subjective Experience
subjective M2tb!:l;c:'§ J::gyca:tiQD Fatb!il;c:' s J;;gucation Experience Boys Girls Boys Girls variables (N=226) (N:=242) (N=226) (N:=242)
AFFECT: overall .11* -.02 .11* •03
In class .11 .01 .10 -.13 With family .11* -.10 .09 -.18 With friends .03 .04 .14 -.08 Alone .06 -.OS .08 .oo
ACTIVATION: Overall .09 -.OS .OS -.02
In class .04 -.os .07 -.03 With family .1s* -.16* .01 -.13 With friends .06 -.04 .os -.04 Alone .06 -.OS .OS .01
MOTIVATION: overall .02 -.08 .10 -.02
In class .10 -.11** .1s* -.11 With family .04 .04 .09 .06 With friends -.01 -.02 .06 .07 Alone -.04 -.04 .04 -.oo
ATTENTION: Overall .11* -.09 .04 .04
In class .11 -.12 .20** -.01 With family .1s* -.01 .03 .03 With friends .04 -.04 .00 • 04 Alone .08 -.10 .OS -.01
*12<.05
**12<.0l

Table 9
children's Subjective Experience by Parental Marital
status
Marital Status
subjective Separated/ Experience Intact Divorced Remarried r variables (N=364) (N=53) (N=28)
overall Affect 5.07 4.93 5.08 .71
(.83) (.83) (. 82)
overall Activation 4.50 4.41 4.52 .35
(. 80) (.82) (. 85)
overall Motivation 6.77 6.96 6.33 1.82
( 1. 44) (1. 45) (1. 30)
overall Attention 6.81 6.44 6.52 1. 61
(l.73) (1. 79) (1.86)
Note 1: Standard deviations are given in parentheses.
Note 2: f's are main effects for marital status. There were no significant interactions with gender or main effects for sex.
Note 3: Similar nonsignficant results were also found for all four subjective experience variables when analyzed separately by location or companions (e.g., in class, with family, with friends and alone). Therefore, in the interests of clarity only overall scores are presented.
64
ns
ns
ns
ns
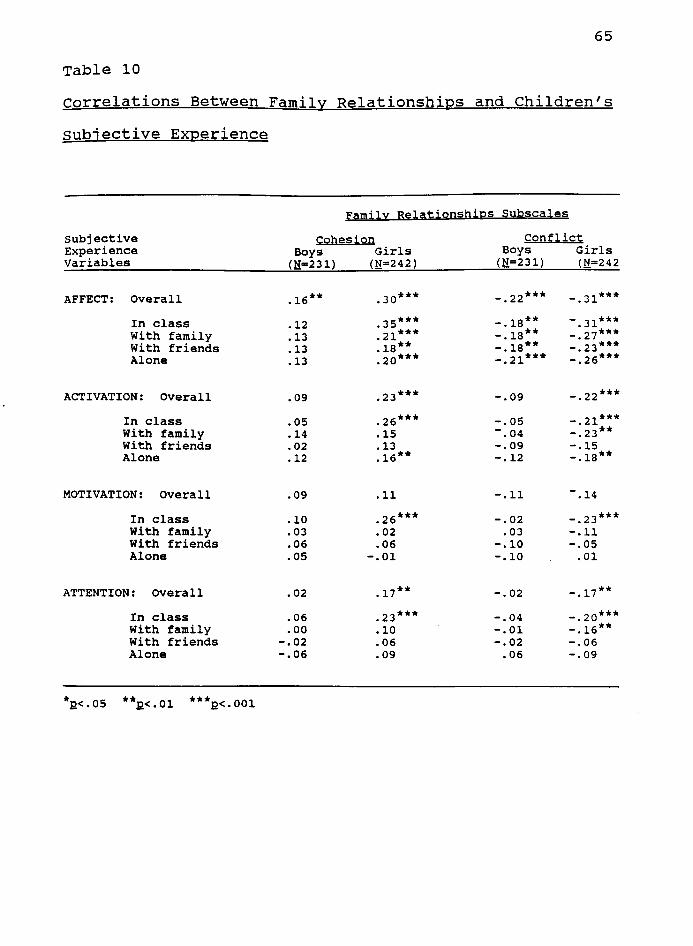
65
Table 10
correlations Between Family Relationships and Children's
subjective Experience
Family Relationships Subscales
Subjective Cohesion CQnflict Experience Boys Girls Boys Girls Variables (N=231) (N=242) (N=231) (N=242
AFFECT: Overall .16** .Jo*** -.22*** -.31***
In class .12 .35*** -.1a** -.31*** With family .13 .21*** -.1a** -.21*** With friends .13 .1a** -.1a** -.23*** Alone .13 .20*** -.21*** -.26***
ACTIVATION: overall .09 .23*** -.09 -.22***
In class .05 .26*** -.05 -.21*** With family .14 .15 - .04 -.23** With friends .02 .13 -.09 -.15 Alone .12 .16** -.12 -.1a**
MOTIVATION: overall .09 .11 -.11 -.14
In class .10 .26*** -.02 -.23*** With family .03 .02 .03 -.11 With friends .06 .06 -.10 -.05 Alone .05 -.01 -.10 .01
ATTENTION: overall . 02 .11** -.02 -.11**
In class .06 .23*** -.04 -.20*** With family .oo .10 -.01 -.16** With friends -.02 .06 -.02 -.06 Alone -.06 .09 .06 -.09
*p<.05 **p<.01 ***p<.001

66
Results revealed that parental education was
weakly and inconsistently related to children's subjec
tive experience (Table 8), and that marital status was
unrelated to subjective experience (Table 9), contrary
to expectations. However, children's ratings of the
degree of conflict and cohesion in their families were
significantly associated with their inner subjective
experience, especially for girls (Table 10).
Regarding the former finding (Table 8), low but
significant (R<.05) positive correlations were found
between mother's education and boys' affect, activation
and attention when with family members (average ~ =
.15). Similar relationships emerged between fathers'
education and boys' motivation and attention during
classes. In contrast, for girls, low but significant
negative correlations were found between mother's educa
tion and girls' activation when with family(~= -.16),
and between mother's education and girls' motivation
during classes (~ = -.17). The remaining correlations
between parental education and the subjective experience
variables were nonsignificant, including those between
father's education and all four subjective experience
variables for girls.
In contrast to these results, family cohesion and
conflict were more consistently associated with chil
dren's subjective experience, especially for girls

68
slightly higher correlations between family cohesion and
children's self-concept (~=.43, Q<.05) and family con
flict and self-concept (~=-.35, Q<.05) for girls and
boys together. Since self-concept and subjective ex
perience are likely related, the two findings taken
together provide convergent evidence that the quality of
family relationships is related to children's inner
experience.
In contrast, the finding that marital status was
not related to children's subjective experience is not
consistent with previous studies (Lorek, 1987). How
ever, the conflicting findings are likely due to the
fact that previous studies have typically involved
children from a recent divorce, while the mean time
since the divorce for the present sample was eight
years.
Overall, while children's subjective emotional
state in the classroom was generally unrelated to their
parents' level of education or marital status, children
from more cohesive, less conflictual families reported
feeling better, both in the classroom and overall. The
latter finding is consistent with previous studies and
with the predictions of interpersonally-based person
ality theories (Winnicott, 1965; Kohut, 1971).
69
Predictor Variables and Academic Performance:
Initial Analyses
Initial analyses investigated the overall rela
tionships between predictor variables (family status,
family relationships, subjective experience) and aca
demic performance, for the sample as a whole. First, to
investigate the hypothesis that all predictors variables
would be significantly related to students' grades (even
after controlling for previous performance), the uni
variate relationships between each predictor variable
and performance were computed separately. Second, to
examine the hypothesis that subjective experience and
family relationships would account for more variance in
performance than family status variables, multiple
regression analyses were used to calculate the relative
influence of the predictor variables.
Individual Relationships Between
Predictor Variables and Academic Performance
The individual relationships between each of the
predictor variables and academic performance were ex
amined by computing zero-order correlations between
students' GPAs and the continuous predictor variables
(parental education, family relationships, subjective
experience variables). The relationship between GPA and
the one categorical variable, marital status, was
70
investigated using a 3 X 2 (marital status by sex)
analysis of variance (ANOVA). Results are presented in
Tables 11 and 12, respectively.
Results are again presented separately by sex due
to the presence of sex differences. In addition, cor
relations with both Adjusted and Actual GPA are included
to allow comparison of the relationship between predic
tor variables and academic performance with and without
control variables included.
Overall, findings for girls were considerably more
consistent with predictions than those for boys, espe
cially for relationships with Adjusted GPA (GPA after
control variables were included). All predictor vari
ables except parental education and overall motivation
(i.e., six of nine predictor variables) were signifi
cantly related to girls' Adjusted GPA (~'s = .17 to
.25). In contrast, all variables except family rela
tionships were significantly related to boys' Actual GPA
(without controls for ability, etc.), but only intrinsic
motivation and marital status remained significant after
controls were included.
The finding that several significant correlations
with Actual GPA were no longer significant after control
variables were included points to the importance of
including such controls when investigating relationships
with academic performance. Present results suggest that

71
Table 11
correlations Between Predictor Variables and Achievement
variables by Gender
Achievement Variables
Predictor variables
Mother's Education
Father's Education
Family cohesion
Family conflict
overall Affect
overall Arousal
overall Motivation
overall Attention
Adiusted GPA Boys Girls
(li=l85) (li=l89)
-.04 . 02
.os -.ll
,14* ,24***
-.04 -.2s***
.10 .21***
.09 .2s***
.1s** .04
.04 .11**
Actual GPA Boys Girls
(li=234) (li=233)
,24*** .02
.2s*** .04
.14* ,19***
-.04 -.is***
.21*** .11**
.09 .10
.10 .OS
.11** .29***
Note l: Adjusted GPA represents grade point averages after controlling for achievement test scores, grade, sex, and school.
Note 2: Actual GPA was computed from report card letter grades on a 13 point scale, with 13 corresponding to a letter grade of A+ and l corresponding to a letter grade of F.

Table 12
children's Actual and Adjusted GPAs by Gender and
Parental Marital Status
Achievement Variables
Intact (N=294)
Marital status
separated/ Divorced (N=41)
Remarried (N=23) l2
Adjusted GPA Boys .09a .11a -.s3b 3.47 .032
Girls
Actual GPA Boys
Girls
(1. 32)
.1aa (1. 33)
6.89a ( 2. 12)
7.99a (1.92)
(2.21 (2.40)
-.67b -.48b (1. 20) (1. 45)
5.79b 6.07ab 7.77 .ooo (2.78) (2.69)
6.aob 7.3oab (2. 35) ( 1. 53)
Note 1: Adjusted GPA represents grade point averages after controlling for achievement test scores, grade, sex, and school.
Note 2: Actual GPA was computed from report card letter grades on a 13 point scale, with 13 corresponding to a letter grade of A+ and 1 corresponding to a letter grade of F.
Note 3: Standard deviations are given in parentheses.
Note 4: I values indicate main effects for marital status. Sex differences in Actual GPA were presented previously (see chapter 3). There were no significant interactions between marital status and gender.
Note 5: Groups with different superscripts in each row differ significantly at the J2<.05 level or greater.
72

73
the potential influence of parental education, affect,
and attention on boys' academic performance can be also
be accounted for by one of the control variables (such
as ability, grade, etc.) In contrast, results demon
strate that family relationships and subjective exper
ience are associated with girls' academic performance
regardless of their grade, school, or previous perfor
mance.
The correlations between each variable and perf or
mance will be briefly discussed in light of previous
correlational studies. The relative importance of each
for predicting performance will then be examined.
Parental education. Contrary to expectations,
parental education was not consistently positively
associated with children's academic performance (Table
11). Both mother's and father's education were sig
nificantly positively related to boys' Actual GPA, but
had little influence on boys' GPA after control vari
ables were included (Adjusted GPA). Moreover, girls'
Actual GPAs were unrelated to parental education, and a
low negative correlation (~ -.16) was unexpectedly found
between mothers' education and girls' Adjusted GPAs,
contrary to predictions. The latter finding was due to
the fact that girls of more educated mothers' earned
higher achievement test scores but similarly higher
grades than did girls of less educated mothers (not
74
shown) .
These results were quite surprising in light of
previous studies that have reported correlations between
achievement and parental education ranging from .35 to
.50 (Fotheringham & Creal, 1980). The discrepancy may
be related to the above average education of this middle
class sample: parental education may be more closely
related to achievement among lower socioeconomic sam
ples. The fact that previous studies have generally not
controlled for the effects of ability on achievement and
have not reported correlations separately by sex also
makes comparison with previous findings difficult.
Marital status. As marital status was not a
continuous variable, the relationship between marital
status and academic performance was examined separately.
Subjects were divided into three groups based on paren
tal marital status: intact, remarried, and separated/
divorced, with children from widowed or never married
parents (N=lO) excluded from the current analysis. A 3
X 2 (marital status by sex) analysis of variance (ANOVA)
was then conducted on Actual and Adjusted GPA. Duncan's
post-hoc comparisons (R<.05) were conducted following
significant ~'s to examine group differences.
Results (Table 12) were consistent with expecta
tions, with one exception. Consistent with expecta
tions, children of both sexes from remarried families

75
and girls from separated/divorced families earned sig
nificantly lower Adjusted GPAs than children from intact
families. However, while both boys and girls from
divorced families earned significantly lower Actual GPAs
than did children from intact families, this difference
did not hold for boys once control variables were in
cluded. Thus, contrary to expectations; Adjusted GPAs
of boys from separated/divorced families were not sig
nificantly lower than those of boys from intact fami
lies.
The latter finding appears to be due to the fact
that boys from divorced/separated families earned strik
ingly lower achievement test scores (not shown) than
boys from intact families. Thus, their lower Actual GPA
scores were accounted for by their similarly lower test
scores, leaving little residual variance (Adjusted GPA).
Overall, while parental education was less predic
tive of children's academic performance than indicated
by previous studies, marital status was more closely
related to children's performance. Children of parental
divorce were found to perform significantly more poorly
in school than children from intact families, consistent
with numerous previous findings (Kinard & Reinherz,
1986; Wallerstein & Kelly, 1976).
Family relationships: Consistent with expecta
tions, as noted above, low but significant correlations

76
were found between girls' ratings of the degree of
conflict and cohesion in their families, and their
Actual and Adjusted GPAs (Table 11). In contrast,
however, there were no significant relationships between
boys' FES ratings and their achievement, except for one
weak correlation between cohesion and Adjusted GPA
(~=.14, 2<.05).
The correlations found for girls are somewhat
higher than correlations between FES ratings and actual
GPA reported by a previous study (Nelson, 1984). The
latter study reported a correlation of ~=-.15 between
GPA and FES ratings of Conflict, and a nonsignificant
correlation between Cohesion and GPA, similar to the
present results when boys and girls are combined. Since
Nelson reported findings for the entire sample of boys
and girls, rather than separately by sex, it is unclear
whether the present findings are inconsistent with pre
vious results.
Subjective experience. As shown in Table 11, low
but significant positive correlations were found between
affect and Actual GPA for both boys and girls, and be
tween Adjusted GPA and affect, arousal, and attention
for girls but not boys. Thus, girls who report positive
moods earn better grades than would be expected based on
their test scores, grade, sex, and school. However, as
with family relationships, moods were not significantly

related to boys' academic performance, contrary to ex
pectations.
77
The prediction that children's moods during
classes would be more closely predictive of achievement
than moods under other circumstances was not supported.
Cor-relations between academic performance and students'
subjective experience while with different companions
are presented in Appendix B, as only overall subjective
experience was utilized for the study's main analyses.
The magnitude of the correlations between academic
performance and subjective experience was generally
similar regardless of students' location or companions
(e.g, girls' Adjusted GPA and affect: during classes,
~=.23, while with family, ~=.21, while with friends,
~=.17, and when alone, ~=.24.) Similarly, when Z-scores
(not shown) of each students' relative mood during
classes (as compared to their average mood) were com
puted, few significant relationships were found with
academic performance. Thus, rather than being influ
enced specifically by subject's moods in the classroom
in particular, it appears that academic performance is
associated with students' overall affective experience.
Summary: overall, results of zero-order correla
tions and univariate analyses of variance (by marital
status) were generally consistent with previous litera
ture for girls, (with the exception of an unexpected
78
nonsignificant relationship between mother's education
and girls' Adjusted GPA). In contrast, results for boys
were less consistent with expectations: only parental
marital status, family cohesion, boys' motivation were
significantly related to boys' GPAs after control vari
ables were included, and even the latter three relation
ships were weaker for boys than were the corresponding
relationships for girls.
Relative Importance of Family and Subjective Experience
Variables for Predicting Academic Performance
While zero-order correlations reflect individual
relationships, multivariate analyses are necessary to
determine the relative importance of several related
variables. Accordingly, to determine the relative
importance of the family and subjective experience
variables for predicting academic performance, stepwise
multiple regression analyses were conducted.
Using Actual GPA as the dependent variable, the
following variables were entered as predictors: abil
ity, grade, and school (control variables), mothers'
education, father's education, marital status (coded
intact=l, remarried=2, divorced=3), family cohesion,
family conflict, and overall affect, arousal, motivation
and attention. overall means for the latter four vari
ables were used rather than ratings during classes,
79
because overall scores had generally been found to be
slightly more highly correlated with academic perfor-
mance in the univariate analyses.
Again, due to the sex differences previously
identified, multiple regressions were computed separate
ly for girls and boys. Results of these regression
analyses are shown in Tables 13 (girls) and 14 (boys).
Results of the multiple regression analysis for
girls were consistent with predictions. Consistent with
the expectation that students' subjective experience
would be more strongly related to academic performance
than family status, affect was the primary predictor of
girls' Adjusted GPA after ability, accounting for 6% of
the variance. In addition, family conflict and marital
status also emerged as significant predictors of academ-
ic performance, although they accounted for relatively
little variance (2% and 1%, respectively). Consistent
with the hypothesis that family relationships would be
more important predictors of performance than family
status variables, family conflict entered into the
equation before marital status and accounted for twice
as much variance.
Results indicated that only the control variables
and overall motivation significantly predicted boys'
GPA, with none of the remaining variables entering into
the equation. Moreover, although significant,
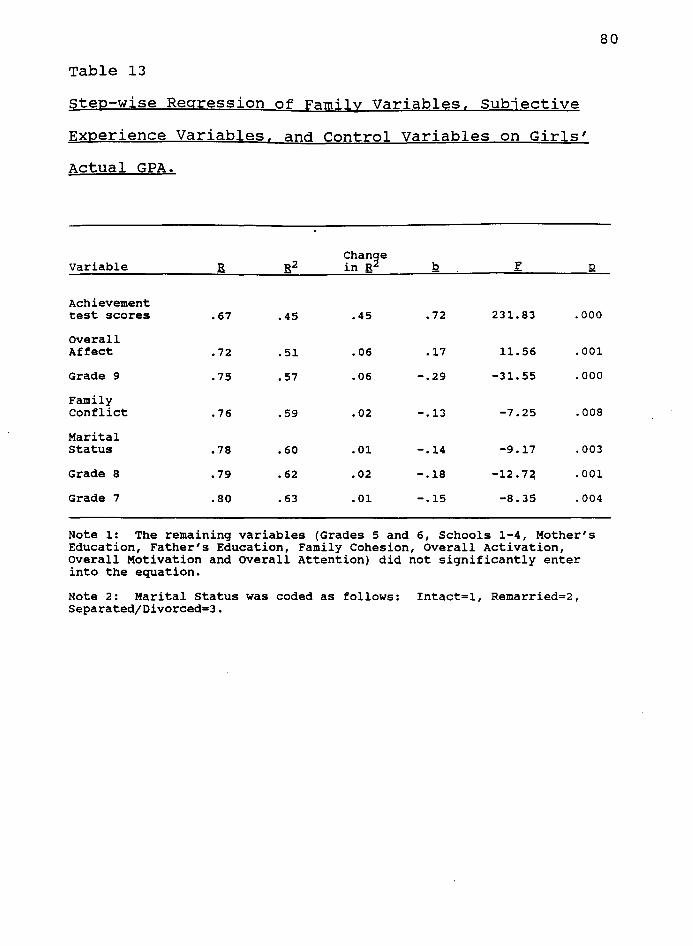
Table 13
Step-wise Regression of Family Variables, Subjective
Experience Variables, and Control variables on Girls'
Actual GPA.
variable B2 Chan~e in R b
Achievement
80
test scores .67 .45 .45 .72 231. 83 .000
overall Affect • 72 .51 .06 .17 11.56 .001
Grade 9 .75 .57 .06 -.29 -31. 55 .ooo
Family Conflict .76 .59 .02 -.13 -7.25 .008
Marital Status .78 .60 .01 -.14 -9.17 .003
Grade 8 .79 • 62 .02 -.18 -12.7~ .001
Grade 7 .so .63 .01 -.15 -8.35 .004
Note 1: The remaining variables (Grades 5 and 6, Schools 1-4, Mother's Education, Father's Education, Family Cohesion, overall Activation, overall Motivation and overall Attention) did not significantly enter into the equation.
Note 2: Marital Status was coded as follows: Intact=!, Remarried=2, Separated/Divorced=3.
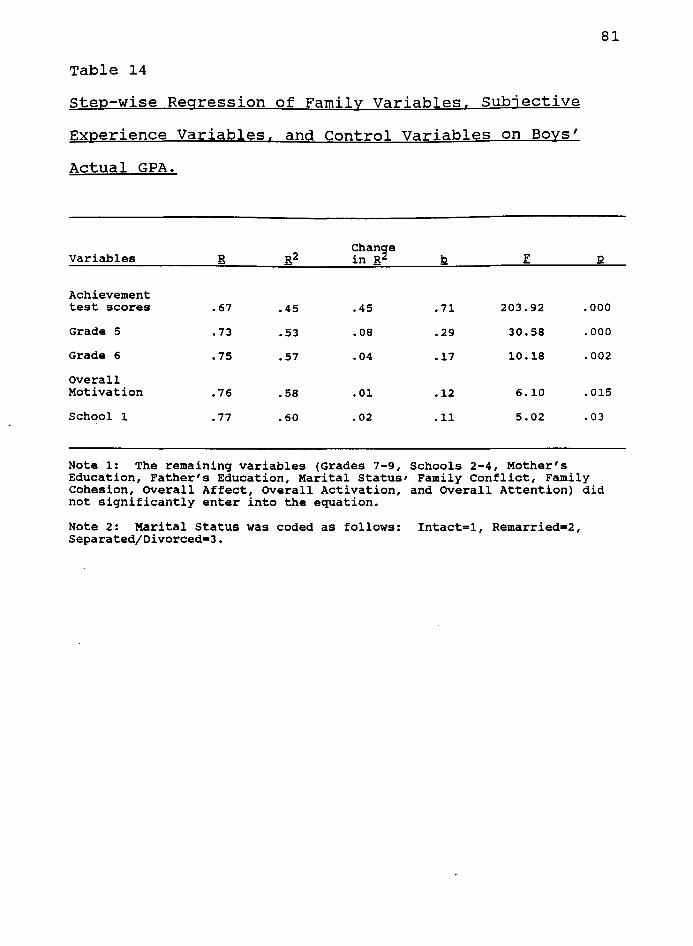
81
Table 14
step-wise Regression of Family Variables, subjective
Experience Variables, and Control Variables on Boys'
Actual GPA.
Variables B B2 Chan~e in R f:
Achievement test scores .67 .45 .45 .71 203. 92 .000
Grade 5 .73 .53 .08 .29 30.58 .ooo
Grade 6 .75 .57 .04 .17 10.18 .002
overall Motivation .76 .58 .01 .12 6.10 .015
School 1 .77 .60 .02 .11 5.02 .03
Note 1: The remaining variables (Grades 7-9, Schools 2-4, Mother's Education, Father's Education, Marital Status• Family Conflict, Family Cohesion, overall Affect, overall Activation, and overall Attention) did not significantly enter into the equation.
Note 2: Marital Status was coded as follows: Intact=l, Remarried=2, Separated/Divorced=3.

motivation accounted for little variance in GPA (1%),
following the 57% percent explained by the control
variables.
Results for boys are clearly not consistent with
predictions, as evident in the correlations reported
above. Nevertheless, it should be noted that of the
82
few significant relationships with boys' Adjusted GPA, a
subjective experience variable (motivation) emerged as a
more significant predictor of performance than parental
marital status. The latter finding is thus somewhat
consistent with the hypothesis that family status vari
ables would be less important predictors of performance
than the remaining predictor variables.
Overall, results indicate that subjective experi
ence and family relationships were more highly related
to students' academic achievement than family "status"
variables, with this relationship much stronger for
girls than for boys. In addition, a significant rela
tionship between two predictor variables - family
relationships and subjective experience - was found for
both boys and girls. Thus, results also support the
notion that family relationships may influence academic
performance indirectly by influencing students' affec
tive experience, which in turn appears to influence
performance more directly.
While partial support was thus found for the

83
study's main hypotheses, the weak and nonsignificant
findings for boys remain of concern and warrant further
investigation. Rather than concluding that family
relationships and subjective experience had no influence
on boys' academic performance, the possibility that
these variables might be more closely related to boys'
p~rf ormance for certain subgroups of the population was
investigated.
In particular, although the first set of analyses
indicated that family and experiential variables were
not highly predictive of performance (especially for
boys), students' who are underachieving may still be
more likely to experience more problematic family rela
tionships and/or more negative affect than adequately
achieving students. To explore this possibility, a
post-hoc second set of analyses was conducted to deter
mine if underachieving students differed from higher
achievers on any of the family or subjective experience
variables.
Predictor Variables and Academic Performance:
Additional Analyses Comparing Achievement Groups
As with the initial analyses, post-hoc analyses
comparing achievement groups were also conducted in two
stages. First, the univariate relationships between
predictor variables and achievement groups was examined,
84
using analyses of variance. Second, the relative impor
tance of the various predictor variables was examined,
using discriminant analyses to determine the variables'
relative ability to correctly classify subjects into
achievement groups.
Consistent with the recommendations of Thorndike,
(1963), subjects were identified as underachieving if
their Adjusted GPA score (residual variance in GPA after
controlling for ability, grade, sex, and school) was
more than one standard deviation below the mean Adjusted
GPA score. Using this criteria, 56 subjects with
Adjusted GPA scores below -1.47 were classified as
underachievers. In addition, 45 subjects had Adjusted
GPA scores more than one standard deviation above the
mean (greater than +1.47) and were therefore identified
as overachievers, with the remaining subjects (N=272)
considered average achievers.
Individual Relationships Between Predictor Variables
and Achievement Groups
The three achievement groups were compared on the
variables of parental education, family relationships,
and subjective experience, using separate analyses of
variance (ANOVAs). In each case a 3 X 2 (achievement
group by sex) ANOVA was conducted; results are describ
ed below. Since these analyses were conducted to ex-

plore the previous unexpected findings, marital status
was not reanalyzed because previous findings had been
consistent with expectations for both boys and girls.
Parental education by achievement group. Re-
85
sults of the ANOVAs on mothers' and fathers' education
levels are shown in Table 15. For mother's education
there was a significant main effect for achievement
group {E(2,364) = 3.52, p<.03}, but no significant main
effect for sex or interaction with sex. Post-hoc Dun
can's multiple range tests following the significant E
revealed that mothers of underachievers were signif
icantly more educated than mothers of students in the
other two groups, who did not differ from each other.
This finding is similar to the unexpected negative
correlation between mother's education and girls'
Adjusted GPA, reported earlier; both findings were con
trary to expectations.
In contrast to the findings for mother's educa
tion, a significant interaction with sex emerged for
father's education {E(5,364) = 4.21, p<.02}. Consistent
with expectations, fathers of boys classified as over
achievers were significantly more educated (M= more than
a college degree) than boys in the other two groups,
although the lower two groups did not differ from each
other. However, similar to the unexpected pattern for
mother's education, Duncan's Multiple Range tests

Table 15
Parental Education by Children's Adjusted GPA Group
Agj:u,1t1g ~fA ~~g:u,g
Under Adequate over Achievers Achievers Achievers
Variables CN:=-54) (li•266) n!:•43)
Mgtbl~'I J::g:u.s;:i:atJ.gn 5.51 4.92 4.98 3.521
( 1. 58) ( 1. 51) (1.76)
filtb1~'1 J::g:u.soa.tign 3.822
Boys 5.5oa 5.42a 6.35b (1.86) ( 1. 84) (1.85)
Girls 5.63a 5.57a 4.85b ( 1. 84) (1.81) (1. 66)
Note 1: z for main effect for Adjusted GPA qroup. There was no siqnificant interaction with sex.
Note 2: z for interaction between Adjusted GPA qroup and qender.
Note 3: Standard deviations are qiven in parentheses.
Note 4: Groups with different superscripts in each row differ siqnificantly at the g<.05 level or qreater.
Note 5: H's for boys • 26 underachievers, 130 adequate achievers, and 23 overachievers. H's for qirls • 28, 136, 20, respectively.
86
.03
.02

87
revealed that fathers of overachieving girls were less
educated than were fathers of girls in the remaining two
groups. These unexpected findings for girls are consis
tent with the previously discussed unexpected correla
tional findings and thus will not be discussed further
here.
Family Relationships by Achievement Group. While
findings for parental education in this set of analyses
were thus generally similar to the correlations present
ed above, different results for family relationships did
emerge in the second set of analyses. In contrast to
the nonsignif icant correlations between family
relationships and boys' Adjusted GPA (reported above),
analyses of variance revealed significant relationships
with Adjusted GPA for both boys and girls. Results are
presented in Table 16.
Consistent with expectations, a significant main
effect for achievement group was found for both cohesion
{E(2,373) = 8.35, R<.000} and conflict {E(2,373)=5.62,
R<.001}. There were no significant main effects for sex
or significant interactions with sex; however, means
are presented separately by sex to illustrate nonsig
nif icant trends toward such interactions that appear to
explain why the correlations (reported in the previous
section) were significant for girls but not boys.
Consistent with expectations, post hoc Duncan's

Table 16
Family Relationships by Children's Adjusted GPA Group
FES Variables
Under Achievers (N=56)
Agjy§teg ~f~ ~~oug
congruent Achievers (N=272)
over Achievers .r (N=45)
88
Cohesion Total 14.5oa 15.8lb 15.69b 8.35 .ooo
Boys
Girls
Conflict Total
Boys
Girls
(2.26)
14.57a
14.43a
13.43a (2.20)
13.36a
13.5oa
( 2. 10)
15.98b
15.65b
12.27b (2.22)
12.34b
12.2lb
( 1. 79)
15.42a,b
16.oob
12.5lb (2.33)
13.17a,b
5.62 .004
Note 1: All .r values indicate main effects for achievement group. There were no significant interactions with sex~ however, means are presented separately by sex to illustrate trends toward interactions that appear to explain why correlations were significant for girls but not boys.
Note 2: Standard deviations are given in parentheses.
Note 3: Groups with different superscripts in each row differ significantly at the R<.05 level or greater.
Note 4: H's for boys a 28 underachievers, 131 adequate achievers, 24 overachievers. H's for girls = 28, 141, 21, respectively.
89
comparisons revealed that underachievers of both sexes
rated their families significantly lower in cohesion and
significantly higher in conflict than did students in
the adequately achieving group. Thus, while the overall
correlations were nonsignificant for boys, family rela
tionships were associated with boys' academic perfor
mance for underachieving students.
However, surprisingly, while underachieving boys
differed significantly from boys in the middle Adjusted
GPA group in terms of family relationships, they did not
also differ significantly from overachieving boys.
Unexpectedly, boys in the latter group (overachievers)
reported more negative family relationships than did
boys in the middle group, although this difference was
not significant. In contrast, underachieving girls
differed significantly from girls in both remaining
groups, since girls' ratings of family relationships
changed in the same direction over the three groups.
It is important to note that there was no sig
nificant interaction between Adjusted GPA group and sex;
thus, the differing patterns of across Adjusted GPA
groups for boys and girls are non-significant. However,
the patterns are presented separately to illustrate
potential trends.
These findings thus shed further light on the low
and nonsignif icant correlations observed in the previous

90
analyses. For both boys and girls, negative family
relationships appear to be characteristic of students
who are significantly underachieving; however, family
relationships are not significantly related to perfor
mance among the remaining higher-achieving students.
Moreover, among these higher-achieving students, family
relationships are associated with performance in the
expected direction for girls but not for boys.
Subjective experience by achievement group. A
similar pattern emerged for the subjective experience
variables, as shown in Table 17. There were no sig
nificant interactions with gender for any of the
variables. However, consistent with expectations,
results revealed a significant main effect for achieve
ment group for overall affect {~(2,365)=3.80, R<.02},
activation {~(2,365)=4.85, R<.008} and motivation
{~(2,365) = 3.18, R<.04}. Post-hoc comparisons revealed
that, as expected, underachievers of both sexes reported
significantly lower overall affect, arousal and motiva
tion than did adequately achieving students. There were
no significant differences between achievement groups in
terms of overall attention, however.
Again, although there were no significant inter
actions with sex, a similar pattern of results by sex
was found on the affect variable as was described above
for family cohesion and conflict. For boys,
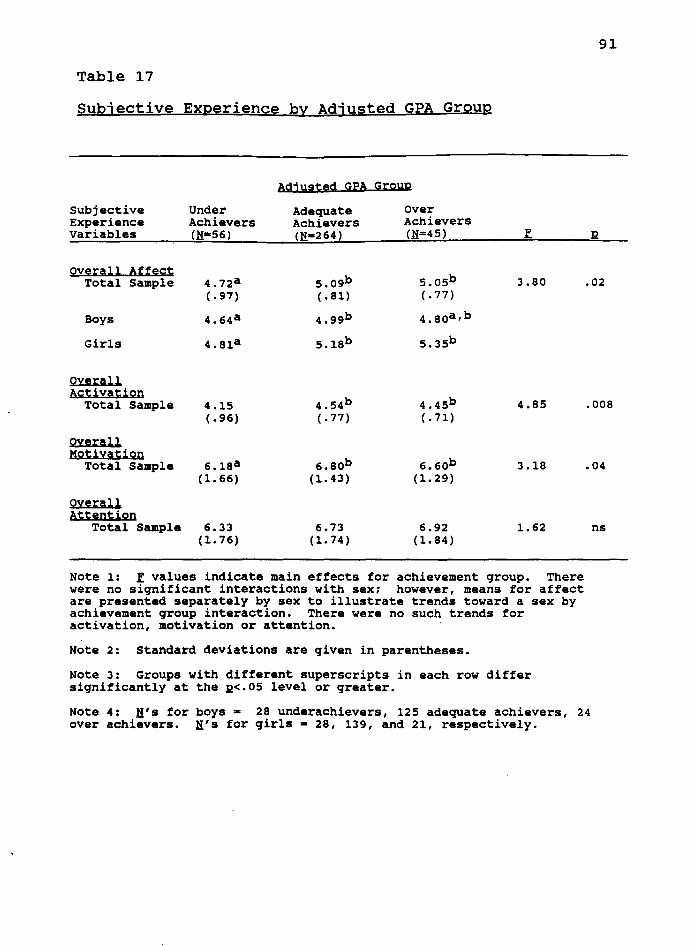
Table 17
Subjective Experience by Adjusted GPA Group
Subjective Experience variables
overall Affect Total Sample
Boys
Girls
overall Aetiyation
Total Sample
oVerall Motiyation
Total sample
overall Attention
Total Sample
Under Achievers (li•56)
4.72a (.97)
4.15 (. 96)
6.l8a (l. 66)
6.33 (l.76)
Adiusted GPA Group
Adequate Achievers (li•264)
5.09b (. 81)
4.99b
5.18b
4.54b (. 77)
6.8ob (l. 43)
6.73 (l. 74)
over Achievers (li==45)
5.o5b (. 77)
4.8oa,b
4.45b (. 71)
6.6ob (l.29)
6.92 ( l. 84)
3.80
4.85
3.18
l.62
Note l: l values indicate main effects for achievement qroup. There were no siqnificant interactions with sex; however, means for affect are presented separately by sex to illustrate trends toward a sex by achievement qroup interaction. There were no such trends for activation, motivation or attention.
Note 2: standard deviations are qiven in parentheses.
Note 3: Groups with different superscripts in each row differ siqnificantly at the ~<.05 level or qreater.
91
.02
.008
.04
ns
Note 4: H's for boys s 28 underachievers, 125 adequate achievers, 24 over achievers. H's for qirls • 28, 139, and 21, respectively.

92
underachievers differed significantly from adequate
achievers but not overachievers, while for girls under
achievers differed from all of the remaining students.
This pattern was not found for the other three subjec
tive experience variables, however.
As with family relationships, these findings shed
further light on the correlations reported earlier.
Specifically, negative affect experience is characteris
tic of both boys and girls who are underachieving, while
more positive affective experience appears to be as
sociated with better academic performance only for
girls.
Relative Importance of Predictor Variables
for Discriminating Between Achievement Groups
As with the multiple regression analyses, multi
variate analyses were again used to identify the rela
tive influence of the predictor variables. step-wise
discriminant analyses were conducted to compare the
ability of the predictor variables to classify students
as underachievers, adequate achievers, or overachievers.
As with the previous multiple regression analyses, all
variables were entered as predictors: mother's educa
tion, father's education, conflict, cohesion, and over
all affect, activation, motivation and attention.
Analyses were again conducted separately by sex.

93
Results for boys are presented in Table 18 and 19
and results for girls shown in Tables 20 and 21. For
boys, all variables except marital status, attention and
conflict entered into the analysis, in contrast to the
results of the previous multiple regression analyses.
(It is likely that conflict did not enter because co
hesion and conflict are highly correlated (~ = -.53) and
thus account for similar variance.) Family cohesion was
most predictive of group membership, followed by motiva
tion, mother's education (negative association), arousal
and father's education. The total equation was found to
correctly classify 73.1% of the underachieving boys, but
only 54% of adequately achieving boys and 30% of the
boys who were identified as overachievers.
Generally similar results were found for girls,
with conflict entering first, followed by mother's
education, activation, affect, attention and father's
education. Only marital status, cohesion and motivation
failed to enter significantly into the equation. For
girls, the total equation correctly classified 63% of
the underachievers, 31.6% of the adequate achievers and
63.2% of the overachievers.
Thus, consistent with predictions, for both boys
and girls, family relationships were most predictive of
group membership, entering first into the equations.
Consistent with expectations, the quality of family
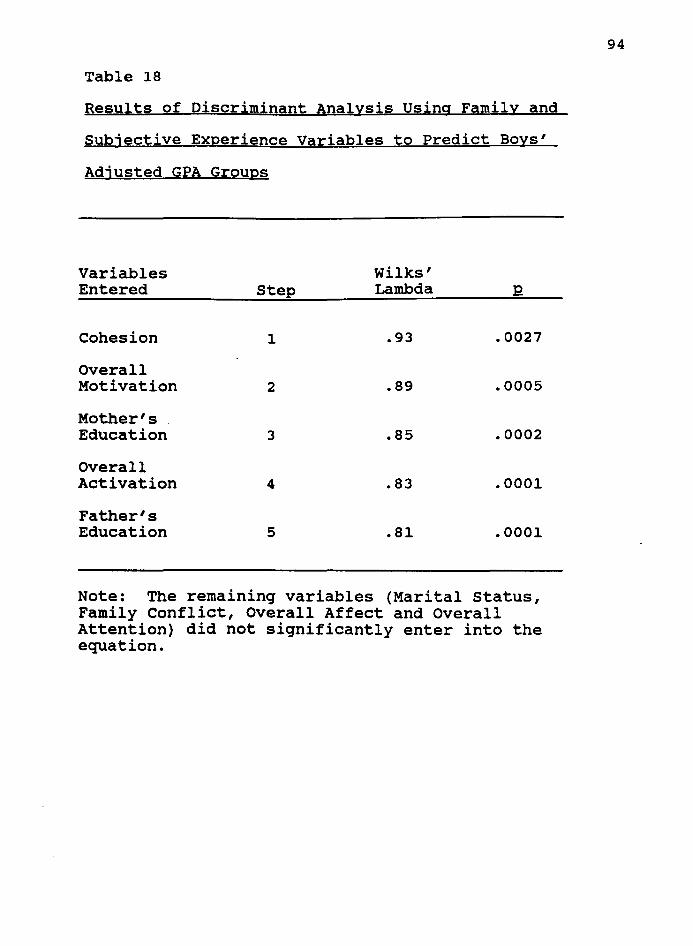
Table 18
Results of Discriminant Analysis Using Family and
Subjective Experience Variables to Predict Boys'
Adjusted GPA Groups
Variables Wilks' Entered Step Lambda
Cohesion 1 .93 .0027
overall Motivation 2 .89 .0005
Mother's Education 3 .85 .0002
overall Activation 4 .83 .0001
Father's Education 5 .81 .0001
Note: The remaining variables (Marital status, Family Conflict, Overall Affect and Overall Attention) did not significantly enter into the equation.
94

Table 19
Classification Results Using Above Equation to Predict
Boys' Adjusted GPA Groups
Predicted Group Meml:>ership Actual ~ Under Adequate over Actual MeD!bership Achievers · Achievers Achievers H
Under Achievers 19 4 3 26
(73.1%) (15.4') (11. St) (100\)
Adequate Achievers 25 67 31 123
(20.3') (54.St) (25.2\) (100\)
over Achievers 7 9 7 23
(30.4t) (39.lt) (30.4t) (100\)
95

Table 20
Results of Discriminant Analysis Using Family and
Subjective Experience Variables to Predict Girls'
Adjusted GPA Groups
Variables Wilks' Entered Step Lambda
Conflict 1 .95 .0086
Mother's Education 2 .93 .0103
overall Motivation 3 .91 .0119
Overall Affect 4 .89 .0093
Overall Attention 5 .87 .0101
Father's Education 6 .86 .0110
96
The remaining variables (Marital Status, Family Cohesion, and Overall Activation) did not significantly enter into the equation.

97
Table 21
Classification Results Using Above Equation to Predict
Girls' Adjusted GPA Groups
f~•gi~t•g ~~gyg M•m.tl•~lbig Actyal ~ Under Adequate over Actual Mem.tlusbip Achievers Achievers Achievers li
Under Achievers 17 5 5 27
(63.0t) (18.5t) (18.5t) (lOOt)
Adequate Achievers 46 42 45 133
(34.6t) ( 31. 6t) (33.st) (lOOt)
over Achievers 5 2 12 19
(26. Jt) (10.5t) (63.2t) (lOOt)

relationships was thus a more important predictor of
academic performance than parents' education level or
marital status.
98
Finally, these analyses shed further light on the
correlations previously reported. First, the finding
that the equations classified underachievers better than
the remaining students again indicates that the predic
tor variables are more closely associated with academic
performance for underachievers than for students in the
remaining two groups.
Second, it is notable that the equations clas
sified overachieving girls more accurately than over
achieving boys. Again, this pattern accounts for the
sex difference in the correlations reported earlier.
Similar to the findings reported in the univariate
analyses of variance, girls with the best academic
performance (relative to ability) report more positive
family relationships and affective experience than do
underachieving students, but this relationship does not
hold for overachieving boys.
Lastly, the discriminant procedure offers one
other piece of information relevant to the low and
nonsignificant correlations with academic performance
reported earlier. Specifically, the classification
tables also identify and group the students whose family
characteristics, subjective experience and academic per-

99
formance are not related as the present study predicted:
namely, the students who were incorrectly classified by
the discriminant equations.
An examination of the incorrectly classified
students reveals that 32 boys and 51 girls were clas
sified by the discriminant equation as underachievers
when they were actually achieving at a higher level. In
other words, these students reported more negative
family relationships and subjective experience, similar
to the family relationships and subjective experience
reported by underachievers; yet they were performing
adequately academically despite these negative factors.
In contrast, only 7 boys and 10 girls who were actually
underachieving were predicted to be in a higher group by
the discriminant equation, indicating that under
achievers rarely reported the more positive family
relationships and subjective experience that were char
acteristic of higher achieving students. Results thus
reveal that the low and nonsignif icant correlations are
due primarily to the presence of students who are
achieving adequately despite negative family relation
ships and subjective experience.
Overall, the additional analyses shed considerable
light on the relationships between family and subjective
experience variables and academic performance. While
the initial analyses indicate that the overall
100
relationship between these variables is weak for girls
and nonsignificant for boys, further examination reveals
that these overall relationships mask a more subtle
pattern of relationships. While problematic family
relationships and negative subjective experience do not
automatically lead to commensurately lower academic
performance, especially for boys, both boys and girls
who are underachieving are much more likely to report
these negative factors. Therefore, results indicate
that the predictions of the present study were supported
for both boys and girls for a significant subgroup of
the sample: the underachievers.

CHAPTER VI
DISCUSSION
The present study was designed to investigate the
relationships between family characteristics, young
adolescents' inner subjective experience, and the adole
scents' academic performance. overall, results were
consistent with interpersonally-based theories of human
development, which propose that the quality of interper
sonal relationships influences children's inner experi
ence and adaptive functioning.
Regarding the latter finding, young adolescents'
reports of the degree of conflict and cohesion in their
families were found to be significantly related to the
adolescents' academic grade point average (although not
for all subgroups of the sample}, even after controlling
for the effects of previous performance. Moreover,
family relationships were found to be more highly relat
ed to academic performance than were the traditionally
studied family "status" characteristics of parental
education and marital status.
Specifically, ratings of family cohesion and
conflict were significantly correlated with girls'
academic grade point averages and explained more vari
ance in GPA than did marital status or parental
101

102
education. In addition, although family relationships
did not similarly predict GPA for boys, both boys and
girls who were underachieving reported higher levels of
conflict and lower levels of cohesion than did higher
achieving children. Family relationships also dis
criminated between underachieving and adequately achiev
ing· students of both sexes better than did parental
education or marital status.
These findings add to a growing body of literature
that is attempting to identify the specific mechanisms
through which childrens' family environment influences
their development, including their academic performance.
In contrast to previous literature on family character
istics and academic performance that has focused primar
ily on family status variables (father absence, divorced
vs. intact families, etc.), recent research has attempt
ed to identify specific aspects of ongoing family inter
action that may influence children's behavior more
directly. The present finding that family interactional
variables were more highly related to academic perf or
mance than were the family status variables provides
further support for this view.
In addition, the finding that family relationships
were related to academic performance extends previous
studies of family interactional variables, which have
typically investigated cognitive or behavioral variables

103
that are perhaps more overtly related to academic
achievement. For example, family "achievement press"
has been found to be significantly related to academic
performance (Marjoribanks & Walhberg, 1975) as have the
"educational environment of the home" (Fotheringham &
Creal, 1980) and parental achievement-oriented attitudes
and expectations (Eccles, 1983). While these variables
may also be important, present results demonstrate that
the affective quality of family relationships is related
to academic achievement as well, consistent with inter
personal theories.
In addition, in contrast to previous studies of
family relationships that have examined primarily the
mother-child relationship for young children, the pre
sent study also extends previous literature by demon
strating a relationship between older children's perfor
mance and a more global measure of family relationships.
Consistent with interpersonal theory, results suggest
that the affective quality of relationships in the
family as a whole influences children's development as
they get older.
It is noteworthy that these results, at least for
girls, are generally consistent with the few previous
investigations of family relationships and academic
performance. Using the same measure of family relation
ships (FES), Nelson (1984) reported slightly lower

104
correlations between actual GPA and ratings of family
cohesion and conflict, for boys and girls together (~= -
.15 vs. -.25, respectively). In addition, the variance
in girls' GPA explained by family relationships in the
present study (6% for conflict and 6% for cohesion when
entered as the sole predictors) is similar to the vari
ance in achievement accounted for by observer ratings of
the affective quality of the mother-child relationship
in a previous study (Hess, et al., 1984). The similar
findings using two different measures of family rela
tionships thus provide convergent evidence that the
quality of family relationships is significantly related
to children's academic performance.
Moreover, present results are particularly sig
nificant because the study rules out several potential
alternative explanations of the relationship between
family relationships and academic performance. As
previously described, a major weakness of studies inves
tigating potential influences on academic performance
has been the failure to control for the influence of
ability on academic performance. Ability has consis
tently been shown to account for over half of the vari
ance in performance (Parkerson, et al., 1984); there
fore, failure to control for this variable leaves it
unclear whether any relationships between a predictor
variable and performance actually merely reflects the

already well-established influence of ability, as op
posed to an additional, independent relationship with
performance.
105
The present study controlled for the influence of
previous performance or ability on students' grade point
averages by regressing achievement test scores on actual
GPA; the remaining unexplained variance in GPA was then
used as the measure of academic performance. Present
findings thus demonstrate that the relationship between
academic performance and family relationships exists
independently of the effects of ability or previous
performance.
In addition, the present study goes one step
further by also controlling for the potential influence
of grade, sex, and school on performance. Although a
number of studies have documented sex, age, and school
(Eccles, 1984; Safer, 1986) differences in adhievement,
investigations of the relationships between achievement
and other variables have rarely if ever controlled for
these demographic variables. In contrast, in the pre
sent study grade, sex and school were entered as predic
tors of performance along with ability (as described
above), to remove variance in performance attributable
to these variables. In sum, rather than investigating
the academic performance of a group of boys and girls in
different grades and from different schools, the present
106
study examined why children of the same sex, in the same
grade, in the same school and possessing similar ability
earn differing grade point averages. The relationships
found with academic performance were thus also shown to
exist independently of the influence of grade, sex, and
school.
While family relationships appear to be more
highly related to academic performance than are family
status variables, the question remains as to how family
relationships affect children so as to then potentially
influence their performance. Emery (1982) proposed
several possible mechanisms through which interparental
conflict may affect children, such as by disrupting
"attachment bonds" (Bowlby, 1980), by providing parental
modeling of maladaptive behavior, by causing altered
discipline practices, and by functioning as a stressor
on children. He concluded that little evidence exists
regarding these hypotheses and has called for additional
research on the relationship between family relation
ships and children's behavior.
The present study was designed to investigate one
such mechanism relevant to the hypotheses regarding
conflict disrupting attachment. Specifically, inter
personally-based psychodynamic theories (Kohut, 1977)
propose that the quality of family relationships influ
ences children's general inner sense of themselves,

107
others, and the world, which in turn is thought to
affect their functioning. This view, while increasingly
popular among clinicians (Greenberg & Mitchell, 1986),
has rarely been empirically demonstrated. However,
using the Experience Sampling Method to obtain informa
tion about children's inner affective experience, the
present study investigated this hypothesis.
Results revealed that children's reports of the
degree of cohesion and conflict in their families were
significantly related to their affect or feelings during
various moments in their daily lives. For both boys and
girls, the more conflictual and less cohesive their
families, the more unhappy, irritable, and angry the
adolescents reported feeling during their daily ac
tivities. For girls, family conflict and cohesion were
also associated with the degree to which the girls felt
alert, motivated and attentive during their daily lives,
especially during classes.
While the relationship between family relation
ships and inner experience has not been previously
assessed using the Experience Sampling Measure, present
results are consistent with a previous study of the
relationship between family relationships and a one
time measure of children's self-concept (Nelson, 1984).
Taken together, both the present study and the study by
Nelson provide further support for the view of
108
interpersonal theories that the quality of family rela
tionships influences children's inner experience.
Moreover, the present study demonstrates that family
cohesion and conflict relate not only to children's more
overt, social cognitions about themselves or their
abilities (e.g., "self-concept"), but also relate to
their more qualitative feeling states during their daily
lives.
Present results also demonstrate, in turn, a
relationship between subjective experience and academic
performance. Girls' overall affect was found to be the
primary predictor of their academic grade point average
after previous performance, accounting for an additional
6% of the variance following the 45% explained by pre
vious performance. Girls' overall activation and atten
tion and boys' overall motivation were also significant
ly related to their GPAs after controlling for ability.
In addition, while subjective experience variables
generally did not predict boys' GPA within the total
sample, underachievers of both sexes reported more
negative affect and lower levels of activation and
motivation than did higher-achieving students.
Except for the nonsignif icant correlations for
boys, these findings are consistent with the results of
previous studies. A previous study using the Experience
Sampling Method (Mayers, 1976) also found low but sig-
109
nificant correlations between children's subjective
state and their academic performance. In addition,
present correlations between girls' subjective exper
ience and their academic performance are also similar to
previously reported correlations between achievement and
other measures of subjective experience. Results are
similar to those of previous studies of.self-concept and
achievement (Hansford & Hattie, 1982) and depression and
achievement (Nolen-Hoeksma, et al., 1985). Thus, taken
together, these results provide convergent support for
the view that children's inner experience influences
their performance.
overall, while some findings were inconsistent
with expectations, family relationships were signif
icantly related to children's inner affective exper
ience, and both family relationships and affective ex
perience were in turn related to children's academic
performance. Admittedly, however, current data permit
only correlational rather than causal interpretations.
Nevertheless, results are not inconsistent with the
hypothesis that the quality of family relationships
influences children's performance indirectly by affect
ing their inner affective experience, which, in turn,
may affect their overall functioning.
It should be noted that while these findings are
consistent with interpersonally-based personality

110
theories (Kohut, 1977; Winnicott, 1965), they are also
somewhat consistent with the hypothesis that disrupted
relationships may affect children's behavior by func
tioning as a stressor on children. Theoretically, the
two views differ considerably: interpersonal theories
predict that relationships contribute to the formation
of affectively-colored "representations" of the self and
others, while the stress hypothesis predicts that stress
leads to negative feelings without postulating the
presence of such underlying representations. However,
operationally, in both views problematic family rela
tionships are proposed to lead to negative emotions or
feelings. The present study demonstrates such a rela
tionship between family relationships and students'
affective experience; it does not allow conclusions
about whether this relationship is due to the quality of
a "representational world", to perceived stress, to a
combination of these factors, or to still other factors.
In addition, however, it is notable that interper
sonal theories propose that positive family relation
ships lead to more positive affect, which the stress
hypothesis does not. Thus, present findings for girls
are consistent with the former theory, as are other
studies of self-concept (Nelson, 1984), which presumably
also reflect internal representations. Future research
is needed to determine more specifically how family

111
relationships operate so as to affect childrens' feel
ings.
Lastly, in addition to supporting these predic
tions of interpersonal theory, results of the present
study go a step further in adding to our understanding
of the typically low but significant relationship be
tween family and self-oriented predictor variables and
academic performance. Several authors have explained
low but significant correlations with academic perfor
mance by arguing that academic performance is multiply
determined, such that there may be numerous causal
factors that each account for a small percentage of
variance in academic performance. Present results
suggest an additional explanation for the low correla
tions.
In particular, the classification tables of the
discriminant analyses (Table 19 and 21) revealed a
considerable number of students who reported family
relationships and subjective experience that were simi
lar to those of underachieving students i.e., more
negative - but who were performing adequately academ
ically. In contrast, relatively few students reported
relatively positive family relationships or academic
performance and also performed poorly academically.
Thus, the correlations between family relationships and
academic performance and between subjective experience

112
and academic performance were lowered or weakened due
mainly to the presence of the former pattern - students
who were performing at a higher level than the would be
expected given their below average family relationships
and subjective experience.
These findings suggest that rather than focusing
on identifying more and more predictors of achievement,
each of which accounts for only a small percentage of
the variance in achievement, future research should
investigate why some children who experience risk fac
tors still achieve adequately. For example, risk fac
tors such as family conflict or negative affect may lead
to poor academic achievement only in the presence of
other risk factors. Similarly, other positive influ
ences may buffer the effects of risk factors (Rutter,
1979) •
While the overall predictions of the study were
generally supported, several findings were inconsistent
with expectations. Most importantly, family relation
ships and affective experience were found to be charac
teristic of underachieving boys and girls, were not
significantly correlated with boys' academic perfor
mance, contrary to expectations. Previous studies of
these variables generally have not reported results
separately by sex, so it is unclear how these findings
compare to previous work.

113
Discriminant analyses revealed that predictor
variables correctly classified similar numbers of under
achieving boys (73%) and girls (63%), but considerably
more overachieving girls (63%) than boys (30%). Simi
larly, separate analyses of variance revealed that
underachieving girls differed from both adequately
achieving and overachieving girls, while the latter
relationship did not hold for boys (although this dif
ference was nonsignificant).
Thus, while more negative family relationships and
inner experience are associated with lower academic
performance for both boys and girls, the sex difference
lies specifically in the fact that more positive family
relationships are also associated with better school
performance for girls but not for boys. This pattern is
somewhat reminiscent of the fact that boys' affect was
more strongly and consistently correlated with family
conflict (a "negative" variable) than with family cohe
sion, while for girls affect was similarly correlated
with both aspects of family relating. In both cases, it
appears that boys may be detrimentally affected by more
negative family relationships and affective experience,
but not similarly positively affected or enhanced by
positive relationships and feelings.
What might account for this finding, which does
not appear to have been previously reported? The range

114
and variance of the measures of family relationships and
subjective experience was similar for girls and boys;
however, it may be that while boys and girls are equally
aware of positive feelings and family relationships,
boys may respond to positive feelings and relationships
differently than do girls. For example, it may be that
positive family relationships were not correlated with
enhanced academic performance for boys because boys are
socialized to be more independent and to separate from
their families sooner than are girls (Chodorow, 1978;
Levenson, 1984); positive family relationships may
therefore have less of an impact on boys. Similarly,
girls may feel emotionally closer to family members (in
a manner not assessed by the Family Environment Scale)
and therefore perhaps more affected by positive family
relationships than boys.
It can also be speculated that boys may respond
differently to their own more positive feelings states
than do girls, such that positive feelings enhance
girls' school performance but not that of boys. For
example, when girls feel positively, they may be more
likely to engage in productive activities (e.g., school
work), while boys may engage in non-school-related
activities that do not affect their grade point average.
Alternatively, boys may be more distanced from their
feelings or better able to control them, such that they
115
may be better able than girls to do schoolwork despite
negative feelings. Either pattern, or a combination of
both, could account for the finding that subjective
experience was not significantly related to achievement
for most boys. Further study is needed to investigate
these possible explanations further.
There are two other unexpected findings of note.
First, parental education was not significantly related
to girls' grade point average, contrary to previous
studies. In fact, surprisingly, mothers of under
achieving girls were found to be more educated than
mothers of higher achieving girls.
There are several possible reasons for this unex
pected finding. Previous studies of the relationships
between parental education and performance have typical
ly involved lower SES samples, whereas the average edu
cation level of the present sample was one year past
high school. Thus, it may be that parental education is
related to girls' performance only for lower levels of
parental education.
In addition, other variables that are correlated
with parental education may actually account for the
unexpected negative association. For example, highly
educated mothers may be more likely to work outside the
home and perhaps to spend less time with their daugh
ters. Lastly, daughters of more educated mothers might

116
also feel under more pressure to achieve and may there
fore underachieve as an expression of anger or rebel
lion. Research is needed to determine if these specula
tions are supported by empirical evidence.
The final unexpected finding involves the subjec
tive experience variable of attention. Based on
previous studies pointing to the effect of time-on-task
(e.g., Karweit, 1984) and effort (Felson, 1984) on
academic performance, it was hypothesized that chil
dren's feelings would affect their attention during
class, which, in turn, was expected to influence their
achievement. However, although attention was found to
be related to children's grade point average before
controlling for previous performance, it was not found
to exert be significantly related to performance once
ability was controlled, contrary to predictions.
One potential reason for the· unexpected findings
involves the wording of the self-report item assessing
attention: "How well were you paying attention?", rated
on a scale of one to ten. Studies of time-on-task have
typically coded children dichotomously as either on or
off task. Thus, it may be that attention only influ
ences performance at extreme levels of inattention, with
gradations in terms of quality of attention less influ
ential. Alternatively, the term "paying attention" may
imply a passive process, while more active, effortful

117
thinking processes such as concentrating, thinking hard,
etc. may be more highly associated with academic perfor
mance.
In addition to these potential explanations, it
should be noted that studies of time-on-task and effort
have rarely controlled for the influence of ability on
academic performance (Felson, 1984; Karweit, 1984).
Thus, present results also raise questions as to whether
attention is a by-product of intellectual ability rather
than an independent predictor of performance.
Despite these unexpected results, overall the
major predictions of the present study were supported.
However, before discussing the implications of these
findings further, several possible limitations of the
present study should be noted.
First, some of the findings may have been affected
by the measures used, as with the wording of the measure
of attention, described above. In particular, it is
notable that present findings are based completely on
the young students' own perceptions of their families
and their experience, and thus subject to the limita
tions of self-report measures. As students' perspec
tives of themselves and their world are clearly impor
tant, use of student reports regarding these variables
is a strength of the present study. However, it is
unclear how the adolescents' perceptions would compare

118
with others' perceptions. For example, it is unclear
whether a family rated as highly conflictual by an
adolescent would also be seen that way by another family
member or by an independent observer. Similarly, would
two adolescents who report feeling unhappy look similar
ly unhappy to observers? Thus, it is unclear if actual
family relationships and subjective experience are
related to students' academic performance or if it is
specifically students' perceptions of these variables
that relate to academic performance. Additional re
search is therefore needed to investigate the present
findings using measures other than self-reports.
In addition to the potential limitations of the
measures used, present results could also be affected by
the middle to upper middle class sample used in the
study. It is unclear how well the present results would
generalize to other samples, including lower SES adoles
cents and younger and older children.
Finally, and perhaps most important, it should be
noted that present results are correlational rather than
causal. While family relationships and subjective
experience were found to be associated with academic
performance, the present results cannot determine if the
predictor variables exert a causal influence on academic
performance.
The alternative possibility that academic perfor-

119
mance exerts an influence on family relationships and
subjective experience can not be ruled out. This pos
sibility is more likely for the latter variable: it is
certainly conceivable that students may feel happy as a
result of doing well in school or unhappy because they
did poorly. Previous studies of self-concept and
academic performance have yielded conflicting evidence
as to the causal relationships between these variables.
Evidence to date suggests that a reciprocal relationship
exists between the two, in which performance influences
the self-concept, which may then exert an independent
relationship on future performance (Marsh, 1984). It
can be speculated that a similar reciprocal relationship
may exist between affective experience and performance.
In contrast, however, academic performance is less
likely to influence family conflict and cohesion as
measured by the FES. While poor academic performance
may lead to parent-child conflict occasionally, the FES
items assess more general, overall family characteris
tics that would be unlikely to be strongly influenced by
one family member's behavior in an entirely different
setting (i.e., school).
Lastly, present correlational findings also can
not rule out the possibility that the results could be
due to unidentified variables that may influence both
the predictor variables and academic performance. This

possibility is reduced because the present study con
trolled for several potential confounding variables.
However, present results must be confirmed by longi
tudinal and/or experimental studies to determine the
causal influences on academic performance.
120
These limitations notwithstanding, the present
study represents a significant contribution to an under
standing of how the family may influence children's
academic performance. The finding that family conflict
and cohesiveness are related to children's affect and
academic performance after ability is controlled points
to the need for further studies of the relationship
between family interaction, children's inner experience,
and children's behaviors.
There are several ways in which future research
could build on the present results. First, the in
fluence of other family process variables (e.g., paren
tal discipline styles, empathy, acceptance, achievement
attitudes, etc.) on children's affective experience
should be investigated. In addition, the ability of the
present measure of children's affective experience and
other affectively-oriented child variables to predict
academic achievement should be examined, to determine
their relative importance as predictors. The question
of how students' affective experience influences their
behavior so as to affect their academic performance

121
(e.g., by affecting their attention, concentration,
effort, time use, etc.) also requires further examina
tion. Finally, and perhaps most importantly, empirical
investigations of interventions designed to foster
improved family relationships are needed to investigate
their impact on children's affect, achievement
behaviors, and academic performance.
In light of evidence of widespread academic under
achievement in the United States (Commission on Excel
lence in Education, 1983), a clearer understanding of
how the family influences children's school performance
appears imperative to the development of much-needed
effective intervention and prevention programs. Toward
this end, the present study provides evidence of the
potential influence of the quality of family relation
ships and children's affective experience on children's
academic performance. Continued research in this area
will hopefully lead to improved assistance for under
achieving and at-risk students.

REFERENCES
Bandura, A. (1973). Aggression: A social learning
approach. New Jersey: Prentice Hall.
Bloom, B.S. (1976). Human characteristics and school
learning. New York: McGraw Hill & Co.
Bowlby, J. (1977). The making and breaking of
affectational bonds: Etiology and
psychopathology in the light of attachment
theory. British Journal of Psychiatry, 130,
201-210.
Bowlby, J. (1980). Attachment and loss. (Vol 3):
Loss, sadness, and depression. London: Hogarth
Press.
Bretherton, I. (1985). Attachment theory: Retrospect
and prospect. Monographs of the Society for
Research in Child Development, 50, (1-2, Serial
No. 209.)
Bronfenbrenner, U. (1979). The ecology of human
development: Experiments by nature and design.
Cambridge: Harvard University Press.
Bronfenbrenner, u. (1986). Ecology of the family as a
context for human development: Research
perspectives. Developmental Psychology, 22,
723-742.
122
Blos, P. (1961). On Adolescence. Free Press: New
York.
123
Burchinal, L. G. (1964). Characteristics of adolescents
from unbroken, broken, and reconstituted
families.
26, 44-51.
Journal of Marriage and the Family,
Butkovsky, I. S., & Willows, D. M. (1980). Cognitive-
motivational characteristics of children varying
in reading ability: Evidence for learned help
lessness in poor readers. Journal of
Personality and SocialPsychology, 72, 408-422.
Chapman, M. (1977). Father absence, step-fathers, and
the cognitive performance of college students.
Child Development, 48, 1155-1158.
Chodorow, N. (1978). The Reproduction of Mothering.
Berkeley: University of California Press.
Coleman, J. s. (1966). Equality of educational
opportunity. Washington, D.C.: U.S. Office of
Education.
Crandall, V. C. (1969). Sex differences in expectancy
of intellectual and academic reinforcement. In
c. P. Smith (Ed.), Achievement-related behaviors
in children. New York: Russell Sage.
Crescimbeni, J. (1965). Broken homes do affect academic
achievement. Child and Family, ~' 24-28.

124
Csikszentmihalyi, M., Larson, R., & Prescott, s.
(1977). The ecology of adolescent activity and
experience. Journal of Youth and Adolescence,
.2..i. 281-294.
Dornbrusch, S. M., Ritter, P.L., Leiderman, P. H.,
Roberts, D. F., & Fraleigh, M. J. (1987). The
relation of parenting style to adolescent school
performance. Child Development, 58, 1244-1257.
Eccles, J.E. (1983). Expectations, values, and
academic behaviors. In J. T. Spence (Ed.),
Achivement and achievment motives. San
Francisco: W.H. Freeman.
Eccles, J.E. (1984). sex differences in achievement
patterns. In Nebraska Symposium on Motivation:
Nebraska: University of Nebraska Press.
Emery, R. E. (1982). Interparental conflict and the
children of discord and divorce. Psychological
Bulletin, 92, 310-330.
Erikson, E. H. (1975). Identification and identity. In
J. Conger (Ed.), Contemporary issues in
adolescent development. New York: Harper &
Row.

125
Estrada, P., Arsenio, N. F., Hess, R., & Holloway, s.
(1987). Affective quality of the mother-child
relationship: Consequences for children's
school-relevant cognitive functioning.
Developmental Psychology, 21_, 210-215.
Fairbairn, W.R. D. (1952). An object relations theory
of the personality. New York: Basic Books.
Felson, R. B. (1984). The effect of self-appraisals of
ability on academic performance. Journal of
Personality and Social Psychology, 47, 944-952.
Forehand, R., Long, N., Brody, G. H., & Fauber, R.
(1986). Home predictors of young adolescents'
school behavior and academic performance. Child
Development, 57, 1528-1533.
Fotheringham, J. B. & Creal, D. C. (1980). Family
socioeconomic educational-emotional
characteristics as predictors of school
achievement. Journal of Educational Research,
73, 311-317.
Galloway, D., Ball, T., Blommfield, D., & Syed, R.
(1982). Schools and Disruptive Pupils. London:
Longman.
Gaudry, E. & Spielberger, C.D.
educational achievement.
Sons.
(1971). Anxiety and
Sydney: John Wiley &

126
Gibson, H. B. (1969). Early delinquency in relation to
broken homes. Journal of Child Psychology and
Psychiatry and Allied Discplines, 19, 195-204.
Glick, P. C. (1979). Children of divorced parents in
demographic perspective. Journal of Social
Issues, 35, 170-182.
Goldstein, J., Freud, A., & Solnit, A. J. (1973).
Beyond the best interests of the child. New
York: Free Press.
Greenberg, J. R. & Mitchell, s. A. (1983). Object
relations in psychoanalytic theory. Cambridge:
Harvard University Press.
Guidano & Liotti (1983). Cognitive processes and
emotional disorders. New York: Guilford Press.
Hansford, B. C. & Hattie, J. A. (1982). Relationship
between self and achievement/performance
measures. Review of Educational Research, 52,
123-142.
Havigurst, R. J., Graham, R. A., & Eberly, D. (1972).
American Youth in the mid-seventies. Bulletin
of the National Association of Secondary School
Principals, 56, 1-13.
Hess, R. D. & Camara, K. A. (1979). Post-divorce family
relationships as mediating factors in the conse
quences of divorce for children. Journal of
Social Issues, 35, 79-96.

127
Hess, R. D., Holloway, s. D., Dickson, w. P., & Price,
G. G. (1984). Maternal variables as predictors
of children's school readiness and later
achievement in vocabulary and mathematics in
sixth grade. Child Development, 55, 1902-1912.
Hess, R. D. & McDevitt, T. M. (1984). Some cognitive
consequences of maternal intervention
techniques: A longitudinal study. Child
Development, 55, 2017-2030.
Hetherington, E. M. (1979). Divorce: A child's
perspective. American Psychologist, 34, 851-
858.
Hetherington, E. M., Cox, M., & Cox, R. (1979b). Family
interaction and social emotional and cognitive
development of children following divorce. In
v. Vaugh & T. Brazelton (Eds.), The family:
Sett~ng priorities. New York: Science and
Medicine.
Hettena, c. M. & Ballif, B. L. (1981). Effects of mood
on learning. Journal of Educational Psychology,
73, 505-508.
128
Izard, C. E., Nagler, s., Randall, D., & Fox, J. (1965).
The effects of affective picture stimuli on
learning perception and affective values of
previously neutral symbols. In S.S. Tompkins
and c. E. Izard (Eds.), Affect, cognition, and
personality. New York: Springer.
Izard, c. E., Wehmer, G. M., Livesey, W. & Jennings, J.
R. (1965). Affect, awareness, & performance.
In S.S. Tompkins and c. E. Izard (Eds.), Affect,
cognition, and personality. New York: Springer.
Jordan, T. J. (1981). Self-concepts, motivation and
academic achievement of black adolescents.
Journal of Educational Psychology, 73, 509-517.
Karweit, N. (1984). Time on task reconsidered:
Synthesis of research on time and learning.
Educational Leadership, 41, 32-35.
Kaslow, N. J., Rehm, L. P., & Siegel, H. W. (1984).
Social cognitive and cognitive correlates of
depression in children. Journal of Abnormal
Psychology, 12, 605-620.
Kinard, E. M. & Reinherz, H. (1986). Effects of marital
disruption on children's school aptitude and
achievement. Journal of Marriage and the
Family, 48, 285-293.
Kohut, H. (1977). The restoration of the self. New
York: International Universities Press.

Kohut, H. (1980). Summarizing reflections. In A.
Goldberg (Ed.), Advances in Self Psychology.
New York: International Universities Press.
129
Larson, R. W. & Csikszentmihalyi, M. (1983). The
Experience Sampling Method. In H. T. Reis
(Ed.), Naturalistic approaches to studying
social interaction: New directions for
methodology of social and behavioral sciences.
New Jersey: Jossey Press.
Larson, R., Csikszentmihalyi, M., & Graef, R. (1980).
Mood variability and the psychosocial adjustment
of adolescents. Journal of Youth and
Adolescence, ~' 469-490.
Levenson, R. (1984). Intimacy, autonomy, and gender:
developmental differences and their reflection
in adult relationships. Journal of the American
Academy of Psychoanalysis, 12, 529-544.
Lorek, P. (1987). Coping with Parental Divorce:
Achievement Motivation and Peer Relations in the
Gifted Adolescent. Unpublished manuscript,
University of Chicago, Chicago, Illinois.
Maccoby, E. E. & Jacklin, c. N. (1974). Psychology of
Sex Differences. Stanford, California:
Stanford University Press.
Masters, J. c., Barden, c., & Ford, M. E. (1979).
Affective states, expressive behaviors and
learning in children. Journal of Personality
and Social Psychology, 37, 370-380.
130
Majoribanks, K. (1979a). Family and school environment
correlates of intelligence, personality and
school-related affective characteristics.
Genetic Psychology Monographs, 99, 165-183.
Marjoribanks, K. (1979b). Family environments. In H.
J. Wahlberg (Ed.), Educational envrionments and
effects: Evaluation, policy, and productivity.
Berkeley: Mccutchan.
Marsh, H. w., Cairns. L., Relich, J., Barnes, J., &
Debus, R. (1984). The relationship between
dimensions of self-attribution and dimensions of
self-concept. Journal of Educational
Psychology, 76, 3-32.
Mayers, P. L. (1976). Flow in adolescence and its
relation to school experience. Unpublished
doctoral dissertation, University of Chicago,
Chicago, Illinois.
McGraw-Hill, Inc. (1983). User's Manual, Comprehensive
Test of Basic Skills. Monterey, California:
McGraw-Hill.
Mcintyre, D. J., Copenhaver, R. w., Byrd, D. M. &
Norris, W. R. A study of engaged student
behavior within classroom activities during
mathematics class. Journal of Educational
Research, 77, 55-59.
131
Moos, R. & Moos, B. (1976). A typology of family social
environments. Family Process, 15, 357-371.
Moos, R. & Moos, B. (1981). Family Environment Scale
Manual. Palo Alto: Consulting Psychologists
Press.
National Commission on Excellence in Education. (1983).
A nation at risk: The imperative for national
reform. Washington, D.C.: United States
Government Printing Office.
Neeper, R. & Lahey, B. B. (1983). Learning disabilities
of children. In c. E. Walker & M.C. Roberts
(Eds.) Handbook of clinical child psychology.
New York: Wiley.
Nelson, G. (1984). The relationships between dimensions
of classroom and family environments and the
self-concept, satisfaction, and achievement of
grade 7 and 8 students. Journal of Community
Psychology, 12, 276-287.

132
Nolen-Hoeksma, s., Seligman, M. E. P., & Girgus, J. s.
(1983). Learned helplessness in children: A
longitudinal study of depression, achievement,
and explanatory style. Journal of Personality
and Social Psychology, 51, 435-442.
Nye, F. I. (1957). Child adjustment in broken and
unhappy homes. Marriage and Family Living, 19,
356-361.
Parkerson, J. A., Lomax, R. G., Schiller, D. P., &
Wahlberg, H. w. (1984). Exploring causal model
of educational achievement. Journal of
Educational Psychology, 76, 638-646.
Petersen, J. L. & Zill, N. (1986). Marital disruption,
parent-child relationships, and behavior
problems in children. Journal of Marriage and
the Family, 48, 295~307.
Phillips, D. (1984). The illusion of incompetence
among academically competent children. Child
Development, 55, 2000-2016.
Power, M. J., Ash, P. M., Schoenberg, E., & Sorey, E. c.
(1974). Delinquency and the family. British
Journal of Social Work, ~' 287-295.
Richards, H. c., Gaver, D. & Golicz, H. (1984).
Academically unpredictable children: Their
attitudes toward school subjects. Journal of
Educational Research, 77, 273-276.

Robertson, D. u. & Hyde, J. s.
133
(1982). The factorial
validity of the Family Environment Scale.
Educational and Psychological Measurement, 42,
1233-1241.
Rose, J., Medway, F. J., Cantrell, U. L. & Marus, S. H.
(1983). A fresh look at the retention-promotion
controversy. Journal of School Psychology, 21,
201-211.
Russell, J. & Ridgeway, D. (1983). Dimensions unerlying
children's emotional concepts. Developmental
Psychology, 19, 795-804.
Rutter, M. (1979). Invulnerablity, or why some children
are not damaged by stress. In S.J. Shamis (Ed.)
New Directions in children's mental health. New
York: Spectrum.
Rutter, M. (1971). Parent-child separation:
Psychological effects on the children.
Journal of Child Psychology and Psychiatry
12, 233-260.
Rutter, M., & Yule, W. (1975). The concept of specific
reading retardation. Journal of Clinical
Psychology, 16, 181-197.
Safer, D. J. (1986). The stress of secondary school for
vulnerable students. Journal of Youth and
Adolescence, 1.2., 405-417.

134
Santrock, J. w. (1972). Relation of type and onset of
father absence to cognitive development. Child
Development, 43, 455-469.
Santrock, J. W., Warshak, R., Lindberg, c., & Meadows,
L. (1982). Children's and parents' observed
social behaviors in step-father families. Child
Development, 53, 472-480.
Sarason, I. G. (1972). Test anxiety and the model who
fails. Journal of Personality and Social
Psychology, 22, 410-413.
Science Research Associates. (1985). SRA Survey of
Basic Skills. California: Science Research
Associates, Inc.
Song, I. & Hattie, J. (1984). Home environment, self
concept, and academic achievement: A causal
modeling approach. Journal of Educational
Psychology. 76, 1269-1281.
Soresby, A. & Christensen, B. (1976). Differences in
interaction and environmental conditions in
clinic and non-clinic families: Implications
for counselors. Journal of Marriage and Family
Counseling, ~' 63-71.
Thorndike, R. L. (1963). The concept of over- and
and under-achievement. New York: Columbia
University Teacher's College, Bureau of
Publications.

135
Tobias, s. (1977).
psychology.
Anxiety research in educational
Journal of Educational Psychology,
71, 573-582.
Trotman, F. K. (1977). Race, I.Q., and the middle class.
Journal of Educational Psychology, 69, 266-273.
U.S. Bureau of the Census. (1980). Statistical
abstract of the United States: 1980.
Washington, D.C.: U.S. Government Printing
Office.
Wallerstein, J.S. & Kelly, J.B. (1974). The effects of
parental divorce: The adolescent experience.
In E.J. Anthony and c. Koupernik (Eds.), The
Child in his family: Children at Psychological
Risk. New York: John Wiley.
Wallerstein, J. S. & Kelly, J. B. (1976). Effects of
parental divorce: Experiences of the child in
later latency. American Journal of
Orthopsychiatry. 46, 256-269.
Weiner, B. (1979). A theory of motivation for some
classroom experiences. Journal of Educational
Psychology, 71, 3-25.

136
Weiss, J. (1974). The identification and measurement of
home environmental factors related to
achievement motivation and self-esteem. In K.
Majoribanks (Ed.), Environments for learning.
London: National Foundation for Education
Research.
White, K. R. (1982). The relationship between
socioeconomic status and academic achievement.
Psychological Bulletin, 91, 461-481.
Winnicott, D. w. (1965). The family and individual
development. London: Tavistock.
Wolf, E. s., Gedo, J. E., & Terman, D. M. (1972). On
adolescent process as a transformation of the
self. Journal of Youth and Adolescence, i, 257-
272.
Wood, R. (1984). Doubts about underachievement,
particularly as operationalized by Yule,
Lansdown and Urbanowitz. British Journal of
Clinical Psychology, 23, 231-232.
Yule, w. (1973). Differential prognosis of reading
backwardness and specific reading retardation.
British Journal of Educational Psychology, 43,
244-248.
137
Yule, w., Lansdown, R. & Urbanowitz, M. (1982).
Predicting educational attainment from WISC-R in
a primary school sample. British Journal of
Clinical Psychology, 21, 43-46.

APPENDIX A

Parent ~uestionnaire 139
IHE....Q!ILQ'S FAMILY
Every family is different and has different daily routines. In thi1 set of questions we would like to obtain information on the family of the 1tudent participating in the study.
Sometimes family changes make it difficult to answer these kind of fixed questions. If this is the case, we will understand. Please do the best you can to ducribe your child's current family.
I. The Parents of the Student
1. What is your relationship to the student in the study?
Mother.............. 1 Father •.••••••••..•• 2 Step-Mother ••••.•••• 3 Step-Father •••••.••• 4 Other
2. How much education have you received? Also, please indicate the educational level of your husband or wife?
(If you are remarried, please answer this and the following question• in terms of your present spouse. If you are divorced or separated and not remarried and your son or daughter is still in contact with or recei•ing support from your previous spouse, then answer these question• in term• of that person.)
Yourself Elementary School •••.•.•••••.• 1 Middle School ...••••.••.•••••• 2 S~me,High School •••••••••••••• 3 H1gh School ••••••••••••••••••• 4 Business or Technical School •• S Some College ••••••••••••••••.• 6 College Degree ••••••.••••••••• 7 Graduate/Professional Degree •• 8
1™ Sppuse 1 2 3 4 5 6 7 8
Does not apply............................ 9
3. Are you currentlv employed?
res.. . . . . . . . . . . . . . 1 No • • • • • • • • • • • • • • • 2
4. I~ ernolov!?d. wn.\t 1.; yn11r iob? (please provide an adequate description f ~: '.:'~)'.l r .. ~ ~ ~ ... r c l r' •. ~ ·~ 1. l ~ s . )

S. Wculd you say that you are satisfied with your current job?
Very satisfied....... l Satisfied............ 2 Moderately Satisfied 3 Moderately Dissatisfied 4 Dissatisfied •..••••• S Very Dissatisfied.... 6
6. How many hours a week do you work?~~~~~~~~
7. At what time of the day do you usually leave home to go to work?
8. At what time of the day do you usually get home from work?
9. Is your spouse currently employed?
Yes............... l No • • • • • • • • • • • • • • • 2
10. If employed. what is his or her job? (please provide an adequate description of his or her responsibilities.)
140
11. Would you say that your spouse is satisfied with his or her current job?
Very satisfied....... l Satisfied............ 2 Moderately Satisfied 3 Moderately Dissatisfied 4 Dissatisfied •••••••• S Very Dissatisfied.... 6
12. How many hours a week does your spouse work?~~~~~~~~
13. At what time of the day does your spouse usually leave home to go to work?
14. At what time of the day does he or she usually get home from work?
lS. Are there ~ny regular times during the week when your child is under someone else·~ r.~re?
,:"' -~:; . . . . . . . • . . . . • 1 ~o . . . . . . . • . . • . . . 2

141
16. !£ so, please list the days and approximate times:
17. Are there any regular times during the week when you child is home alone?
Yes • • • • • . • • • • • • • 1 No • • • • • . • • • • • • • • 2
18. If so, what kind of arrangements do you have? Please list the days and approximate times:
19. What is your ethnic background? (For example, Polish, Italian, Ge~man)
20. What is the ethnic background of your spouse?
21. Where were you born? (city)
22. Where was your spouse born? -~--..-----(city)
23. What is your present marital status?
Married......................... 1 Separated •••••••.••••••..•••••.. 2 Divorced........................ 3 Divorced and remarried •••••••••• 4 Widowed.. . • . . • . • • • • • • • • . . . . . . . . • 5 Widowed and remarried ••••••••.•• 6 Single, never married .••••.••. ,. 7
(state or country,
(state or country)
24. (If married) How many years have you been married to your husband or wife?
25. If you are divorced or separ3t~d from your child's father/mother, how l. .. n:~ ::1~U \Vt:r:: }·~·'...! J~vor·:.e.J ~.:.r sc~~ril~~.j?
142
26. If you are divc:ced er separated from your child's father/mother, ~bout how often does he or she see this person?
Daily . . • • • • . . • • • • • • • • • . • • . • • • • • l Hore than once a week •••.•.•.•.. 2 weekly.......................... 3 Monthly......................... 4 Several times a year •••••••••••• 5 Yearly.......................... 6 Rarely or never ••••••••••••••••• 7
Not applicable ••••••••••••.••••• 9
II. The Student's Family
1. Who are the people who currently live in your household? Please remember to include all adults, including yourself and all children, including the child in the study.
Relationship ~ ~ student i.a. ~ J.tlld:! (mother, father, brother, etc.)
1
2 ~------------------------------------) ----~------------------------------
5
6
7
8 ~-------------------------------------(?lease indicate whether any of your child's brothers or sisters are "half-" siblings or "step-" siblings.) .
2. Does your son or daughter have any brothers or sisters that are not living with you?
RelatLonshio t..12 ~ student
1
2
l
4
~living?
(.\.;.Jin µ;!.l5:! indi-::it.! "h3lf-" brother~. iisters, etc .. if appli<:-tf-il~l
F!\.."1.IL Y ENV!l~H1EN1' SCALE 143
Describe }Qur family. Put a circle around the l if t.r:ue: circle the 2 if false. If a statement seens pcLrtly true anl partly false, circle the m.1rber that is closest to beirg accurate.
'l'RJE FALSE
l. Family rnerrbers really help a.rd supp::>rt one arcther.
2. Family members often keep their feelings to themselves.
3. We fight a lot in our family.
4. We ofta."'l scan to be killing tiire at hcme.
5. ·we say anything we want to around our hcme.
6. Family ITIE!'l'bers rarely becane openly angry.
7. We put a lot of energy into what we oo at heme.
8. It's hard to "blOIN off steam" at heme with:>Ut upsetting sanetody.
9. Family IllE!rbers sanet.i.rnes get so angry they throw things.
10. There is a feeling of togeti"'srness in aJr f~..i.ly.
11. We tell each other about our personal problems.
12. Family mer.bers hardly ever lose their tempers.
13. We rarely voh.nteer when something has to be oone at hcrne.
14. If we feel like doing sanething at the spur of the m::ment we often just t'ick up and go. ·
15. Family members often criticize each other.
16. Family mE!!'bers really back each other up.
17. S0meo::e usua.11:: ~r·'':s upset if you ccrnplain in our family.
B. Family ~L---ers som;times hit each oth&.
~ ! : 1..-.:-- .1 _,\. -- .1.. ·.~ • • ' L
l 2
l 2
l 2
l 2
l 2
l 2
l 2
l 2
1 2
l 2
l 2
l 2
1 2
1 2
l 2
1 2
l 2
l 2
l 2
, ..,

FAMILY ElNIFDNMENT SCALE PAGE 2 of 2
21. If there's a disagreement in our family, we try hard to srrooth things over am keep the ~..ace.
22. We really get along well with each other.
23. We are usually careful about what we say to each other.
24. Family rrembers often tzy to one-up or out-do each other.
25. There is plenty of t.ilre and attention for everyone in our family.
26. There are a lot of spontaneous discussions in our family.
27. In our family, we believe j'OU cbn' t ever get anywhere by raising j'Our voice.
144
TRUE FALSE
1 2
1 2
1 2
1 2
1 2
1 2
1 2

Experience (Completed
Sampling Uethod Self-Report after each pager signal)
:~uestionnaire
l'aae 1 ___ :.l,;i. ____ .
OA'lr ____ n• llC••LLta. ____ ... , .. Tl• •II.LIO°"''----
.IUIT el•Olll YOu Wl•I llC .. ALLIOI
.,... .. , W1•4E YOU TMl•lllC Al!(IUT1 _________________ _
......,,., •••• •ou'------------------------
...... ""' vo.. oouc1 _____________________ _
1-tOW" WUCM CHOICI 010 YOU MAVI ...,,.
MO' AT ALL .,..,,. ....
\)()llllC TMI I •CTIV I T'f'1 •---• ---•-- .. •--·•---• ---•--·• ............. .
00 TOU WI ... YOU HAD HIN OOllllC IOlll ™ flfC ll 111 • - .... ., ......... --•--·• ---•---• ......... --• ---•
... 09 WILL wt•I •OU ••YllllC ATTlftlOJ111 •---·-••••-•···•-··•···•··••···•-··•
HCW t•ll.llD •"I •OU AT T'MI• •·--•-·-•·--•-··•---•---•---•---•---• a'"TIYITYl t I J 4 I I 1 I I •O
.-0. .... 't'OU 'llLlllC ll'0-1 'f'OU Wlllll llCNAU.101
ft•Y lltrC) A \.lnLI tCJT AT llllJCM• Of'• llT AL\.
IOllll'f'
IN COWTltOl ...... ..., \.()lillL'Y
Ill' COlllKIOUI
Coo-'llllAT I VI
·······························-··········································· 0Vl11All, "40. Wlllll •OU lllflllllC't
Yl'•ve QUITI• SOllll. .... ,.,. .. SQllll ..,, Tl• Yl•T•
0 l•lllTAILI
1i:--10 0 0 .~p;n:"'• u ............ 0 0 ......... •lUn 0 0 O•t'W'l'f
•tfC•T 0 0 '•lllC>L'f
SlllOMC 0 0 .... UCLY 0 0 •n•ACTIYI
············································································ 1' "DU Wllll 'llllNC A LOT OJ IOWfTltf"(:, !!ll 010 'TOU 'llL 'ntU WAY1
I llll ft ---------- HC•Vll: -------------
···········································································• &Lo-I• 0,,...1111 •IO"ll Nta•I• . I" (lAll ..... ,
AlOMS • MO ONa AllllOUMD. • • . • . . f I
"°"""'" .............. . f I
OMI ••UNO - a 80'r., •.....
ONI ••UNO - a C l•l..
'•'"•·· .. ' .................. . lllTt•lt _________ _
llVl"AL •• llNDI - 90•1 ....
HYlllllAL rlllilllC)I - ClllllLI., .
llVl•AL , • ..,1-IO'f'I I ClllllLI {
YOUJt 90.,,llllllllC>/~IJtVttll• f
t•on41•1r _________ _
OT'Ht.1111 •IUflYll1 __ ~----OTHlllll8t ______ _ ............................................................................
I• "OU wtq ALOMI • WHY1
m!llll• I fllM(X)• II ••OUC>
I lllOeOD• W•NTI TO el Wint ...
3 I .... ,. TO •I ALOJlll TO CO'fCllllTllATI Olll .Wilt I AW OOllllC
• I ••NT TO •• •LCNC TO Tl't 1 •• ••ca.IT ,._.! .. Cl, CIT .,'f'SILF TOCIT,..UI
I I All TI ll•D OI' •IO"LI
I I av INJOYl-C HlllC ALCJlifl
7 OTWllll ---------
IP YOU Wl'•I Wl T't4 IOMIOlfl, WHY1 10• tallll"I l• , • ., •• ,.,. itr •"'•"'•t
I I NAYI TO •I
I I WAlfT TO II I aw 1"0' llC '"" •tlllaOlll I Ofl •tlll•Olt•,
J I WANT TO 11 .... 1 ·1111 CITTIMC IQlll'Tt11NC ••C'WI TMU •t•SO- fOfl tofllSOMIJ WH6T1
4 TMI• tollllOlll I) WAlllTI TO II WfTM ...
I •1cavs1 °' •• •CTIVIT'T I AM DOllllQ
I I OOlll'T •ANT TO H A\ONI
' on.1• -----------...........................................................................• .. •OU IJfllll WITH f'IOflll, .... T'Mf't'1
'f'llt'f QUITI . .,... .. 11n-1• . .,... QUITI wun
'llltfNOLY 0 0 VNllllll(NOlV
HllllOUI 0 0 JO-I~
IJAI lout:IOOT II llltC .... llAOllllt II ... ,, ""
IJAI IT •OUt t • Tll Jt .. o. ~ IJ6S IT1 ----------
···········································································•
14-5

APPENDIX B

Means and Standard Deviations of Study Variables
Variable
Adjusted GPA
Actual GPA
Composite Achievement Test Percentiles
Mother's Education
Father's Education
Family Cohesion (FES)
Family Expressiveness
Family Conflict
Affect Overall
In class With family With friends Alone
Arousal overall In class With family With friends Alone
Motivation Overall In class With family With friends Alone
o.oo
7.14
65.40
5.07
5.52
15.60
12.90
12.50
5.05 4.96 5.09 5.35 4.80
4.49 4.44 4.47 4.84 4.19
6.76 7.07 7.43 7.76 7.08
Standard Deviation
1.47
2.28
22.92
1. 51
1. 86
2.17
1. 76
2.31
.84 1. 03 1.08
.91
.99
.80
.96 1.12
.91
.96
1. 44 2.12 2.70 1. 78 2.01
147

Means and Standard Deviations of Study Variables -
Continued
Variable
Attention Overall In class With family With friends Alone
6.72 6.78 7.21 7.09 6.50
Standard Deviation
1. 78 2.23 2.50 2.08 2.38
'~ f:~
148

APPENDIX C

Correlations Between Achievement Variables and
Sµbiectiye Experience with Different Companions
Achiayement yarilbles
Actual GPA Adjusted GPA Subjective Experience Boys Girls Boys Girls Variables (n•234) (n•233) (n•185) cn-iS9)
AFl'EC'l' overall • 2i*** .i7- .io .21-In class .i9- • i2 .io .23-With family • i7 .09 .07 .2i-With friends .17 .09 .09 • i7 Alone .06 • i6** -.oo .24-
AROUSAL overall • 09 .io .09 .25-In class .oi .05 .02 .is-With family .os -.03 .05 .i6 With friends .06 .oi .04 .is-Alone .oi .12* -.03 .21-
MOTIVATION overall .10 .05 .1s*• • 04 In class .13 .02 .1i .03 With family .i1** •. 02 .li -.i4 With friends .11 .04 .i9- .07 Alone -.02 .01 .07 -.06
ATTENTION overall .11** . 29*** .04 .11** In class .13 • 2 5*** .as .13 With family .14 .27 -.03 .19** With friends .10 • 21 *** .01 .08 Alone .12 .21*- -.oi .12
150
151
APPROVAL SHEET
The dissertation submitted by Carla M. Leone has been read and approved by the following committee:
Dr. Joseph Durlak, Director Professor, Psychology Loyola University of Chicago
Dr. Maryse Richards Assistant Professor, Psychology Loyola University of Chicago
Dr. Reed Larson Associate Professor, Human Development University of Illinois
The final copies have been examined by the director of the dissertation and the signature which appears below verifies the fact that any necessary changes have been incorporated and that the dissertation is now given final approval by the Committee with reference to content and form.
The dissertation is therefore accepted in partial fulfillment of the requirements for the degree of Doctor of Philosophy.
o~~))~ Date Director's Signature