Embed Size (px)
Citation preview
Subjective Wellbeing: An Assessment of Competing Theories
By
Jed Daniel Blore BA(Hons)(Psych)
Submitted in fulfilment of the requirements for the degree of
Doctor of Philosophy
Deakin University
June 2008
v
I certify that the thesis entitled: Subjective Wellbeing: An Assessment of Competing Theories
submitted for the degree of: Doctor of Philosophy
is the result of my own work and that where reference is made to the work of others, due acknowledgment is given.
I also certify that any material in the thesis which has been accepted for a degree or diploma by any university or institution is identified in the text.
Full Name: Jed Daniel Blore
Date: June 2, 2008

vi
Acknowledgements
First and foremost I would like to thank my supervisor, Professor Mark Stokes. Mark,
through your supervision you provided me the challenges and stimulation I needed and
desired for intellectual growth. For this I am incredibly grateful. The value of your
guidance, both professional and personal, is incalculable. Also to my mum, Angela,
thank you; not only for your sacrifices that have helped bring me to this point, but also
for your love and support. To my dad, Graeme, your encouragement and belief in my
abilities helped keep me going when the motivation fell. Thank you for your love and
support. To my brother John and my sister Rosa, thank you for your love, care,
friendship, and understanding. Thanks also to my extended family for your
encouragement and love. To my fellow Deakin “dungeon” crew, thanks for your
friendship; especially to my fellow PhD’s, Ardy, Johann, and Matt. I have no doubt the
friendships we have forged will last a lifetime. A special thanks also go to my best
friend, Caline. We’ve had an incredible relationship over the past few years; I sincerely
appreciate and value the care and support you have given me. Thanks also to my close
mate John and the rest of “team globe”, our bodyboarding adventures helped keep me
sane throughout this thesis. To the other Tomyn brothers, Justin and Luke, thanks for
your fantastic friendship. To Greg, Claire, Rob, and Terry, you’re incredible generosity
helped build a space for me to study and live, without which this thesis would have been
a little more difficult to say the least. Also thanks to Frank O’Dea whose encouragement
and support was invaluable in the latter years of my high school education. Lastly, to
my grandad Ernie, you pulled through and I owe you a completed thesis. Here it is.
vii
TABLE OF CONTENTS
GLOSSARY......................................................................................................................1 ABSTRACT......................................................................................................................3 CHAPTER 1: SUBJECTIVE WELLBEING CHARACTERISTICS..............................6
1. INTRODUCTION ............................................................................................................... 6 2. CHARACTERISTICS OF SUBJECTIVE WELLBEING .................................................. 9
2.1 Objective and Subjective Wellbeing ............................................................................... 9 2.2 Affect and Subjective Wellbeing .................................................................................. 15 2.3 Global and Domain-based Satisfaction ......................................................................... 29
2.3.1 Global Satisfaction Judgements............................................................................... 30 2.3.2 Domain Satisfaction Judgements............................................................................. 36
2.4 Summary of Subjective Wellbeing Characteristics....................................................... 38 3. DISPOSITIONAL INFLUENCES ON SUBJECTIVE WELLBEING............................. 40
3.1 Extroversion, Neuroticism, and Subjective Wellbeing ................................................. 40 3.1.1 Extroversion and Subjective Wellbeing .................................................................. 41 3.1.2 Neuroticism and Subjective Wellbeing ................................................................... 46
3.2 The relation of Self-esteem, Optimism, and Perceived Control to SWB...................... 49 3.2.1 Self-esteem .............................................................................................................. 52 3.2.2 Optimism ................................................................................................................. 53 3.2.3 Perceived Control .................................................................................................... 54
3.3 Summary of Subjective Wellbeing Dispositional Influences........................................ 56 CHAPTER 2: THEORETICAL MODELS OF SUBJECTIVE WELLBEING .............57
2.1 Headey and Wearing’s Dynamic Equilibrium Model of Subjective Wellbeing ........... 57 2.2 Cummins Homeostatic Model of Subjective Wellbeing............................................... 64
2.2.1 Internal Buffers and Control of Subjective Wellbeing ............................................ 68 2.2.2 Summary of Homeostatic Model of SWB............................................................... 75
2.3 Adaptation-level Theory of Subjective Wellbeing........................................................ 76 2.4 Gap Theory Approach to Subjective Wellbeing ........................................................... 77
2.4.1 Michalos’ Multiple Discrepancies Theory .............................................................. 78 2.5 The Affective-Cognitive Model of SWB...................................................................... 86 2.6 Contrasting MDT, the Homeostatic Model, and Affective-Cognitive Theory ............. 88 2.7 Conclusion .................................................................................................................... 88
viii
TABLE OF FIGURES
Figure 1.2: The cost of purchasing a percentage point of SWB. ................................................ 13 Figure 1.3: Schematic description of Russell’s (2003, p. 148) Core Affect. .............................. 17 Figure 1.4: Schematic description of Larsen and Diener’s (1992, p. 39) Affect Circumplex.. .. 20 Figure 1.5: A circumplex representation of four alternative structures of affect. ....................... 27 Figure 1.6: Schematic description of domains of the circumplex model of affect sampled by
Watson et al.’s (1988) PANAS.............................................................................................. 28 Figure 2.1: Schematic description of distribution of life satisfaction scores. ............................. 66 Figure 2.2: Schematic description of control of SWB. ............................................................... 70 Figure 2.3: Schematic description of Homeostatic model of SWB. ........................................... 72

ix
TABLE OF TABLES
Table 2.1: Scales used by Headey and Wearing (1989, 1992) according to time of measurement................................................................................................................................................ 59
Table 2.2: Over-time correlations of LS, PA, and NA from Headey & Wearing (1992). .......... 61

x
TABLE OF EQUATIONS
Equation 1.1 .................................................................................................................................26 Equation 1.2 .................................................................................................................................44 Equation 2.1 .................................................................................................................................65 Equation 3.1 ...............................................................................................................................108 Equation 3.2 ...............................................................................................................................133 Equation 5.1 ...............................................................................................................................249 Equation 6.1 ...............................................................................................................................324 Equation 6.2 .............................................................................................................................. 344 Equation 6.3 .............................................................................................................................. 345 Equation 6.4 .............................................................................................................................. 346 Equation 6.5 .............................................................................................................................. 347 Equation 6.6 .............................................................................................................................. 347 Equation 6.7 .............................................................................................................................. 347 Equation 6.8 .............................................................................................................................. 360

1
GLOSSARY
%SM: percentage of scale maximum
AIC: Akaike’s Information Criterion
AGFI: Adjusted Goodness of Fit Index
ANEW: Affective Norms for English Words
AUWBI 8: Eighth survey of the Australian Unity Wellbeing Index
BDI: Beck Depression Inventory
BAWLC: Balanced Affective Word List Creation
CFI: Comparative Fit Index
DASS: Depression, Anxiety, and Stress Scale
Df: Degrees freedom
DV: Dependent Variable
ESM: Experience Sampling Methodology
FDR: False Discovery Rate procedure
GDP: Gross Domestic Product
GNP: Gross National Product
GT: Global Trait measurement
L-AUWBI 5: Fifth longitudinal survey of the Australian Unity Wellbeing Index
L-AUWBI 6: Sixth longitudinal survey of the Australian Unity Wellbeing Index
L-AUWBI 7: Seventh longitudinal survey of the Australian Unity Wellbeing Index
LDT: Lexical Decision Task
LOT-R: Life Orientation Test – Revised
LS: Life Satisfaction
M: Mean
MDT: Multiple Discrepancies Theory
MLM: Multi-Level Model(ling)
MR: Multiple Regression
MS: Mean State measurement
ms: Milliseconds
NA: Negative Affect
NEO-PI-R: NEO Personality Inventory, Revised
NFI: Normed Fit Index
NoP: No Priming
2
NP: Negative Priming
NvN: Negative versus Neutral task
P-A: Pleasant-activated affect
PA: Positive Affect
PACA: Pleasant-activated Core Affect
PANAS: Positive and Negative Affect Schedule
PDA: Personal Data Assistant
PLS: Plain Language Statement
PMAT: Purdue Momentary Assessment Tool
PP: Positive Priming
PvN: Positive versus Neutral task
PWI: Personal Wellbeing Index
QOL: Quality of Life
R: Recalled measurement
ResNvN: Residualised Reaction Time for Negative versus Neutral Task
ResPvN: Residualised Reaction Time for Positive versus Neutral Task
RMSEA: Root Mean Squared Error of Approximation
RSE: Rosenberg Self-Esteem scale
RT: Reaction Time
SD: Standard Deviation
SEM: Structural Equation Model(ling)
SMC: Squared Multiple Correlation
SWB: Subjective Wellbeing
SWLS: Satisfaction with Life Scale
TIPI: Ten Item Personality Inventory
VIT: Valence Identification Task
3
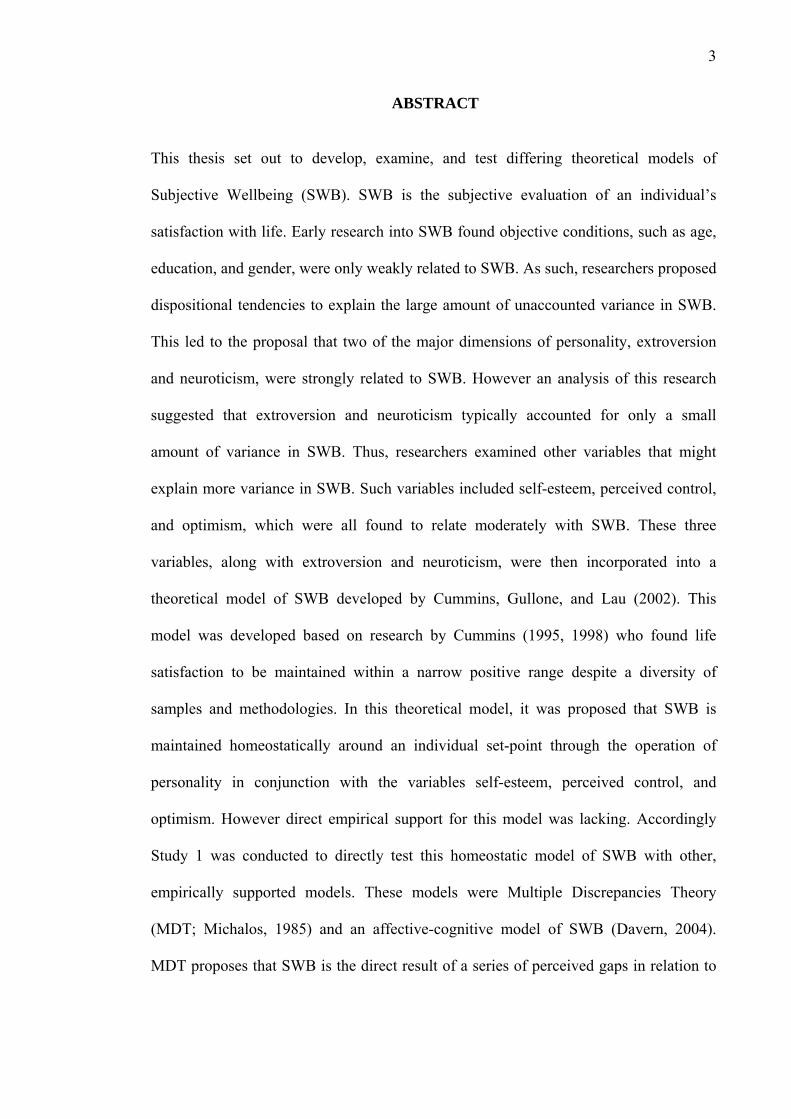
ABSTRACT
This thesis set out to develop, examine, and test differing theoretical models of
Subjective Wellbeing (SWB). SWB is the subjective evaluation of an individual’s
satisfaction with life. Early research into SWB found objective conditions, such as age,
education, and gender, were only weakly related to SWB. As such, researchers proposed
dispositional tendencies to explain the large amount of unaccounted variance in SWB.
This led to the proposal that two of the major dimensions of personality, extroversion
and neuroticism, were strongly related to SWB. However an analysis of this research
suggested that extroversion and neuroticism typically accounted for only a small
amount of variance in SWB. Thus, researchers examined other variables that might
explain more variance in SWB. Such variables included self-esteem, perceived control,
and optimism, which were all found to relate moderately with SWB. These three
variables, along with extroversion and neuroticism, were then incorporated into a
theoretical model of SWB developed by Cummins, Gullone, and Lau (2002). This
model was developed based on research by Cummins (1995, 1998) who found life
satisfaction to be maintained within a narrow positive range despite a diversity of
samples and methodologies. In this theoretical model, it was proposed that SWB is
maintained homeostatically around an individual set-point through the operation of
personality in conjunction with the variables self-esteem, perceived control, and
optimism. However direct empirical support for this model was lacking. Accordingly
Study 1 was conducted to directly test this homeostatic model of SWB with other,
empirically supported models. These models were Multiple Discrepancies Theory
(MDT; Michalos, 1985) and an affective-cognitive model of SWB (Davern, 2004).
MDT proposes that SWB is the direct result of a series of perceived gaps in relation to
4
an individual’s life circumstances. In contrast, the affective-cognitive model proposes
SWB is driven largely by trait affect in conjunction with MDT and personality.
Results of Study 1 did not support any of the three theoretical models. However,
support was found for an affective model of SWB in which Pleasant-Activated Core
Affect (PACA) was the sole predictor of SWB. Study 2 replicated these results in three
independent samples. In Study 3, a Reaction Time (RT) paradigm was used to examine
whether individual differences in affective processing correlated with SWB. Participants
completed a valence identification task, in which RTs to correctly identify the valence
of positive versus neutral, and negative versus neutral words, was measured. Individual
differences in affective processing was found to significantly influence RT. Individuals
high on positive affect performed worse than individuals low on positive affect. In
conjunction with the RT task, individuals also completed self-report measures of SWB
and trait affect. As in Studies 1 and 2, the trait PACA model of SWB provided an
excellent explanation of the data. However, conclusions regarding the efficacy of this
model could not be conclusively drawn, as the results from Studies 1, 2, and 3 were all
based on retrospective self-reports of affect and SWB. This is problematic as research
has demonstrated that such reports are subject to memory distortions and judgmental
biases. Accordingly, Study 4 was conducted using a different methodology to determine
the efficacy of the trait PACA model. This methodology is termed Experience Sampling
Methodology (ESM). In this ESM study, participants reported on momentary affect and
SWB at random intervals throughout the day for 14 days, on a personal data assistant
(PDA). ESM effectively solves the problems associated with retrospective self-reports
as the time lag between the signal and the response is minimal. ESM is also ecologically
valid as data are collected within the context of an individual’s daily life. Using

5
multi-level modelling and structural equation modelling, results again supported the
utility of the PACA model of SWB. This result, in conjunction with the results from
Studies 1, 2, and 3, strongly suggests that an affective model of SWB with trait PACA
as the sole determinant of SWB provides an efficacious and parsimonious explanation
of subjective judgments of life satisfaction.
6
CHAPTER 1: SUBJECTIVE WELLBEING CHARACTERISTICS
1. Introduction
The quest for happiness is fundamental to human beings. It is a state that most people
strive to achieve. Most of us can report, at least at some stage of our lives, being happy.
The meaning of happiness has evolved over time; our current conceptualisations are not
the same as those posited by early Greek philosophers. The basic correlate of happiness
in Aristotle’s time was referred to as eudaemonia, which roughly translates into the
highest good, a state that is not pursued for its own ends, but rather, gained by leading a
virtuous life. This concept of happiness is normative; happiness is judged as a desirable
state from an observer’s particular value framework (Diener, 1984). However modern
Western notions of happiness centre on the individuals subjective experience. Most
commonly, the correlate of happiness in today’s society is thought to be the
maximisation of pleasure and minimisation of pain.
Although the drive towards achieving happiness, whether normative or subjective, is
innate to being human, the study of how and why people strive to achieve happiness is
only a recent phenomenon that arose from the study and compilation of ‘social
indicators’. Social indicators were originally conceived of in North America in the
1960s as a response to the need to measure changes in society (Land, 1999). At the
time, the typical indices used to measure societal changes were of an economic nature;
for example, Gross Domestic Product (GDP) and Gross National Product (GNP). In
response to this, a class of indicator was developed that purported to measure an
individual’s subjective satisfaction with life, which included overall happiness, and
7
happiness or satisfaction with various life domains (such as work, family, etc.).
Subsequently, empirical research began to emerge that examined individual differences
in satisfaction scores (Andrews & Withey, 1976; Campbell, Converse, & Rodgers,
1976). Following these early studies, empirical research has grown exponentially and
given rise to the birth of a new field, that of ‘Quality of Life’ research.
Contributing to this growth in research was the move in psychology away from a strict
focus on illbeing, towards a broader focus incorporating wellbeing. This followed the
realisation that the absence of illbeing did not necessarily entail the presence of
wellbeing. This idea is reflected in the World Health Organisations definition of
wellbeing, in which wellbeing is characterised by the presence of “complete physical,
mental and social wellbeing, and not merely the absence of disease or infirmity” (WHO,
1946, p.1). Psychology was now beginning to ask how and why people felt good, and
how this contributed to positive mental health. This question has become the core of
research in the quality of life field.
At this point, a taxonomy of definitions is required as research in this field often
employs differing terms. Quality of life consists of objective and subjective
components. Objective quality of life considers the degree that a life meets
norm-referenced standards as judged by an impartial outsider. In contrast, subjective
quality of life concerns self-appraisals of an individual’s satisfaction with life
(Veenhooven, 1999). The relation between objective and subjective quality of life will
be discussed further in the following section, however, the remainder of this review will
emphasise subjective quality of life research.
8
The term “subjective quality of life” is also referred to as life satisfaction (LS), and is
often used interchangeably with the term Subjective Wellbeing (SWB). Researchers
have hypothesised that subjective wellbeing comprises two components of evaluation
(Diener, 1984; Pavot, Diener, Colvin, Sandvik, 1991). The first component is a
cognitive evaluation of how satisfactory an individual rates their life, either as a whole,
or in various domains. The former evaluation is generally denoted the ‘global approach’
and is typically measured via self-report by asking some variant of the question, “How
satisfied are you with your life as a whole?”, whilst the latter is thought of as the
domain approach and is asked by, “How satisfied are you with domain x?” It is also
important to note that scores on each domain are summed to yield an overall satisfaction
score. The second component of subjective wellbeing is proposed to be an affective
evaluation of one’s life. That is, an evaluation that taps into the long-term affective state
(i.e., pleasure and displeasure, or positive and negative affect) of an individual, often
measured by self-report questionnaires. Researchers have reported that life satisfaction
judgements form a separate factor from affective evaluations of one’s life (Andrews &
Withey, 1976; Diener, Suh, Lucas & Smith, 1999).
Diener is a major proponent in the field of subjective wellbeing research and has
amassed a large body of SWB research. In 1984, Diener published a major review of the
subjective wellbeing literature in which his starting point was to note that a prior review
of the field conducted by Wilson in 1967 came to two broad conclusions. Firstly, those
who were the happiest were those with the most advantages (i.e., young, well-educated,
healthy, etc). Secondly, that since the time of the ancient Greek philosophers, little
theoretical progress had been made towards understanding happiness. Diener noted that
9
since the publication of Wilson’s review, little had changed in terms of theoretical
progress in the field of subjective wellbeing research.
This review will attempt to address the lack of theoretical progress noted by Diener
(1984) by furthering the understanding of subjective wellbeing. This discussion will
progress from an identification of the characteristics of SWB; to examining the
variables thought to relate to SWB; to finally, critically evaluating theoretical models of
SWB that attempt to integrate such variables.
2. Characteristics of Subjective Wellbeing
2.1 Objective and Subjective Wellbeing
It is important to firstly identify the parameters of wellbeing research that this review
will focus on. While quality of life can be separated into objective and subjective
components, the quality of life field often does not distinguish between the two. This is
evident in an analysis of the literature by Cummins (1997) in which an overwhelming
majority (80%) of the definitions of quality of life referred to both objective and
subjective components, whilst a minority referred to the latter only (20%). This mixture
of the objective and subjective components of wellbeing leads to confusion and hinders
understanding. To clear this confusion and further the understanding of subjective
wellbeing, it is necessary to examine the relation between objective and subjective
quality of life.
10
According to Diener (1984), one of the characteristics of subjective wellbeing is its
subjectivity. Objective conditions are seen as potential influences, but not as an inherent
or necessary part of SWB. The weak relation between objective conditions and
subjective wellbeing has been highlighted by a number of studies (Cummins, 1997,
2000; Diener, 1999). In one particular study, Cummins (2000) analysed the relation
between objective and subjective quality of life indicators. An evaluation of 10 studies
was conducted whereby, within each study, objective indicators were correlated with
other objective indicators (i.e., education and income); subjective indicators were
correlated with other subjective indictors (i.e., life satisfaction and happiness), and
finally, both objective and subjective indicators were correlated (i.e., education and life
satisfaction). Cummins found that the average of the objective correlations (M=.32,
SD=.05) and subjective correlations (M=.38, SD=.15) did not significantly differ,
however, both of these average correlations were significantly higher than the average
correlation between objective and subjective indicators (M=.12, SD=.08). This result
suggested that objective and subjective quality of life indicators are poorly correlated.
However, the relationship between objective and subjective indicators was proposed by
Cummins to be non-linear. Specifically, when objective circumstances become
detrimental, and the organism’s capacity for adaptation is exceeded, objective and
subjective indicators would strongly co-vary (Cummins, 2000). This co-variation has
been demonstrated by studies that have examined the effect of income on subjective
wellbeing. A strong relation exists when levels of income are such that a basic material
standard of living cannot be achieved. For instance, in a survey of over 2,000 South
Africans, Moller and Dickow (2002) found wealthy South Africans, regardless of race,
reported higher life satisfaction than poorer South Africans (also see Graham &
Pettinato, 2002 for an analysis of income and SWB in developing countries). However,
11
Diener and C. Diener (1995) note that once basic standards have been met, the effects of
increasing levels of income become marginal. This curvilinear relationship between
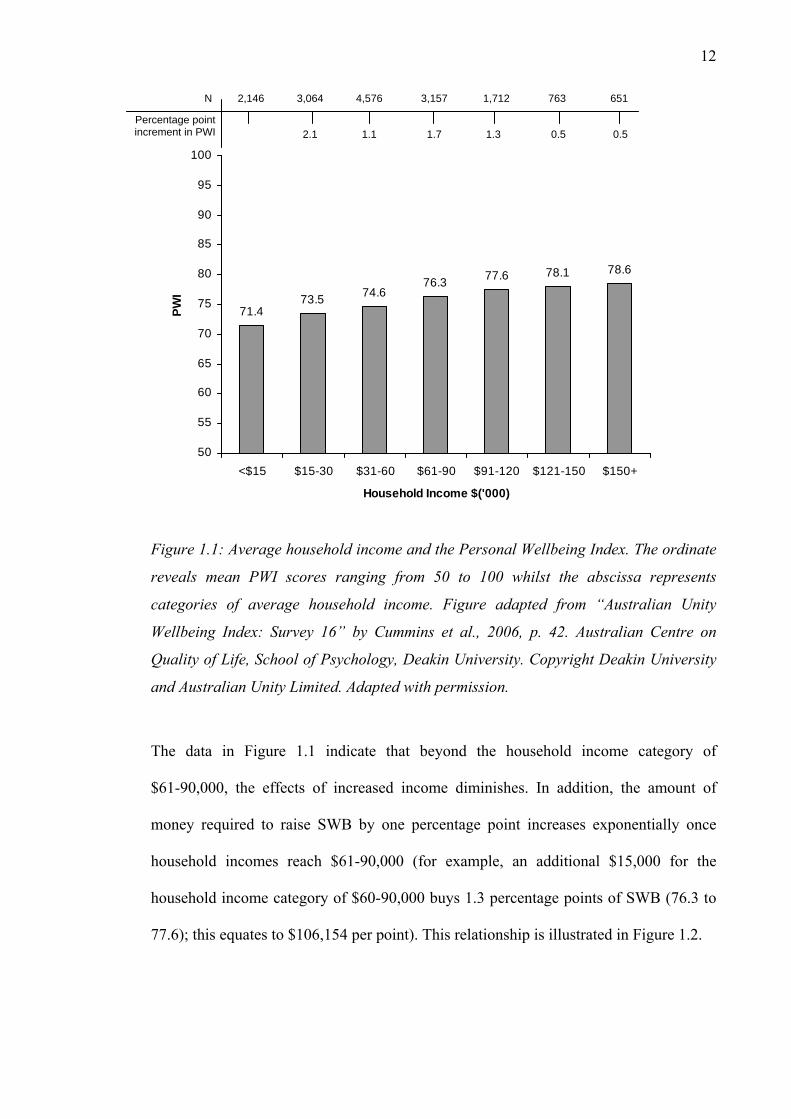
income and subjective wellbeing is illustrated in a geographically representative survey
of 16,069 Australians (Cummins, Woerner, Tomyn, Gibson, & Knapp, 2006). In this
survey, individuals provided reports on life satisfaction as well as satisfaction with
various domains. Together these domains represent the Personal Wellbeing Index
(PWI), which was developed as the first level deconstruction of global life satisfaction.
Individuals in this survey also provided estimates of annual gross household income,
allowing the relation between SWB (as measured by the PWI) and income to be
assessed. The results of this analysis are presented in Figure 1.1.
12
71.473.5 74.6
76.3 77.6 78.1 78.6
50
55
60
65
70
75
80
85
90
95
100
<$15 $15-30 $31-60 $61-90 $91-120 $121-150 $150+
Household Income $('000)
PWI
Figure 1.1: Average household income and the Personal Wellbeing Index. The ordinate
reveals mean PWI scores ranging from 50 to 100 whilst the abscissa represents
categories of average household income. Figure adapted from “Australian Unity
Wellbeing Index: Survey 16” by Cummins et al., 2006, p. 42. Australian Centre on
Quality of Life, School of Psychology, Deakin University. Copyright Deakin University
and Australian Unity Limited. Adapted with permission.
The data in Figure 1.1 indicate that beyond the household income category of
$61-90,000, the effects of increased income diminishes. In addition, the amount of
money required to raise SWB by one percentage point increases exponentially once
household incomes reach $61-90,000 (for example, an additional $15,000 for the
household income category of $60-90,000 buys 1.3 percentage points of SWB (76.3 to
77.6); this equates to $106,154 per point). This relationship is illustrated in Figure 1.2.
Percentage point increment in PWI
N 2,146 3,064 4,576 3,157 1,712 763 651
2.1 1.1 1.7 1.3 0.5 0.5
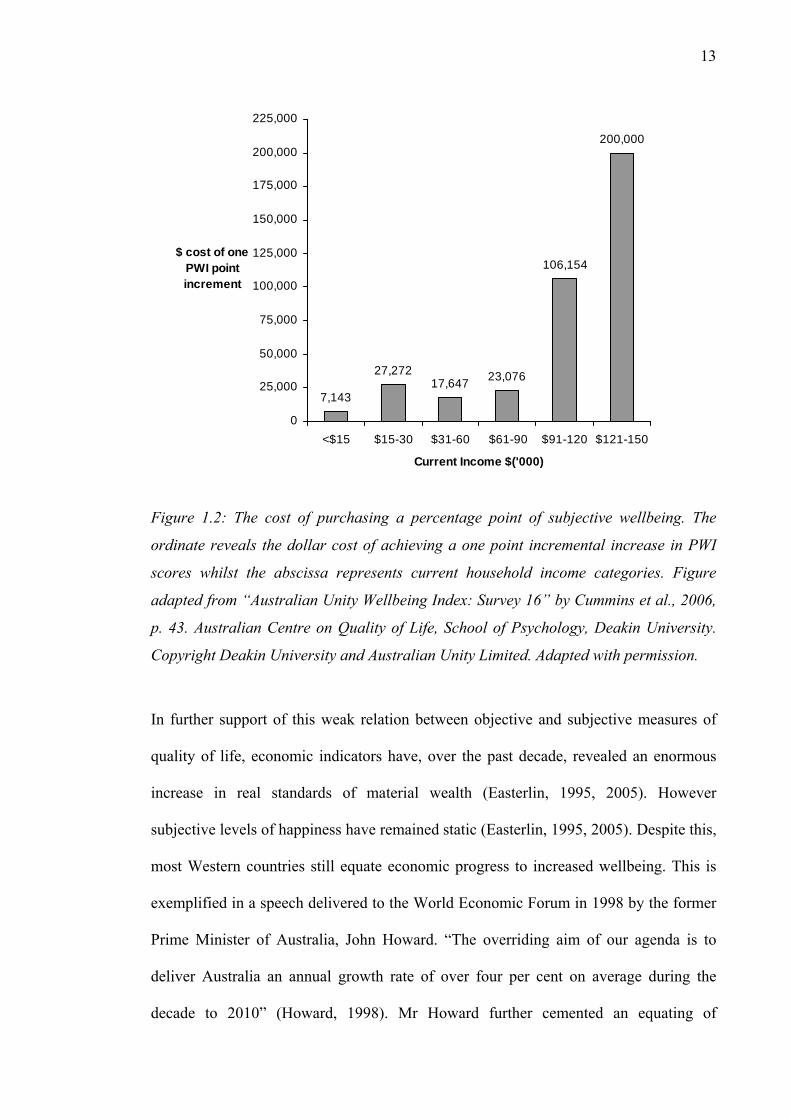
13
7,143
27,27217,647 23,076
106,154
200,000
0
25,000
50,000
75,000
100,000
125,000
150,000
175,000
200,000
225,000
<$15 $15-30 $31-60 $61-90 $91-120 $121-150
Current Income $('000)
$ cost of one PWI point increment
Figure 1.2: The cost of purchasing a percentage point of subjective wellbeing. The
ordinate reveals the dollar cost of achieving a one point incremental increase in PWI
scores whilst the abscissa represents current household income categories. Figure
adapted from “Australian Unity Wellbeing Index: Survey 16” by Cummins et al., 2006,
p. 43. Australian Centre on Quality of Life, School of Psychology, Deakin University.
Copyright Deakin University and Australian Unity Limited. Adapted with permission.
In further support of this weak relation between objective and subjective measures of
quality of life, economic indicators have, over the past decade, revealed an enormous
increase in real standards of material wealth (Easterlin, 1995, 2005). However
subjective levels of happiness have remained static (Easterlin, 1995, 2005). Despite this,
most Western countries still equate economic progress to increased wellbeing. This is
exemplified in a speech delivered to the World Economic Forum in 1998 by the former
Prime Minister of Australia, John Howard. “The overriding aim of our agenda is to
deliver Australia an annual growth rate of over four per cent on average during the
decade to 2010” (Howard, 1998). Mr Howard further cemented an equating of
14
economic progress with wellbeing in April of 2000, when he stated that, “economic
reform is about satisfying human needs. Economic reform is about making people feel
more secure, happier [emphasis added], more able to care for their families” (Howard,
2000). In contrast to this governmental view, social research has identified that the
equating of economic progress and wellbeing is at odds with the majority view of
Australians. In a survey of 1,200 Australians, Eckersley (1999) found that 75% of
respondents considered spending more time with family and friends was very important
to improving personal quality of life. In comparison, only 38% of respondents regarded
more money to buy things as very important to improving quality of life.
The constant rise in economic wealth, with no equivalent rise in quality of life, has led
some researchers to propose a threshold hypothesis whereby levels of per capita Gross
National Product (GNP) are strongly linked to quality of life up to a sufficient point,
beyond which any greater rise in economic wealth has zero or negative effects
(Max-Neef, 1995). Max-Neef provides observational evidence in support of this
hypothesis. The Index of Sustainable Economic Welfare (ISEW), an index that
combines social factors, income inequalities and environmental deterioration, was
plotted against the per capita GNP for five different countries (United States, United
Kingdom, Germany, Austria, and the Netherlands). Max-Neef found that the ISEW runs
parallel to per capita GNP for the period between 1950 and the 1970s. However, as per
capita GNP continued to rise from the 1970s onwards, in all countries the ISEW not
only levels off but also declines sharply. This led the author to speculate that such
countries may have approached a point in which quantitative growth must be
metamorphosed into qualitative development for progress in quality of life to result. In
15
other words, economic growth, in and of itself, is not sufficient to produce increases in
individuals’ or countries’ happiness and satisfaction.
The empirical research reviewed above demonstrates that objective quality of life, best
exemplified by economic indicators such as GDP and GNP, is minimally related to
subjective experiences of wellbeing. As such, a necessary distinction between objective
and subjective quality of life has been proposed by Cummins (1997). As the quality of
life literature often employs definitions conflating objective and subjective components,
Cummins argues for a consensus on the definition of quality of life based upon three
key propositions: (a) quality of life refers to both objective and subjective dimensions
of human life, (b) the objective dimension incorporates norm-referenced measures of
wellbeing, and (c) the subjective dimension includes measures of perceived wellbeing.
Cummins notes that the subjective dimension is often referred to as “Subjective
Wellbeing”. As such, in this review subjective wellbeing will be considered
synonymous with the terms subjective quality of life, and wellbeing.
Based on the discussion of the distinction between objective and subjective quality of
life, and the weak relation between the two, the subject of the current review will focus
on subjective quality of life.
2.2 Affect and Subjective Wellbeing
As mentioned previously, affect is of central importance to considerations of life
satisfaction as it is proposed to comprise a major component of SWB (Diener et al.,
1999). Along with research into SWB, affect research often employs differing terms.
16
Terms such as mood, emotion, valence, and affect are often used interchangeably.
Russell (2003) notes that this is problematic, as emotions are qualitatively different
from moods and affect. Emotions include a substantial evaluative component, as an
emotion is usually directed at, or attached to, an event or object. For instance, an
individual, encountering a snake, is afraid of the snake (or more precisely, of the snake
causing physical harm; Russell, 2003). In comparison, moods are often, although not
always, objectless. In a search for the primitive components associated with affect,
valence, moods, and emotions, Russell proposed what he termed “Core Affect”. Core
affect is the combination of two objectless dimensions of pleasure-displeasure and
activation-deactivation, and is the primitive component associated with felt emotion and
moods. Specifically core affect is a consciously accessible neurophysiological state
comprised of a blend of hedonic and arousal values. It is simple, objectless, universal,
and ubiquitous, existing prior to any attribution about its cause. Therefore, core affect is
not cognitive or reflective, as cognitive events are intrinsically about something
(Russell, 2003). This distinction between emotions and moods is applied throughout this
thesis. In addition, moods and affect will be considered synonymous. The structure of
Russell’s core affect is presented in Figure 1.3.
17
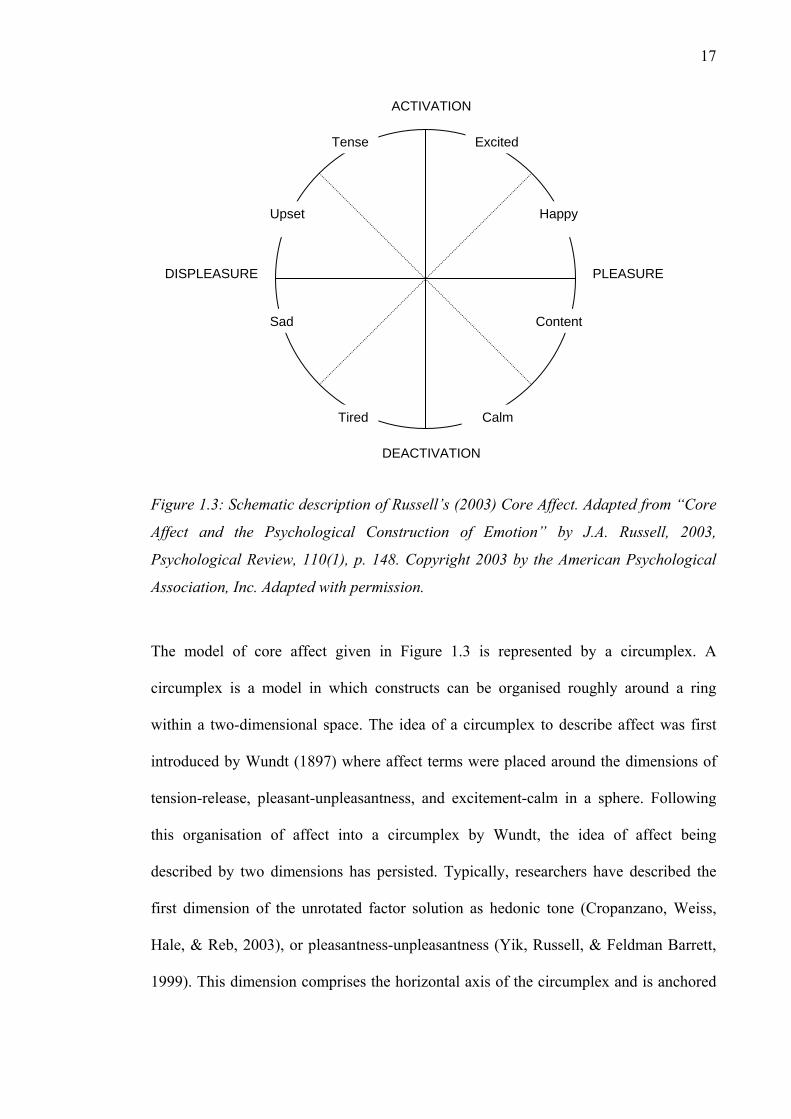
Figure 1.3: Schematic description of Russell’s (2003) Core Affect. Adapted from “Core
Affect and the Psychological Construction of Emotion” by J.A. Russell, 2003,
Psychological Review, 110(1), p. 148. Copyright 2003 by the American Psychological
Association, Inc. Adapted with permission.
The model of core affect given in Figure 1.3 is represented by a circumplex. A
circumplex is a model in which constructs can be organised roughly around a ring
within a two-dimensional space. The idea of a circumplex to describe affect was first
introduced by Wundt (1897) where affect terms were placed around the dimensions of
tension-release, pleasant-unpleasantness, and excitement-calm in a sphere. Following
this organisation of affect into a circumplex by Wundt, the idea of affect being
described by two dimensions has persisted. Typically, researchers have described the
first dimension of the unrotated factor solution as hedonic tone (Cropanzano, Weiss,
Hale, & Reb, 2003), or pleasantness-unpleasantness (Yik, Russell, & Feldman Barrett,
1999). This dimension comprises the horizontal axis of the circumplex and is anchored
ACTIVATION
DEACTIVATION
PLEASURE DISPLEASURE
Happy
Content
Upset
Sad
ExcitedTense
Tired Calm
18
by terms such as happy and contented for the pleasant pole, and upset and sad for the
unpleasant pole. Following the extraction of the pleasant-unpleasantness dimension, a
second dimension was extracted that relates to the intensity with which one experiences
positive and negative emotions. This dimension has been labelled
activation-deactivation (Cropanzano et al., 2003) and comprises the vertical axis of the
circumplex. Terms that anchor this dimension include tense and alert for the activated
pole, and fatigued and calm for the deactivated pole.
The circumplex model of affect is one of many different structures used to describe
affect. To determine the utility of Russell’s (2003) core affect, and the circumplex
model of affect, it is necessary to examine some of the more popular alternative
structures of affect.
The most common and widely cited model of affect was provided by Watson, Clark,
and Tellegen (1988) who, following psychometric research, found positive and negative
emotions to cluster together. Watson et al. interpreted this as evidence for the
separability of positive and negative affect, labelling the cluster of positive emotions
positive affect (PA), and the cluster of negative emotions negative affect (NA). High PA
is characterised by pleasurable engagement. However, low PA does not indicate
presence of negative affect. A low PA state could best be characterised by the absence
of positive ‘activated’ affect (i.e., enthusiastic or excited) indicated by descriptors such
as tired or bored (Watson et al., 1988). This also applies to NA, which is characterised
by feelings of distress and unpleasurable engagement. High NA is most related to states
such as hostility or anger. In contrast, low NA indicates a state characterised by
calmness or relaxation. The Positive and Negative Affect Schedule (PANAS) developed
19
by Watson et al. purports to measure both PA and NA. Participants are asked to rate
adjectives on a scale anchored from 1 (very slightly or not at all) to 5 (extremely)
according to how strongly that adjective describes how they feel. The adjectives
include, distressed, upset, scared, and hostile for NA; excited, enthusiastic, active, and
interested for PA. It is important to note that these adjectives do not measure the low
poles of each dimension of PA and NA (such as tired and bored or calm and relaxed).
This shortcoming has been addressed in an alternative structure of affect, Larsen and
Diener’s (1992) eight combinations of pleasantness and activation.
Larsen and Diener (1992) began by cautioning researchers that Watson et al.’s (1988)
proposed dimension of “Positive Affect” is misleading as it does not consider states
such as happiness, contentment, and pleasure to comprise PA. Similarly, Watson et al.’s
proposed NA dimension excludes states such as sadness, which is considered a central
exemplar of negative affect (Larsen & Diener, 1992). Thus, Watson et al.’s proposed
dimensions only sample high activation affective states, thereby excluding a large
portion of an individual’s affective experience. To correct for this, Larsen and Diener
put forth a version of the circumplex model of affect with simpler labels to avoid
confusion. The authors began from the premise that affective states vary on both
valence and activation. Thus, the horizontal axis of the circumplex is labelled
pleasantness, and the vertical axis of the circumplex is labelled activation (see
Figure 1.4).
20
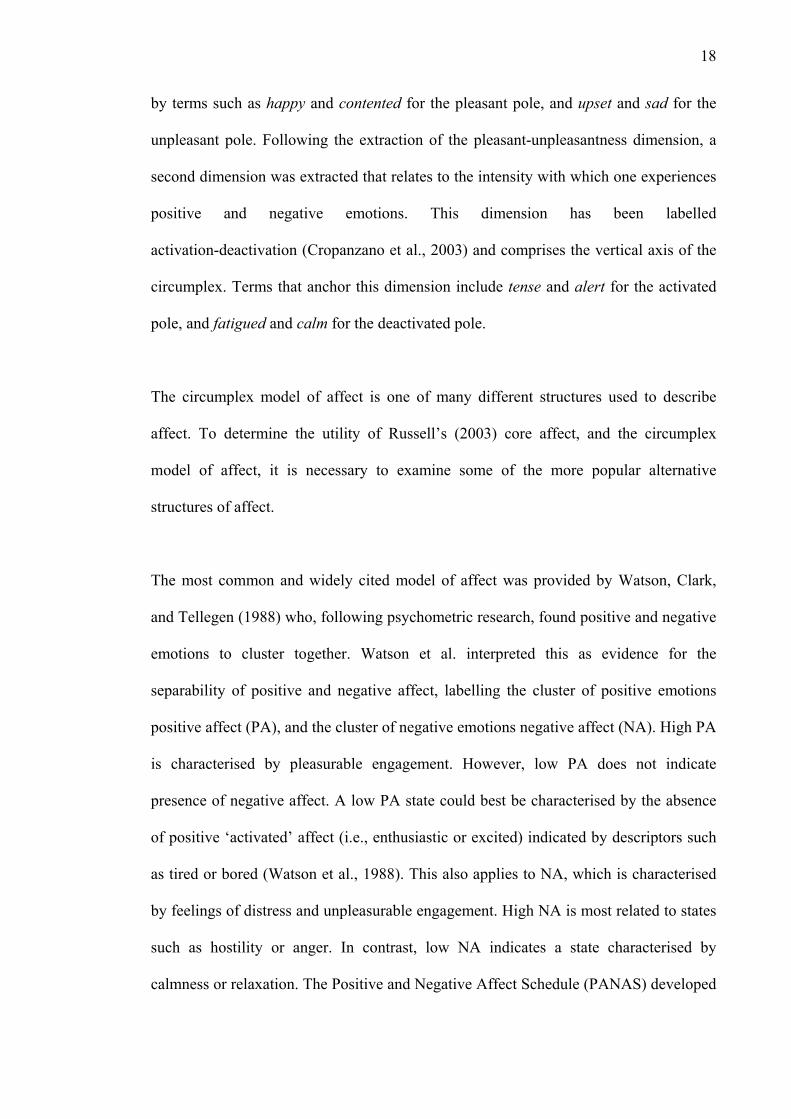
Figure 1.4: Schematic description of Larsen and Diener’s (1992) Affect Circumplex.
Adapted from “Structure of Self-Reported Current Affect: Integration and Beyond” by
M.S.M. Yik et al., 1999, Journal of Personality and Social Psychology, 77(3), p. 601.
Copyright 1999 by the American Psychological Association, Inc. Adapted with
permission.
In Figure 1.4 any state falling in the upper half of the circumplex is prefixed with
“activated” whilst any state falling on the right half of the circumplex is prefixed with
“pleasant”. This yields eight combinations of affect, ranging from activated unpleasant
affect, to unactivated pleasant affect. Larsen and Diener (1992) do not provide empirical
evidence supporting their model, and as such, no conclusions could be drawn as to its
utility. It does however, seem an intuitive structure of affect.
An alternative structure of affect has also been provided by Thayer (1987). In
comparison with Larsen and Diener (1992), Thayer proposed a model of affect with a
focus on activation rather than activation and pleasantness. Specifically, Thayer’s
LOW ACTIVATION
PLEASANT
HIGH ACTIVATION
UNPLEASANT
Activated Unpleasant
Activated Pleasant
Unactivated Unpleasant
Unactivated Pleasant
21
structure of affect comprises two dimensions, energetic arousal and tense arousal. These
dimensions are proposed to form different subjective energy states. For example,
calm-tiredness and calm-energy are states that occur without appreciable tension. Such
states may be seen as somewhat similar to Larsen and Diener’s pleasantness (for
calm-energy) and low-activation (for calm-tiredness). Conversely, tense-energy and
tense-tiredness are states which involve varying levels of energy with chronic anxiety or
tension. Such states may be considered similar with Larsen and Diener’s high activation
(for tense-energy) and unpleasantness (for tense-tiredness). Empirical support for these
separate affective states was provided by Thayer in a study of 18 undergraduates.
Following moderate exercise, individuals reported states associated with calm-energy.
Thayer also found that following ingestion of a sugar snack, participants reported states
associated with tense-energy followed by states associated with tense-tiredness.
However these effects were not significant.
These four different structures of affect each attempt to account for an individual’s
affective experience. In order to draw conclusions regarding the utility of any of these
four structures of affect, it is necessary to examine an empirical test of each model. This
test was conducted by Yik et al. (1999), who examined the four different structures of
affect: Russell’s (2003) circumplex; Watson and Tellegen’s (1985) positive and
negative affect; Thayer’s (1987) tense and energetic arousal; and Larsen and Diener’s
(1992) eight combinations of pleasantness and activation. Yik et al. hypothesised that
although these four structures have each been proposed as general descriptors of
affective states, considerable overlap occurs such that these four constructs can be
integrated into one circumplex model. The authors tested this hypothesis using two
separate data sets. The first data set comprised 198 undergraduates from Boston, whilst
22
the second data set comprised 217 undergraduates from Vancouver. All participants
completed the Current Mood Questionnaire (CMQ; which purports to measure
momentary pleasant, unpleasant, activated, and deactivated states), in order to test the
vertical and horizontal axes of the circumplex respectively. The authors took measures
to ensure that the CMQ items did not overlap with those from other constructs. In
particular, participants from the Boston sample only completed scales corresponding to
Watson et al.’s (1988) PA and NA dimensions. Similarly, participants in the Vancouver
sample only completed scales corresponding to Larsen and Diener’s and Thayer’s
constructs of affect. Each of the four constructs was assessed with three scales, all using
different response formats. The first scale comprised an adjective list, with adjectives
sourced from the original authors of the construct. Each adjective was rated on a Likert
scale with responses ranging from 1 (not at all), to 5 (extremely). The remaining two
scales comprised a set of statements to which participants indicated their degree of
agreement (scale two) and how well the statements described their current feelings
(scale three).
Yik et al. (1999) then tested: (a) the bipolarity of the four structures, (b) the adequacy of
the measurement model for each structure, (c) whether the dimensions of
pleasant-unpleasant and activated-deactivated could account for substantial variance in
each structure, and (d) whether the four structures could be incorporated into one
two-dimensional circumplex model of affect. The results of the analysis by Yik et al.
will thus be presented in the above order beginning with (a) the test of bipolarity.
In the test of bipolarity for the pleasant-unpleasant and activated-deactivated dimensions
(measured using the CMQ) in the Boston sample, pleasant-unpleasant correlated at -.92
23
across the three response formats, whilst activated-deactivated correlated at -.77. In the
Vancouver sample these correlations were -.89 and -.71 respectively. For Watson and
Tellegen’s (1985) construct, high and low PA correlated at -.73 whilst high and low NA
correlated at -.79. For Larsen and Diener’s (1992) construct, activated-pleasant and
unactivated-unpleasant correlated at -.52 whilst activated-unpleasant and
unactivated-pleasant correlated at -.76. Thayer’s (1987) energy and tiredness
dimensions correlated at -.69 whilst the dimensions of tension and calmness correlated
at -.66. These results led Yik et al. (1999) to conclude that although not all pairs could
be considered perfect bipolar opposites (as indicated by a correlation approaching -1),
they fit the pattern expected of bipolar opposites.
Yik et al. (1999) tested the appropriateness of the measurement models for each
structure using confirmatory factor analyses. A confirmatory factor analysis of the
CMQ, with four latent constructs measuring the pleasant, unpleasant, activated, and
deactivated quadrants, provided a moderate fit to the data in the Boston sample
(χ2/df=3.11, RMSEA=.10, AGFI=.82, CFI=.95). The measurement model provided a
better fit to the data in the Vancouver sample (χ2/df=2.36, RMSEA=.07, AGFI=.87,
CFI=.98). In addition, this model provided a significantly better fit to the data in both
samples than a model which fixed the correlations between the latent constructs to zero.
The measurement model for Watson and Tellegen’s (1985) structure provided a good fit
the data (χ2/df=2.11, RMSEA=.07, AGFI=.88, CFI=.98), as did the measurement
model’s for Larsen and Diener’s (1992) structure (χ2/df=1.75, RMSEA=.06, AGFI=.90,
CFI=.99) and Thayer’s (1987) structure (χ2/df=2.16, RMSEA=.07, AGFI=.88,
CFI=.99). For each construct, the model specifying correlations between the latent
constructs provided a significantly better fit to the data than a model specifying no
24
relationship between the latent constructs. Based on these results Yik et al. concluded
that the individual structures of the four models were adequately measured.
The main hypothesis of the study conducted by Yik et al. (1999) was that the two
dimensions of pleasant-unpleasant and activation-deactivation could account for a large
proportion of variance in the four different structures of affect, thereby pointing toward
the possibility that these structures were describing the same two-dimensional space and
could be integrated into such a space. The authors tested this hypothesis by firstly
comparing Larsen and Diener’s (1992) structure and Thayer’s (1987) structure. The
authors found that correlating and combining these two structures into one measurement
model resulted in a good fit to the data (χ2/df=1.81, RMSEA=.06, AGFI=.82,
CFI=.98). In addition, this model fit the data significantly better than a model in which
the correlations between the constructs were fixed to zero. The authors also found that
Larsen and Diener’s four dimensions and Thayer’s four dimensions (hypothesised to be
equivalent), were extremely strongly correlated (correlations ranged from .91 to .95).
Based on these results, Yik et al. concluded that Thayer’s structure and Larsen and
Diener’s structure were essentially describing the same dimensions of affect.
Following this, Yik et al. (1999) used Structural Equation Modelling (SEM) to predict
each construct of the four structures of affect with the pleasant-unpleasant and
activated-deactivated dimensions. For instance, in one of the models, the latent variables
pleasant-unpleasant and activated-deactivated were used to predict Larsen and Diener’s
(1992) activated-pleasant construct. Another three models were used to assess the
remaining three constructs (unactivated-unpleasant, activated-unpleasant, and
unactivated-pleasant). In testing these models, across four measures, the two dimensions
25
of pleasant-unpleasant and activation-deactivation accounted for between 53% and 77%
of variance (M=66%) in Larsen and Diener’s constructs when these constructs were
treated as unipolar. When Larsen and Diener’s constructs were treated as bipolar (i.e.,
activated-pleasant vs. unactivated-unpleasant) the pleasant-unpleasant and
activated-deactivated dimensions accounted for between 81% to 83% variance
(M=82%). Similar results were obtained in each of the remaining two structures of
affect. For Thayer’s (1987) constructs, between 57% and 75% of variance (M=64%)
across four measures was accounted for by the pleasant-unpleasant and
activated-deactivated dimensions. When Thayer’s constructs were treated as bipolar,
variance explained rose to between 73% and 80% (M=77%). Similarly, for Watson and
Tellegen’s (1985) constructs, across four measures the pleasant-unpleasant and
activated-deactivated dimensions accounted for between 79% and 90% variance
(M=87%). When Watson and Tellegen’s (1985) constructs were treated as bipolar,
variance explained rose to between 92% and 97% (M=95%). These analyses
demonstrated that the three different structures of affect could be adequately explained
using the two dimensions of the circumplex model of affect,
pleasantness-unpleasantness and activation-deactivation. These results were interpreted
by Yik et al. to be supportive of the proposition that the four constructs may be
considered alternative descriptors of the same two-dimensional space. Following this,
Yik et al. then attempted to integrate each structure into one, two-dimensional
circumplex model of affect.
Yik et al. (1999) attempted to identify the nature of the two-dimensional circumplex
model by plotting each unipolar construct for each structure of affect using a structural
equation modelling program (CIRCUM) that provides estimates of the location of each
26
variable on a circle. Pleasant was designated as the reference variable, and was fixed at
zero degrees. Each construct was then estimated relative to pleasant. For the Boston
sample, the circumplex model provided an inadequate fit to the data (χ2=43.64, df=10,
p<.001, χ2/df=4.36, RMSEA=.13). Similarly, the circumplex model for the Vancouver
sample provided an inadequate fit to the data (χ2=168.39, df=39, p<.001, χ2/df=4.32,
RMSEA=.12). As RMSEA is dependent on the number of participants sampled, it is
possible to model the effect of increasing the sample size presuming the other
parameters (such as error and degrees freedom) remain constant. The relationship
between sample size and RMSEA is illustrated in Equation 1.1.
dfNdfRMSEA
2
×−
=χ (Eqn. 1.1)
thus: dfRMSEA
df2
2
×−χ = N
Where χ2 = chi-square; N = number of participants; df = degrees freedom.
In order to obtain an RMSEA of .08 (the maximum acceptable value), the Vancouver
sample would need to be increased to N=526 and the Boston sample would need to be
increased to N=519. The circumplex’s for both samples were then superimposed on one
another by Yik et al. (1999) to represent all of the unipolar constructs in one
two-dimensional model. This model is reproduced from Yik et al. and given in
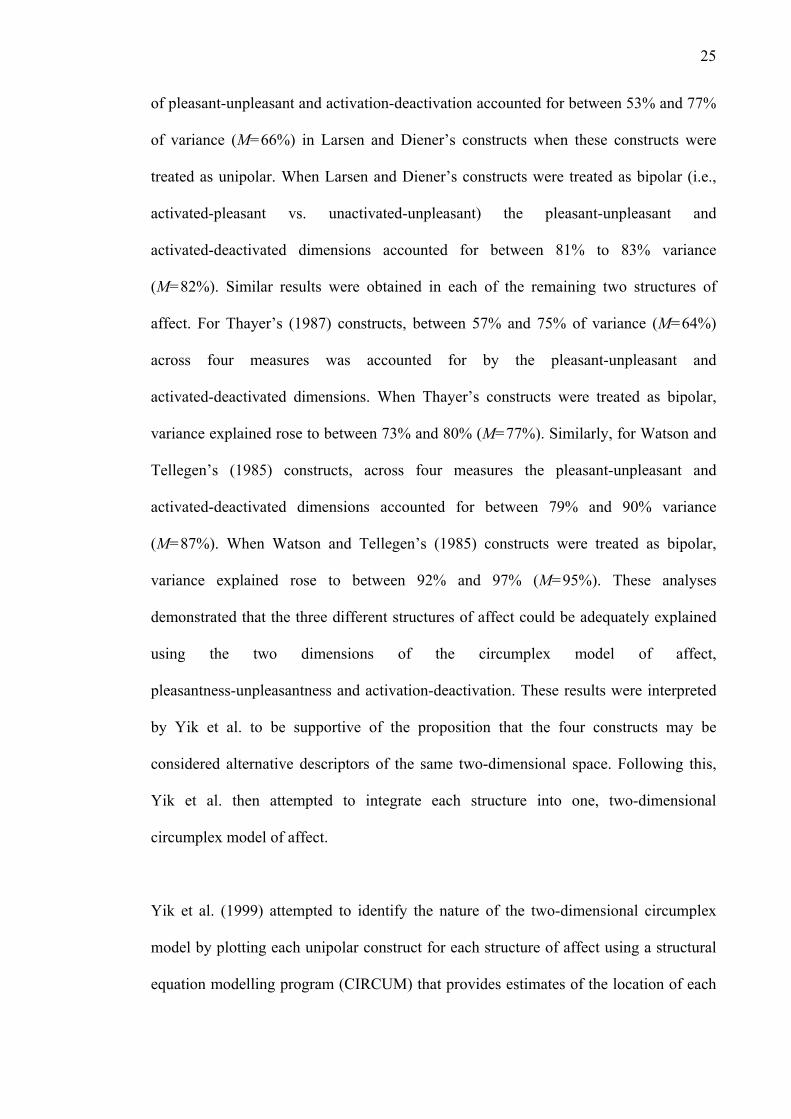
Figure 1.5.
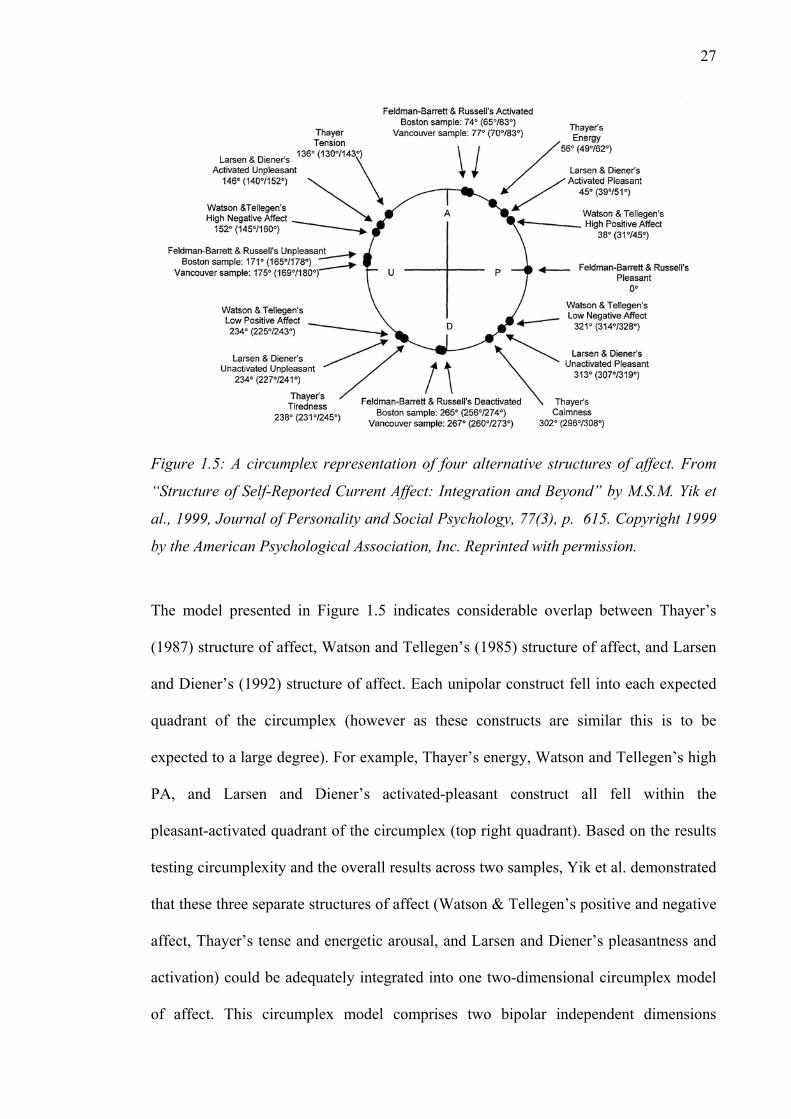
27
Figure 1.5: A circumplex representation of four alternative structures of affect. From
“Structure of Self-Reported Current Affect: Integration and Beyond” by M.S.M. Yik et
al., 1999, Journal of Personality and Social Psychology, 77(3), p. 615. Copyright 1999
by the American Psychological Association, Inc. Reprinted with permission.
The model presented in Figure 1.5 indicates considerable overlap between Thayer’s
(1987) structure of affect, Watson and Tellegen’s (1985) structure of affect, and Larsen
and Diener’s (1992) structure of affect. Each unipolar construct fell into each expected
quadrant of the circumplex (however as these constructs are similar this is to be
expected to a large degree). For example, Thayer’s energy, Watson and Tellegen’s high
PA, and Larsen and Diener’s activated-pleasant construct all fell within the
pleasant-activated quadrant of the circumplex (top right quadrant). Based on the results
testing circumplexity and the overall results across two samples, Yik et al. demonstrated
that these three separate structures of affect (Watson & Tellegen’s positive and negative
affect, Thayer’s tense and energetic arousal, and Larsen and Diener’s pleasantness and
activation) could be adequately integrated into one two-dimensional circumplex model
of affect. This circumplex model comprises two bipolar independent dimensions
28
labelled pleasantness-unpleasantness and activation-deactivation. Thus the circumplex
model of affect represents an efficacious measure of affect that attempts to account for a
large diversity of affective states.
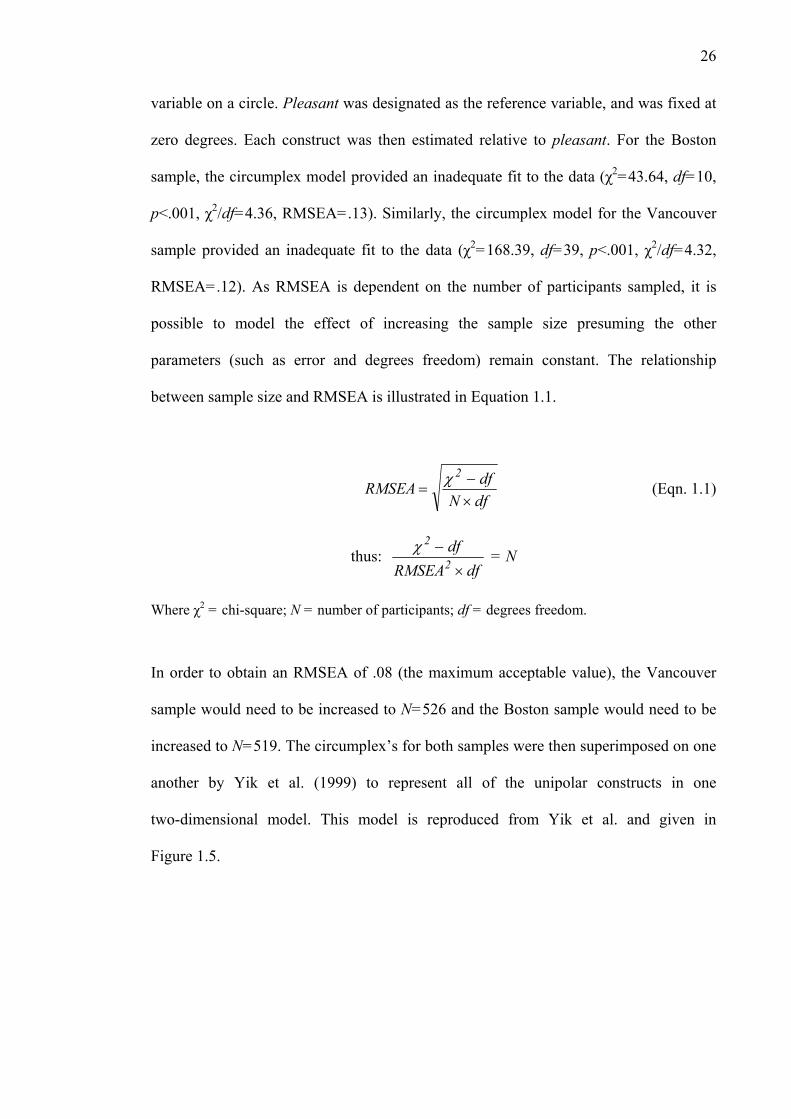
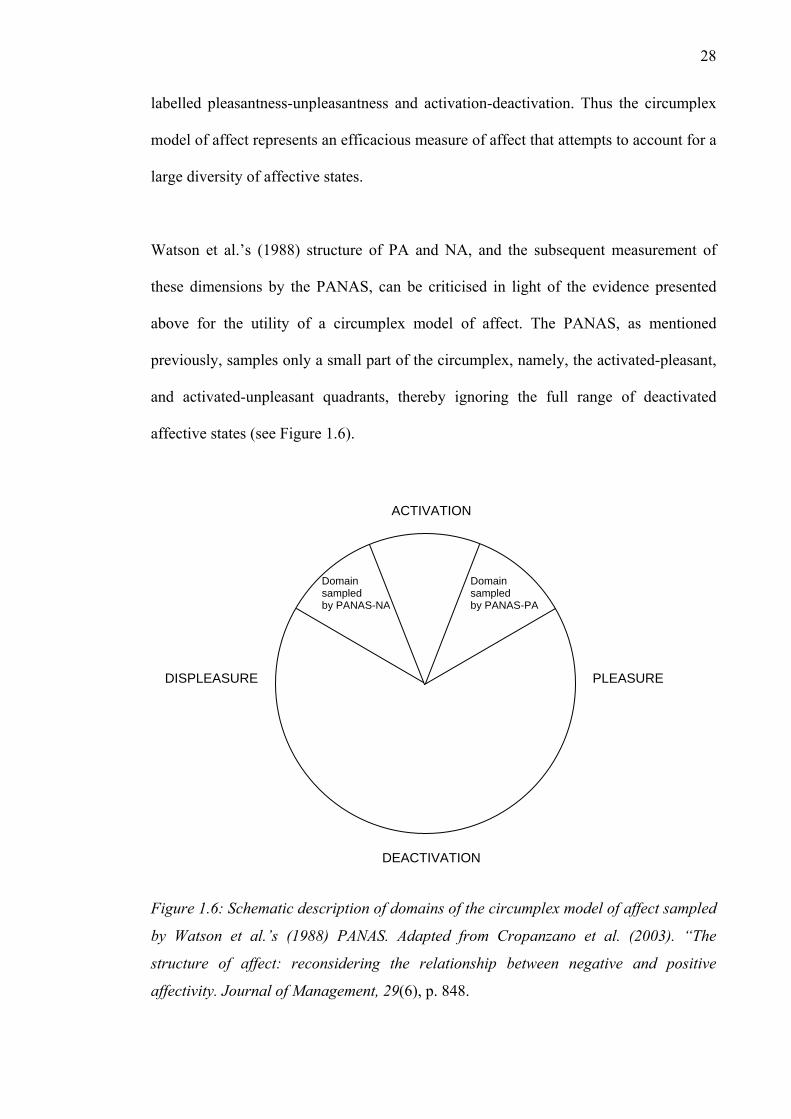
Watson et al.’s (1988) structure of PA and NA, and the subsequent measurement of
these dimensions by the PANAS, can be criticised in light of the evidence presented
above for the utility of a circumplex model of affect. The PANAS, as mentioned
previously, samples only a small part of the circumplex, namely, the activated-pleasant,
and activated-unpleasant quadrants, thereby ignoring the full range of deactivated
affective states (see Figure 1.6).
Figure 1.6: Schematic description of domains of the circumplex model of affect sampled
by Watson et al.’s (1988) PANAS. Adapted from Cropanzano et al. (2003). “The
structure of affect: reconsidering the relationship between negative and positive
affectivity. Journal of Management, 29(6), p. 848.
ACTIVATION
DEACTIVATION
PLEASURE DISPLEASURE
Domain sampled by PANAS-NA
Domain sampled by PANAS-PA
29
Further, a number of empirical studies (e.g., Eid & Diener, 2004; Gutierrez, Jiminez,
Hernandez, & Puente, 2005; Headey & Wearing, 1989; Lucas, Diener & Suh, 1996;
Napa Scollon, Diener, Oishi, & Biswas-Diener, 2004; Schimmack, 2003) in the
subjective wellbeing literature fail to adequately assess affect, using descriptors of affect
that often sample only a small portion of the circumplex. Thus, questions of validity are
necessarily raised. Conclusions based on inadequate measurement of affect must be
analysed and interpreted cautiously. Research into subjective wellbeing, which
comprises a strong affective component, should sample the full range of affective states.
The circumplex model of affect provides the tool by which this can be achieved.
2.3 Global and Domain-based Satisfaction
The second component of subjective wellbeing has been hypothesised to be cognitive,
in which individuals make subjective judgements of satisfaction with their lives
(Diener, 1996). According to Diener (1984), a satisfaction judgement involving a global
assessment of all aspects of a person’s life (sometimes called the life-as-a-whole
approach) is a necessary characteristic of subjective wellbeing.
Typically, all measures of SWB include some variant on the life as a whole question.
Some researchers have also employed a domain-based approach in conjunction with the
life as a whole approach. In this research, individuals not only rate satisfaction with
their life as a whole, but also satisfaction with various domains, such as family,
relationships, community, and so forth. The two different approaches to measuring life
satisfaction have given rise to a debate which revolves mainly around questioning the
validity of asking individuals to rate their satisfaction with life as a whole. Some
30
researchers argue that such an approach necessarily invokes a set of cognitive heuristics,
as the cognitive effort required to make a judgement of satisfaction across an
individual’s life span is too great (Schwarz & Strack, 1999; Kahneman, 1999). Others
however, argue that heuristics have little influence on judgements of life satisfaction
(Eid & Diener, 2004). These arguments will be considered in more detail in the
following section.
2.3.1 Global Satisfaction Judgements
Schwarz and Strack (1999) and Kahneman (1999) both argue that when individuals are
asked to rate their satisfaction with life as a whole, a judgment process is invoked that is
highly context dependent. They argue that individuals cannot be expected to review all
relevant aspects of life that influence their satisfaction. Instead it is proposed by
Schwarz and Strack that individuals use information that is either temporarily or
chronically accessible at the time. An example of temporarily accessible information
would be information that has been used in answering a previous question on a
questionnaire. Chronically accessible information is information that is used relatively
frequently, and that reflects important aspects of an individual’s life. Schwarz and
Strack also argue that the life-as-a-whole approach is particularly burdensome as
individuals are required to perform a large number of comparisons across many
dimensions with poorly defined criteria, which then must be integrated into one
composite judgment. In contrast, the domain-based approach involves well-defined
criteria, and comparisons are relatively easier to make (Schwarz & Strack, 1999;
Schwarz, Strack, Kommer & Wagner, 1987). As such, Schwarz and Strack argue that
the domain-based approach yields relatively accurate life satisfaction judgements,
31
whereas life-as-a-whole judgements are more likely to be inaccurate and influenced by a
variety of heuristic strategies, including one’s current mood.
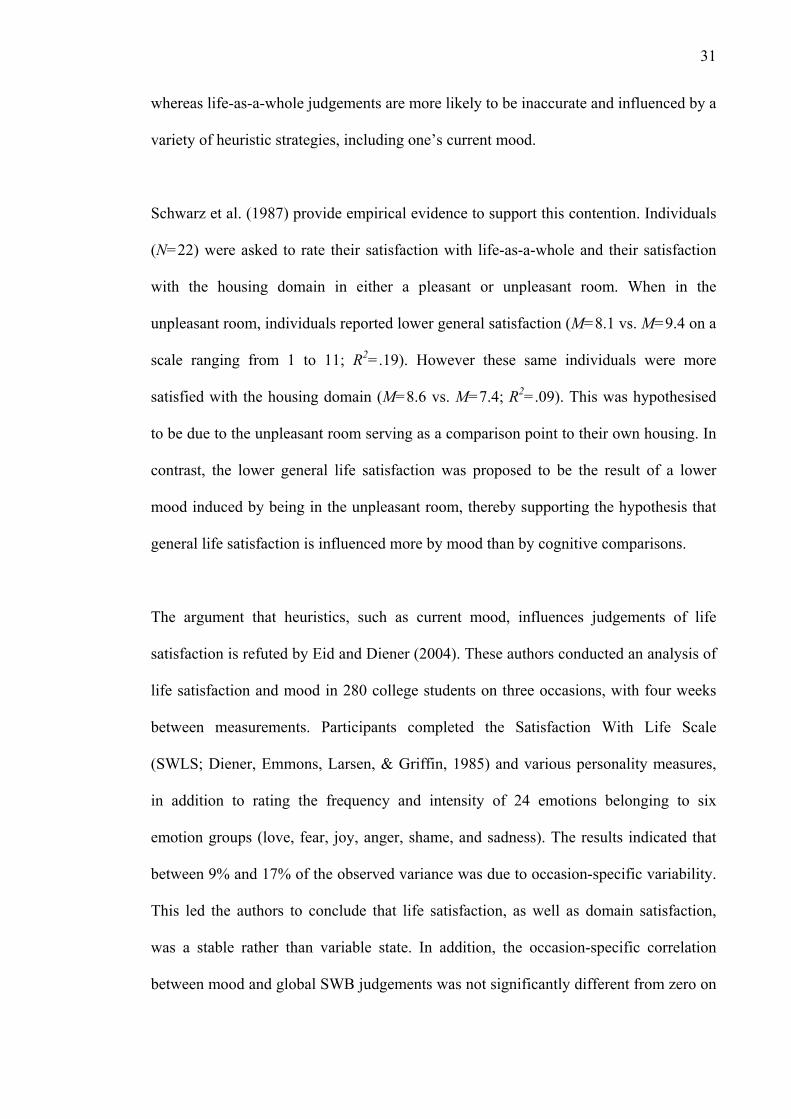
Schwarz et al. (1987) provide empirical evidence to support this contention. Individuals
(N=22) were asked to rate their satisfaction with life-as-a-whole and their satisfaction
with the housing domain in either a pleasant or unpleasant room. When in the
unpleasant room, individuals reported lower general satisfaction (M=8.1 vs. M=9.4 on a
scale ranging from 1 to 11; R2=.19). However these same individuals were more
satisfied with the housing domain (M=8.6 vs. M=7.4; R2=.09). This was hypothesised
to be due to the unpleasant room serving as a comparison point to their own housing. In
contrast, the lower general life satisfaction was proposed to be the result of a lower
mood induced by being in the unpleasant room, thereby supporting the hypothesis that
general life satisfaction is influenced more by mood than by cognitive comparisons.
The argument that heuristics, such as current mood, influences judgements of life
satisfaction is refuted by Eid and Diener (2004). These authors conducted an analysis of
life satisfaction and mood in 280 college students on three occasions, with four weeks
between measurements. Participants completed the Satisfaction With Life Scale
(SWLS; Diener, Emmons, Larsen, & Griffin, 1985) and various personality measures,
in addition to rating the frequency and intensity of 24 emotions belonging to six
emotion groups (love, fear, joy, anger, shame, and sadness). The results indicated that
between 9% and 17% of the observed variance was due to occasion-specific variability.
This led the authors to conclude that life satisfaction, as well as domain satisfaction,
was a stable rather than variable state. In addition, the occasion-specific correlation
between mood and global SWB judgements was not significantly different from zero on
32
two occasions, but was substantive on the third occasion of measurement. The authors
proposed that this might have been due to the time the third measurement took place.
This measurement was close to the end of the semester, typically when exams would
have been taking place. Eid and Diener suggested that the heightened stress of exams
likely influenced current mood to the point that this influenced judgements of life
satisfaction.
However, the validity of Eid and Diener’s (2004) conclusions need to be tempered by
the seemingly inadequate conceptualisation of current mood used by the authors.
Current mood was assessed by four items, happy, unhappy, pleased, and depressed. It is
not clear why only four items were chosen to tap into current mood, as other
conceptualisations, such as the circumplex model of affect, have been demonstrated to
be both a reliable and valid measure of affect (Yik et al., 1999). When a consideration is
made of the circumplex model, the adjectives (happy, unhappy, pleased, and depressed)
chosen by Eid and Diener (2004) to measure current mood are inadequate as these
adjectives fall at 0º along the horizontal axis of the pleasure-displeasure dimension. By
sampling only this dimension, Eid and Diener (2004) ignore the entire
activation-deactivation dimension of affect. Thus, the activated states of happiness, such
as excited or upset, and the deactivated states of unhappiness, such as contented or tired,
are not measured. This criticism applies equally for the items pleased and depressed.
Using an appropriate measure of affect, such as the circumplex, would have provided
results that were both reliable and valid.
Eid and Diener (2004) also found, in contrast to Schwarz and Strack’s (1999)
hypotheses (i.e., that domain satisfaction would be less affected by current mood), that
33
mood effects could explain between 7 and 31% of occasion-specific variance in domain
satisfaction. This finding provides indirect support for the hypothesis that individuals,
when asked to rate their satisfaction, use current mood as a gauge. Surprisingly, this
finding is in the opposite direction to that which would be expected by Schwarz and
Strack (1999). That is, the task of rating domain satisfaction specifies concrete criteria
(individuals are restricted to reporting on a specific domain of life), rendering the use of
heuristics less likely. In comparison, the task of rating global satisfaction is
considerably more abstract with ill-defined criteria, and as such, heuristics are more
likely to be invoked.
Two contrasting findings have emerged from the research of Schwarz and Strack (1999)
and Eid and Diener (2004). According to Schwarz and Strack, global judgements of
SWB are inherently difficult to make, therefore individuals rely on a number of
heuristics (such as current mood) to inform their judgment. Schwarz et al. (1987)
demonstrated this effect in which a manipulation of current mood altered self-reported
life satisfaction. In contrast, Eid and Diener found that current mood had little effect on
judgements of global satisfaction on two out of three occasions, but some effect on
judgements of domain satisfaction. However these results do not refute the heuristic
hypothesis of Schwarz and Strack. Eid and Diener’s argument that mood and heuristics
are relatively unimportant in explaining SWB is undermined by an invocation of current
mood as an explanation of the significant correlation between global SWB and mood on
the third measurement occasion. Their argument is also contradicted by the finding that
current mood significantly influenced up to 31% of variance in domain satisfaction. In
addition, Eid and Diener’s conclusions were based on an inadequate measure of mood.
34
Accordingly, the current mood heuristic remains a viable hypothesis that attempts to
explain how individuals come to make a decision regarding their satisfaction with life.
An individual’s positivity has also been proposed as a potential source of knowledge
used to inform life satisfaction judgments (Diener, Napa Scollon, Oishi, Dzokoto, &
Suh, 2000). Diener et al. agree with Schwarz and Strack (1999) that asking an
individual to calculate their overall happiness invites a host of heuristic strategies, as
people cannot sum positive and negative experiences over the course of a lifetime to
arrive at an overall score. However, Diener et al. suggest that rather than being an
artefact and shortcoming of global assessment measures, the strategies used by
individuals to derive an overall satisfaction score can provide useful information about
the nature of SWB. These researchers hypothesised that precisely because an overall
assessment of satisfaction is a vague, ill defined, and inherently difficult task,
individuals are more likely to project their norms, views of life, and self-beliefs onto
such assessment items. Thus, dispositional tendencies are likely to influence global
SWB over and above domain-based satisfaction scores, as assessments of domain
satisfaction draw attention to concrete areas of life leaving less room for the influence of
top-down processes.
Diener et al. (2000) then set out to empirically test this hypothesis. Specifically, these
researchers hypothesised that those with a positive disposition would likely evaluate
global life domains higher than specific life domains. Utilising data from 7,167 college
students from 41 societies, partial support for this hypothesis was found. An
individual’s propensity to judge global categories more positively than specific
categories was significantly predictive of life satisfaction after controlling for income
35
(β=.31, Total R2=.11). Diener and colleagues then tested whether this positivity would
predict life satisfaction over and above the prediction of life satisfaction from scores on
five domains; health, finances, friends, family, and religion. The standardised regression
coefficient for all the domains taken together predicting life satisfaction was .42,
p<.001. In comparison, the standardised regression coefficient for positivity predicting
life satisfaction was .23, p<.02. The overall R2 was .27. This result indicated that an
individual’s general positivity predicted life satisfaction after controlling for
domain-based satisfaction scores. This supports Diener et al.’s hypothesis that
judgments of global SWB are influenced by top-down or dispositional factors. This
finding has important implications for understanding the possible influences on
judgements of life satisfaction. For instance, it suggests that other dispositions, such as
an individual’s personality, may exert an influence on assessments of SWB. A
discussion of this possibility will be taken up in the following section.
In spite of the finding that global SWB is influenced by dispositional factors, Diener et
al. (2000) concluded against abandoning global SWB assessment. These authors
consider that global SWB judgments are an important component in the understanding
of SWB.
It is clear from the research reviewed above that global judgements of satisfaction are a
necessary component in the assessment of subjective wellbeing. However, caution
should be taken when interpreting such judgements. As Schwarz and Strack (1999) and
Diener et al. (2000) have shown, global judgements are likely to be arrived at via a host
of heuristic strategies, rather than via an objective summation of life experiences. Thus,
assessment of SWB should not rely exclusively on judgements of global satisfaction.
36
Ideally, subjective wellbeing should be assessed via the domain-based approach in
conjunction with the global approach.
2.3.2 Domain Satisfaction Judgements
The domain-based approach to life satisfaction is often measured by asking individuals
to rate their satisfaction with important areas in their life. Within this approach there
exists no general agreement to the number and scope of such areas. Cummins (1997)
has attempted to define the most likely constituent domains based upon an analysis of
27 definitions used in the literature to identify the quality of life domains. Cummins
notes that of these definitions, 85% include emotional wellbeing (happiness,
satisfaction, self-esteem, etc.), 70% include health, 70% social and family connections
(intimacy), 59% material wealth, and 56% work or some other productive activity.
Cummins notes that these five domains have been previously rated in large population
surveys as the most important domains.
Following from this discussion of domains, Cummins (1997) presents evidence for the
addition of two more domains, that of safety and community. The domain of safety
encompasses notions of security, personal control, privacy, independence, autonomy,
and competence. Of those 27 definitions noted previously, 22% included a domain
related to safety. Based on empirical evidence conducted by Cummins, the domain of
safety correlated at .27 with satisfaction, and was rated as .45 in importance. The
domain of community encompasses constructs such as (objective) social class,
education, job status, community integration, and community involvement. This domain
differs from the intimacy domain as an individual’s place in community reflects a
37
hierarchical position within community life that implies no intimacy. Of the 27
definitions mentioned earlier, 30% included a domain related to community. Cummins
notes the correlation of the community domain with satisfaction was .34, and the
importance of this domain was rated as .28.
In a follow up to Cummins (1997), the same author (Cummins, 1996) undertook further
empirical testing to validate his claims for the existence of seven quality of life domains
(Cummins, 1997 was originally submitted for publication in 1996; R. A. Cummins,
personal communication, June 15, 2006). A search of the literature yielded 152 articles
that provided data on life satisfaction. Cummins enforced strict criteria for articles to be
included in the study. Articles had to have used a scale containing a minimum of three
life domains, representing a broad indication of life quality. These scales must have also
reported Likert scale points, direction of scoring, and a numerical average for each
domain. Lastly, the scale must have had life satisfaction as its response mode. All
articles that had happiness as the criteria were excluded. Thirty-two studies satisfied the
above criteria. Within these studies, 173 different terms were used to describe domains
of life satisfaction. Each term was classified according to whether it could be placed in
one of the seven quality of life domains. Of these 173 different terms, 68% were
classified as belonging to one of the seven proposed domains.
Domain satisfaction has been demonstrated empirically to be one of the most powerful
statistical predictors of global wellbeing (Andrews & Robinson, 1991). For example,
Andrews and Withey (1976) found, after allowing for correlated and random
measurement error, that almost all of the explainable variance in their global measure of
life satisfaction could be accounted for by specific sets of life concerns. These were
38
concerns that were close to the self and home (including family, financial resources, and
housing). Concerns that were considered more remote contributed less to global
subjective wellbeing. These remote concerns included assessments of local and national
government.
Domain satisfaction judgements therefore represent an integral part of the assessment of
subjective wellbeing. However, there exists a debate within the literature as to the
direction of influence regarding domain and global subjective wellbeing. For example,
it is not known whether domain satisfaction results from, or rather causes, global life
satisfaction. In addition, Andrews and Robinson (1991) and Schmotkin (1998) note that
as yet, no one has provided a compelling analysis of this debate for any strong
conclusions to be drawn.
2.4 Summary of Subjective Wellbeing Characteristics
This review began with the aim of furthering an understanding of subjective wellbeing.
For this to be achieved, an identification of the characteristics of SWB was undertaken.
Based on this, a number of conclusions can be drawn before moving on to discuss the
variables thought to influence SWB judgements. Firstly, an investigation of the relation
between objective and subjective wellbeing revealed a weak relationship, such that
objective indicators are often at odds with subjective indicators. This was highlighted by
the rise in economic growth with no equivalent rise in levels of satisfaction with life.
Secondly, the affective component of wellbeing was explored. This exploration
involved an empirical analysis of structures of affect, which led to the demonstration
that four alternative constructs of affect were essentially describing the same
39
dimensions. As such, these constructs could all be placed inside a two-dimensional
circumplex model, with a horizontal axis of pleasantness-unpleasantness and a vertical
axis of activation-deactivation. It was concluded that the circumplex model of affect
represented an excellent model for SWB research as it incorporated both activated and
deactivated affective states. Thirdly, this review indicated that judgements of SWB are
made both globally and across domains. However, judgements made using these
assessments are influenced by different processes. Specifically, a global assessment of
SWB is likely to invoke heuristics, as it is a cognitively complex task to arrive at a
judgement of overall life satisfaction. In addition, global judgments of life satisfaction
are more likely to reflect individual differences in personality. By contrast, domain
judgements of life satisfaction involve concrete criteria, and as such, judgments are less
likely to be formed using heuristics. Both forms of SWB measurement have
demonstrated utility; accordingly, assessments of SWB must take into account both the
global approach, and the domain-based approach. Finally, empirical evidence was
summarised for the existence of seven SWB domains.
As the background and characteristics of wellbeing have been highlighted, the
discussion now turns towards the identification of variables that are thought to exert a
strong influence on SWB judgements. Following this, an analysis of theories that
attempt to bring together such variables into comprehensive accounts of how an
individual arrives at a judgement of life satisfaction will be presented.
40
3. Dispositional Influences on Subjective Wellbeing
The major focus of early research in the quality of life field was to identify the
bottom-up or situational influences on SWB. However these researchers were typically
disappointed with the relatively small effect sizes found (Diener, 1999). For instance, in
a survey of over 2,100 North Americans conducted by Campbell et al. (1976),
demographic factors (i.e., age, sex, income, race, education, and marital status)
accounted for less than 20% of the variance in SWB. In a similar North American
survey of over 1,200 participants conducted in the 1970s, Andrews and Withey (1976),
using the same variables, could only account for 8% of the variance in SWB. Similarly,
Andrews and Robinson (1991) note that demographic variables, even when taken
together, rarely explain more than 10% of the variance in happiness or satisfaction
scores. In a recent review of the correlates of happiness, Argyle (1999) concluded that
although demographic variables may only account for 15% of variance, these effects
remain after controlling for the influence of other demographic variables (i.e., the effect
of ethnicity remains after controlling for income, education, and occupation). In
addition, the effects are stronger for different groups, such as income on the poor, and
religion on the old. Thus although demographic variables are not irrelevant, the small
effects found have led researchers to focus on top-down or dispositional factors in the
search to explain the remaining variability in SWB.
3.1 Extroversion, Neuroticism, and Subjective Wellbeing
A number of studies have been conducted over the past 40 years that have examined the
effects of a variety of variables on SWB. One of the most consistently studied set of
41
variables in SWB research is that of personality. In particular, the most commonly
studied dimensions of personality are extroversion and neuroticism, which are generally
agreed to comprise at least two of the major dimensions of personality (Eysenck, 1997).
In addition, extroversion has been found to relate to positive affectivity (Costa &
McCrae, 1980, 1989; Emmons & Diener, 1985; Fleeson, Malanos, & Achille, 2002;
Gross, Sutton & Ketelaar, 1998; Hayes & Joseph, 2003; Lucas, Diener, Grob, Suh, &
Shao, 2000), whilst neuroticism has been found to relate to negative affectivity (Costa
& McCrae, 1980, 1989; Emmons & Diener, 1985; Fleeson et al., 2002; Gross et al.,
1998; Hayes & Joseph, 2003). It is worthwhile to reiterate that negative affect and
positive affect are thought to comprise the affective dimension of SWB. Extroversion
and neuroticism are also thought to be positive and negative contributors to life
satisfaction respectively (Emmons & Diener, 1985; McCrae & Costa, 1991; Myers &
Diener, 1995). Cummins, Gullone, and Lau (2002) note that much of the literature
examining the link between SWB and these two dimensions of personality have found
robust correlations. The following sections will examine, in detail, the evidence
presented in support of the proposition that extroversion and neuroticism influence
SWB.
3.1.1 Extroversion and Subjective Wellbeing
In an attempt to understand the fundamental features of extroversion, Lucas et al. (2000)
characterised this construct as reflecting systematic differences in an individual’s
behaviour toward, and feelings about others. Further, Lucas et al. presented evidence
that extroversion consists of three components. Firstly, affiliation, a tendency to enjoy
and value close interpersonal bonds in addition to being warm and affectionate;
42
secondly, ascendance, which relates to social dominance, assertiveness and leadership,
and finally; venturesome, a feeling of excitement seeking and desire for change. In
addition, extroversion was found by the authors to exhibit a strong positive relation to
positive affect. The average correlation between extroversion and positive affect over
five samples (combined N=6,632) was .74.
Subsequent to the finding that extroverts report greater positive affect (Costa &
McCrae, 1980, 1989; Emmons & Diener, 1985; Fleeson et al., 2002; Gross et al., 1998;
Hayes & Joseph, 2003; Lucas et al., 2000), research in the quality of life field has
attempted to examine whether extroversion can predict variance in individual reports of
SWB. Emmons and Diener (1985) were one of the first researchers to conduct such an
examination. The impetus of their study was centered on the premise that previous
analyses finding positive relationships between extroversion and PA had implemented
poor measures of affect, namely Bradburn’s (1969) affect scale (which was noted by the
authors to suffer from low reliability). In the study conducted by Emmons and Diener,
affect was measured at the end of each day in two samples (sample 1, N=74; sample 2,
N=62) for 84 and 56 consecutive days respectively (the samples corresponded to
undergraduate students enrolled in different university semesters). Mood was assessed
via four adjectives representing PA (happy, joyful, pleased and enjoyment/fun) and five
adjectives representing NA (unhappy, depressed, frustrated, worried/anxious, and
angry/hostile; the authors treated enjoyment/fun, worried/anxious, and angry/hostile as
three adjectives rather than six). These items were chosen based on earlier factor
analytic work by the authors. A battery of personality measures were utilised that
included the Eysenck Personality Inventory (EPI), Rotter’s (1966) Locus of Control
scale, and the 16 Personality Factors (16PF). Life satisfaction was measured via the
43
SWLS (Diener et al., 1985) which consists of five items designed to measure global life
satisfaction, a cognitive judgment of satisfaction with one’s life as a whole.
Emmons and Diener (1985) found that when the EPI was used as the measure of
extroversion, the correlation between extroversion and PA was .31 and .32 in both
samples respectively. The correlation between extroversion and the SWLS was .29 and
.30. The authors then broke down the dimension of extroversion into its constituents,
and when done so, only the sociability component significantly correlated with PA (.29
and .49) and SWLS (.34 and .40) across the two samples. Furthermore, a similar pattern
of results was found using a different measure of sociability (EASI-III survey of
temperaments). Extroversion (as measured by EASI-III) correlated moderately with PA
(.44 and .49) and SWLS (.55 and .30) across both samples. A composite of the EASI-III
sociability scale and the EPI sociability items were then taken to form one variable in a
multiple regression predicting life satisfaction. This computation yielded an R2 of .34,
p<.001. Thus, 34% of variance in life satisfaction scores in these samples could be
predicted by the sociability component of extroversion.
Emmons and Diener’s (1985) research provides some evidence that extroversion is
related to reports of increased SWB. Recent research has replicated the moderate
correlation between extroversion and life satisfaction, with Hayes and Joseph (2003)
reporting a correlation of .42 between extroversion and SWLS in a sample of 111
individuals in the United Kingdom. However in a multiple regression predicting SWLS
with extroversion, neuroticism, and conscientiousness, the beta weight for extroversion
was only .09 (sr2e=.002; where relevant effect sizes are not provided, these are
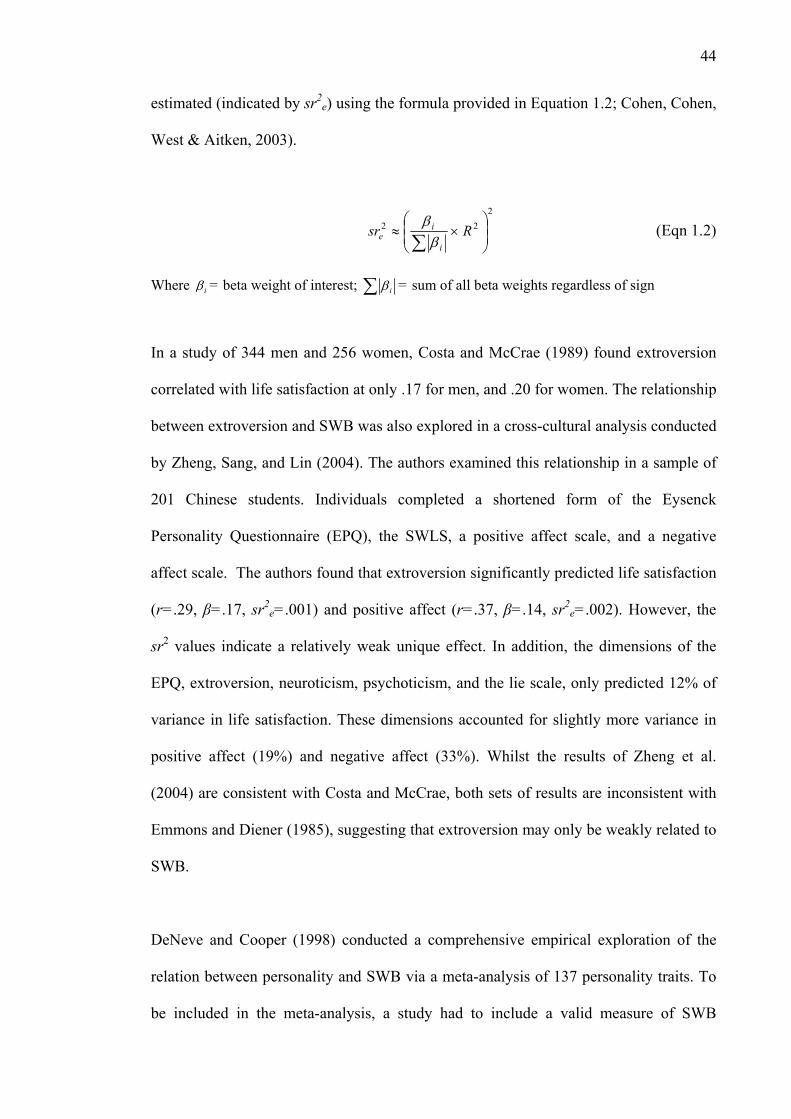
44
estimated (indicated by sr2e) using the formula provided in Equation 1.2; Cohen, Cohen,
West & Aitken, 2003).
2
22⎟⎟⎠
⎞⎜⎜⎝
⎛×≈
∑Rsr
i
ie β
β (Eqn 1.2)
Where iβ = beta weight of interest; ∑ iβ = sum of all beta weights regardless of sign
In a study of 344 men and 256 women, Costa and McCrae (1989) found extroversion
correlated with life satisfaction at only .17 for men, and .20 for women. The relationship
between extroversion and SWB was also explored in a cross-cultural analysis conducted
by Zheng, Sang, and Lin (2004). The authors examined this relationship in a sample of
201 Chinese students. Individuals completed a shortened form of the Eysenck
Personality Questionnaire (EPQ), the SWLS, a positive affect scale, and a negative
affect scale. The authors found that extroversion significantly predicted life satisfaction
(r=.29, β=.17, sr2e=.001) and positive affect (r=.37, β=.14, sr2
e=.002). However, the
sr2 values indicate a relatively weak unique effect. In addition, the dimensions of the
EPQ, extroversion, neuroticism, psychoticism, and the lie scale, only predicted 12% of
variance in life satisfaction. These dimensions accounted for slightly more variance in
positive affect (19%) and negative affect (33%). Whilst the results of Zheng et al.
(2004) are consistent with Costa and McCrae, both sets of results are inconsistent with
Emmons and Diener (1985), suggesting that extroversion may only be weakly related to
SWB.
DeNeve and Cooper (1998) conducted a comprehensive empirical exploration of the
relation between personality and SWB via a meta-analysis of 137 personality traits. To
be included in the meta-analysis, a study had to include a valid measure of SWB
45
(operationalised as life satisfaction, happiness, or current PA or NA) and at least one
personality variable as one of the measures. Application of this criteria resulted in the
inclusion of 148 studies, yielding 42,171 respondents. The authors found an overall
average weighted correlation of personality with SWB of .19. When overall SWB was
correlated with each of the Big Five personality factors (extroversion, agreeableness,
conscientiousness, neuroticism, and openness to experience), neuroticism and
conscientiousness exhibited the strongest correlations, r=-.22 and r=.21 respectively,
whilst extroversion correlated at .17 with SWB. The relationship between extroversion
and SWB was further analysed by breaking down SWB into its hypothesised
components: life satisfaction, PA, and NA. The correlation for extroversion with life
satisfaction was .17, with PA was .20, and with NA was -.07. These correlations are in
agreement with the correlations reported by Costa and McCrae (1989) and provide
additional support for the proposition that extroversion is only weakly related to SWB.
In addition, the correlations found by DeNeve and Cooper had a range of .17 to .20,
much lower than those reported by Emmons and Diener (1985; extroversion and life
satisfaction, mean r=.36, sociability and PA, mean r=.39).
The above studies demonstrate that although extroversion does explain some variance in
SWB, there remains considerable variance unaccounted for. Furthermore, four of the
five studies reviewed found that extroversion was only weakly related to SWB (Costa &
McCrae, 1989; DeNeve & Cooper, 1998; Hayes & Joseph, 2003; Zheng et al., 2004).
46
3.1.2 Neuroticism and Subjective Wellbeing
Neuroticism, comprising the second fundamental dimension of personality, has been
found to relate to the experience of negative affect (Costa & McCrae, 1989; Emmons &
Diener, 1985; Fleeson et al., 2002; Gross et al., 1998; Hayes & Joseph, 2003).
Individuals who score high on the dimension of neuroticism are reported to be
characteristically worrisome, nervous, emotional, insecure, inadequate, and
hypochondriacal (Pervin & John, 2001). Thus, as negative affectivity is said to comprise
part of the affective dimension of SWB (Diener, 2000), it is likely that neurotics would
experience decreased levels of SWB.
Emmons and Diener (1985), in addition to examining the influence of extroversion on
SWB, also examined the influence of neuroticism on SWB. Using the same
methodology as reported previously, neuroticism was found to correlate significantly
with PA (-.31) and SWLS (-.31) in sample 1 only, whilst strongly correlating with NA
in both sample 1 and sample 2 (.61 and .33 respectively). When the EASI-III was used
as the measure of neuroticism, the correlation between neuroticism and NA for sample 1
decreased to .40, whilst for sample 2, increased to .42. These results indicate that, for
the individuals in Emmons and Diener’s study, those high on neuroticism experienced
less positive affect and more negative affect than those low on neuroticism. This adds
further weight to the argument that neuroticism is strongly related to negative
affectivity. The relation to global life satisfaction however, was inconsistent across
studies. The results in study 1 indicated that the EASI-III and EPI measures of
neuroticism correlated -.23 and -.31 respectively with life satisfaction. However, in
study 2, these correlations fell dramatically and were non-significant (-.03 and -.08
47
respectively). Thus, the influence of neuroticism on life satisfaction cannot be
concluded from this study due to the inconsistent results across samples.
Zheng et al. (2004), in addition to investigating the influence of extroversion on SWB,
also investigated the relation between neuroticism and SWB. Using the same
methodology as reported earlier, Zheng et al. found neuroticism to be a strong predictor
of negative affect (r=.57, β=.60) and a moderate predictor of positive affect (r=-.37,
β=-.27). However neuroticism was only weakly related to life satisfaction
(r=-.28, β=-.18). In addition, as reported previously, extroversion and neuroticism only
accounted for 12% variance in life satisfaction. These results provide further evidence
that neuroticism is strongly linked to the experience of negative affect; however it
seems that neuroticism is only weakly related to life satisfaction.
Further investigation of the relationship between neuroticism, negative affect, and SWB
comes via DeNeve and Cooper’s (1998) meta-analysis. These authors found an overall
correlation of -.22 between neuroticism and overall SWB. When SWB was broken
down into life satisfaction, PA and NA, of the Big-Five personality dimensions
neuroticism was the strongest predictor of life satisfaction (r=-.24), and negative affect
(r=.23).
As was the case with extroversion and SWB, significant variation occurs between
studies in the strength of the relation found between neuroticism and SWB. As such, the
strength of relationship between neuroticism and SWB cannot be conclusively
determined.
48
One of the most important findings to arise from the above examination of research
investigating the influence of extroversion and neuroticism on SWB, comes from
DeNeve and Cooper’s (1998) meta-analysis. Specifically, of the 137 personality traits,
the strongest predictor of SWB was not extroversion or neuroticism, but repressive
defensiveness (r=-.40), described as a denial of an experience of threatening
information and of the negative emotions following this experience. The next strongest
predictors of SWB included locus of control-chance (r=-.34), desire for control
(r=.34), and private collective self-esteem (r=.31).
Thus it can be concluded from DeNeve and Cooper’s (1998) meta-analysis, and from
the variation in results across studies, that personality explains little variance in SWB,
and as such, focussing solely on extroversion and neuroticism is shortsighted and
ignores other potential influences on SWB. This view is supported by McCrae and
Costa (1991), the proponents of the Five-Factor model of personality, who found
extroversion, neuroticism, and openness to experience only explained between 10 to
18% of variance in SWB. Furthermore, these authors suggested that if extroversion and
neuroticism were measured by asking about the frequency and intensity of positive and
negative emotions, then the resulting scales would invariably load onto extroversion and
neuroticism factors. This raises the possibility that the effects of extroversion and
neuroticism on SWB are due to the underlying positive and negative affectivity in
extroversion and neuroticism respectively. Partialling out the variance due to affect in
extroversion and neuroticism, and measuring the subsequent relation to SWB, would
provide a more accurate estimate of the effect of extroversion and neuroticism on SWB.
49
The weak relation between extroversion, neuroticism, and SWB has led Diener, Oishi,
and Lucas (2003) to argue for an examination not only of other traits that may influence
SWB, but also of non-trait features of personality, such as one’s goals, that relate to
SWB constructs. As this review demonstrates the two personality dimensions of
extroversion and neuroticism are only weakly related to SWB, other factors must
directly influence judgements of SWB (it is possible that extroversion and neuroticism
influence SWB indirectly; a possibility that is taken up in later discussions). This view
is supported by Zheng et al. (2004) who note that personality often explains no more
than 30% of variance in SWB. The search for alternative factors to explain the
remaining variance in SWB has resulted in a variety of cognitive variables put forth. A
good starting point to discern which variables are important in predicting SWB is
DeNeve and Cooper’s (1998) meta-analysis. These authors found some of the strongest
predictors of SWB were not extroversion and neuroticism, but were locus of control and
self-esteem. In addition, Myers and Diener (1995) argued that the four inner traits of
self-esteem, sense of personal control, optimism, and extroversion are characteristic
traits of happy people. As such, the proceeding section will investigate the influence of
the variables self-esteem, optimism, and perceived control on SWB.
3.2 The relation of Self-esteem, Optimism, and Perceived Control to SWB
As DeNeve and Cooper (1998) have found, extroversion and neuroticism are not the
most powerful predictors of SWB. Their meta-analysis presented evidence that how
people thought about and explained what happened in their lives strongly predicted
SWB (DeNeve, 1999). That is, individuals who did not believe they controlled their
lives reported low life satisfaction, whereas individuals who desired control and
50
believed that they had control over themselves and the events that occurred in their
lives, exhibit increased life satisfaction. Similarly, appraising events in an optimistic
fashion and engaging in active coping strategies has been associated with heightened
SWB (DeNeve, 1999; Myers & Diener, 1995). Finally, a positive sense of self-esteem,
that is, evaluating yourself in a positive fashion, has also been found to positively
influence SWB (DeNeve & Cooper, 1998). These three variables of self-esteem,
optimism, and perceived control have been grouped together by Cummins and Nistico
(2002) as relating to satisfaction with the self. Satisfaction with the self may explain at
least some of the remaining unaccounted variance in SWB. Prior to an examination of
the evidence suggesting these variables influence SWB, it is important to demonstrate
that such variables can be discriminable from SWB.
To examine the discriminability of a construct, Campbell and Fiske (1959) state that
more than one variable and more than one method of measurement must be used. When
these conditions are met, Campbell and Fiske provide two criteria that can be used to
assess discriminability. For the first criterion, the convergent validity coefficient (the
correlation between the same variable measured using a different valid method) should
exceed the correlation between that variable and any other variables not sharing
common methods of measurement. The second criterion requires that the correlation
between a variable measured using different valid methods exceed the correlations
between different variables using the same method of measurement.
Lucas et al. (1996) applied these criteria to demonstrate that life satisfaction,
self-esteem, and optimism were separate constructs. The authors measured these
constructs in three separate samples (sample 1 N=212, sample 2 N=109, sample 3
51
N=172). In the first sample, self-report measures of life satisfaction, self-esteem, and
optimism were completed on two separate occasions, two weeks apart. Informant
reports from friends or family members were also obtained, however informant reports
are somewhat unreliable. (For instance, self-rated and peer-rated performance in an
organisational context was found to correlate at only .38 (van Hooft, van der Flier &
Minne, 2006). In addition, in a review of self-and informant reports in the general
population and college students, Cummins (2002) found, across seven separate studies,
correlations ranging from .25 to .65 (M=.48, SD=.13). This led the author to conclude
that informant reports cannot be regarded as valid estimates of a person’s SWB. As such
the results relating to informant reports were not considered.) For the second sample,
Lucas et al. extended the time between completion of self-reports to two years. In the
third sample, two different measures of each construct were completed on two separate
occasions, two days apart. After constructing and analysing multi-trait multi-method
matricies for each construct and sample, the authors found that across all three samples,
life satisfaction met the two criteria for evidence of discriminability 100% of the time.
For all three constructs there were only four failures out of 36 comparisons in which the
criteria for discriminability were not met. Further, all of these four failures were due to
low correlations between the alternative measure of optimism (the hopelessness scale)
in sample 3. Thus, in this study, life satisfaction was discriminable from self-esteem and
optimism. To date there are no published studies examining the discriminability of
perceived control and life satisfaction.
52
3.2.1 Self-esteem
Self-esteem has been characterised as a cognitive evaluation of our own worthiness
(Cummins et al., 2002). Self-esteem is one of the most widely studied variables in
psychology; in 2007 the PsychInfo database returned 27,544 results for self-esteem (in
comparison, subjective wellbeing returned 1,637 results). This popularity has
subsequently led to self-esteem being investigated as a possible correlate of SWB. In
one such study, Cummins and Nistico (2002) presented zero-order correlations for six
studies relating self-esteem to life satisfaction. The correlations ranged from .54 to .77.
Thus, compared to the weak to moderate correlations found between extroversion and
neuroticism and SWB, self-esteem seems to relate substantially with SWB. That is,
those with high levels of self-esteem reported higher levels of satisfaction with life.
These results led Cummins and Nistico to conclude that satisfaction with the self was
one of the strongest predictors of subjective quality of life found to date.
In a review article, Diener (1984) also noted that self-esteem was one of the strongest
predictors of SWB. Further empirical support for this statement was provided by
Emmons and Diener (1985), who found self-esteem to correlate .26 with overall life
satisfaction. Furthermore in a hierarchical regression controlling for extroversion,
self-esteem added significantly to the prediction of overall life satisfaction, accounting
for an additional 11% unique variance. Furthermore, in DeNeve and Cooper’s (1998)
meta-analysis of 137 personality traits, private collective self-esteem was found to be
one of the strongest correlates of SWB (r=.31).
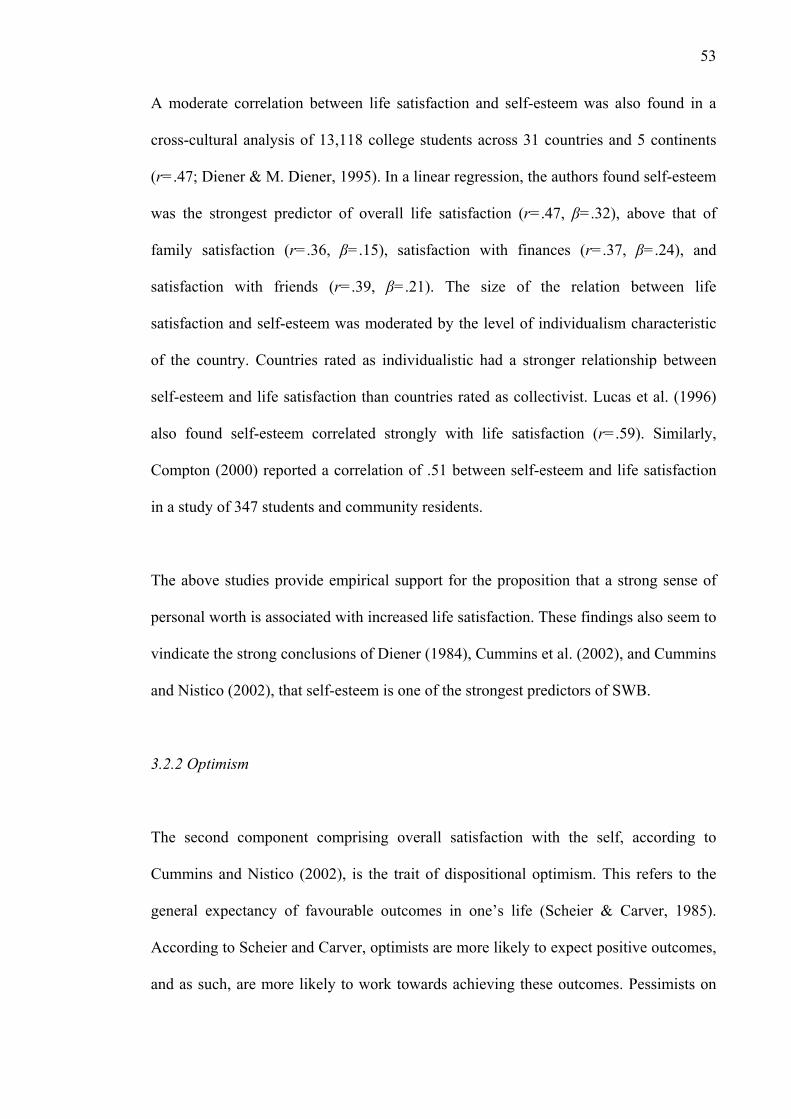
53
A moderate correlation between life satisfaction and self-esteem was also found in a
cross-cultural analysis of 13,118 college students across 31 countries and 5 continents
(r=.47; Diener & M. Diener, 1995). In a linear regression, the authors found self-esteem
was the strongest predictor of overall life satisfaction (r=.47, β=.32), above that of
family satisfaction (r=.36, β=.15), satisfaction with finances (r=.37, β=.24), and
satisfaction with friends (r=.39, β=.21). The size of the relation between life
satisfaction and self-esteem was moderated by the level of individualism characteristic
of the country. Countries rated as individualistic had a stronger relationship between
self-esteem and life satisfaction than countries rated as collectivist. Lucas et al. (1996)
also found self-esteem correlated strongly with life satisfaction (r=.59). Similarly,
Compton (2000) reported a correlation of .51 between self-esteem and life satisfaction
in a study of 347 students and community residents.
The above studies provide empirical support for the proposition that a strong sense of
personal worth is associated with increased life satisfaction. These findings also seem to
vindicate the strong conclusions of Diener (1984), Cummins et al. (2002), and Cummins
and Nistico (2002), that self-esteem is one of the strongest predictors of SWB.
3.2.2 Optimism
The second component comprising overall satisfaction with the self, according to
Cummins and Nistico (2002), is the trait of dispositional optimism. This refers to the
general expectancy of favourable outcomes in one’s life (Scheier & Carver, 1985).
According to Scheier and Carver, optimists are more likely to expect positive outcomes,
and as such, are more likely to work towards achieving these outcomes. Pessimists on
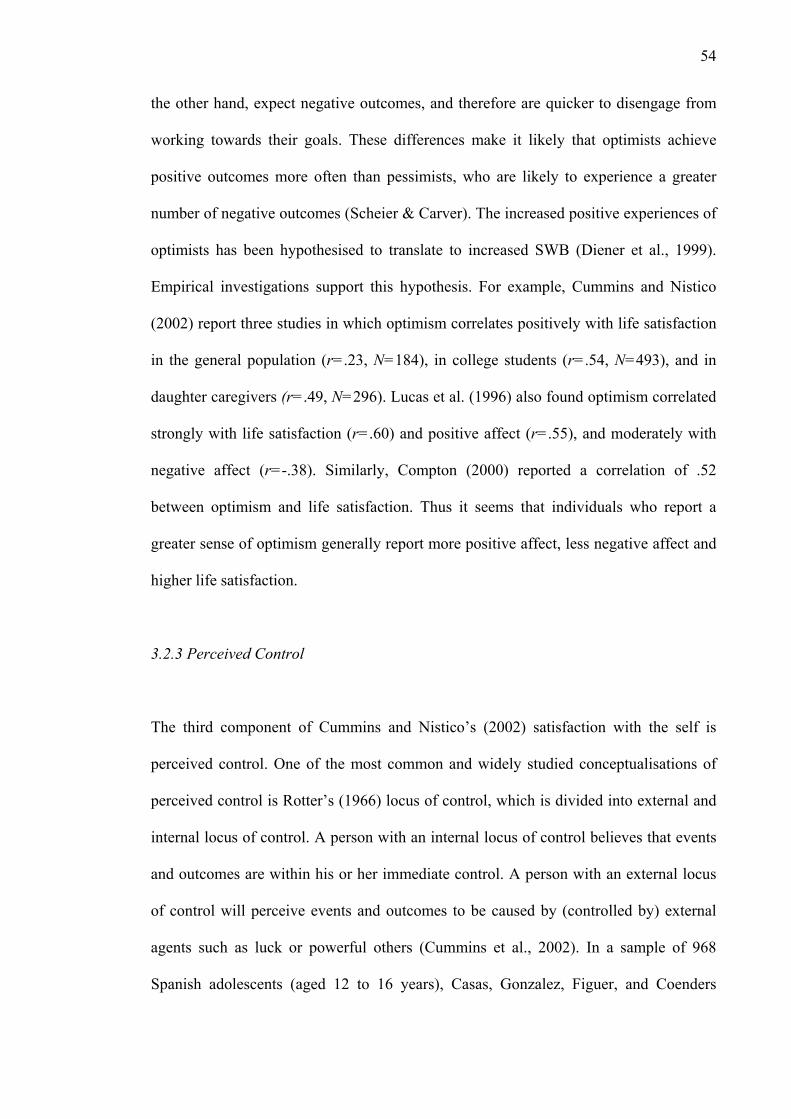
54
the other hand, expect negative outcomes, and therefore are quicker to disengage from
working towards their goals. These differences make it likely that optimists achieve
positive outcomes more often than pessimists, who are likely to experience a greater
number of negative outcomes (Scheier & Carver). The increased positive experiences of
optimists has been hypothesised to translate to increased SWB (Diener et al., 1999).
Empirical investigations support this hypothesis. For example, Cummins and Nistico
(2002) report three studies in which optimism correlates positively with life satisfaction
in the general population (r=.23, N=184), in college students (r=.54, N=493), and in
daughter caregivers (r=.49, N=296). Lucas et al. (1996) also found optimism correlated
strongly with life satisfaction (r=.60) and positive affect (r=.55), and moderately with
negative affect (r=-.38). Similarly, Compton (2000) reported a correlation of .52
between optimism and life satisfaction. Thus it seems that individuals who report a
greater sense of optimism generally report more positive affect, less negative affect and
higher life satisfaction.
3.2.3 Perceived Control
The third component of Cummins and Nistico’s (2002) satisfaction with the self is
perceived control. One of the most common and widely studied conceptualisations of
perceived control is Rotter’s (1966) locus of control, which is divided into external and
internal locus of control. A person with an internal locus of control believes that events
and outcomes are within his or her immediate control. A person with an external locus
of control will perceive events and outcomes to be caused by (controlled by) external
agents such as luck or powerful others (Cummins et al., 2002). In a sample of 968
Spanish adolescents (aged 12 to 16 years), Casas, Gonzalez, Figuer, and Coenders
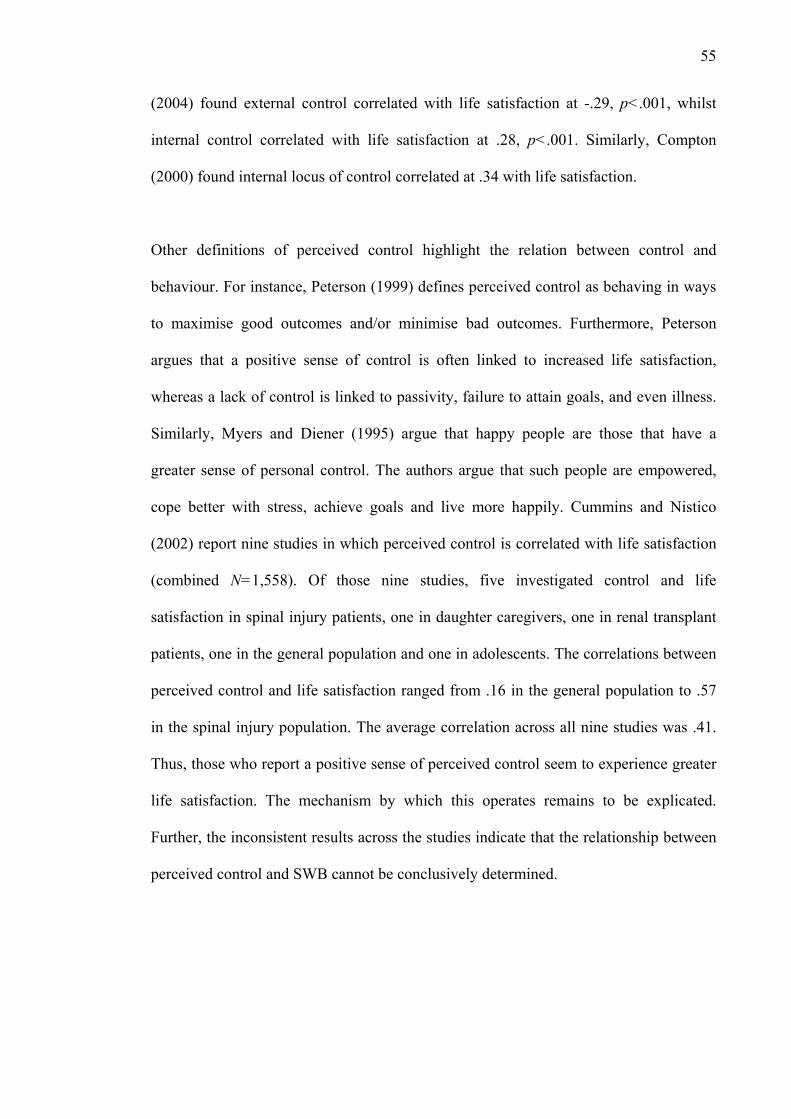
55
(2004) found external control correlated with life satisfaction at -.29, p<.001, whilst
internal control correlated with life satisfaction at .28, p<.001. Similarly, Compton
(2000) found internal locus of control correlated at .34 with life satisfaction.
Other definitions of perceived control highlight the relation between control and
behaviour. For instance, Peterson (1999) defines perceived control as behaving in ways
to maximise good outcomes and/or minimise bad outcomes. Furthermore, Peterson
argues that a positive sense of control is often linked to increased life satisfaction,
whereas a lack of control is linked to passivity, failure to attain goals, and even illness.
Similarly, Myers and Diener (1995) argue that happy people are those that have a
greater sense of personal control. The authors argue that such people are empowered,
cope better with stress, achieve goals and live more happily. Cummins and Nistico
(2002) report nine studies in which perceived control is correlated with life satisfaction
(combined N=1,558). Of those nine studies, five investigated control and life
satisfaction in spinal injury patients, one in daughter caregivers, one in renal transplant
patients, one in the general population and one in adolescents. The correlations between
perceived control and life satisfaction ranged from .16 in the general population to .57
in the spinal injury population. The average correlation across all nine studies was .41.
Thus, those who report a positive sense of perceived control seem to experience greater
life satisfaction. The mechanism by which this operates remains to be explicated.
Further, the inconsistent results across the studies indicate that the relationship between
perceived control and SWB cannot be conclusively determined.
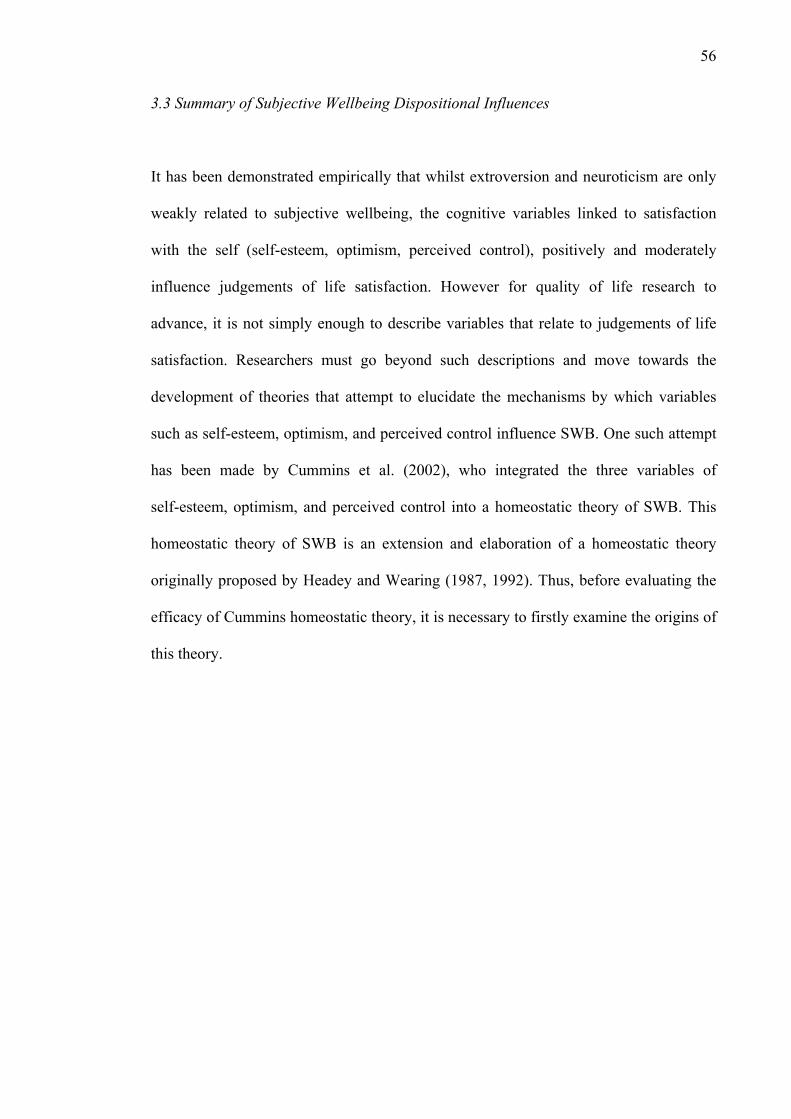
56
3.3 Summary of Subjective Wellbeing Dispositional Influences
It has been demonstrated empirically that whilst extroversion and neuroticism are only
weakly related to subjective wellbeing, the cognitive variables linked to satisfaction
with the self (self-esteem, optimism, perceived control), positively and moderately
influence judgements of life satisfaction. However for quality of life research to
advance, it is not simply enough to describe variables that relate to judgements of life
satisfaction. Researchers must go beyond such descriptions and move towards the
development of theories that attempt to elucidate the mechanisms by which variables
such as self-esteem, optimism, and perceived control influence SWB. One such attempt
has been made by Cummins et al. (2002), who integrated the three variables of
self-esteem, optimism, and perceived control into a homeostatic theory of SWB. This
homeostatic theory of SWB is an extension and elaboration of a homeostatic theory
originally proposed by Headey and Wearing (1987, 1992). Thus, before evaluating the
efficacy of Cummins homeostatic theory, it is necessary to firstly examine the origins of
this theory.
57
CHAPTER 2: THEORETICAL MODELS OF SUBJECTIVE WELLBEING
2.1 Headey and Wearing’s Dynamic Equilibrium Model of Subjective Wellbeing
Headey and Wearing (1989, 1992) were the first researchers to propose a homeostatic
theory of SWB. The authors arrived at their theory in order to explain why most quality
of life research had found consistently high levels of SWB among individuals from all
major social groups in Western industrialised countries (with the exception of black
South Africans, see Moller, 1998; Moller & Dickow, 2002). Headey and Wearing
argued that this finding was largely unexpected because at face value, it seemed
unlikely that such a large majority of individuals were so satisfied with their lives. Thus,
instead of attempting to explain the relatively small amount of variance in people’s
ratings, Headey and Wearing set out to develop a theory that would account for both the
high average levels of SWB, in addition to the variance in individual ratings. To do this
comprehensively, Headey and Wearing implemented a longitudinal panel study in
which an initial representative sample of 942 people were followed up on five occasions
(1981, 1983, 1985, 1987, and 1989).
In Headey and Wearing’s (1989, 1992) study, SWB was measured using Andrew and
Withey’s (1976) life-as a-whole index, the life-fulfillment index (Headey & Wearing,
1992), SWLS (Diener et al., 1985), Fordyce’s 0 to 10 happy scale, and Bradburn’s
(1969) positive affect scale. On the basis of factor analyses, Headey and Wearing
combined the life satisfaction measures into a composite index that gave equal weight to
the four scales (life-as-a-whole, life fulfillment, SWLS, and 0 to 10 happy scale). As the
last two scales were not available until the 1987 survey, the index was only used in the
58
cross-sectional analyses of the 1987 and 1989 data. A composite index giving equal
weight to life-fulfillment and life-as-a-whole was used for all waves of data. In addition
to measuring life satisfaction and positive affect, Headey and Wearing implemented
measures of psychological distress to investigate the relation between SWB and
illbeing. These measures included a shortened version of the General Health
Questionnaire (GHQ), which focuses on somatic symptoms and negative affects,
Spielberger’s state anxiety scales (STAI), Beck’s Depression Inventory (BDI) and
Bradburn’s negative affect scale, which covers both anxiety and depression. The BDI
and Spielberger’s scales were only available for the 1987 and 1989 data; as such,
Bradburn’s negative affect scale was used for analysis of change data between 1981 and
1989. In addition to measures of SWB and psychological distress, Headey and Wearing
used Eysenck’s personality inventory (EPI) as measure of extroversion and neuroticism.
From 1987 onwards, Headey and Wearing included a facet of Costa and McCrae’s
(1995) openness to experience personality trait, ‘openness to feelings’. In addition, a
measure of personal competence was included, combining internal locus of control and
the sense that a person feels capable of planning, organising, and controlling his or her
own life. A summary of the scales used at each measurement time point is provided in
Table 2.1.
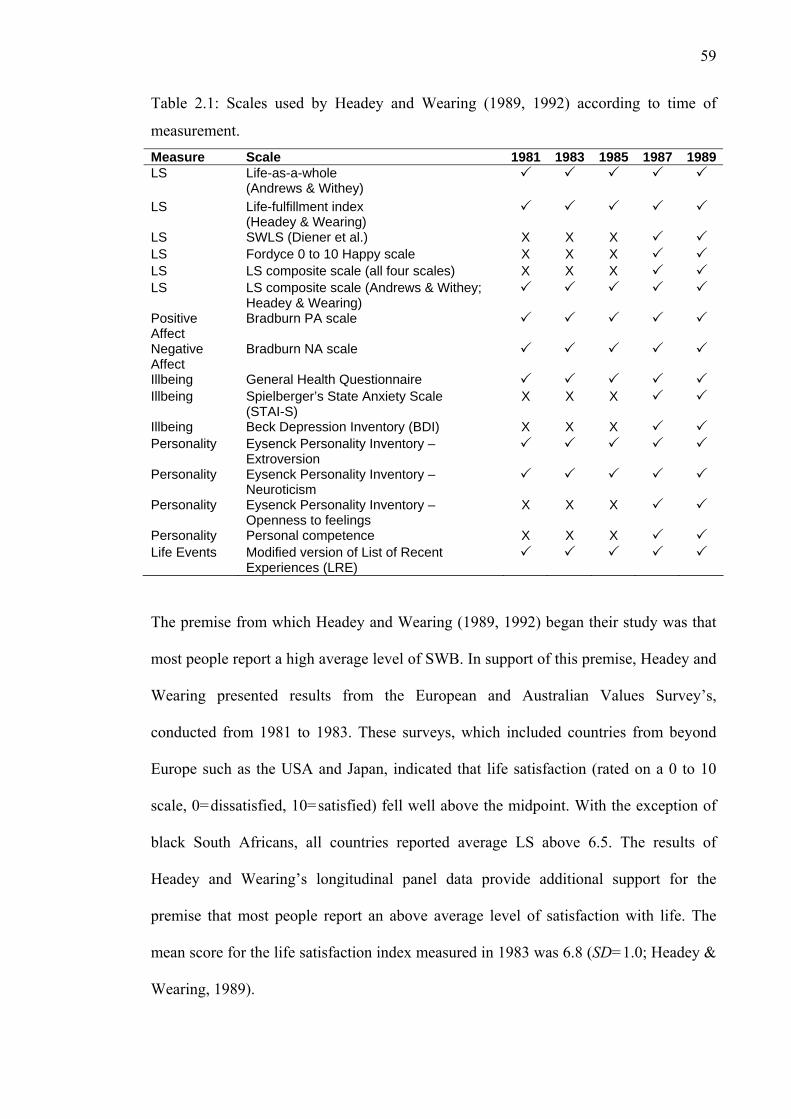
59
Table 2.1: Scales used by Headey and Wearing (1989, 1992) according to time of
measurement. Measure Scale 1981 1983 1985 1987 1989LS Life-as-a-whole
(Andrews & Withey)
LS Life-fulfillment index (Headey & Wearing)
LS SWLS (Diener et al.) X X X LS Fordyce 0 to 10 Happy scale X X X LS LS composite scale (all four scales) X X X LS LS composite scale (Andrews & Withey;
Headey & Wearing)
Positive Affect
Bradburn PA scale
Negative Affect
Bradburn NA scale
Illbeing General Health Questionnaire Illbeing Spielberger’s State Anxiety Scale
(STAI-S) X X X
Illbeing Beck Depression Inventory (BDI) X X X Personality Eysenck Personality Inventory –
Extroversion
Personality Eysenck Personality Inventory – Neuroticism
Personality Eysenck Personality Inventory – Openness to feelings
X X X
Personality Personal competence X X X Life Events Modified version of List of Recent
Experiences (LRE)
The premise from which Headey and Wearing (1989, 1992) began their study was that
most people report a high average level of SWB. In support of this premise, Headey and
Wearing presented results from the European and Australian Values Survey’s,
conducted from 1981 to 1983. These surveys, which included countries from beyond
Europe such as the USA and Japan, indicated that life satisfaction (rated on a 0 to 10
scale, 0=dissatisfied, 10=satisfied) fell well above the midpoint. With the exception of
black South Africans, all countries reported average LS above 6.5. The results of
Headey and Wearing’s longitudinal panel data provide additional support for the
premise that most people report an above average level of satisfaction with life. The
mean score for the life satisfaction index measured in 1983 was 6.8 (SD=1.0; Headey &
Wearing, 1989).
60
In their analysis of the longitudinal panel data, Headey and Wearing found evidence that
extroversion and neuroticism accounted for variance in SWB. Specifically, extroversion
was found to correlate .26 with LS, .22 with PA, -.17 with anxiety, and -.23 with
depression. Neuroticism correlated -.34 with LS, -.12 with PA, .40 with anxiety, and .46
with depression. Personal competence was also strongly related to depression (-.42),
and moderately to anxiety (-.28), PA (.22), and LS (.34). Openness to feelings
correlated weakly with LS (.08) and PA (.18) and non-significantly with anxiety and
depression. This data supports the previous conclusion that extroversion and
neuroticism only account for a small amount of variance in SWB. Individuals in Headey
and Wearing’s study that were high on extroversion reported slightly higher life
satisfaction and PA, and lower anxiety and depression. Conversely, highly neurotic
individuals reported lower LS and PA, and higher psychological distress. In addition,
and consistent with previous research (Cummins & Nistico, 2002; DeNeve & Cooper,
1998), having a positive sense of personal competence and control protected from
depression and anxiety and led to increased feelings of positive affectivity and life
satisfaction.
The longitudinal nature of the data enabled Headey and Wearing (1989, 1992) to test
their hypothesis that each person had a stable, equilibrium level of SWB that is
influenced by stable personality characteristics. In this test, Headey and Wearing
computed over-time correlations of LS, PA, and NA. These correlations are reproduced
in Table 2.2.
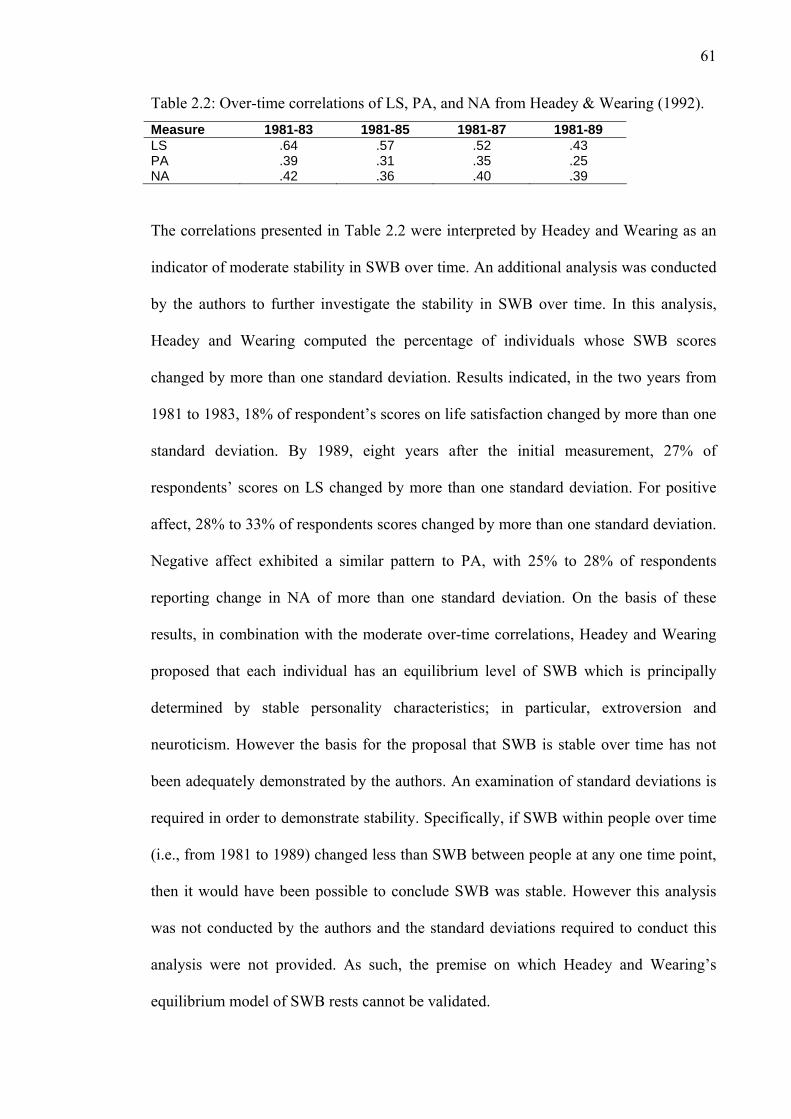
61
Table 2.2: Over-time correlations of LS, PA, and NA from Headey & Wearing (1992). Measure 1981-83 1981-85 1981-87 1981-89 LS .64 .57 .52 .43 PA .39 .31 .35 .25 NA .42 .36 .40 .39
The correlations presented in Table 2.2 were interpreted by Headey and Wearing as an
indicator of moderate stability in SWB over time. An additional analysis was conducted
by the authors to further investigate the stability in SWB over time. In this analysis,
Headey and Wearing computed the percentage of individuals whose SWB scores
changed by more than one standard deviation. Results indicated, in the two years from
1981 to 1983, 18% of respondent’s scores on life satisfaction changed by more than one
standard deviation. By 1989, eight years after the initial measurement, 27% of
respondents’ scores on LS changed by more than one standard deviation. For positive
affect, 28% to 33% of respondents scores changed by more than one standard deviation.
Negative affect exhibited a similar pattern to PA, with 25% to 28% of respondents
reporting change in NA of more than one standard deviation. On the basis of these
results, in combination with the moderate over-time correlations, Headey and Wearing
proposed that each individual has an equilibrium level of SWB which is principally
determined by stable personality characteristics; in particular, extroversion and
neuroticism. However the basis for the proposal that SWB is stable over time has not
been adequately demonstrated by the authors. An examination of standard deviations is
required in order to demonstrate stability. Specifically, if SWB within people over time
(i.e., from 1981 to 1989) changed less than SWB between people at any one time point,
then it would have been possible to conclude SWB was stable. However this analysis
was not conducted by the authors and the standard deviations required to conduct this
analysis were not provided. As such, the premise on which Headey and Wearing’s
equilibrium model of SWB rests cannot be validated.
62
To support the proposition that personality is the principal determinant of an
equilibrium level of SWB, Headey and Wearing (1989, 1992) analysed whether
extroversion and neuroticism, measured in 1981, could predict LS, PA, and NA
measured up to eight years later. The authors found that extroversion and neuroticism
significantly predicted LS, PA, and NA in 1983, 1985, 1987, and 1989. The variance
accounted for by extroversion and neuroticism ranged from a minimum of 17%
(predicting PA in 1989), to a maximum of 49% (predicting NA in 1983). The average
variance accounted for by extroversion and neuroticism in LS was 32%, in PA 22%,
and in NA 42%. The authors interpreted these results as support for their hypothesis that
SWB is stable around an individual set-point, and that personality strongly determines
the set-point level.
Headey and Wearing (1989, 1992) then attempted to understand change in SWB and
distress by investigating the impact of life events. The unique contribution of such life
events was assessed in a hierarchical regression in which personality was entered at step
1 and life events were entered in step 2. Whilst extroversion and neuroticism accounted
for 35% of variance in LS, 31% in PA, and 49% in NA, at step 2 life events accounted
for an additional 7% variance in LS, 16% in PA, and 10% in NA. Thus, life events
predicted LS, PA, and NA after controlling for extroversion and neuroticism. This
result, in combination with the previous results, led the researchers to propose that
personality, life events, SWB, and psychological distress are in dynamic equilibrium
(Headey & Wearing, 1992). Personality plays a central role in this theory. It is
hypothesised to strongly influence the set-point of SWB, in addition to predicting an
individual’s equilibrium level of favourable and adverse life events. Change in SWB is
hypothesised to be caused by deviations from the equilibrium level of life events. That
63
is, a major negative or positive life event that is not part of the normal pattern of life
events causes SWB to increase or decrease beyond its equilibrium level. Headey and
Wearing propose that such changes in SWB are only temporary, as stable personality
characteristics ensure that the individual is returned to his or her normal equilibrium
level of SWB.
Headey and Wearing’s (1992) longitudinal data provide an insight into the nature of
SWB and psychological distress beyond that which cross-sectional research can
establish. Following from their analyses, Headey and Wearing proposed that individuals
have a stable, equilibrium level of SWB. The stability in this equilibrium level of SWB
is hypothesised to be due to extroversion and neuroticism. However, as mentioned
previously, Headey and Wearing have not adequately demonstrated stability in SWB.
This limits the utility of the theory. In addition, Headey and Wearing found that
extroversion and neuroticism could only account for an average of 32% variance in life
satisfaction over time, leaving 68% unaccounted for. Other research, reviewed earlier,
often reported stronger correlations between life satisfaction and self-esteem, optimism,
and perceived control (Compton, 2000; Cummins & Nistico, 2002; DeNeve & Cooper,
1998; Diener & M. Diener, 1995; Lucas et al., 1996). These findings, interpreted
together with previous research finding inconsistent or weak correlations between
personality and life satisfaction (DeNeve & Cooper, 1998; Emmons & Diener, 1985;
Zheng et al., 2004) further limits the utility of Headey and Wearing’s theory. Thus the
search for a more comprehensive theory of SWB, incorporating other, potentially
stronger influences on SWB, must be made.
64
2.2 Cummins Homeostatic Model of Subjective Wellbeing
The search for a more complete theory of SWB has led to development of the
homeostatic theory of SWB by Cummins (1995). Specifically, Cummins built upon the
idea that SWB is maintained within a narrow range, however, extended Headey and
Wearing’s (1992) equilibrium idea further by incorporating the variables that relate to
satisfaction with the self (self-esteem, optimism, and perceived control), in addition to
the personality dimensions of extroversion and neuroticism. As such, the homeostatic
theory of SWB represents an important theoretical advancement in the field, and
warrants a detailed examination in order to determine the utility of this theory.
Cummins (1995) began his research following evidence that a majority of people report
life satisfaction above the mid-point of scales (Headey & Wearing, 1989, 1992). That is,
most people report feeling satisfied with their lives. Cummins proposed that if this
phenomenon were evident across studies in different populations, then the operation of
a psychological set-point for SWB may be the cause. Cummins set out to test this
hypothesis by conducting an analysis of the distribution of life satisfaction data in
published quality of life research. Cummins restricted the analysis to data from Western
countries. These studies were then subjected to strict criteria for inclusion. To be
included in the final analysis, studies had to have implemented symmetric Likert scales
measuring satisfaction either globally or through domains from which mean scores
could be derived. Scales measuring happiness were excluded. In addition, studies had
to: (a) originate from countries comparable on culture and socio-economic status,
(b) include participants between the ages of 17 and 65, and (c) exceed a sample size of
200. Seventeen studies fulfilled these criteria. These studies comprised data from
65
England, USA, Australia, Norway, and Canada. For comparability, scores on each study
were converted to a common statistic, Percentage of Scale Maximum (%SM), which
converts any response on a Likert-type scale to a common metric that can range from 0
to 100% (see Equation 2.1).
(Eqn 2.1)
Application of this formula by Cummins (1995) to the 17 studies gave a mean of
75%SM (SD=2.5). Thus, consistent with Headey and Wearing (1989, 1992), a majority
of people reported themselves to be three-quarters satisfied with their lives. Cummins
argued that this finding was evidence of the operation of a homeostatic mechanism by
which life satisfaction is maintained around 75%SM. Such a mechanism is argued by
Cummins to be highly adaptive, as it ensures that individuals, despite relatively stable
but diverse living conditions, maintain a high level of satisfaction with their lives.
However, this mechanism applies only on an averaged basis across populations and, as
the investigation of population sub-groups by Cummins revealed, some groups fell
outside the normal range (arbitrarily defined as two standard deviations from the mean).
Cummins’ homeostasis hypothesis is further supported when consideration is made of
the diversity of the studies. Fourteen different scales of life satisfaction were used in the
17 studies, with little commonality in the methodology. In addition, all studies were
linked only to the extent that they enquired about life satisfaction. Yet despite this
diversity in methodology, mean life satisfaction was found to be remarkably similar
scale on the possible score maximum the wherescale on the possible score minimum the where
converted be toscore the where
100%
=
=
=
×−
−=
Max
Min
MinMax
Min
kkx
kkkxSM
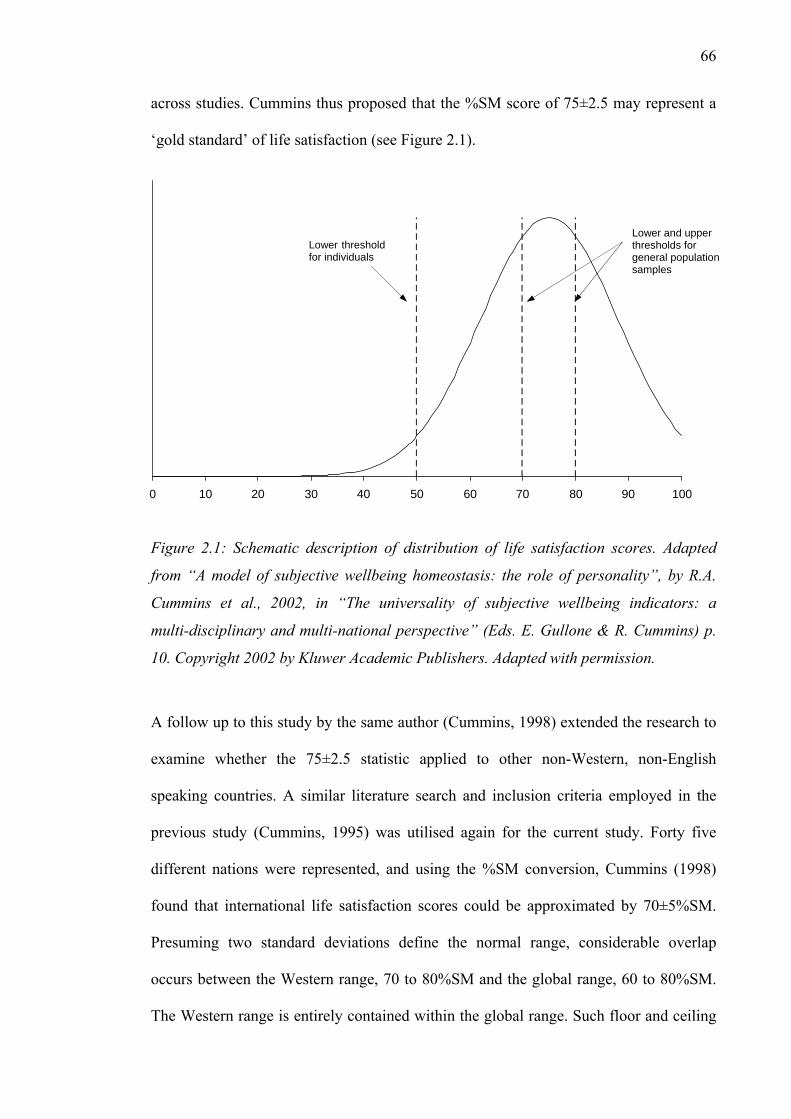
66
across studies. Cummins thus proposed that the %SM score of 75±2.5 may represent a
‘gold standard’ of life satisfaction (see Figure 2.1).
Figure 2.1: Schematic description of distribution of life satisfaction scores. Adapted
from “A model of subjective wellbeing homeostasis: the role of personality”, by R.A.
Cummins et al., 2002, in “The universality of subjective wellbeing indicators: a
multi-disciplinary and multi-national perspective” (Eds. E. Gullone & R. Cummins) p.
10. Copyright 2002 by Kluwer Academic Publishers. Adapted with permission.
A follow up to this study by the same author (Cummins, 1998) extended the research to
examine whether the 75±2.5 statistic applied to other non-Western, non-English
speaking countries. A similar literature search and inclusion criteria employed in the
previous study (Cummins, 1995) was utilised again for the current study. Forty five
different nations were represented, and using the %SM conversion, Cummins (1998)
found that international life satisfaction scores could be approximated by 70±5%SM.
Presuming two standard deviations define the normal range, considerable overlap
occurs between the Western range, 70 to 80%SM and the global range, 60 to 80%SM.
The Western range is entirely contained within the global range. Such floor and ceiling
0 10 20 30 40 50 60 70 80 90 100
Lower threshold for individuals
Lower and upper thresholds for general population samples
67
effects further support the proposition that a homeostatic mechanism maintains SWB
within a positive range. In addition, despite diverse living conditions, the average level
of life satisfaction across a disparate range of Western and non-Western countries varied
within a range of only 20% (Cummins, 2003). Consistent with these results, recent
research has found mean life satisfaction scores in non-English speaking samples of
Spanish adults and adolescents to be contained within the 70 to 80%SM range (Casas &
Coenders et al., 2007; Casas, Figuer, Gonzalez, & Malo, 2007).
An additional investigation of normative life satisfaction was undertaken by Cummins
(2003) in an examination of the distribution of life satisfaction data within populations.
A similar methodology that had been implemented in previous research by Cummins
(1995, 1998) was used, yielding within population data from 62 studies across 23
Western and non-Western countries. Results supported the previous finding of a global
standard for life satisfaction scores, with means ranging from 58%SM to 82%SM. This
study differed from previous research by Cummins (1995, 1998) as an analysis of
intra-population variance was undertaken. Cummins (2003) found that population
means above 70%SM were directly and systematically related to their standard
deviations. As mean values approached and were greater than 70%SM, the distribution
of data became increasingly leptokurtic, therefore having lower variance. Conversely, as
means fell below 70%SM, the distribution became increasingly platykurtic, with a
corresponding increase in variance. These results led Cummins to propose that life
satisfaction is not free to vary over its theoretical range; it is maintained within a narrow
range of positive values through the operation of a homeostatic mechanism. However a
systematic increase in variance for values above the upper threshold is also needed to
demonstrate evidence for the operation of a homeostatic mechanism. This test was not
68
able to be performed on the data in Cummins (2003) as intra-population life satisfaction
scores did not exceed 75%SM.
2.2.1 Internal Buffers and Control of Subjective Wellbeing
The finding that life satisfaction is maintained within a positive range led Cummins
(2003) to propose that life satisfaction may be held under homeostatic control in an
analogous manner to other homeostatic systems such as blood pressure. In a search to
understand how this occurs, Cummins hypothesised that devices maintaining
homeostasis may be found within cognitive schemata. For instance, optimism (sense
that tomorrow will be better than today), perceived control (sense of control over one’s
environment), and worthiness (that the self is decent and praiseworthy) may act to
maintain a positive worldview, thereby generating positive SWB. These variables were
eventually integrated into a theoretical model of SWB, which is discussed in detail
below.
In the homeostatic model of SWB developed by Cummins et al. (2002), each individual
is proposed to have an internal set-point for their normal level of SWB, where SWB
oscillates within a narrow range. The basic operation of the homeostatic mechanism
works by resisting change to SWB at the upper and lower thresholds, and, if such
thresholds are exceeded, works to return SWB to its normal level. Evidence presented
above provided partial support for this contention at the level of sample means, whereby
a systematic increase in variance was found when values fell below 70%SM, the lower
threshold for SWB (Cummins, 2003). However, as mentioned above, a systematic
increase in variance for values above the upper threshold is also needed to demonstrate
69
the operation of a homeostatic mechanism. Stability in SWB is also proposed to be
dependent on the operation of the homeostatic mechanism. For individuals who
experience no major life event to disrupt homeostasis, their SWB will be stable and
maintained around their set-point. However, individuals who experience a major life
event sufficient to defeat the homeostatic mechanism will experience the least stability
in SWB.
The notion that SWB depends on the severity of the challenging agent allowed a further
prediction by Cummins et al. (2002) to be made. That is, SWB would be controlled by
the homeostatic mechanism inside the upper and lower thresholds. When the strength of
an extrinsic influence (conditions that are outside the homeostatic system) exceeded the
capacity of the homeostatic system to adapt, SWB would respond to that extrinsic
condition. For instance, a strong negative condition would lead to the lower threshold
being exceeded, homeostasis defeated, and reduced SWB (Cummins et al., 2002; see
Figure 2.2).
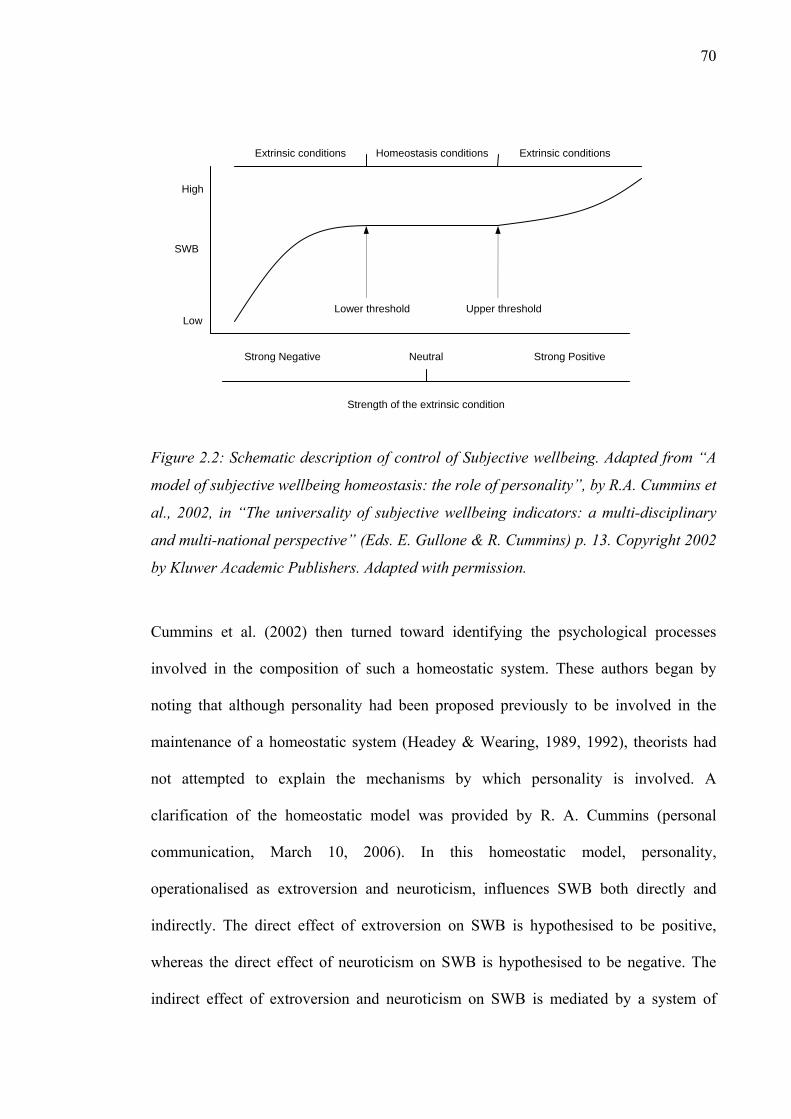
70
Figure 2.2: Schematic description of control of Subjective wellbeing. Adapted from “A
model of subjective wellbeing homeostasis: the role of personality”, by R.A. Cummins et
al., 2002, in “The universality of subjective wellbeing indicators: a multi-disciplinary
and multi-national perspective” (Eds. E. Gullone & R. Cummins) p. 13. Copyright 2002
by Kluwer Academic Publishers. Adapted with permission.
Cummins et al. (2002) then turned toward identifying the psychological processes
involved in the composition of such a homeostatic system. These authors began by
noting that although personality had been proposed previously to be involved in the
maintenance of a homeostatic system (Headey & Wearing, 1989, 1992), theorists had
not attempted to explain the mechanisms by which personality is involved. A
clarification of the homeostatic model was provided by R. A. Cummins (personal
communication, March 10, 2006). In this homeostatic model, personality,
operationalised as extroversion and neuroticism, influences SWB both directly and
indirectly. The direct effect of extroversion on SWB is hypothesised to be positive,
whereas the direct effect of neuroticism on SWB is hypothesised to be negative. The
indirect effect of extroversion and neuroticism on SWB is mediated by a system of
Extrinsic conditions Extrinsic conditions Homeostasis conditions
Lower threshold Upper threshold
Strong Negative Neutral Strong Positive
Strength of the extrinsic condition
High
SWB
Low
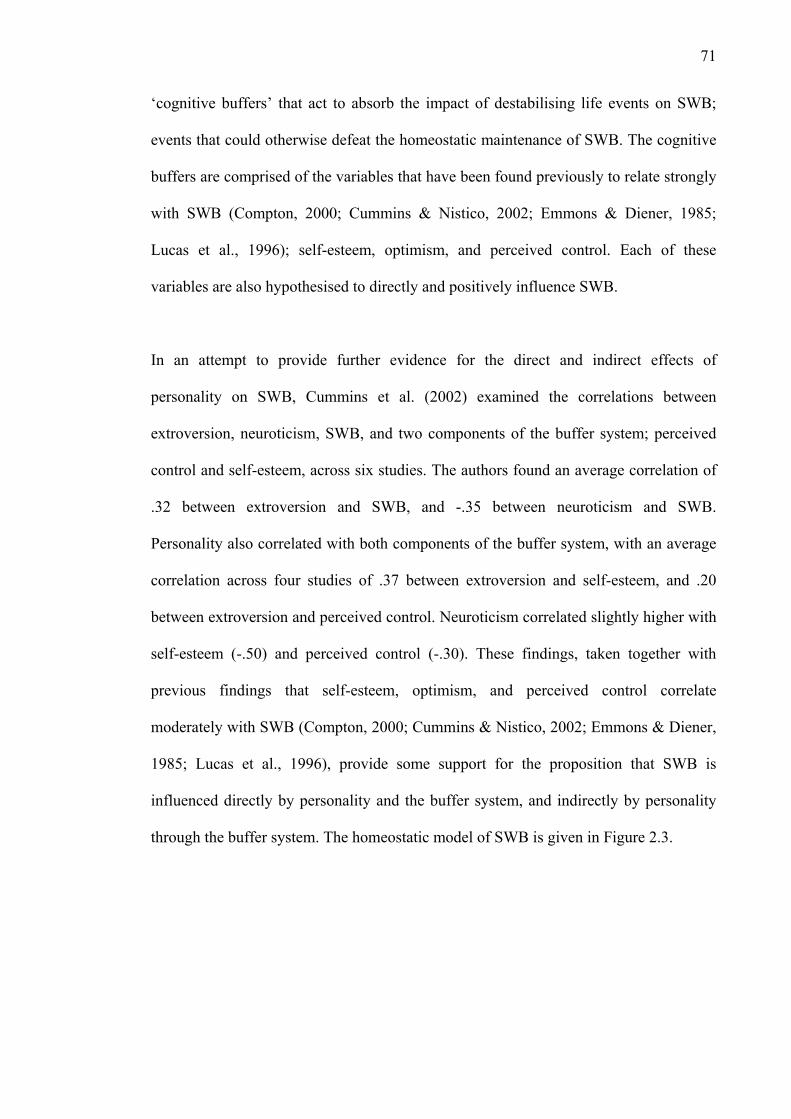
71
‘cognitive buffers’ that act to absorb the impact of destabilising life events on SWB;
events that could otherwise defeat the homeostatic maintenance of SWB. The cognitive
buffers are comprised of the variables that have been found previously to relate strongly
with SWB (Compton, 2000; Cummins & Nistico, 2002; Emmons & Diener, 1985;
Lucas et al., 1996); self-esteem, optimism, and perceived control. Each of these
variables are also hypothesised to directly and positively influence SWB.
In an attempt to provide further evidence for the direct and indirect effects of
personality on SWB, Cummins et al. (2002) examined the correlations between
extroversion, neuroticism, SWB, and two components of the buffer system; perceived
control and self-esteem, across six studies. The authors found an average correlation of
.32 between extroversion and SWB, and -.35 between neuroticism and SWB.
Personality also correlated with both components of the buffer system, with an average
correlation across four studies of .37 between extroversion and self-esteem, and .20
between extroversion and perceived control. Neuroticism correlated slightly higher with
self-esteem (-.50) and perceived control (-.30). These findings, taken together with
previous findings that self-esteem, optimism, and perceived control correlate
moderately with SWB (Compton, 2000; Cummins & Nistico, 2002; Emmons & Diener,
1985; Lucas et al., 1996), provide some support for the proposition that SWB is
influenced directly by personality and the buffer system, and indirectly by personality
through the buffer system. The homeostatic model of SWB is given in Figure 2.3.
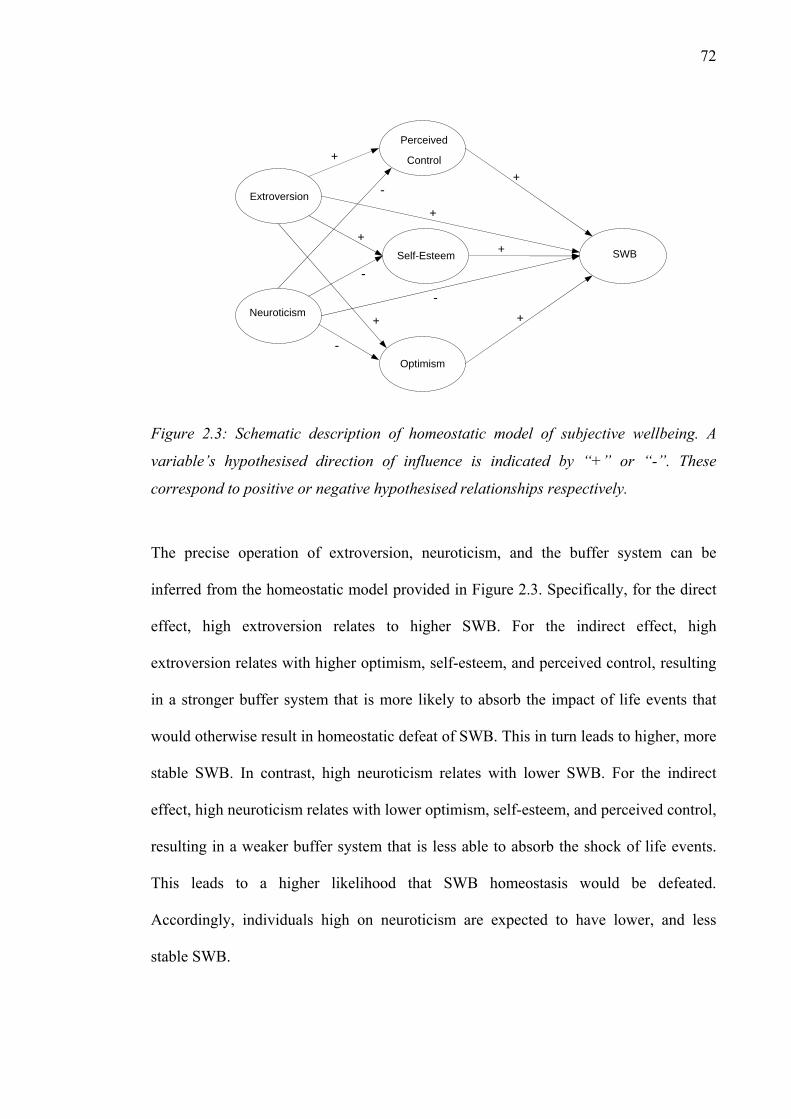
72
Figure 2.3: Schematic description of homeostatic model of subjective wellbeing. A
variable’s hypothesised direction of influence is indicated by “+” or “-”. These
correspond to positive or negative hypothesised relationships respectively.
The precise operation of extroversion, neuroticism, and the buffer system can be
inferred from the homeostatic model provided in Figure 2.3. Specifically, for the direct
effect, high extroversion relates to higher SWB. For the indirect effect, high
extroversion relates with higher optimism, self-esteem, and perceived control, resulting
in a stronger buffer system that is more likely to absorb the impact of life events that
would otherwise result in homeostatic defeat of SWB. This in turn leads to higher, more
stable SWB. In contrast, high neuroticism relates with lower SWB. For the indirect
effect, high neuroticism relates with lower optimism, self-esteem, and perceived control,
resulting in a weaker buffer system that is less able to absorb the shock of life events.
This leads to a higher likelihood that SWB homeostasis would be defeated.
Accordingly, individuals high on neuroticism are expected to have lower, and less
stable SWB.
Perceived
Control
SWB
Self-Esteem
Optimism
Neuroticism
Extroversion
+
+
+
+
+
+
-
-
-
+
-
73
The positive relationship between high self-esteem, optimism, and perceived control
was noted previously, however precisely how these variables influence SWB had not
been elucidated. Cummins et al. (2002) and Cummins and Nistico (2002) attempted to
rectify this by outlining how these variables might enhance or reduce SWB. Cummins
et al. (2002) proposed that individuals high on self-esteem who evaluate themselves
positively will demonstrate SWB resilience in the face of negative extrinsic conditions.
Such resilience may be found in upward social comparisons following failure. For
instance, an individual high on self-esteem may choose to believe that a person of
similar or greater abilities would have also failed under the particular conditions,
attributing their failure to the environment rather than to themselves (Cummins &
Nistico, 2002). Conversely, those low in self-esteem may be more likely to interpret
failures as a result of their own shortcomings, leading to higher anxiety and lower SWB.
High scores on the second component of the buffer system, optimism, have also been
demonstrated to relate to increased positive affect and higher life satisfaction (Compton,
2000; Cummins & Nistico, 2002; Lucas et al., 1996). Optimism is proposed to exert its
influence on SWB by reducing the impact of negative events on SWB such that an
individual expects difficulties would not last, and that things would get better in the
future. Extroversion would be expected to relate with relatively high levels of optimism
to the extent they are both positive traits. Conversely, neuroticism would be expected to
relate with low levels of optimism.
The final component of the buffer system, perceived control, relates to behaviour in
which steps are taken to maximise good outcomes and/or minimise bad outcomes
(Peterson, 1999). As discussed previously, a sense of personal control has been linked
74
to increased life satisfaction, whereas a lack of control has been linked to anxiety and
lower life satisfaction. Perceived control is proposed by Cummins et al. (2002) to act in
two ways. Firstly, under normal conditions, a person with a strong sense of control will
believe that the environment is under their control, and attribute positive events to his or
her actions. Secondly, when negative extrinsic conditions are experienced and must be
endured, a person with a strong sense of control is likely to attribute such events to
causes outside of his or her control. Conversely, a person low on perceived control is
likely to attribute negative events to his or her actions which could lead to feelings of
helplessness. However, Cummins et al. note that the capacity of this buffer will be
exceeded by a strong and protracted negative life event. Extroversion is likely to be
associated with a greater sense of perceived control due to the tendency for extroverts to
report higher positive affect. Conversely, neuroticism would be expected to relate with a
lack of perceived control due to the tendency for neurotics to experience greater
negative affect.
In summary, a strong buffer system is likely to provide some protection against events
(internal or external) that threaten SWB homeostasis, whereas a weak buffer system is
more susceptible to homeostatic defeat. The above discussion also highlights the
considerable overlap between the components of the buffer system (self-esteem,
optimism, and perceived control), rendering it likely that these components are
positively correlated. Indeed, over three separate samples, Lucas et al. (1996) found an
average correlation between self-esteem and optimism of .64. However these authors
also demonstrated that these two constructs were discriminable.
75
2.2.2 Summary of Homeostatic Model of SWB
Empirical evidence conducted by Cummins (1995, 1998, 2003) supports the argument
that life satisfaction is maintained around a stable set-point. In addition, the evidence
reviewed supports the proposition that SWB is maintained homeostatically through the
direct and indirect influences of extroversion, neuroticism, self-esteem, perceived
control, and optimism. Thus, a number of predictions can be made based on Cummins
et al.’s homeostatic model of SWB. That is: (a) SWB will be maintained
homeostatically around an individual set-point, (b) this set-point is influenced directly
by personality and the buffer system, specifically, extroversion, neuroticism,
self-esteem, perceived control, and optimism, and (c) SWB is influenced indirectly by
personality through the system of cognitive buffers.
These predictions have yet to be tested inside an empirical model, and as such, no
conclusion can be drawn as to the efficacy of the homeostatic model proposed by
Cummins et al. (2002). Research that specifies a structural equation model according to
the above predictions could answer such questions of efficacy. In addition, if this model
were subject to a direct comparison of alternative models of SWB that are supported by
empirical evidence, then stronger conclusions may be drawn. Possible alternative
theoretical models for such a test are provided by Michalos (1985), who proposes that
SWB is the direct result of a series of perceived gaps in one’s life, and Davern (2004),
who proposes SWB is primarily determined by affect in combination with personality
and cognitions. Adaptation-level theory also offers an alternative explanation of SWB,
however empirical support for this model is weak.
76
2.3 Adaptation-level Theory of Subjective Wellbeing
The homeostatic theory of SWB developed by Cummins et al. (2002) provides a
comprehensive explanation of SWB by incorporating variables that have been
empirically demonstrated to relate with SWB. However it is necessary to briefly discuss
an alternative, but related, account of SWB, namely adaptation. In quality of life
research, adaptation has been studied in response to major life events. Adaptation-level
theory (Brickman & Campbell, 1971) proposes that individuals judge their current level
of stimulation against whether such stimulation is higher or lower than that to which
they are accustomed. If the level of stimulation is higher, the person experiences a
change. However, over time, this new level of stimulation is incorporated into the
‘accustomed’ level, such that repeated exposure to this new level will exert considerably
less influence. An upward shift is said to have occurred in the adaptation level. This
process has been termed, the ‘hedonic treadmill’ as individuals must seek out new
levels of stimulation to maintain old levels of subjective pleasure. However,
adaptation-level theory provides a less comprehensive explanation of SWB than
Cummins homeostatic theory. Specifically, in adaptation-level theory, only external
events influence SWB. This explanation ignores personality and the large influence that
cognitive variables such as self-esteem and optimism exert on SWB (Cummins &
Nistico, 2002). In addition, adaptation-level theory does not provide a description of
how adaptation is measured or how strong the stimulus must be to cause a shift in SWB.
Further, the proposal of an adaptive mechanism that drives SWB is analogous to the
proposal of a homeostatic system. However the proposal of the adaptive mechanism
ignores other, recognised internal components (such as self-esteem, optimism, and
perceived control) that relate strongly with SWB (Cummins & Nistico). In comparison
77
to adaptation-level theory, Cummins homoeostatic theory not only incorporates both
external events and internal, cognitive variables, but also explicates the operation of a
mechanism that maintains homeostasis within a positive range. Thus the adaptation
theory of SWB is a poor explanation of SWB and will not be considered further.
2.4 Gap Theory Approach to Subjective Wellbeing
The gap theory approach represents an alternative, empirically supported (Michalos,
1985) explanation of SWB. According to this theory, SWB is thought to result from
‘gaps’ or perceived differences between an individual’s aspirations or goals and what
they have currently achieved (Andrews & Robinson, 1991). Smaller gaps between
aspiration levels and achieved levels result in higher SWB, whereas large gaps result in
lower SWB. A comprehensive gap model of SWB was developed by Michalos (1985,
Multiple Discrepancies Theory; MDT) and is regarded by some researchers to be one of
the most elegant and thoroughly articulated gap theories of life satisfaction (Andrews &
Robinson, 1991; Cummins, 1997; Lance, Mallard, & Michalos, 1995). MDT provides
an alternative theoretical approach to SWB than the approach given by the homeostatic
theories of Headey and Wearing (1989, 1992) and Cummins et al. (2002). This
alternative approach allows contrasts between the theories to be made, thereby helping
to determine the utility of either theory. Before any direct tests of the two theories it is
necessary to firstly elaborate on, and examine in detail, the mechanisms of MDT and the
evidence supporting the theory.
78
2.4.1 Michalos’ Multiple Discrepancies Theory
Michalos (1985) began from the premise that humans are motivated to pursue and
maintain satisfaction in proportion to perceived expected levels of satisfaction. The idea
is not new. Michalos notes that one of the central hypotheses of MDT, that satisfaction
results from the gap between what one has and wants, is rooted in the Stoic philosophy
of Zeno of Citium (300 B.C.). Michalos views SWB as resulting from evaluations of the
present self in relation to multiple standards of comparisons. These comparisons form
the core of MDT. Thus SWB, formally hypothesised by Michalos, results from
perceived gaps between, 1. what one has and wants (self-wants); 2. what relevant others
have (self-other); 3. the best one has had in the past (self-best); 4. what one expected to
have now, 3 years ago (self-progress); 5. what one expects to have in five years
(self-future); 6. what one deserves (self-deserves) and; 7. what one needs (self-needs).
Each discrepancy was developed based on a diverse set of empirical and theoretical
evidence. For instance, as mentioned previously the discrepancy between what one has
and wants is rooted in Stoic philosophy. The self-other and self-best discrepancies are
related to social comparison theory (comparisons with relevant others, and with the past
self), whilst the self-deserves discrepancy is supported by equity theory (that each
person receives whatever is due to him or her, as opposed to a distribution in which
each person receives the same as every other person). The discrepancy between what
one has and expects to have is rooted in Festinger’s theory of cognitive dissonance (the
difference between actual and expected outcomes; Festinger & Carlsmith, 1959). The
self-future discrepancy relates with optimism about the future, whilst
person-environment fit theory informs the self-needs discrepancy (i.e., the fit between a
person’s resources and what they need). Of these perceived discrepancies, Michalos
79
(1985), based on previous research (Michalos, 1980, 1982, 1983), hypothesised the
self-wants discrepancy as the most influential, and the mediating variable between all
other perceived discrepancies and overall life satisfaction.
To test whether MDT could explain variance in SWB, Michalos utilised a convenience
sample of 682 University undergraduate students. The sample comprised 46% males
and 54% females, with 70% of the sample aged between 20 and 25 years. Individuals
completed a demographic questionnaire containing questions regarding marital status,
work status, formal education, and major studies. Satisfaction with life as a whole was
measured using two different questions. The first question asked, “Considering your life
as a whole, would you describe it as very unhappy (=1), unhappy (=2 or 3), mixed
(=4), happy (=5 or 6), or very happy (=7)?” (p. 360). It is important to note at this point
that this conceptualisation of life satisfaction differs from the way in which life
satisfaction is measured in the majority of the quality of life literature. That is, global
life satisfaction is usually asked by some variant on the question, “How satisfied are you
with your life as a whole?” Measuring life satisfaction using happiness raises issues
about the connotations associated with the term “happy” that may bias an individual’s
response. For instance, Diener (1984) notes that most societies would consider being
happy as normative, and thus may report themselves as so regardless of their individual
experiences. Using the term ‘happy’ in the question itself could also prime the
individual to report a positive response. In addition, happiness and satisfaction are not
one and the same; an individual may be satisfied without being happy, and vice versa.
Nevertheless, applying the %SM conversion to the happiness data of Michalos yields a
score of 66.67%. This score is similar to the normative score for life satisfaction in
student data across countries as measured by Diener and M. Diener (1995). In the study
80
conducted by Diener and M. Diener, the authors examined cross-cultural correlates of
life satisfaction in 13,118 college students across 31 countries. The mean overall life
satisfaction, converted to %SM, was 61.56. When only western populations were taken
into account, the USA mean was 71.67, whilst for both Canada and New Zealand, mean
life satisfaction was 68.33.
In addition to the happiness measure of life satisfaction, Michalos (1985) also included
the more common conceptualisation of global life satisfaction in his research, asking
individuals, “How do you feel about your life as a whole right now?” Responses were
made using a revised 7-point Likert-type delightful-terrible scale. Response categories
ranged from “terrible” (=1), “mixed dissatisfying and satisfying” (=4), to “delightful”
(=7). This question yielded the same mean as the happiness question (66.67%SM).
Thus, posing a more valid measure of life satisfaction seemed to make no difference in
the reporting of global satisfaction in this sample. It may be that for these particular
college students, the term ‘happy’ had no inherent bias. Alternatively, it may be that
these particular students considered the terms happy and satisfaction as equivalent:
being satisfied with life may have been seen as synonymous with being happy.
Individuals in Michalos’ (1985) research also made satisfaction ratings for 12 life
domains. These domains included; health, financial security, family relations, paid
employment, friendships, housing, area lived in, recreation, religion, self-esteem,
transportation, and education. Following domain satisfaction ratings, individuals made
assessments according to each of the discrepancy hypotheses. The first discrepancy,
self-wants, asked individuals to consider how their life as a whole (or relevant domain)
compared to their general aspirations or what they wanted. The self-other discrepancy
81
asked individuals to compare how their life measured up against the average for most
people that were of a similar age and geographic location. The self-best discrepancy
asked individuals to consider how their life as it is now, measured up against the best
they have experienced in the past. For the self-progress discrepancy, individuals were
asked, “Compared to what you expected to have 3 years ago at this point in life, does
your life offer extremely less, about what you expected, or extremely more?” Similarly,
the self-future discrepancy asked individuals to, “Consider how you would rate your
own life, as it is at present, in comparison to what you expect it will be five years from
now.” For the self-deserves discrepancy, individuals compared their own life to the life
they thought they deserved. For the self-needs discrepancy, individuals were asked to
consider how their life measured up to what they thought they needed.
The results for these discrepancy ratings indicated the highest discrepancy across the 12
domains to be between what one has and what one needs (M=3.6; lower values indicate
larger discrepancies). The lowest discrepancies across the twelve domains were for what
one has and wants (M=4.7) and what one has compared with relevant others (M=4.7).
The domain of health elicited the highest satisfaction rating (5.3), whilst the domain of
paid employment elicited the lowest satisfaction rating (3.7). Michalos (1985) then used
the eleven domains, the six demographic variables, and self-esteem to predict global life
satisfaction. This regression resulted in 53% of variance in global satisfaction scores to
be accounted for by eight life domains and self-esteem. The remaining three domains of
area lived in, religion, and transportation did not significantly predict global life
satisfaction. The demographic variables were found to exert no effect on global life
satisfaction as the significance levels of the demographic variables were too low to be
entered into the regression equation. Satisfaction with self-esteem was the strongest
82
predictor of global life satisfaction (β=.31), followed by satisfaction with friendships
(β=.17). The weakest predictor of global satisfaction was satisfaction with paid
employment (β=.09).
Happiness with life as a whole was then predicted by the eleven domains, six
demographic variables, and self-esteem. Results indicated 39% of variance was
explained in global happiness scores by five of the eleven domains and self-esteem. The
six remaining domains of financial security, housing, area lived in, recreation, religion,
and transportation, in addition to the six demographic variables, exerted no effect on
global happiness scores. As with the global life satisfaction regression, self-esteem
(β=.26) and satisfaction with friendships were the two strongest predictors of global
happiness (β=.21).
The results of the two regressions provide further support for the role of self-esteem in
predicting life satisfaction. Self-esteem was found to be the strongest predictor of both
global life satisfaction and global happiness. This finding is consistent with previous
research that has found self-esteem and life satisfaction to be highly related (Compton,
2000; Cummins & Nistico, 2002). The finding that demographic variables had no effect
on global satisfaction or global happiness scores remains somewhat surprising, but is
consistent with previous research that has found little variance explained in SWB by
such demographic variables (Andrews & Withey, 1976; Campbell et al., 1976).
Following the regressions for life domains and demographic variables, Michalos (1985)
tested the predictions of MDT. The set of perceived discrepancies, demographic
variables (age, sex, work status, education), self-esteem, and social support were found
83
to predict 53% of variance in global life satisfaction. However the strongest predictors
were not any of the perceived discrepancies, but were social support (β=.28) and
self-esteem (β=.28). Similarly, when the set of perceived discrepancies, demographic
variables, self-esteem, and social support were used to predict global happiness, social
support (β=.24) and self-esteem (β=.18) were the first and third strongest predictors.
Together, these variables accounted for 49% of variance in global happiness.
Interestingly, only 10% more variance was accounted for by the combination of the
perceived discrepancies, self-esteem, social support, and demographics compared to the
variance accounted for by the combination of life domains and self-esteem (39%).
Similarly, the combination of perceived discrepancies, demographics, self-esteem, and
social support accounted for the same amount of variance in global life satisfaction as
satisfaction with eight life domains and self-esteem (53%).
Michalos (1985) then analysed which of the discrepancy variables exerted the greatest
influence on satisfaction scores in a series of multiple regressions. Using all seven
discrepancy variables as predictors, and domain (or global) satisfaction (or happiness)
as the criteria, the self-wants discrepancy had the highest beta value 38 times. On this
basis, Michalos concluded that the self-wants discrepancy was the most influential. The
second strongest discrepancy variable was the discrepancy between what one has and
relevant others have (self-other).
Overall Michalos (1985) found that the set of perceived discrepancies accounted for a
large proportion of variance in global life satisfaction and global happiness scores.
However, the strongest predictors of both global happiness and global life satisfaction
were not any of the perceived discrepancy variables, but social support and self-esteem.
84
Thus, although Michalos’ (1985) research provides some support for the hypothesis that
SWB is arrived at via judgements of perceived gaps, it also strongly supports the role
that cognitive variables, such as self-esteem and social support, have in influencing
judgements of SWB. As such, any model of SWB should take into account the role of
cognitive variables in influencing life satisfaction judgments.
An additional empirical analysis of MDT was conducted by Staats, Armstrong-Stassen,
and Partilo (1995). Staats et al., using the same methodology as Michalos (1985), tested
708 college students from the USA and Canada in 1985 and again in 1992. Mean
satisfaction and happiness scores averaged 5.17 across samples and time frames.
Converting this statistic to %SM yields satisfaction and happiness scores of 69.5%: a
finding consistent with Michalos (1985) and previous research for normative levels of
satisfaction within student populations (Diener & M. Diener, 1995). The predictions of
MDT were tested via a path analysis with global life satisfaction as the dependent
variable. This analysis resulted in 39% of the variance in life satisfaction accounted for
by the set of perceived discrepancies. Consistent with Michalos’ (1985) hypothesis, the
self-wants discrepancy exerted the greatest influence on life satisfaction (β=.37),
followed by self-esteem (β=.17). When the measure of SWB was global happiness, the
path analysis accounted for 45% variance, with self-esteem exerting the greatest
influence on happiness (β=.25), followed by the self-wants discrepancy (β=.22). Social
support was also found to directly and significantly influence global happiness (β=.16).
This additional empirical analysis of MDT provides further support that any theory of
SWB should include some form of cognitive variables, as self-esteem and social support
have been consistently found to strongly relate to judgements of SWB (Cummins &
Nistico, 2002; Diener & M. Diener, 1995; Michalos, 1985). The research of Staats et al.
85
provides moderate support for the prediction of MDT that perceived discrepancies
influence SWB.
MDT was also subjected to empirical investigation by Lance et al. (1995) who tested
the relationship between satisfaction with life domains and global satisfaction. The
sample comprised 1,354 students from the United States of America. The methodology
replicated that of Michalos (1985) with the exception that only the self-wants
discrepancy was measured. Empirical research has demonstrated the self-wants
discrepancy to be the most influential of the perceived discrepancies (Michalos, 1985;
Staats et al., 1995). The self-wants discrepancy was measured by asking participants to
consider, “your present life in comparison to your wants or aspirations. Now rate your
own life right now in terms of your life approaching what you want.” Response
categories ranged from 1 (not at all), through 4 (half as well as what you want) to
7 (matches or is better than what you want). A model was constructed that specified the
effect of the self-wants discrepancy for overall life satisfaction and each life domain.
The direct effect of the self-wants discrepancy on overall life satisfaction was
significant (β=.41; R2 and sr2 not provided). Similarly, self-wants significantly
influenced each domain, with beta weights ranging between .45 for education to .75 for
partner (mean β=.62). Based on these results, Lance et al. concluded that one of the
central tenets of MDT, that the self-wants discrepancy is an immediate and major
determinant of SWB, had been strongly supported by the empirical data. However this
conclusion is not warranted as the other perceived discrepancies were not measured,
therefore their effects on SWB could not be compared with the effects of self-wants on
SWB.
86
Overall, the picture emerging from these three empirical investigations of MDT is that
the perceived discrepancy between what one has and what one wants is a strong
predictor of SWB, though not stronger than an individual’s judgement of social support
or self-esteem. In addition, MDT seems to account for a moderate to large proportion of
variance in global satisfaction and global happiness scores (39% to 53%). However this
finding is not as impressive when consideration is made of the fact that MDT, in
Michalos’ (1985) research, predicted no more variance than satisfaction with nine life
domains. When global happiness was the measure, MDT predicted only 10% more
variance than domain satisfaction.
MDT represents an alternative theoretical model of SWB to the homeostatic model
provided by Cummins et al. (2002). However the research reviewed herein only finds
moderate support for MDT. In spite of this, any conclusion as to which of MDT and
homeostasis is the more efficacious theory cannot be made until an empirical analysis is
conducted that compares the two theories directly.
2.5 The Affective-Cognitive Model of SWB
Both homeostatic theory and MDT posit cognitions as the central, dominant influence
of SWB. However other researchers have put forth an alternative position whereby
SWB is primarily influenced by affect. Initially affect was proposed as a heuristic that
individuals used when making judgements of LS, as it was thought that asking an
individual to arrive at an overall judgement of life satisfaction across his or her life span
required an excessive amount of cognitive effort (Schwarz & Strack, 1999). In addition,
the abstract nature of the question made it even more likely that individuals would use
87
some form of heuristic in arriving at their LS judgement. Empirical evidence indirectly
supported this hypothesis, as LS was found to be not only sensitive to fluctuations in
mood (Forgas & Moylan, 1987), but also sensitive to environmental conditions
(Schwarz et al., 1987), and even to the nature of the questions that preceded the LS
question (Schwarz & Strack, 1999). Recent research conducted by Davern (2004) has
suggested that affect might be more than just a heuristic. Specifically, Davern proposes
that affect is strongly related to judgments of life satisfaction. This conclusion was
reached after finding that five trait affect items accounted for 66% of variance in SWB.
These five trait affects were happy, content, excited, satisfied, and discontent. Davern
then specified and tested a model of SWB that incorporated Costa and McCrae’s (1992)
five factors of personality (extroversion, neuroticism, conscientiousness, agreeableness,
openness to experience; combined to form a latent variable), multiple discrepancies
theory, and the five trait affects. In this model the five trait affects were combined to
form a single latent variable which was proposed to directly influence SWB, MDT, and
the five factors of personality. MDT and personality were also hypothesised to directly
influence SWB. A test of this model indicated the latent variable trait affect to be a
powerful predictor of SWB (β=.88 p<.001), MDT (β=.90, p<.001), and personality
(β=.78, p<.001). In addition, the combination of the five trait affects accounted for 53%
of the variance in MDT, and 61% of variance in personality. Having controlled for the
effects of trait affect in this model, MDT (β=.15, p=.05) and personality (β=-.11,
p=.05) were only weakly related to SWB. The model provided an adequate fit to the
data (χ2=466.91, p<.001, χ2/df=2.2, RMSEA=.04, AIC=636.91) and explained a large
amount of variance in SWB (88%). As these results suggest that trait affect is a
powerful determinant of SWB, this affective-cognitive model will be considered as an
alternative model to MDT and homeostatic theory.
88
2.6 Contrasting MDT, the Homeostatic Model, and Affective-Cognitive Theory
There are some points of difference between the three theoretical models of SWB that
must be borne out. Firstly, MDT hypothesises that a set of perceived discrepancies will
directly influence SWB such that higher discrepancies will lead to lower SWB. In
addition, MDT predicts personality, optimism, and perceived control exert no direct
influence on SWB. By contrast homeostatic theory predicts that SWB is directly
influenced by personality, and indirectly via self-esteem, optimism, and perceived
control (the three components of the buffer system). In comparison, the
affective-cognitive model proposes affect to directly influence SWB, as well as
indirectly through personality and MDT.
In a test of these three theories, there are two specific findings that would indicate
support for homeostatic theory over MDT and affective-cognitive theory. Such findings
are: (a) that life satisfaction data will lie between 70 to 80% of scale maximum despite
reports of large perceived discrepancies, and (b) that a structural equation model of
SWB according to homeostatic theory will predict greater variance in SWB, and
provide a better fit to the data, than a structural equation model of SWB specified
according to MDT or affective-cognitive theory.
2.7 Conclusion
This review began by noting that happiness is a fundamental part of human experience.
For centuries philosophers have attempted to outline the nature and causes of happiness;
however, it has only been in the last four decades that scientists have taken the study of
89
happiness, and more specifically, subjective quality of life, to be a legitimate area of
enquiry. This coincided with the move in psychology away from an exclusive focus on
ill-health, and towards an examination of how and why humans feel good. Such
investigations led to the finding that most people report a level of life satisfaction above
the mid-point of scales. Subsequently a search was undertaken to explain why a
majority of people report themselves to be satisfied with their lives. This search led to
the proposal that personality influences judgements of SWB. However empirical
support for this proposition is mixed at best. Nevertheless, Headey and Wearing (1992)
proposed a theoretical model of SWB in which personality provides an individual with
his or her equilibrium level of SWB. Their argument was that personality acts to bring
SWB back to equilibrium following events that change SWB above or below such an
equilibrium point. However, as mentioned previously, personality is not a strong
predictor of SWB. The search to explain the remaining unaccounted for variance in
SWB led researchers to examine other cognitive variables, such as self-esteem,
optimism, and perceived control. Each of these variables were found to correlate
strongly with SWB (Compton, 2000; Cummins & Nistico, 2002). This finding, in
conjunction with the finding that life satisfaction was maintained within a narrow range,
led Cummins et al. (2002) to propose a homeostatic theory of SWB. In this theory,
SWB is maintained around a set point through the operation of personality in
conjunction with a cognitive buffer system, comprised of self-esteem, optimism, and
perceived control. This system acts to absorb events or circumstances that have the
capacity to threaten the maintenance of SWB. Conclusions as to the efficaciousness of
this theory cannot be drawn until the theory has been subjected to an empirical test.
Ideally such a test would involve the comparison of the homeostatic theory with
alternative models of SWB that have empirical support. These alternative models are
90
MDT (Michalos, 1985), and affective-cognitive theory (Davern, 2004). According to
MDT, SWB is a direct function of a set of perceived discrepancies. This model has been
tested by Michalos and was found to account for a large amount of variance in SWB.
However the strongest predictors of SWB were not any of the perceived discrepancies,
but self-esteem and social support. Thus it may be that the homeostatic theory of SWB
that encompasses cognitive variables such as self-esteem, provides a better explanation
of SWB than MDT. The second alternative model of SWB, proposed by Davern,
incorporates affect, MDT, and personality to the explanation of SWB. This
affective-cognitive model was found to provide an adequate fit to the data whilst also
accounting for a substantial amount of variance in SWB. A direct test of homeostatic
theory, MDT, and affective-cognitive theory will allow conclusions to be drawn
regarding the utility of either one of these models in explaining SWB.