Embed Size (px)
Citation preview

©2005 Millennium Pharmaceuticals, Inc. 6/15/2005 1
Vlado DancikComputational Sciences
False Negatives and False Positives in High Throughput Screening data

©2005 Millennium Pharmaceuticals, Inc. V. Dancik 6/15/2005 2
Overview of the HTS and Hit Validation Process
HTS Confirmation Retest
Dose Response (Potency, Selectivity)
2nd
Chemical Assessment
200k - 1M+ 1k - 10k 100 - 1000 100 - 500
1st
Chemical Assessment
100 - 1000

©2005 Millennium Pharmaceuticals, Inc. V. Dancik 6/15/2005 3
Histogram of Results from an HTS
%inh_hts
18 11 13 25 26 114 667
4317
22774
64936
75921
41482
16664
6806
327719141288 928 712 636 469 432 325 297 235 217 199 191 139 149 148 131 105 81 102
-50 -40 -30 -20 -10 0 10 20 30 40 50 60 70 80 90 100 110 120
10000
20000
30000
40000
50000
60000
70000
All graphs generated using Spotfire Decision Site

©2005 Millennium Pharmaceuticals, Inc. V. Dancik 6/15/2005 4
Our Task
• Find false negatives:– Compounds that have HTS %inhibition below
the cutoff threshold but:• Are likely to be active• Are likely to add value (additional lead series)
• Find false positives– Compounds that have HTS %inhibition above
the cutoff threshold but:• Are not likely to be active against the target• Are not likely to add value

©2005 Millennium Pharmaceuticals, Inc. V. Dancik 6/15/2005 5
Our Approach
• Use computational and statistical methods• Use historical screening data
• Methods:– Mixture distributions– Selectivity– Cross-reactivity– Similarity clustering– Individual well analysis– Computational chemical assessment
©2005 Millennium Pharmaceuticals, Inc. V. Dancik 6/15/2005 6
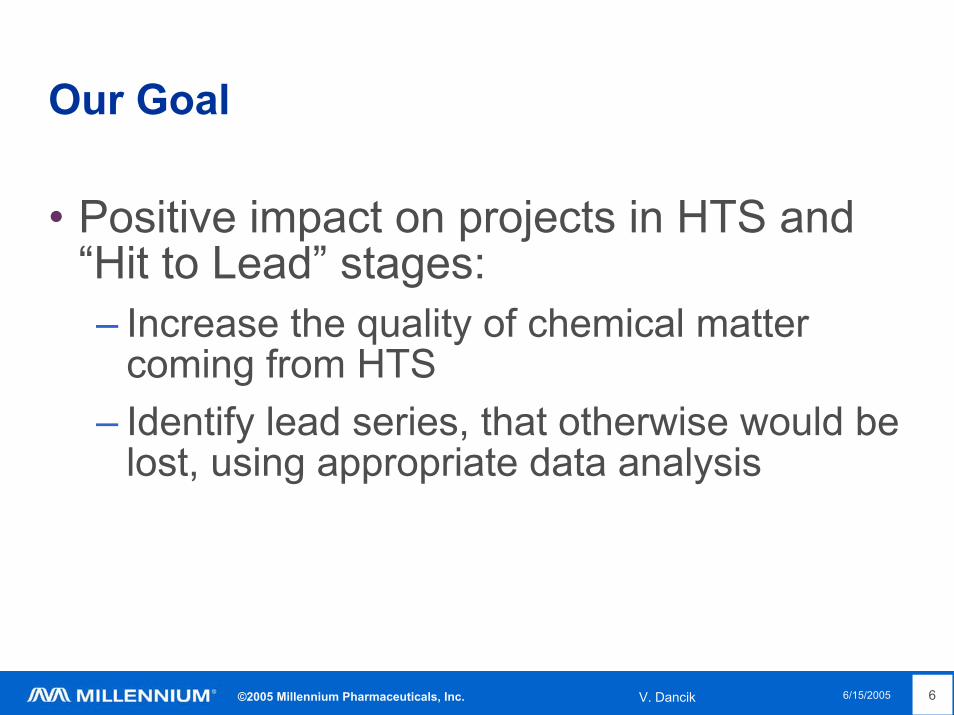
Our Goal
• Positive impact on projects in HTS and “Hit to Lead” stages:– Increase the quality of chemical matter
coming from HTS– Identify lead series, that otherwise would be
lost, using appropriate data analysis

©2005 Millennium Pharmaceuticals, Inc. V. Dancik 6/15/2005 7
Histogram of Results from an HTS
%inh_hts
18 11 13 25 26 114 667
4317
22774
64936
75921
41482
16664
6806
327719141288 928 712 636 469 432 325 297 235 217 199 191 139 149 148 131 105 81 102
-50 -40 -30 -20 -10 0 10 20 30 40 50 60 70 80 90 100 110 120
10000
20000
30000
40000
50000
60000
70000
Activity threshold
Compounds to analyze for potential false negatives
Positives
Analysis Threshold

©2005 Millennium Pharmaceuticals, Inc. V. Dancik 6/15/2005 8
HTS as a Random Number Generator
Flip a (very biased) coin:
p 1 – p
Generate Hit:Uniform distribution(usually) between 0 and 100%inh
Generate Noise:Normal (Gaussian)distributionMean µ ~ 0%inhStdDev σ ~ large

©2005 Millennium Pharmaceuticals, Inc. V. Dancik 6/15/2005 9
Mixture of Normal and Uniform Distributions
%inh_hts-50 -40 -30 -20 -10 0 10 20 30 40 50 60 70 80 90 100
0
0.01
0.02
0.03
0.04
0.05
µ
σ
p

©2005 Millennium Pharmaceuticals, Inc. V. Dancik 6/15/2005 10
Using Mixtures to Derive Thresholds
• Find parameters p,µ,σ that optimally fit HTS data
– We can use EM algorithm (Expectation-Maximization)
• Define hit likelihood as ratio of uniform probability density part and normal probability density part of the mixture
• Find threshold where hit likelihood is 50% (or other desired value)
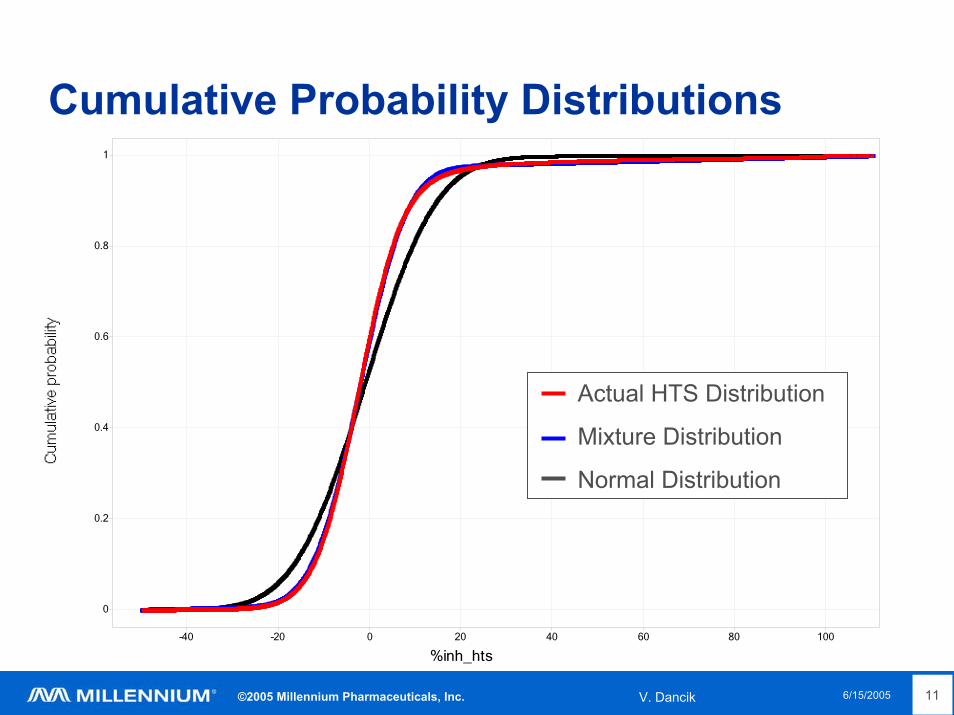
©2005 Millennium Pharmaceuticals, Inc. V. Dancik 6/15/2005 11
%inh_hts-40 -20 0 20 40 60 80 100
0
0.2
0.4
0.6
0.8
1
Cumulative Probability Distributions
Actual HTS Distribution
Mixture Distribution
Normal Distribution

©2005 Millennium Pharmaceuticals, Inc. V. Dancik 6/15/2005 12
Hit Likelihood
%inh_hts-40 -20 0 20 40 60 80 100
0
0.2
0.4
0.6
0.8
1
Hit
Like
lihoo
d

©2005 Millennium Pharmaceuticals, Inc. V. Dancik 6/15/2005 13
Our Approach
• Use computational and statistical methods• Use historical screening data
• Methods:– Mixture distributions– Selectivity– Cross-reactivity– Similarity clustering– Individual well analysis– Computational chemical assessment

©2005 Millennium Pharmaceuticals, Inc. V. Dancik 6/15/2005 14
Examples of a Selective and a Cross-reactive Compound
Assay
-20
0
20
40
60
80
100
Selective Compound
Assay
-20
0
20
40
60
80
100
Cross-reactive Compound
Kinase Chemokine Non-Chemokine GPCR Transferase Other

©2005 Millennium Pharmaceuticals, Inc. V. Dancik 6/15/2005 15
Selective and Cross-reactive Compounds
• Compare data for target of interest to data for other targets:– Selective compound: result for the target of
interest is significantly higher than results for other targets
• Compound may be of interest even if the result is below the threshold
– Cross-reactive compound: its results are frequently significantly high for many targets
• We may not be interested in the compound even if the result is above the threshold

©2005 Millennium Pharmaceuticals, Inc. V. Dancik 6/15/2005 16
Selectivity Score
• How many standard deviations the result is away from average result:
• Selectivity Score = (X – µ)/σ
• Selective compounds: – Selectivity Score > 3

©2005 Millennium Pharmaceuticals, Inc. V. Dancik 6/15/2005 17
Selectivity Score
%inh_hts40 50 60 70 80 90 100
0
1
2
3
4
5

©2005 Millennium Pharmaceuticals, Inc. V. Dancik 6/15/2005 18
Cross-reactivity Score
• For each compound:– Cross-reactivity score = “Squished” Average
of all HTS results– if %inh_hts < 0 then %inh_hts := 0– if %inh_hts > 100 then %inh_hts := 100
• Cross-reactive compound: score > 25– <1% of the HTS library are cross-reactive but 5-10% of hits in typical HTS are cross-reactive

©2005 Millennium Pharmaceuticals, Inc. V. Dancik 6/15/2005 19
Similarity Clustering
• Structure similarity clustering is used to find compounds that are NOT similar to compounds above the activity threshold:– The objective is to find additional lead
series– Cluster compounds using SciTegic’s
Pipeline Pilot clustering (maximum dissimilarity method)
– Find clusters that do not have members above the activity threshold

©2005 Millennium Pharmaceuticals, Inc. V. Dancik 6/15/2005 20
Similarity Clustering
%inh_hts30 40 50 60 70 80 90 100
0
50
100
150
200
250
300
350

©2005 Millennium Pharmaceuticals, Inc. V. Dancik 6/15/2005 21
“Average” Plate (Edge Effect)
column5 10 15 20
P
O
M
K
I
G
E
C
A
Color by averageof ~900 results in a well
-16.45 18.46

©2005 Millennium Pharmaceuticals, Inc. V. Dancik 6/15/2005 22
“Average” Plate (Multidrop Effect)
column5 10 15 20
P
O
M
K
I
G
E
C
A
Color by averageof ~1500 results in a well
-13.36 8.34

©2005 Millennium Pharmaceuticals, Inc. V. Dancik 6/15/2005 23
“Average” Plate (Checkered Board Effect)
column5 10 15 20
P
O
M
K
I
G
E
C
A
11.47
Color by averageof ~1000 resultsin a well
-6.90

©2005 Millennium Pharmaceuticals, Inc. V. Dancik 6/15/2005 24
Individual Well Analysis
• Because of the screening technology some wells may be:– hot wells – the measured values are higher
than the actual values– cold wells – the measured values are lower
than the actual values• Compensate for the well effect by using
different cutoff thresholds for each well

©2005 Millennium Pharmaceuticals, Inc. V. Dancik 6/15/2005 25
Individual Well Thresholds
(T – µ) / σ = (Tw – µw) / σwTw = [(x – µ) / σ] × σw + µw
whereTw – activity threshold for well wT – overall activity thresholdµw, σw – mean and standard deviation of
results in the well wµ, σ – overall mean and standard deviation

©2005 Millennium Pharmaceuticals, Inc. V. Dancik 6/15/2005 26
Chemical Assessment
• Compounds assessed by medicinal chemists: 1 – I like the molecule2 – OK3 – I don’t want to deal with it
• 10% – 50%+ of validated hits fail chemical assessment
• Disadvantage – low throughput, impractical for early stages of hit validation with high number of compounds

©2005 Millennium Pharmaceuticals, Inc. V. Dancik 6/15/2005 27
Computational Chemical Assessment
• Algorithm for prediction of how appealing compound is: – Combination of two Bayesian classifiers – one to
differentiate Category 1 from 2,3 and one to differentiate Category 3 from 1,2
– using SciTegic’s Pipeline Pilot fingerprints (ECFP6) and a few basic chemical properties
• 70% accurate for prediction of undesirable compounds and 50-60% accurate for prediction of appealing compounds

©2005 Millennium Pharmaceuticals, Inc. V. Dancik 6/15/2005 28
mTriage
• To use triage algorithm for purchasing of compounds and for library reformatting we need:– To improve and validate the algorithm– To collect additional assessment data
outside of the current training set• mTriage - web based tool for chemical
assessment by chemists

©2005 Millennium Pharmaceuticals, Inc. V. Dancik 6/15/2005 29
Training Set for Computational Chemical Assessment
• 12165 compounds in the training set:– 3601 compounds from 15 projects
• some projects used YES (=1.5) and NO (=3) rather then 1-2-3 for assessment.
– 8564 compounds with assessments collected via mTriage (web-based assessment tool):
• 3933 in first season and 4631 in second season• Every compound judged by three medicinal chemists
(or by 5 if first 3 do not agree)

©2005 Millennium Pharmaceuticals, Inc. V. Dancik 6/15/2005 30
Computational Chemical Assessment
Consensus Triage
808
1, 55%
2, 45%3, 1%
45191, 7%
2, 78%
3, 15% 30781, 1%
2, 30%
3, 69%
1 2 3
Consensus Triage
1854
1, 68%
2, 29%3, 2%
11155
1, 11%
2, 76%
3, 13%5873
1, 2%
2, 26%
3, 71%
1 2 3
“Average” Chemist
1 2 3

©2005 Millennium Pharmaceuticals, Inc. V. Dancik 6/15/2005 31
Compound Evaluation
-++--+Pass / Fail-+Chem. Assessment
-+Well analysis+Clustering
-Cross-reactivity+Selectivity
N. . .54321Compound

©2005 Millennium Pharmaceuticals, Inc. V. Dancik 6/15/2005 32
Example of Retest Results
%inh (HTS)60 65 70 75 80 85 90 95 100 105
0
20
40
60
80
100
1.14% hit rate(primary screen)
47.7% retest rate
Clustering
Selectivity
Well Analysis
Combination

©2005 Millennium Pharmaceuticals, Inc. V. Dancik 6/15/2005 33
Retest Rates
Region
628
No, 46%
Yes, 54%
422
No, 82%
Yes, 18%
947
No, 92%
Yes, 8%
Actives Datamined Not Datamined

©2005 Millennium Pharmaceuticals, Inc. V. Dancik 6/15/2005 34
IC50’s for Datamined Compounds
%inh_hts30 40 50 60 70 80 90 100
0
20
40
60
80
100

©2005 Millennium Pharmaceuticals, Inc. V. Dancik 6/15/2005 35
Results
• Applied to (at least) 18 HTS projects:– Additional lead series: 1 project– Additional validated hits: 5 projects– Additional confirmed positives, no additional
validated hits: 2 projects– Additional confirmed positives, hit validation
pending: 2 projects– No additional confirmed positives: 1 project– Discontinued projects: 7 projects

©2005 Millennium Pharmaceuticals, Inc. V. Dancik 6/15/2005 36
Methods were also used beyond HTS false negative/positive analysis:
• Evaluation of compounds for compound purchase and for HTS library reformatting
• Kinase inhibiting compounds for assay development
• Evaluation of biased libraries• Chemical assessment support• Iterative/Partial screening

©2005 Millennium Pharmaceuticals, Inc. V. Dancik 6/15/2005 37
Acknowledgements
• Medicinal Chemistry:– Chris Blackburn, Ken Carson, Chris Claiborne, Natalie Dales, Paul
Fleming, Tom Gant, Shomir Ghosh, Sandy Gould, Paul Greenspan, Gary Harriman, Mike Hepperle, Tracy Jenkins, Jeremy Little, Mike Patane
• Lead Discovery:– Jen Alley, Gabriel Berstein, Dan Bojanic, Seth Cohen, Larry Dick, Darren
Freeman, Jim Gavin, Paul Hales, Adam Hill, Ben Knight, Lev Kotler, ElinaMakino, Saurabh Menon, Eneida Pardo, Margaret Porter Scott, ChantevyPou, Alejandra Raimondi, Paul Skerker, Nick Skiba, Jeff Smith, Chris Sneeringer, Josh Xiao, Kim Yue-Hahn
• Computational Chemistry:– Lee Herman, Tim Mitchell, Dominic Ryan, Omar Stradella
• Chem-informatics:– Nick Camp, Csilla Csank, Rich Ferrante, Dave Pratt

©2005 Millennium Pharmaceuticals, Inc. 6/15/2005 38
Breakthrough science. Breakthrough medicine.SM
![Oui! Outlier Interpretation on Multi-dimensional Data via ...yhwu.me/publications/oui-eurovis19.pdf · blurry [CBK09,HPK11], leading to many false positives / negatives during outlier](https://img.pdfslide.us/doc/110x75/5fd14b8dd515d066f56790e9/oui-outlier-interpretation-on-multi-dimensional-data-via-yhwumepublicationsoui-.jpg)

![Move fast and secure things - OWASP · 4/4/2019 · – Continuous detection [+ prevention] • Limitations – False positives and negatives – Difficult to get right!10 • Whitehat](https://img.pdfslide.us/doc/110x75/5f77249cf947737044193a71/move-fast-and-secure-things-owasp-442019-a-continuous-detection-prevention.jpg)