Embed Size (px)
Citation preview
Falls - costs, numbers and links with visual impairment
Tammy Boyce
August 2011
Logo – RNIB supporting blind and partially sighted peopleRegistered charity number 226227
Published by:RNIB105 Judd StreetLondon, WC1H 9NE
Author(s):Tammy Boyce
Date: August, 2011
Sensitivity: Internal and full public access
Copyright: RNIB 2011
Document reference:
Commissioning: Evidence and Service Impact Team, RNIB.
Citation guidance:Boyce, T (2011) Falls - costs, numbers and links with visual impairment. RNIB.
Correspondence: Contact: RNIB Evidence and Service ImpactTelephone: 0121 665 4200Email: [email protected]
rnib.org.uk 2
2
Contents
Falls - costs, numbers and links with visual impairment.................1
Contents.......................................................................................3
Overview......................................................................................4
1. Evidence - Number of falls.......................................................8
1.1 All falls.................................................................................8
1.2 Fallers – one third of population over 65, half of those over 80..............................................................................................8
1.3 Recurrent fallers – half of all fallers.....................................9
1.4 Inequalities..........................................................................9
1.5 Rising trend and underestimates.........................................9
2. Falls attributable to partial sightedness and blindness (see also page 12).............................................................................10
3. Current guidance....................................................................11
4. Impact on health services - use.............................................12
4.1 All falls...............................................................................12
4.2 Primary and secondary care.............................................12
4.3 Ambulance........................................................................13
5. Impact on health services – costs..........................................13
5.1 All falls...............................................................................13
5.2 Recurrent falls...................................................................13
5.3 Falls attributable to partial sightedness and blindness......14
6. Evidence of visual impairment concerning causes and prevention of falls.......................................................................15
6.1 Causes..............................................................................15
6.2 Prevention.........................................................................16
7. In summary............................................................................17
8. Bibliography...........................................................................18
rnib.org.uk 3
3
Overview This briefing paper provides a summary of the evidence concerning the number and cost of falls attributed to partial sightedness and blindness.
Falls have a specific definition in the medical profession:
“A fall is an event that results in a person coming to rest inadvertently on the ground or floor or other lower level and should be considered as a recurrent event as soon as a subject reported at least two falls in a 12-month period.”
(Beauchet et al. 2011)
A large body of evidence examines the causes of falls, with the majority of research examining falls in the elderly as they account for most of all fallers. However understanding the role of partial sightedness and blindness as a cause of falls is studied less and therefore less well understood. Part of the reason why there is less evidence could be due to NICE guidance (issued in 2004) which concludes, based on a very small number of research papers, that there was ‘no evidence that referral for correction of vision as a single intervention’. This conclusion was based only on evidence of older people with partial sightedness/blindness living in community dwellings. NICE’s conclusions may have influenced researchers planning research in this area and those who fund related research. It would be advised to carry out more research to better understand the effect of secondary prevention related to vision impairment in preventing falls, such as the role of Eye Clinic Liaison Officers.
Calculating number of falls related to visual impairmentThe number of falls is increasing and recurrent fallers account for half of all fallers.
The limited amount of research estimating the number of falls attributed to partial sightedness and blindness primarily uses either Scuffham’s formula (e.g. Access Economics 2009) or a ‘modified’ understanding of it (e.g. Action for Blind People 2011).
rnib.org.uk 4
4
Scuffham’s formulaScuffham’s formula is used to estimate the number of falls attributed to partial sightedness and blindness. The formula is: Episodesk,VI = (IVI - Inon-VI) PVI. The part of the formula which may be of question is the ‘relative risk’ of falls attributed to partial sightedness and blindness. Relative risk (RR) forms part of the ‘IVI’ and ‘Inon-VI’ figures. Scuffham et al. (2002) established the RR at 1.9, basing this on the average of relative risks from non-UK studies. They state that a RR of 1.9 was ‘reasonable’ and ‘conservative’.
Scuffham ‘modified’The ‘modified’ understanding of Scuffham’s formula does not use the formula but instead uses a percentage to estimate the number of falls attributed to partial sightedness and blindness. The percentages used are based on the following (Scuffham et al. 2003): total accidental falls in the UK in 1999 requiring hospital
treatment - 2.35 million number which occurred in individuals with visual impairment –
189,000 (8.04 per cent) the number which can be attributed to the visual impairment -
89,500 (3.80 per cent).
Scuffham’s modified formula (Action for Blind People 2011) suggests a PCT could use their own fall numbers and calculate: 8 per cent of falls that result in hospital admissions occur in
individuals with visual impairment o costing 21 per cent of the total cost of treating accidental
falls; 3.8 per cent of falls resulting in hospital admissions could be
attributed to visual impairmento costing 10 per cent of the total cost of treating accidental
falls.
For example, Action for Blind used POPPI (2011) fall figures and Scuffham’s percentages to predict the number of falls attributable to visual impairment in Northamptonshire PCT in 2015:
33,255 people aged 65 or over will have a fall in 2015;
rnib.org.uk 5
5
2,509 of these people will have to be admitted to hospital; 200 people (0.0804 per cent) aged 65 and over with visual
impairment having a fall resulting in hospital admission; 95 people (0.038 per cent) aged 65 and over with visual
impairment having a fall resulting in hospital admission, directly attributable to visual impairment.
Is the Scuffham’s ‘modified’ formula acceptable?Using Scuffham’s modified formula to estimate the number of falls attributable to partial sightedness and blindness seems reasonable considering the relative risk is ‘conservative’.
In addition, Scuffham’s formula under-estimates falls in three ways:
1. Research concludes all fall Scuffham et al. (2003) estimate visual impairment was directly attributable to 47 per cent of the cost of falls in the population with visual impairment and 10 per cent of the cost of all falls in the UK. The proportion of total falls and associated costs attributable to visual impairment increased substantially with age – so areas with older population will incur higher number of falls and related costs.
2. There are inequalities in the number of falls – so areas with a higher Index of Multiple deprivation (IMD) score will more likely have higher number of falls and related costs.
3. Copious research concludes the costs of falls attributed to partial sightedness or blindness s are under-estimates for a number of reasons:o estimates are low as falls are either not recorded in notes or
the consequence of the fall is recorded instead of the fall.o Costs to primary care are rarely included – for example, the
cost to GPs are not included in Scuffham’s formula.o Costs of loss of income are not included in Scuffham’s
formula.
Prevention and clinical behaviourOne key point to consider is the lack of evidence of the effectiveness of prevention in reducing falls – particularly concerning the effectiveness of addressing partial sightedness and blindness to reduce falls. This may be something to consider as
rnib.org.uk 6
6
this could be used to state there is little evidence to state that Eye Clinic Liaison Officers will save money in the long-term.
It is important to note that ‘opportunities for secondary prevention (as set out by NICE) are being missed’ (Royal College of Physicians 2009). For example, only 41 per cent of sites (in primary, health and social care and acute trusts) include a home hazard assessment. They conclude: “the evidence base for falls prevention and bone protection has become consolidated, though there has not been any new evidence of sufficient weight to merit a paradigm shift in clinical practice” (ibid.).
Getting clinicians to acknowledge the role of partial sightedness and blindness in falls will be difficult, not only because there is less evidence of the role of partial sightedness and blindness in falls, but because it is difficult to change clinical behaviour to emphasise prevention rather than treatment.
rnib.org.uk 7
7
1. Evidence - Number of falls 1.1 All falls In 2006-7 there were 810,612 hospital episodes related to falls for the UK population (Access Economics 2009). Each year, over 700,000 older people in the UK attend hospital accident and emergency departments following a fall and many more attend minor injury units, or call for ambulance assistance (Royal College of Physicians 2009). Between October 2008 and September 2009 there were 283,438 slips, trips and falls reported to the National Patient Safety Association (NPSA 2010). In 1999, there were 647,721 A&E attendances and 204,424 admissions to hospital for fall-related injuries in the UK population aged 60 years or over (NICE 2004). The associated cost of these falls to the NHS and Personal Social Services was £908.9 million and 63 per cent of these costs were incurred from falls in those aged 75 years and over (NICE 2004).
In the UK approximately one in three older people will fall each year and two-thirds of them will fall more than once (Masud and Morris 2001).
1.2 Fallers – one third of population over 65, half of those over 80Most estimates of the number of falls examine falls in those over 65. Cohort studies have consistently demonstrated that 30 per cent of those aged 65 years and older experience at least one fall each year (e.g. Davis et al. 2010, Masud and Morris 2001, Rubenstein 2006). Every minute, six people over 65 suffer a fall. Falls are a major cause of disability and the leading cause of mortality resulting from injury in people aged over 75 in the UK. (NICE 2004). It is estimated that 50 per cent of over 80s will fall in any given year (Masud and Morris 2001, Rubenstein 2006). Not all of these falls are due to partial sightedness and blindness.
The South West falls, hip fractures and bone health review (Stewart 2010) estimated for a primary care trust and local authority with a population of 320,000: 15,500 will fall each year; 6,700 people will fall twice
rnib.org.uk 8
8
2,200 will attend accident and emergency departments or minor injuries units
A similar number will call an ambulance 1,250 will have a fracture of which 360 will be hip fractures
In a general practice with an all-age population of 10 000, the rate of incidence extrapolates to about 78 recorded fall events per year amongst its 2113 people aged >60 years. Across the whole of the UK it equates to more than 475 000 recorded fall events per year (Gribbin et al. 2009).
1.3 Recurrent fallers – half of all fallers It is estimated that half of fallers fall recurrently (e.g. Davis et al. 2010, van Nieuwenhuizen et al. 2010). Research reports percentages varying between 39 per cent and 65 per cent (Tinetti e al. 1995, Close et al. 1999, Whitehead et al. 2003, Davison et al. 2005). Approximately 25 per cent of adults aged over 75 years suffer at least two falls a year (Beauchet et al. 2011). Around 25 per cent of adults aged over 80 years suffers at least two falls per year (Rossat et al . 2010).
Not all of these falls are due to partial sightedness and blindness.
1.4 InequalitiesThe incidence rate of recorded falls and recurrent falls is higher in older age groups, women and least advantaged social groups (Gribbin et al. 2009).
1.5 Rising trend and underestimates As the population increases in the next decades, the number of older persons who fall is expected to rise. The British Orthopaedic Association (2007) estimate the number of hip fracture patients in a year may double by the year 2050. In addition, understanding of causes and funding for prevention has reduced incidence of other disease, such as heart disease, where the incidence of strokes and heart attacks are decreasing. However, the current trend for fractures from falls is increasing.
Many studies conclude that the numbers of falls are underestimated. In primary and secondary care this could be due
rnib.org.uk 9
9

to falls not recorded in notes or the consequence of the fall recorded instead (e.g. Gribben et al. 2009).
2. Falls attributable to partial sightedness and blindness (see also page 12)There is growing evidence of the impact of impaired vision on falls. Wood et al. (2011) found older adults with AMD had a higher incidence of falls and injuries. Almost half (47 per cent) of all falls in the population with visual impairment were directly attributable to the visual impairment (Scuffham et al. 2003).
Scuffham et al. (2002/3) methodology: To determine the number of falls attributable to partial
sightedness and blindnesso the difference between the estimated number of falls in the
population with partial sightedness and blindness and the expected number of falls in this population if they did not have sight loss.
Scuffham estimates: the total of accidental falls in the UK in 1999 requiring hospital
treatment (2.35 million) the number which occurred in individuals with visual impairment
– 189,000 (8.04 per cent) the number which can be attributed to the visual impairment -
89,500 (3.8 per cent).
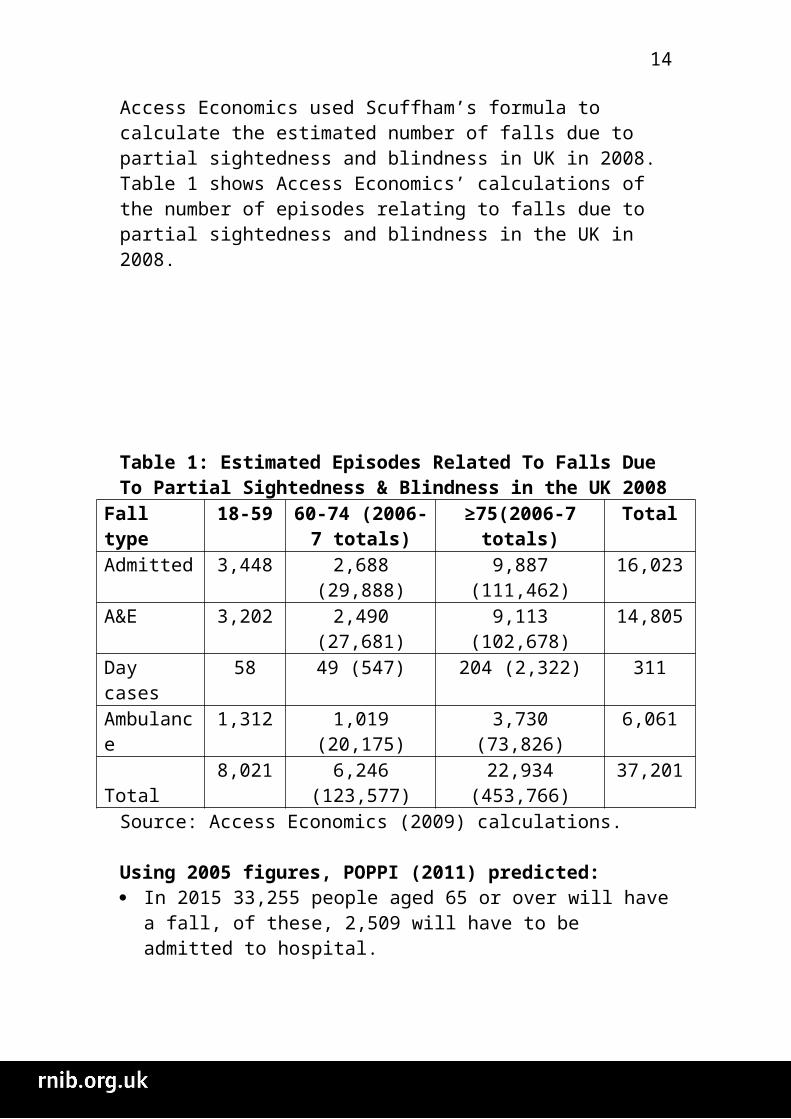
Access Economics used Scuffham’s formula to calculate the estimated number of falls due to partial sightedness and blindness in UK in 2008. Table 1 shows Access Economics’ calculations of the number of episodes relating to falls due to partial sightedness and blindness in the UK in 2008.
rnib.org.uk 10
10

Table 1: Estimated Episodes Related To Falls Due To Partial Sightedness & Blindness in the UK 2008
Fall type 18-59 60-74 (2006-7 totals)
≥75(2006-7 totals)
Total
Admitted 3,448 2,688 (29,888) 9,887 (111,462) 16,023A&E 3,202 2,490 (27,681) 9,113 (102,678) 14,805Day cases 58 49 (547) 204 (2,322) 311Ambulance 1,312 1,019 (20,175) 3,730 (73,826) 6,061Total 8,021 6,246 (123,577) 22,934 (453,766) 37,201
Source: Access Economics (2009) calculations.
Using 2005 figures, POPPI (2011) predicted: In 2015 33,255 people aged 65 or over will have a fall, of these,
2,509 will have to be admitted to hospital.
Using 2005 figures, Action for Blind People (2011) predicted in Northamptonshire PCT: In 2015 200 people aged 65 and over with visual impairment
having a fall resulting in hospital admission 95 people aged 65 and over with visual impairment having a fall
resulting in hospital admission, directly attributable to visual
3. Current guidanceCurrent guidance to reduce falls associated with partial sightedness and blindness recommends multi-component interventions. Based on evidence of the effectiveness of secondary prevention of falls, NICE guidance recommends referral to a falls service include all those who have received medical attention for a fall or have fallen more than once in a year (NICE 2004). There is evidence that the number of falls is higher than the number of referrals, therefore many opportunities to identify patients at risk of falling are missed (Royal College of Physicians 2009, Gribben et al. 2009).
In 2004, when the NICE guidance was published, there was ‘no evidence that referral for correction of vision as a single intervention for community dwelling older people is effective in reducing the number of people falling. However, vision assessment and referral has been a component of successful multifactorial falls prevention programmes’ (NICE 2004).
rnib.org.uk 11
11
NICE recommends individualised multifactorial interventions, tailored interventions to manage the following risk factors: strength and balance training home hazard assessment and intervention vision assessment and referral medication review with modification/withdrawal
The Clinical Practice Guideline for Prevention of Falls in Older Persons issued by the American Geriatrics Society and British Geriatrics Society recommends (2001, 2011): cataract surgery on the first eye should be expedited in older
persons in which the surgery is indicated vision assessment or intervention as part of a multifactorial
assessment and intervention strategy (not offered on its own).
4. Impact on health services - use4.1 All falls 5 per cent of all falls lead to a fracture and 5 per cent lead to
other serious injuries (Stel et al. 2004) Hip fracture the most common serious consequence of falling,
92 per cent of all proximal hip fractures are result of a fall (McKay and Anderson 2010, Torgerson et al. 2001)
86,000 hip fractures occur annually in the UK 20 per cent of all orthopaedic beds are used by hip fracture
patients. Half of people suffering a hip fracture never return to their
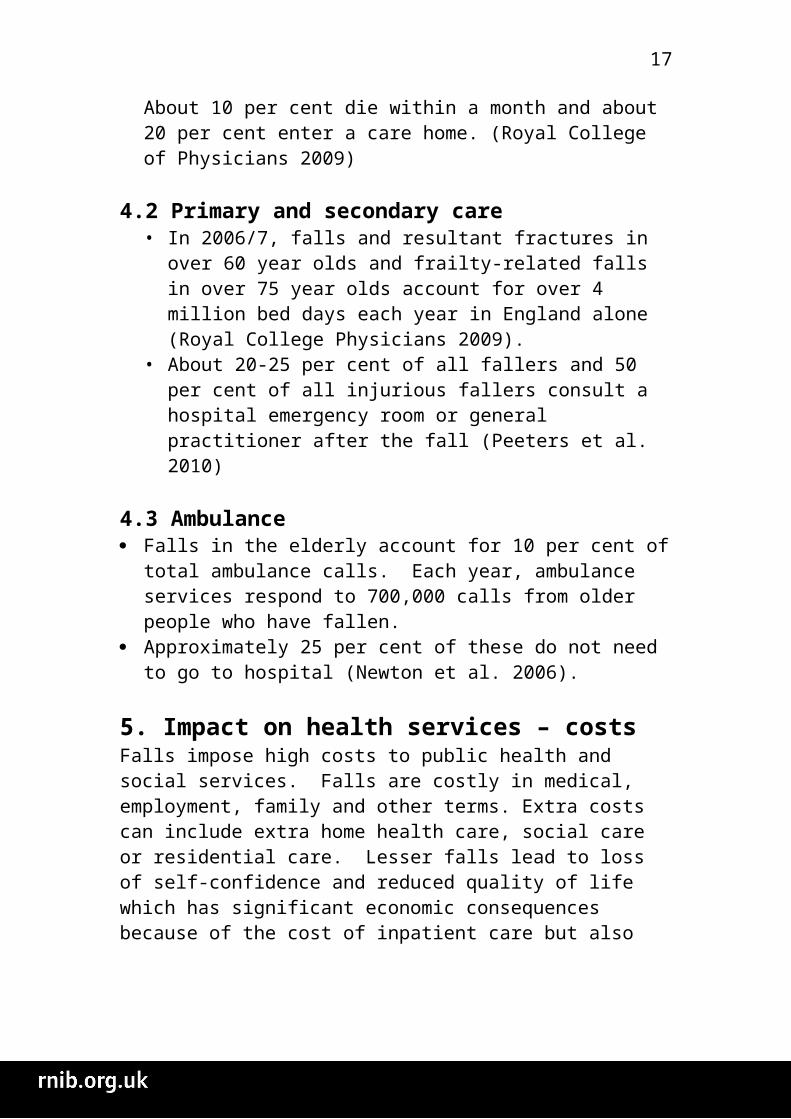
previous level of independence. About 10 per cent die within a month and about 20 per cent enter a care home. (Royal College of Physicians 2009)
4.2 Primary and secondary care• In 2006/7, falls and resultant fractures in over 60 year olds
and frailty-related falls in over 75 year olds account for over 4 million bed days each year in England alone (Royal College Physicians 2009).
• About 20-25 per cent of all fallers and 50 per cent of all injurious fallers consult a hospital emergency room or general practitioner after the fall (Peeters et al. 2010)
rnib.org.uk 12
12
4.3 Ambulance Falls in the elderly account for 10 per cent of total ambulance
calls. Each year, ambulance services respond to 700,000 calls from older people who have fallen.
Approximately 25 per cent of these do not need to go to hospital (Newton et al. 2006).
5. Impact on health services – costs Falls impose high costs to public health and social services. Falls are costly in medical, employment, family and other terms. Extra costs can include extra home health care, social care or residential care. Lesser falls lead to loss of self-confidence and reduced quality of life which has significant economic consequences because of the cost of inpatient care but also loss of independence and the cost of residential care.
5.1 All falls In 2003, falls by adults aged 60 years and older in the UK
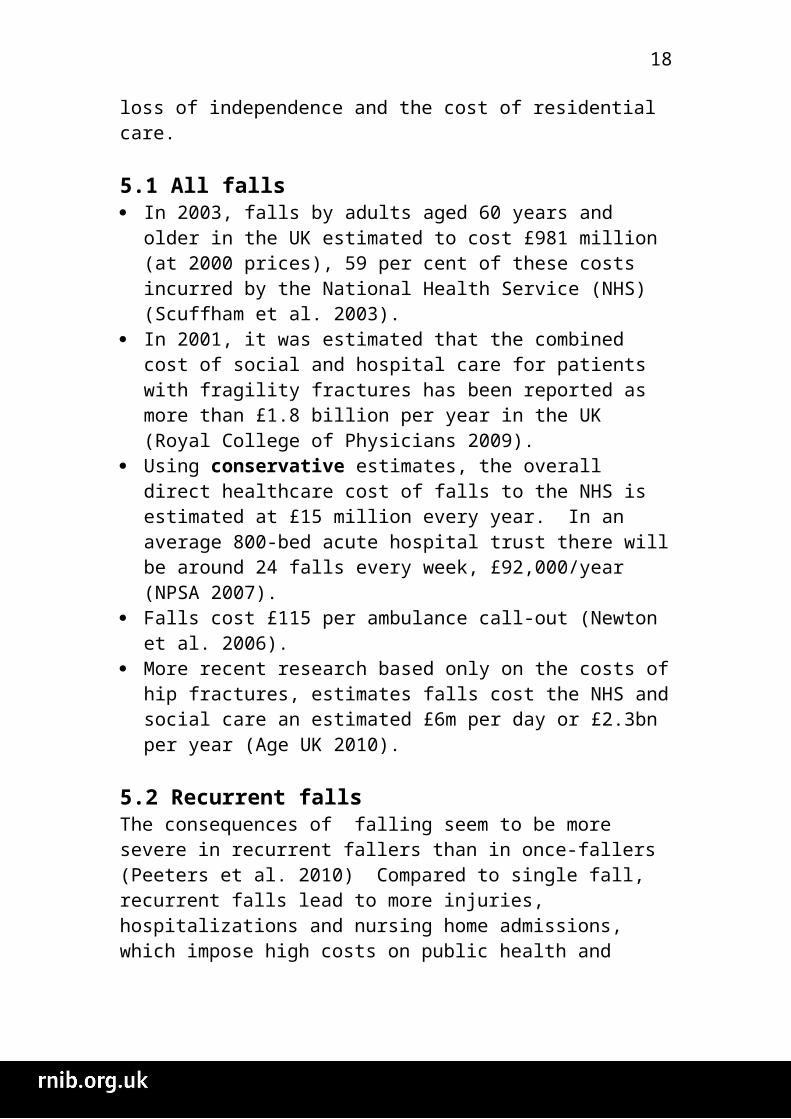
estimated to cost £981 million (at 2000 prices), 59 per cent of these costs incurred by the National Health Service (NHS) (Scuffham et al. 2003).
In 2001, it was estimated that the combined cost of social and hospital care for patients with fragility fractures has been reported as more than £1.8 billion per year in the UK (Royal College of Physicians 2009).
Using conservative estimates, the overall direct healthcare cost of falls to the NHS is estimated at £15 million every year. In an average 800-bed acute hospital trust there will be around 24 falls every week, £92,000/year (NPSA 2007).
Falls cost £115 per ambulance call-out (Newton et al. 2006). More recent research based only on the costs of hip fractures,
estimates falls cost the NHS and social care an estimated £6m per day or £2.3bn per year (Age UK 2010).
5.2 Recurrent fallsThe consequences of falling seem to be more severe in recurrent fallers than in once-fallers (Peeters et al. 2010) Compared to single fall, recurrent falls lead to more injuries, hospitalizations and nursing home admissions, which impose high costs on public health and social services (Beauchet et al. 2011). Patients who fell
rnib.org.uk 13
13
more than once experienced more often a fracture or had to be admitted to the hospital (van Nieuwenhuizen et al. 2010, Pluijm et al. 2006).
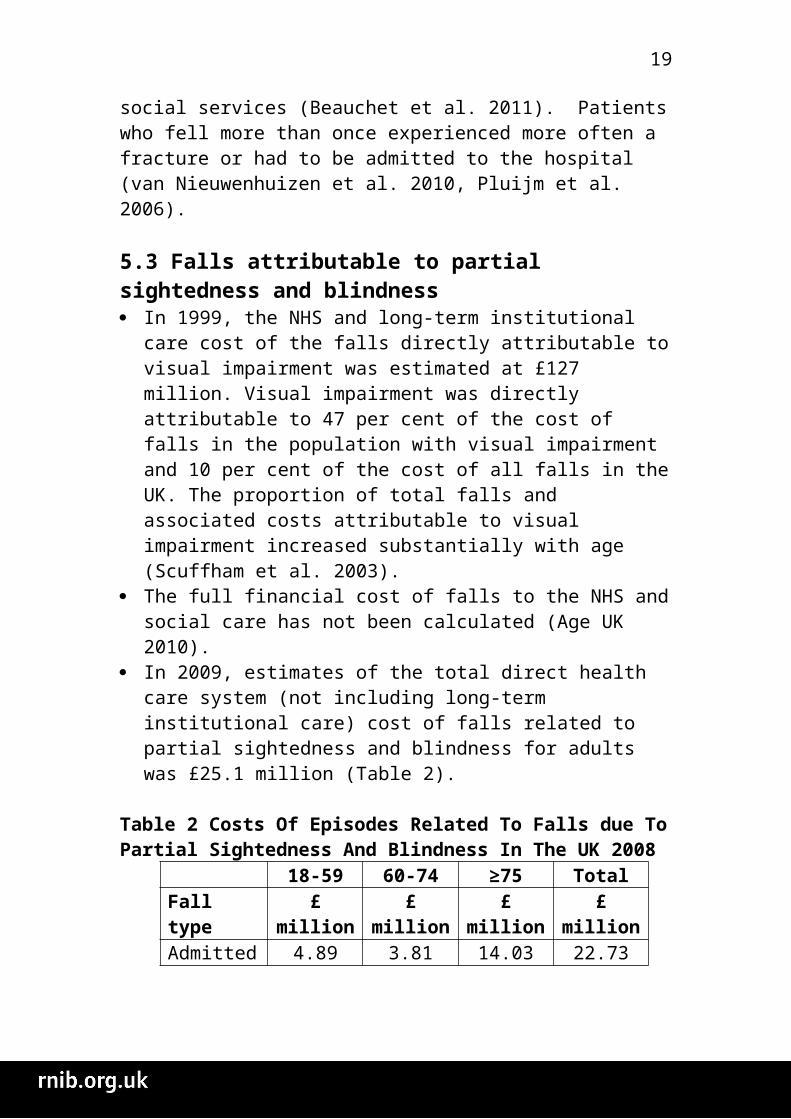
5.3 Falls attributable to partial sightedness and blindness In 1999, the NHS and long-term institutional care cost of the
falls directly attributable to visual impairment was estimated at £127 million. Visual impairment was directly attributable to 47 per cent of the cost of falls in the population with visual impairment and 10 per cent of the cost of all falls in the UK. The proportion of total falls and associated costs attributable to visual impairment increased substantially with age (Scuffham et al. 2003).
The full financial cost of falls to the NHS and social care has not been calculated (Age UK 2010).
In 2009, estimates of the total direct health care system (not including long-term institutional care) cost of falls related to partial sightedness and blindness for adults was £25.1 million (Table 2).
Table 2 Costs Of Episodes Related To Falls due To Partial Sightedness And Blindness In The UK 2008
18-59 60-74 ≥75 TotalFall type £ million £ million £ million £ millionAdmitted 4.89 3.81 14.03 22.73A&E 0.26 0.19 0.69 1.14Day cases 0.03 0.02 0.08 0.14Ambulance 0.23 0.19 0.67 1.09Total 5.41 4.21 15.48 25.10Source: (Access Economics 2009)
Formula Scuffham et al. (2003) and Access Economics (2009) use the same formula to calculate costs of falls related to partial sightedness and blindness.
Episodesk,VI = (IVI - Inon-VI) PVI Episodesk,VI = number of episodes directly attributable to partial sightedness and blindness across the k types of episodes
rnib.org.uk 14
14
PVI = prevalence of partial sightedness and blindness Ik,VI and Ik,non-VI = attributable fractions given by the following equations:I k,VI = RR* [Episodes k,Total / RR* P VI + P non-VI]I k,non-VI = [Episodes k,Total / RR* P VI + P non-VI]Pnon-VI = population of people without partial sightedness and blindnessRR = relative risk of falls associated with partial sightedness and blindness, which was 1.9 (Scuffham et al, 2002) Episodesk,Total = known number of episodes related to falls within the population.
6. Evidence of visual impairment concerning causes and prevention of falls
6.1 Causes The aetiology of falls is usually multifactorial, seldom due to a single cause (e.g. Tinetti 2003, Rubenstin 2006). Partial sightedness or blindness are two of the many causes of falls. Recurrent falls are seldom due to a single cause. (Beauchet et al. 2010). More than 400 risk factors for falls have been identified (Rossat et al. 2010).
Van Nieuwenhuizen et al. (2010) found impaired vision was not more prevalent in patients who fell more than once in the past year (compared to first time fallers). They conclude other risk factors are more relevant, such as; age, balance and mobility, osteoporosis incontinence, fear of falling, and orthostatic hypotension.
Few studies have specifically examined the risk factors for recurrent falls, with estimates that only around 5% of published manuscripts in the field of falls focused on their recurrence (Rossat et al. 2010). Research shows sensory deficits such as vision or proprioception impairment seem to be particularly related to the recurrence of falls (Hauer et al. 2006, Tinetti 2003, American Geriatrics Society et al. 2001, Lipsitz et al. 1991). Recurrent falls usually occur during basic activities of daily living such as walking and body transfer positions from sit-to-stand or stand-to-sit positions (Beauchet et al. 2011). A single fall may be coincidental
rnib.org.uk 15
15
and may be caused mainly by environmental factors, whereas recurrent falls usually are caused by physical, cognitive, and behavioural factors within the person (Peeters et al. 2010).
6.2 Prevention “The rate of recorded falls has remained unchanged in recent years. Greater emphasis on identifying and recording those who fall and delivering appropriate interventions are important for reducing the individual and societal costs of falling.” (Gribbin et al. 2009)
Regardless of NICE guidance and recommendations from the British Geriatrics Society, a survey of primary and secondary care found 50 per cent of sites do not employ a proforma to prompt standardised visual acuity assessment (Table 3, Royal College Physicians 2009).
Table 3: Availability of Multi-factorial falls risk assessmentMFFRA: components
National Primary care organisations
Health & social care
trusts
Acute Trusts
Standardised assessment for vision Impairment
50 per cent
(151/302)
45 per cent(66/146)
71 per cent(5/7)
54 per cent
(80/149)
The same survey found home hazard assessment and advice on safe and effective performance of activities of daily living was only offered by 41 per cent (123/303) of sites.
There is ample evidence that prevention reduces falls (e.g. NICE 2004, Department of Health 2009). The incidence of falls can be reduced by about 18 per cent in community-dwelling older adults, and by 25 per cent in hospitalized patients, regardless of the type of intervention (Beauchet et al. 2010). Tailored interventions, such as home modifications, appear to be more effective in high-risk populations (Peeters et al. 2010)
Medical personnel often focus on the resulting injury with little systematic assessment of the underlying cause and the effect on
rnib.org.uk 16
16
functional status and without recognizing possibilities for future prevention (van Nieuwenhuizen et al. 2010).
7. In summary As the number of falls increases with the ageing population, it is important that health and social services understand the significant impact of sight loss and falls. It is possible to calculate the number of falls related to partial sightedness and blindness. Scuffham et al.’s original formula has been modified to create a more simplistic formula for local areas to calculate falls in their area. This will create a conservative estimate of the number of falls related to partial sightedness and blindness at a local level.
rnib.org.uk 17
17
8. Bibliography
Access Economics (2009) The economic impact of partial sight and blindness in the UK adult population. London: RNIB.
Action for Blind People (2011) ECLO support in Northamptonshireand Kettering General Hospitals: Evaluation of potential cost savings. London: Action for blind people.
Age UK (2010) Stop Falling: Start Saving Lives and Money. London: Age UK.
American Geriatrics Society, British Geriatrics Society, and American Academy of Orthopaedic Surgeons panel on falls prevention (2001) Guideline for the prevention of falls in older persons. J Am Geriatr Soc, 49: 664-772.
American Geriatrics Society and British Geriatrics Society (2011) Summary of the Updated American Geriatrics Society/British Geriatrics Society Clinical Practice Guideline for Prevention of Falls in Older Persons. J Am Geriatr Soc, 59: 148–157.
Beauchet O, Dubost V, Revel-Delhom C, Berrut G, Belmin J et al (2011) How to manage recurrent falls in clinical practice: Guidelines of the French Society of Geriatrics and Gerontology. The Journal of Nutrition, Health & Aging, 15(1): 79-84.
British Orthopaedic Association (2007) The care of patients with fragility fracture. CA, USA: Blue Book. http://www.fractures.com/pdf/BOA-BGS-Blue-Book.pdf
Close J, Ellis M, Hooper R, Glucksman E, Jackson S, Swift C (1999) Prevention of falls in the elderly trial (PROFET): A randomised controlled trial. Lancet, 353(9147): 93-7.
Davison J, Bond J, Dawson P, Steen N, Kenny RA (2005) Patients with recurrent falls attending accident & emergency benefit from multifactorial intervention—a randomized controlled trial. Age Ageing, 34: 162-8.
rnib.org.uk 18
18
Davis JC, Robertson MC, Ashe MC, Liu-Ambrose T, Khan KM, Marra A (2010) Does a home-based strength and balance programme in people aged >80 years provide the best value for money to prevent falls? A systematic review of economic evaluations of falls prevention interventions. Br J Sports Med, 44: 80–89.
Department of Health (2009) Fracture Prevention Services: An economic evaluation. London: Department of Health.
Gribbin J, Hubbard R, Smith C, Gladman J, Lewis S (2009) Incidence and mortality of falls amongst older people in primary care in the United Kingdom. Q J Med, 102: 477–483.
Hauer K, Lamb SE, Jorstad EC, Todd C, Becker C; PROFANE-Group (2006) Systematic review of definitions and methods of measuring falls in randomised controlled fall prevention trials. Age Ageing, 35: 5-10.
Lipsitz LA, Jonsson PV, Kelley MM, Koestner JS (1991) Causes and correlates of recurrent falls in ambulatory frail elderly. J Gerontol, 46: M114-22.
Martin F, Sturdy D; Half way home? Update guidance from the DH on Intermediate Care in England 2010.
Masud T, Morris RO (2001) Epidemiology of falls. Age Ageing, 30(Suppl 4): 3-7.
McKay C, Anderson KE (2010) How to manage falls in community dwelling older adults: a review of the evidence. Postgrad Med J, 86: 299-306.
Newton JL et al. (2006) The Costs of Falls in the Community to the North East Ambulance Service. Emergency Medicine Journal, 23: 479–81.
Nice (2004) Press release: New guidelines for the NHS on the assessment and prevention of falls in older people. London: NICE.
rnib.org.uk 19
19
NPSA (2007) Slips, trips and falls in hospital. http://www.nrls.npsa.nhs.uk/resources/?entryid45=59821
NPSA (2010) New data prompts falls prevention reminder to NHS organisations. http://www.npsa.nhs.uk/corporate/news/new-data-prompts-falls-prevention-reminder-to-nhs-organisations/?locale=en
Peeters GMEE, Pluijm SMF, van Schoor NM, Elders PJM, Bouter LM, Lips P, (2010) Validation of the LASA fall risk profile for recurrent falling in older recent fallers. Journal of Clinical Epidemiology, 63: 1242-1248.
Pluijm SM, Smit JH, Tromp EA, Stel VS, Deeg DJH, Bouter LM, et al (2006) A risk profile for identifying community-dwelling elderly with a high risk of recurrent falling: results of a 3-year prospective study. Osteoporos Int, 17(3): 417-25.
POPPI (2011) http://www.poppi.org.uk/
Royal College of Physicians (2009) National Audit of Organisation of Services for Falls and Bone Health. http://www.bgs.org.uk/pdf_cms/pubs/National%20Audit_Organisation%20of%20Falls%20Services.pdf
Rossat A, Fantino B, Nitenberg C, Annweiler C, Poujol L, Herrmann FR, Beauchet O (2010) Risk factors for falling in community dwelling older adults: Which of them are associated with the recurrence of falls? The Journal of Nutrition, Health & Aging, 14(9): 787-791.
Rubenstein LZ (2006) Falls in older people: epidemiology, risk factors and strategies for prevention. Age Ageing, 35(Suppl 2): ii37-41.
Scuffham PA, Legood R, Wilson ECF, and Kennedy-Martin T (2002) The incidence and cost of injurious falls associated with partial sight and blindness in the UK. Visual impairment research, 4(1): 1-14.
rnib.org.uk 20
20
Scuffham P, Chaplin S, Legood R (2003) Incidence and costs of unintentional falls in older people in the United Kingdom. J Epidemiol Community Health, 57:740–4.
Stel VS, Smit JH, Pluijm SM, Lips P (2004) Consequences of falling in older men and women and risk factors for health service use and functional decline. Age Ageing, 33:58-65.
Stewart M (2010) Key Facts on Falls. London: British Geriatric Society.
Tinetti ME, Inouye SK, Gill TM, Doucette JT (1995) Shared risk factors for falls, incontinence, and functional dependence. Unifying the approach to geriatric syndromes. JAMA, 273(17): 1348-53.
Torgerson D, Iglesias C, Reid D (2001) ‘The economics of fracture prevention’ in The effective management of osteoporosis. Edited by Barlow DH, Francis RM, Miles AM. London: Aesculapius Medical Press.
van Nieuwenhuizen RC, van Dijk N, van Breda FG, Scheffer AC, Korevaar JC, van der Cammen TJ, Lips P, Goslings JC, de Rooij SE et al. (2010) Assessing the prevalence of modifiable risk factors in older patients visiting an ED due to a fall using the CAREFALL Triage Instrument. American Journal of Emergency Medicine, 28: 994–1001.
Whitehead C, Wundke R, Crotty M, Finucane P (2003) Evidence based clinical practice in falls prevention: a randomised controlled trial of a falls prevention service. Aust Health Rev, 26(3): 88-97.
Wood JM, Lacherez P, Black AA, Cole MH, Boon MY, Kerr GK (2011) Risk of Falls, Injurious Falls, and Other Injuries Resulting from Visual Impairment among Older Adults with Age-Related Macular Degeneration. IOVS, 52(8): 5088-92
rnib.org.uk 21
21


![Classify whole numbers, integers, and rational numbers using a visual representation such as a Venn diagram to describe relationships between sets of numbers.[6.2A]](https://img.pdfslide.us/doc/110x75/56649e6b5503460f94b689e1/classify-whole-numbers-integers-and-rational-numbers-using-a-visual-representation.jpg)