Embed Size (px)
Citation preview

Falling Sex Ratios and Emerging Evidence of Sex Selective
Abortion in Nepal
Melanie Frost1, Mahesh Puri2, Andrew Hinde1
1 Division of Social Statistics and Demography, University of Southampton 2 Center for Research on Environment, Health and Population Activities (CREHPA), Nepal

Introduction Selective abortion of females has been found to occur extensively in several Asian countries. Estimates
suggest that between 3.1 and 6.0 million sex-selective abortions took place in India in the 2000s.1 China
has a well-documented history of so-called “missing girls” resulting from a combination of the one child
policy and son preference, with as few as 847-877 girls born for every 1,000 boys.2 3 Both China and
India have well-established abortion services provided by national and regional governments; sex-
selective abortion is illegal in both countries.4 5
An interesting question is the extent to which state provision of abortion services is associated with the
selective abortion of females. Assessing this using data from China and India is difficult as the provision
of abortion services has increased gradually.4 6 However the neighbouring country of Nepal saw an
abrupt change between 2002 and 2004 which provides the opportunity to measure the impact of state
provision of abortion services on sex-selective behaviour. Abortion was legalised in Nepal in 2002 and
Comprehensive Abortion Care (CAC) services were provided by the government from 2004 onwards.7
Sex determination is expressly prohibited and anyone found performing (or facilitating) an abortion on
this basis can be punished with one year’s imprisonment, but otherwise the law is now liberal. Before
2002 unsafe abortion was the third largest cause of maternal mortality and it was not uncommon for
women living in the south of the country to visit India if they wanted an abortion, though the scale of
this is not known.7 Studies of post-abortion care at 10 major hospitals showed that between 20% and
60% of the women admitted as obstetric and gynaecological patients were abortion complication
cases.8
Nepal has revealed high levels of son preference since the World Fertility Surveys first documented the
phenomenon in the 1980s.9 Daughters are often considered to be an economic burden because of the
dowry system and the fact that a girl will join her husband’s family after marriage. Sons are highly
prized because they continue the family name, are deemed crucial to perform funeral rites, are likely to
bring in a daughter-in-law into the family and are expected to provide support for their parents in old
age.10-12
Before 2002, son preference in Nepal was mainly evidenced through differential stopping behaviour
(i.e. the decision to have another child depended upon the sex composition of previous children). It has
been estimated that such behaviour caused the fertility rate to be at least 6% higher and contraceptive
use to be as much as 24% lower than it would otherwise have been.9 10 It therefore seems possible that,
despite the strict prohibition of abortion on the grounds of the sex of the child, Nepalis will have taken
advantage of the opportunities provided by the legalisation of abortion to influence the sex composition
of their children.
Previous research suggests that sex-selective abortions occur in Nepal, but the evidence is either
qualitative or based on small scale data.13 A study in Kathmandu recorded the sex and parity of all
babies born in a single hospital during a five year period (2003-2007) and found that, while for first
born children the sex ratio was relatively normal at 943 females per 1,000 males, the sex ratio for
second order births was 847 and for higher order births it was 565.14 Unfortunately the sample sizes
were too small to draw any significant conclusions. A rapid assessment of sex ratios at birth in 1991
and 2001 consistently found more male than female babies being born in a number of districts of Nepal
bordering India.15 A study conducted in 2007 revealed that legal sanctions against pre-natal sex
determination and sex-selective abortion had not stopped medical practitioners and sonographers in
Nepal from providing such services.16

Abnormal sex ratios can be the result of mechanisms other than sex-selective abortion: one example is
through Hepatitis B, which can cause the sex ratio to be skewed towards males, though this is
somewhat controversial; 17 there are also other biological explanations, but none of these would
operate differentially across birth orders. If sex ratios vary substantially across birth orders then the
explanation for this is almost certainly the use of sex-selective abortion. In India, for example, recent
research indicates that the sex ratio of first born children has not changed significantly since 1990,
while the sex ratio of second born children where the first was female was as low as 786 in the year
2000 and has not been above 900 since 1992.1 Research from China has also found that sex ratios differ
by parity – in 2004-05 the sex ratio of first born children was 925, while for second born children it was
699.3
It should be noted that even when sex-selective abortion is occurring, changes in its prevalence can
occur for reasons related to the demand for, rather than the supply of, abortion services. Where fertility
is declining rapidly the preference for sons may be intensified since the overall desired number of
children will fall faster than the desire for sons, and pressure on couples to balance the sex composition
of their children may contribute to further demand for pre-natal sex selection at low parities.12 18 Nepal
has seen one of the most dramatic fertility declines in history, with the total fertility rate (TFR) falling
from 4.1 to 2.6 in just 10 years.19
The aim of this paper, therefore, is to examine sex ratios of births before and after the introduction of
Comprehensive Abortion Care in 2004 to assess whether, given the religious and socio-economic value
given to sons, the legalisation of abortion, and the availability of pre-natal sex-determination
technologies and abortion clinics, was associated with a change in the proportion of babies which were
male.
Methods
Data Over 40,000 women were interviewed in four rounds of the Nepal Demographic and Health Survey
(NDHS), conducted in 1996, 2001, 2006 and 2011. All four surveys were nationally representative and
used a two stage stratified sampling scheme. All women were asked about their fertility and full birth
histories were obtained from the 31,842 women aged 15-49; these birth histories included information
on over 111,000 births. Full details of the NDHSs can be found elsewhere.19-22
A module on induced abortion was included in the 2011 NDHS for the first time. This included
questions to ascertain the prevalence of abortion as well as the reasons for it. Overall 7.5% of
pregnancies were reported to have ended in abortion in the five years before the survey was conducted.
This varied substantially depending on the woman’s socioeconomic characteristics with 17.5% of
pregnancies ending in abortion for women in the highest wealth quintile. Of 506 women who gave a
reason for their abortion 3.16% reported that it was due to the child’s sex, but the subject area tends to
have a high incidence of misreporting so indirect methods are likely to be the best method of studying
the phenomenon.23
Statistical Analysis In the absence of intervention, the sex ratio at birth in human populations is essentially a biological
constant with relatively little variation. For every 1,000 males born, there will generally be between
950 and 975 females.24 25 This should not vary by birth order.

To control for the fact that demand for sex-selective abortions will vary by birth order and sex of
previous children conditional sex ratios (CSRs) are used in our analysis, specifically the CSR for second-
born children where the first born was female. This sex ratio is generally held to be where evidence of
sex-selective abortion will be most visible, since the motivation for sex-selection will probably be at its
highest; it has been used frequently to provide evidence for the widespread use of sex-selective
abortion in India.1 23 If a woman is sufficiently motivated (or pressured) to have a son that she is
prepared to have an abortion to achieve that end it is unlikely that she will wait until a much higher
parity than two or three.
The sex ratios presented in this paper are the number of female births per 1,000 male births, calculated
as( ⁄ ) , where is the proportion of total births that are female and is the proportion of
total births that are male. The sex ratios are weighted to account for the sampling scheme used in the
NDHS. We only included births reported to have happened within ten years of the survey date, since
extremely long recall periods tend to be less accurate, and misreporting may differ by sex of the baby.
For time periods where more than one survey was available a weighted average of the different surveys
was used.
Wealth tertiles were produced using principal components analysis; this was done separately for urban
and rural areas in order to be able to look at the relative contribution of women at different wealth
levels in diverse environments. Tertiles were used, rather than the more traditional quintiles, due to
sample size considerations.
All analyses were conducted in STATA (version 12.0).
Results Sex ratios at birth were found to vary substantially by parity, the sex of previous offspring and the time
period during which the births occurred. Table 1 shows the trends in different conditional sex ratios
over the 18-years 1992-2010. Years were grouped as the sample sizes for single years were small. The
overall sex ratio is never significantly different from the expected range of 950-975 and does not show
significant change over time; the same is true of the sex ratio of first-born children. However, for
second-born children where the first born was female, the sex ratio shows a substantial decline after
the legalisation of abortion. In 2001-2003 it was 947, in 2004-2006 (when government abortion
services became available in most district headquarters and urban and semi-urban areas) it dropped to
830 and by 2007-2010 it had fallen further to just 742, despite the overall sex ratio being 933. For
third-born children where the first two children had both been female the sex ratio was also very low at
767, compared to 892 if the first two children had both been male or 935 if one was male and one was
female. The sex ratio for second-born children in 2007-2010 was low even for mothers whose first
born was male at 822. Of the 4,521 births recorded in the NDHS 2011 during 2007-2010, 1,247 were
second order births and just 559 (44.8%) of these were female. Assuming the biologically expected sex
ratio at birth we would have expected at least around 650 females to have been born given the number
of males.
It should be noted that in 2007-2010 only 14% of all births in Nepal were second order after a first-
born girl. This explains why the overall sex ratio at birth is not greatly affected even by substantial
changes in the sex ratio for this subset of births.

The sex ratio for second-born children where the first was female is thought to be the strongest
evidence for sex selective abortion available, short of direct data. If this particular CSR also varies by
socioeconomic characteristics then this is even stronger evidence that sex-selective abortion is being
used, since knowledge of, access to, and uptake of abortion will not be equal in all parts of society.
Figure 1 shows how the CSR has varied over the four NDHSs by mother’s education. The sex ratios
shown are those experienced during the five years prior to each survey. Table 2 shows the CSR and
overall sex ratio before and after 2004 (when CAC services first became available), the percentage
change in the CSR and the significance of the fall using a one sided t-test. A dramatic decline in the sex
ratio is evident for those women who have at least a secondary leaving certificate or above. In the five
years before the NDHS 2006 the CSR for this group of women was just 653 females for every 1,000
males, and the NDHS 2011 showed a CSR of just 368, while the CSR was almost 50% lower after 2004.
The fall in the CSR after 2004 was significant at the 5% level for all educational groups except those
with no education.
Table 1: Conditional sex ratios at birth (females per 1000 males), by birth order, 1992-2010
Birth order All First born Second born
Sex of previous children
NA
NA first born male first born female
Year mean 95% CI n mean 95% CI n mean 95% CI n mean 95% CI n
1992-1994 975 (945 ,1007) 14963 964 (892 ,1041) 3642 1063 (949 ,1191) 1580 951 (852 ,1061) 1685
1995-1997 952 (920 ,985) 13050 878 (807 ,954) 3295 856 (760 ,963) 1474 967 (858 ,1090) 1439
1998-2000 973 (938 ,1009) 11553 920 (850 ,995) 3136 902 (799 ,1018) 1386 1021 (906 ,1150) 1340
2001-2003 928 (887 ,971) 7586 907 (812 ,1011) 2187 818 (688 ,969) 966 947 (810 ,1106) 968
2004-2006 962 (915 ,1012) 6044 975 (872 ,1090) 1864 971 (816 ,1157) 812 830 (702 ,978) 788
2007-2010 933 (880 ,989) 4521 1010 (907 ,1124) 1489 822 (689 ,979) 633 742 (599 ,913) 614
Birth order
Third born Fourth or above Sex of previous children both male both female one male, one female
NA
Year mean 95% CI n mean 95% CI n mean 95% CI n mean 95% CI n
1992-1994 811 (681 ,964) 662 1027 (864 ,1221) 719 984 (870 ,1113) 1327 963 (912 ,1016) 5348
1995-1997 922 (763 ,1112) 530 975 (814 ,1167) 640 1131 (995 ,1287) 1163 951 (897 ,1008) 4509
1998-2000 1005 (806,1254) 449 849 (699 ,1027) 553 954 (827 ,1099) 948 1011 (948 ,1078) 3741
2001-2003 933 (713,1218) 300 872 (689 ,1099) 392 888 (726 ,1084) 620 972 (893 ,1057) 2153
2004-2006 930 (650 ,1325) 198 846 (629 ,1130) 313 1041 (845 ,1282) 490 994 (900 ,1097) 1579
2007-2010 892 (637 ,1241) 169 767 (556 ,1046) 215 935 (707 ,1233) 372 1100 (973 ,1244) 1029

Figure 1: Conditional sex ratio of second order births where the first born was female, by educational level of the
mother, over time
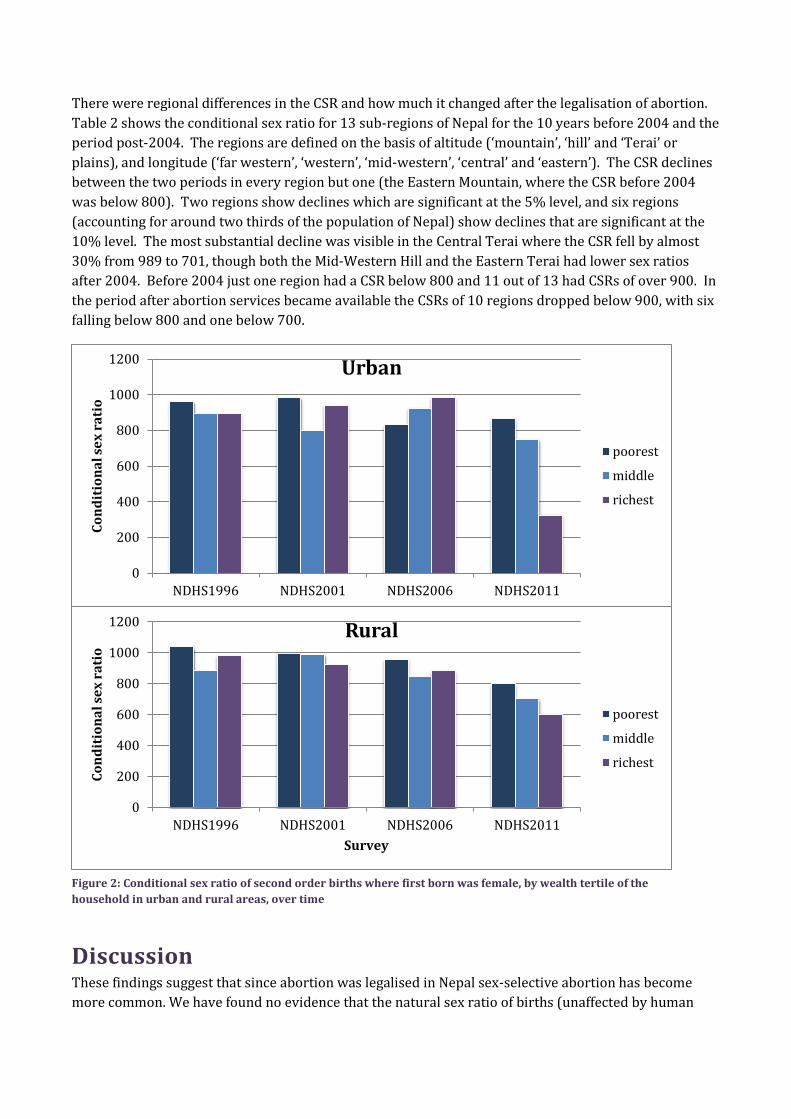
Figure 2 shows the same CSR split by wealth tertile in urban and rural areas for the five year period
before each NDHS. In the 2011 NDHS rural women in all wealth tertiles display lower sex ratios than
would be expected, with the sex ratio in all wealth groups below 800. A wealth gradient is visible, with
the richest women being least likely to have a girl, but it seems that even poorer women are finding
ways of manipulating the sex composition of their children. For urban women in the 2011 NDHS the
wealth gradient is dramatic, with the poorest urban women having a higher sex ratio than rural women,
but the richest urban women exhibiting the lowest sex ratio of all at just 326, indicating where sex-
selective abortion is likely to be most prevalent. That the CSR is lowest among richer urban women is
unsurprising, as they would be expected to be able to access abortion services most easily and have the
greatest knowledge about the availability of abortion services; that said, the extent of the shortfall in
female births is remarkable. Table 2 shows that the fall in the sex ratio was significant for all wealth
groups in rural areas, but only for the richest in urban areas. Nonetheless, the CSR post-2004 was
substantially less than 900 for all wealth groups of urban women.
0
200
400
600
800
1000
1200
1400
NDHS 1996 NDHS 2001 NDHS 2006 NDHS 2011
con
dit
ion
al s
ex r
atio
Survey
No education Primary or less Some Secondary SLC and above

Table 2: Conditional sex ratios of second order births where the first born was female and overall sex ratios, before and after the introduction of CAC services
1992-2003 2004-2010 % fall in
CSR Sig.
Overall
sex ratio n CSR n Overall
sex ratio n CSR n
Wealth of urban women Poorest 949 3963 956 952 953 1014 843 129 11.8
Middle 952 2789 915 772 971 749 864 139 5.6
Richest 943 1263 1019 480 872 279 794 57 22.1 *
Wealth of rural women
Poorest 990 13256 1074 2706 989 3642 911 544 15.2 *
Middle 954 15852 939 3657 912 2845 795 538 15.3 **
Richest 939 8811 916 2463 897 1476 786 330 14.2 †
Woman's education No education 956 34496 957 8758 988 5433 895 567 6.5
Primary or less 998 6539 1046 1517 937 2059 969 321 7.4 *
Some secondary 945 5416 958 1219 899 2598 730 440 23.8 **
SLC or above 991 699 1001 166 863 475 501 74 49.9 **
Region Eastern Mountain 978 2194 789 477 930 635 945 83 -19.8
Central Mountain 961 2330 1194 534 828 468 1011 53 15.4
Western Mountain 897 2953 901 591 965 863 833 101 7.5
Eastern Hill 1024 3310 1023 793 1002 855 792 120 22.6 †
Central Hill 925 4056 964 1207 996 701 761 112 21.0
Western Hill 969 4152 997 1136 1004 809 847 118 15.0
Mid-Western Hill 928 3485 869 737 867 945 691 99 20.5 †
Far-Western Hill 979 3356 1105 712 929 872 872 99 21.1
Eastern Terai 991 4557 911 1298 969 882 700 133 23.1 *
Central Terai 969 5823 989 1412 980 1113 701 139 29.1 †
Western Terai 941 3983 1023 992 964 821 1000 110 2.3
Mid-Western Terai 921 3370 1020 844 941 852 761 119 25.4 *
Far-Western Terai 1001 3583 956 928
923 749 835 116 12.6 †
NB: † p<0.1 * p<0.05 **p<0.01 ***p<0.001
0
200
400
600
800
1000
1200
NDHS1996 NDHS2001 NDHS2006 NDHS2011
Co
nd
itio
na
l se
x r
ati
o
Survey
Rural
poorest
middle
richest
0
200
400
600
800
1000
1200
NDHS1996 NDHS2001 NDHS2006 NDHS2011
Co
nd
itio
na
l se
x r
ati
o
Urban
poorest
middle
richest
There were regional differences in the CSR and how much it changed after the legalisation of abortion.
Table 2 shows the conditional sex ratio for 13 sub-regions of Nepal for the 10 years before 2004 and the
period post-2004. The regions are defined on the basis of altitude (‘mountain’, ‘hill’ and ‘Terai’ or
plains), and longitude (‘far western’, ‘western’, ‘mid-western’, ‘central’ and ‘eastern’). The CSR declines
between the two periods in every region but one (the Eastern Mountain, where the CSR before 2004
was below 800). Two regions show declines which are significant at the 5% level, and six regions
(accounting for around two thirds of the population of Nepal) show declines that are significant at the
10% level. The most substantial decline was visible in the Central Terai where the CSR fell by almost
30% from 989 to 701, though both the Mid-Western Hill and the Eastern Terai had lower sex ratios
after 2004. Before 2004 just one region had a CSR below 800 and 11 out of 13 had CSRs of over 900. In
the period after abortion services became available the CSRs of 10 regions dropped below 900, with six
falling below 800 and one below 700.
Discussion These findings suggest that since abortion was legalised in Nepal sex-selective abortion has become
more common. We have found no evidence that the natural sex ratio of births (unaffected by human
Figure 2: Conditional sex ratio of second order births where first born was female, by wealth tertile of the
household in urban and rural areas, over time

intervention) is outside the normal range for human populations; in particular the sex ratio of first-born
does not differ significantly from the expected level of 950-975 females per 1,000 males. However, for
second-born children, especially where the first-born was female, there has been a sharp (and
significant) fall in the number of girls compared with boys. The sex ratio of third-born children where
the first two were female has also fallen substantially in recent years, while for children of higher
parities the sex ratio remains within the expected range; this may indicate a tendency for those women
having more than four children not to use contraception or abortion services.26 Sex ratios of births are
lowest for richer, more educated women, especially in urban areas and differ substantially by parity and
the sex composition of previous children.
The data we have used were collected over the course of 16 years and include over 40,000 Nepali
women, but are still not sufficient to allow the identification of all the sub-populations experiencing low
sex ratios. Regional estimates of sex ratios were limited to relatively large areas. Census data may yet
prove fruitful for achieving a finer level of aggregation. The 2001 census indicated that no district had
an abnormal population sex ratio for infants. It will be interesting to find out if almost ten years after
abortion was legalised, the infant sex ratios in any particular districts show a decline. The survey data
analysed here indicates that this may well be the case, but it should be remembered that the extremely
low CSRs are masked by a relatively normal overall sex ratio at birth.
Apart from the fact that the results reported in this paper are based on a relatively small number of
births, some underreporting of girls in full birth histories is a possibility. However, it seems improbable
that the underreporting would be greater than average for second order and third order births, or
among rich, urban, or better educated women in more recent surveys.
Although we have been able to suggest that sex-selective abortion has increased in Nepal since 2004,
we have not been able to enumerate the size of the problem. It is hoped that census data will allow the
number of sex-selective abortions in recent years to be estimated. However, the CSR we report for
second order births where the first born was female is just 742, which is as low as the same CSRs found
in India, where sex-selective abortion is known to be widespread.1 23 It seems likely that sex-selective
abortion is becoming a more common phenomenon in Nepal, a trend which mirrors that in India and
China. Recent evidence from DHS data suggests that the proportion of pregnancies aborted increases
with birth order and is higher for urban, richer and better-educated women.19
The timing and abruptness of the change in CSRs suggests that it is associated with the legalisation of
abortion and the state provision of abortion services in the country. CAC services have only been
available since 2004, but in some regions the CSR of second-born children where the first born was
male has fallen by well over 200 in that time. However, we do not mean to suggest a simple
relationship between the introduction of CAC services and the change in the CSRs. It is more likely that
both demand and supply factors have been at work. The decline in fertility has increased the
importance that at least one son is born among the first three children. This has intensified the demand
for abortions on the grounds of the sex of the foetus. Before 2004, Nepali women desiring abortions
had to be prepared to incur either substantial health risks (from illegal services) or costs (from going to
India) or both. The effect of the introduction of CAC services in 2004 was to reduce both the risks and
the costs, and hence to increase the number of abortions in Nepal. The reduction in risks/costs applied
to all abortions, but since a major (and increasingly important) reason for demanding an abortion in
Nepal is the sex of the foetus there has been a rise in the number of abortions performed for this reason.
It is interesting to note that the change in the CSR for second births following a first-born girl was
greatest among urban educated women, who would have been most able to afford abortions even

before 2004. The decline in fertility has been most acute among this group; if cultural forces leading to
a strong desire for at least one son remain universal in Nepal, their demand for sex-selective abortions
may have increased more rapidly than that of rural and less well educated women.
Clearly there are policy implications in terms of education about the long term social and demographic
consequences of sex-selective abortion. While educating medical practitioners is one important step,
previous research has shown that medical practitioners believe that if a woman wishes to have a sex-
selective abortion she can easily obtain one in India; it may also be hard for practitioners to judge a
woman’s reasons for wanting an abortion.13 27 For these reasons it is also paramount to educate wider
members of the community about the illegality of sex determination tests for the sole purpose of
selective abortion and the health risks associated with second trimester abortions.
Advocacy and educational campaigns amongst groups with particularly low sex ratios will be
important; literate, urban women are one target group. Those living in the Terai with easy access to the
Indian border are another. It is also important to remember that the use of sex-selective abortion has
risen not only because of socio-cultural preferences for sons, but also because girls are seen as an
economic burden. Ultimately, combating sex-selective abortion will require the empowerment of
women throughout Nepali society. Programmes benefiting female children would be a start; these
might include maternity incentives to mothers who give birth to a girl, education scholarships and free
vocational training for girls, and economic incentives for the parents of girls.
References 1. Jha P, Kesler MA, Ram F, Ram U, Aleksandrowicz L, Bassani DG, et al. Trends in selective
abortions of girls in India: analysis of nationally representative birth histories from 1990
to 2005 and census data 1991 to 2011. Lancet 2011;377:1921-28.
2. Chan CI, Yip PS, Ng EH, Ho PC, Chan CH, Au JS. Gender selection in China: its meanings
and implications Journal of Assisted Reproduction and Genetics 2002;19:426-30.
3. Zhu WX, Lu L, Hesketh T. China's excess males, sex selective abortion, and one child policy:
analysis of data from 2005 national intercensus survey. BMJ 2009;338(b1211).
4. Hirve SS. Abortion law, policy and services in India: a critical review. Reproductive Health
Matters 2004;12(24):114-21.
5. Department of Economic and Social Affairs. Abortion Policies: A Global Review. New York:
United Nations, 2001:94-95.
6. Scharping T. Birth Control in China 1949-2000: Population Policy and Demographic
Development. Abingdon: Taylor and Francis, 2002.
7. Ministry of Health and Population, World Health Organization, Center for Research on
Environment Health and Population Activities (CREHPA). Unsafe Abortion: Nepal
Country Profile. Kathmandu: Ministry of Health and Population
Government of Nepal, 2006.
8. CREHPA. Management of Abortion Related Complications in Hospitals of Nepal - A
situational Analysis. Kathmandu: CREHPA, 1999.
9. Cleland J, Verall J, Vaessen M. Preferences for the Sex of Children and Their Influence on
Reproductive Behaviour, World Fertility Survey Comparative Studies. Voorburg,
Netherlands: International Statistical Institute, 1983.

10. Leone T, Matthews Z, Zuanna GD. Impacts and determinants of sex preference in Nepal.
International Family Planning Perspectives 2003;29(2):69-75.
11. Arnold F, Choe MK, Roy TK. Son Preference, the Family-building Process and Child
Mortality in India. Population Studies 1998;52(3):301-15.
12. Brunson J. Son Preference in the Context of Fertility Decline: Limits to New Constructions
of Gender and Kinship in Nepal. Studies in Family Planning 2010;41(2):89-98.
13. Lamichhane P, Harken T, Puri M, Darney PD, Blum M, Harper C, et al. Sex-Selective
Abortion in Nepal: A Qualitative Study of Health Workers' Perspectives. Women's
Health Issues 2011;21(3):37-41.
14. Adhikari N, Ghimire A, Ansari I. Sex preference in urban Nepal. Journal of Institute of
Medicine 2008;30(2):19-23.
15. Puri M, Adhikari R. A rapid assessment on sex ratio at birth with special reference to sex
selective abortion and infanticide. Lalitpur, Nepal: UNFPA and CREHPA, 2007.
16. CREHPA. Sex Selection: Pervasiveness and Preparedness in Nepal. 4th Asia Pacific
Conference on Reproductive and Sexual Health and Rights . Hyderabad, India, 2007.
17. Chahnazarian A, Blumberg B, London WT. Hepatitis B and the Sex Ratio at Birth: a
Comparative Analysis of Four Populations. Journal of Biosocial Science
1988;20(3):357-70.
18. Das Gupta M, Bhat PNM. Fertility Decline and Increased Manifestation of Sex Bias in
India. Population Studies 1997;51(3):307-15.
19. Ministry of Health and Population (MOHP) [Nepal], ERA N, INC. II. Nepal Demographic
and Health Survey 2011. Kathmandu, Nepal: Ministry of Health and Population, New
ERA, and ICF International, 2012.
20. Ministry of Health [Nepal], New ERA and ORC Macro. Nepal Demographic and Health
Survey 2001. Calverton, Maryland, USA: Family Health Division, Ministry of Health;
New ERA and ORC Macro, 2002.
21. Ministry of Health and Population (MOHP) [Nepal], New ERA and Macro International Inc.
Nepal Demographic and Health Survey 2006. Kathmandu, Nepal: Ministry of Health and
Population, New ERA and Macro International Inc., 2007.
22. Pradhan A, Aryal R, Regmi G, Ban B, Govindasamy P. Nepal Family Health Survey 1996.
Kathmandu, Nepal and Calverton, Maryland: Ministry of Health [Nepal], New ERA and
Macro International Inc., 1997.
23. Jha P, Kumar R, Vasa P, Dhingra N, Thiruchelvam D, Moineddin R. Low male-to-female
sex ratio of children born in India: national survey of 1.1 million households. The Lancet
2006;367:211-18.
24. Garenne M. Sex Ratios at Birth in African Populations: A Review of Survey Data. Human
Biology 2002;74(6):889-900.
25. Waldron I. Sex differences in human mortality: the role of genetic factors. Social Science
and Medicine 1983;17(6):321-33.
26. Dahal GP, Padmadas SS, Hinde PRA. Fertility-limiting behavior and contraceptive choice
among men in Nepal. International Family Planning Perspectives 2008:6-14.

27. Möller A, Öfverstedt S, Siwe K. Proud, not yet satisfied: the experiences of abortion service
providers in the Kathmandu valley, Nepal. Sexual and Reproductive Healthcare
2012;3(4):135-40.
Acknowledgements This work was done independently and there were no funding sources. The views expressed within this manuscript reflect those of the authors and do not necessarily reflect the views of any institution.
Dr. Andrew “Amos” Channon provided the wealth indices used within this paper.