Embed Size (px)
Citation preview

Fall Databook
2017
Jan 2018 uccs.edu/ir

Fall Databook | Institutional Research | Jan 2018
2 | P a g e
Contents Introduction .................................................................................................................................................................................................................. 4
Student Demographics ................................................................................................................................................................................................. 5
Career ....................................................................................................................................................................................................................... 5
College ..................................................................................................................................................................................................................... 5
Primary Degree-Granting Plan .................................................................................................................................................................................. 6
Class Level ............................................................................................................................................................................................................. 11
Full-Time Status ...................................................................................................................................................................................................... 12
Admit Types ............................................................................................................................................................................................................ 13
Residency ............................................................................................................................................................................................................... 14
Citizenship .............................................................................................................................................................................................................. 15
Country of Citizenship ............................................................................................................................................................................................. 15
Gender .................................................................................................................................................................................................................... 19
Ethnicity .................................................................................................................................................................................................................. 20
Age ......................................................................................................................................................................................................................... 21
Home State ............................................................................................................................................................................................................. 21
Athletics .................................................................................................................................................................................................................. 23
Military Affiliation ..................................................................................................................................................................................................... 24
Online Instruction .................................................................................................................................................................................................... 25
First Generation Status ........................................................................................................................................................................................... 25
Pell Recipients ........................................................................................................................................................................................................ 26
Student Persistence & Performance .......................................................................................................................................................................... 27
Admissions Index & Test Scores ............................................................................................................................................................................ 27
Undergraduate Persistence .................................................................................................................................................................................... 27
Graduation Rates .................................................................................................................................................................................................... 28
Grade Point Averages ............................................................................................................................................................................................ 28
Fall Databook | Institutional Research | Jan 2018
3 | P a g e
Degrees Conferred ................................................................................................................................................................................................. 29
Academic Instruction & Credit Hours .......................................................................................................................................................................... 33
Instruction Mode ..................................................................................................................................................................................................... 33
Session ................................................................................................................................................................................................................... 34
Class Sizes ............................................................................................................................................................................................................. 35
Credit Hour Matrix ................................................................................................................................................................................................... 36
Institutions Attended ................................................................................................................................................................................................... 38
Transfer Credit Institutions ...................................................................................................................................................................................... 38
High Schools ........................................................................................................................................................................................................... 40

Fall Databook | Institutional Research | Jan 2018
4 | P a g e
Introduction The Fall Databook reflects data extracted from the Integrated Student Information System (ISIS) at different points in time.
• The Fall Census Snapshot is taken within a few days of the last day students can drop courses or withdraw for a 100% refund and has usually been within the second week of September.
• The Fall End-of-Term Snapshot data are frozen several weeks after the end of the semester, usually in early January, which is expected to be enough time for final grades to have been reported to Student Records.
• Data extracted from the Campus Solutions Warehouse are specific to the day of the extraction and will differ from census or end-of-term snapshots.
Read the notes for each table to determine the point of time of the extraction. The Fall Databook will be updated in September and February, with
the last update noted in the header and in the data labels shown within the tables.
Data items are included based on the frequency of requests from campus constituents. The Fall Databook is not comprehensive nor does it reflect
all the data on hand nor all the reporting handled by Institutional Research or other offices. Contact Institutional Research directly if you have
additional data requests or questions.
Please visit our website at www.uccs.edu/ir.
Thank you,
Robyn Marschke, Ph.D.
Director of Institutional Research
University of Colorado Colorado Springs
719-255-3640 | [email protected] | www.uccs.edu/ir
Fall Databook | Institutional Research | Jan 2018
5 | P a g e
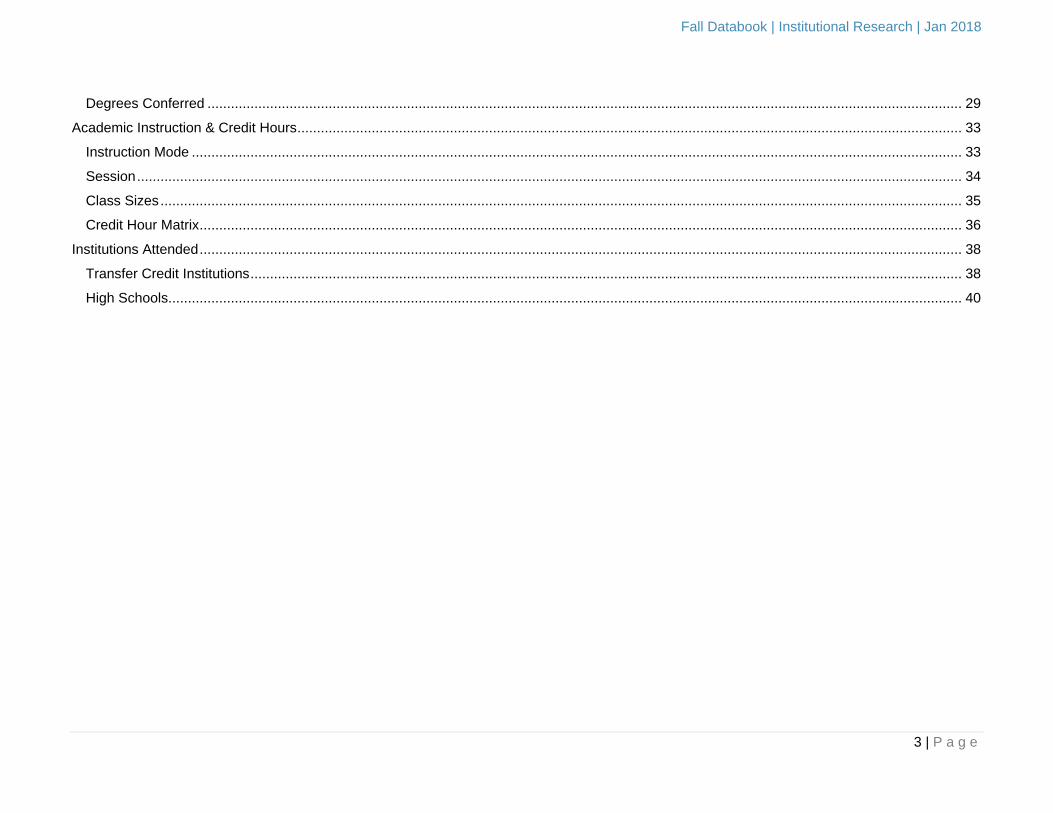
Student Demographics Career A student career may be categorized as Undergraduate, Graduate, or Non-Degree Graduate. The non-degree graduate career houses students
who are taking graduate-level courses but are not seeking a master’s or doctoral degree; for example, they might be seeking a certificate or
licensure or simply taking continuing education courses.
2013 Census
2013 EOT
2014 Census
2014 EOT
2015 Census
2015 EOT
2016 Census
2016 EOT
2017 Census
2017 EOT
GRAD 1537 1547 1602 1611 1553 1561 1666 1684 1822 1832
NDGR 190 190 151 151 128 127 142 145 163 164
UGRD 8871 8882 9379 9385 9618 9607 10187 10188 10437 10439
Total 10598 10619 11132 11147 11299 11295 11995 12017 12422 12435
College A student’s college is that which manages the degree plan. The proper name of each college is abbreviated in the table.
2013 Census
2013 EOT
2014 Census
2014 EOT
2015 Census
2015 EOT
2016 Census
2016 EOT
2017 Census
2017 EOT
GRAD 1531 1541 1600 1609 1551 1561 1661 1679 1822 1829
BUSN 280 280 275 275 262 262 305 305 332 332
CLAS 242 246 263 267 250 253 249 253 245 248
EDUC 438 442 452 455 424 425 389 400 469 472
ENGR 273 275 302 304 281 286 292 296 316 319
NURS 177 177 187 187 202 202 262 261 275 275
PAFF 121 121 121 121 132 131 164 164 182 183
UGRD 8778 8797 9267 9269 9491 10110 10437 10366
BUSN 1073 1073 1167 1169 1186 1186 1263 1261 1277 1278

Fall Databook | Institutional Research | Jan 2018
6 | P a g e
CLAS 5449 5463 5493 5496 5379 5372 5634 5634 5718 5725
EDUC 35 36 84 84 99 99 234 234 329 329
ENGR 802 804 1026 1023 1302 1302 1366 1369 1408 1406
NURS 1034 1035 1080 1079 1106 1106 1158 1162 1155 1155
PAFF 385 386 417 418 419 418 455 456 473 473
NDGR & OTHER 289 281 265 269 257 251 224 222 243 240
Total 10598 10619 11132 11147 11299 11295 11995 12017 12422 12435
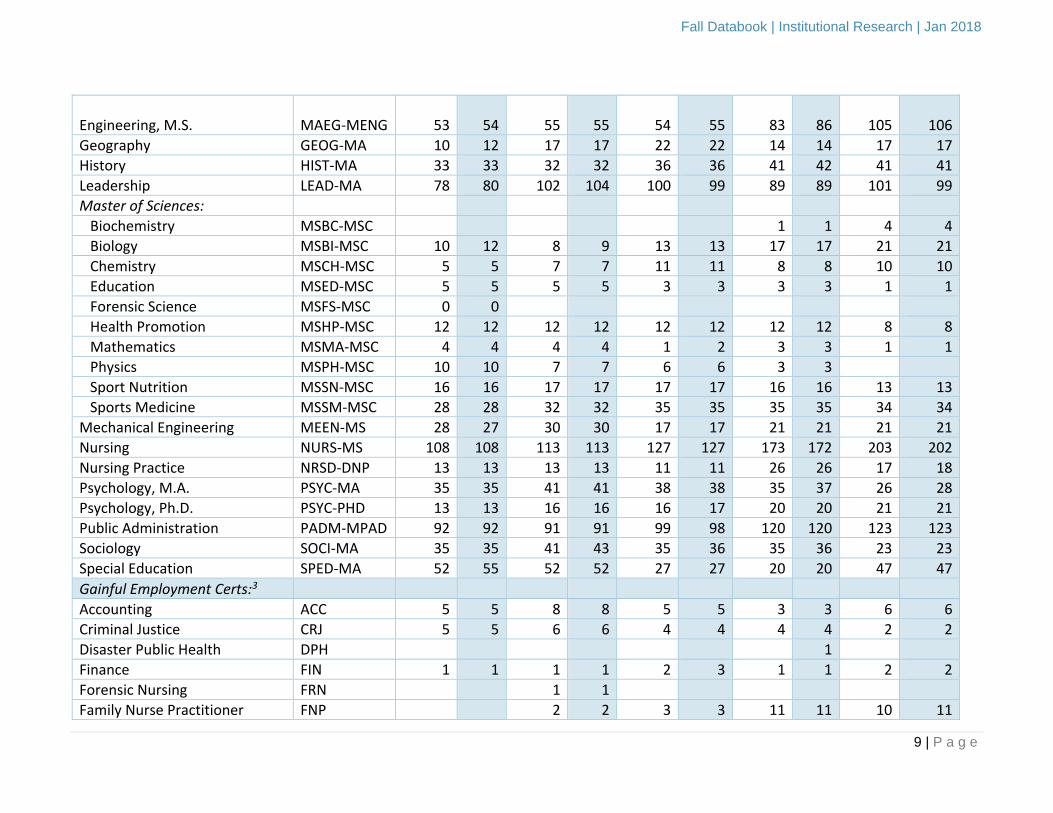
Primary Degree-Granting Plan Students may have more than one academic plan and to avoid counting them more than once, only degree-granting primary plans are shown
here. For a more exhaustive report including all primary plans, please see the Enrollment section of the IR website. For a list of state-approved
degree programs refer to http://www.uccs.edu/ir/academic-programs/degrees.html.
Description Code 2013
Census 2013 EOT
2014 Census
2014 EOT
2015 Census
2015 EOT
2016 Census
2016 EOT
2017 Census
2017 EOT
UGRD
Anthropology ANTH-BA 102 102 98 96 75 75 68 69 61 61
Biochemistry, B.A. BCBA-BA 9 9 29 29 35 35 35 35 39 39
Biochemistry, B.S. BCBS-BS 68 68 76 76 83 83 94 95 86 86
Biology, B.A. BIOL-BA 70 71 63 63 52 52 43 43 41 41
Biology, B.S. BLBS-BS 630 632 634 637 693 693 703 704 717 718
Business Administration:1
Accounting ACCT-BSBU 150 150 154 154 185 184 185 183 168 167
Business Administration BUAD-BSBU 125 126 126 126 143 144 128 131 135 135
Business Innovation2 XXXX-BI 50 50 67 67 78 79 92 92 108 109
Finance FNCE-BSBU 100 100 128 129 151 151 152 150 146 146
Human Resource Mgmt HRMG-BSBU 30 30 37 37 41 41 42 42 45 46
Information Systems INFS-BSBU 33 33 38 38 41 41 47 47 64 64
International Business INTB-BSBU 41 41 51 51 57 58 44 44 50 50
Management MGMT-BSBU 98 99 111 111 107 106 122 122 139 140

Fall Databook | Institutional Research | Jan 2018
7 | P a g e
Marketing MKTG-BSBU 147 147 141 142 139 140 122 122 97 97
Organizational Mgmt ORMG-BSBU 1 1
Service Management SVMG-BSBU 11 11 19 19 9 9 14 14 10 10
Sport Management SPTM-BSBU 106 106 123 122 118 118 137 136 171 171
Chemistry, B.A. CHEM-BA 38 40 35 35 31 28 22 22 15 16
Chemistry, B.I. BICH-BI 1 1 2 2
Chemistry, B.S. CMBS-BS 74 73 60 60 53 53 62 62 61 61
Communication, B.A. COMM-BA 491 493 496 497 506 507 501 501 479 477
Communication (Digital Film.) BIDF-BI 7 7 17 17
Computer Engineering CPEN-BS 59 59 80 78 129 130 117 117 110 109
Computer Security BISC-BI 20 20 32 31 60 60 56 56 72 72
Computer Science, B.I. BICS-BI 26 26 37 36 61 61 61 61 74 74
Computer Science, B.S. CSCI-BS 168 168 209 209 252 252 260 261 271 272
Criminal Justice CRJU-BA 384 386 417 418 419 418 455 456 473 473
Data Analytics & Systems Engr DASE-BS 5 5
Data Analytics & Systems Engr BIDA-BI 1 1
Distributive Studies DIST-BA 3 3 3 3 3 3 2 2 1 1
Economics ECON-BA 48 47 71 72 93 94 95 94 108 106
Electrical Engineering, B.I. BIEL-BI 10 10 9 11 12 12 14 14 8 8
Electrical Engineering, B.S. ELEN-BS 121 122 142 143 174 173 184 185 184 184
Engineering Education BSEE-BS 2 2 10 10 9 9
English ENGL-BA 333 333 312 315 336 335 298 298 295 295
Exercise Science EXSC-BS 108 108 169 168
Game Design & Dev. BIGD-BI 45 45 70 71 106 106 118 118 115 114
Geography/Enviro Studies GEEV-BA 250 250 236 237 232 232 237 238 221 221
Health Care Science HCSC-BS 457 458 502 503 488 488 390 391 304 304
History HIST-BA 273 273 238 239 217 216 180 179 174 174
Inclusive Early Childhood Ed. BICE-BI, EDBI 38 38 58 58 73 73 77 77
Inclusive Elementary Ed. IELM-BA 121 121 209 208
Mathematics, BA MTBA-BA 54 54 52 51 60 60 50 50 16 16
Mathematics, BS MTBS-BS 51 52 42 41 49 49 84 85 88 87

Fall Databook | Institutional Research | Jan 2018
8 | P a g e
Mechanical Engineering MEEN-BS 328 329 410 408 473 473 525 526 543 542
Nursing NURS-BS 348 348 377 376 430 430 455 457 422 424
Philosophy PHIL-BA 65 64 48 49 54 54 59 58 61 61
Physics/Energy Science, B.S. PHES-BS 71 72 81 81 91 92 102 101 91 92
Political Science PSCI-BA 127 128 115 114 122 121 123 122 126 128
Psychology PSYC-BA 599 602 599 600 613 610 659 658 671 672
Sociology SOCI-BA 141 141 155 156 146 147 136 136 139 140
Spanish SPAN-BA 44 44 37 37 38 38 49 49 35 36
Visual & Performing Arts VAPA-BA 213 215 219 219 227 223 212 212 217 221
VAPA – Museum Stdy. BIGM-BI 3 3 7 7
VAPA – Music BIMU-BI 1 1 13
Women's & Ethnic Studies WEST-BA 19 19 19 19 14 14 12 12 15 16
Women’s & Ethnic Studies, B.I. BIWE-BI 6 6 7 7
GRAD
Accounting MACC-MSA 6 6 18 18 20 20
Applied Mathematics AMTH-MS 8 8 17 17 12 11 12 12 16 16
Applied Science - Math ASMT-PHD 3 3 4 4 7 7 7 7 10 10
Applied Science - Physics ASPY-PHD 26 27 25 26 25 26 28 28 30 31
Business Administration MBAD-MBA 230 230 225 225 206 206 198 198 190 190
Business Administration (2) MBAE-MBA 46 46 48 48 50 50 89 89 122 122
Communication COMM-MA 50 49 44 44 28 28 25 25 25 25
Computer Science, M.S. CSCI-MS 61 60 70 70 65 65 51 53 57 58
Computer Science, Ph.D. CSCI-PHD 1 1
Counseling & Human Services COUN-MA 136 136 124 124 124 124 117 117 109 109
Criminal Justice CRJU-MCJ 29 29 30 30 33 33 44 44 59 60
Curriculum & Instruction CURR/TESL-MA 107 104 95 94 89 89
76
77 74 74
Educational Leadership LERP-PHD 48 50 51 54 57 58 52 54 48 50
Electrical Engineering, M.S. ELEN-MS 43 44 49 50 53 53 45 47 38 39
Electrical Engineering, Ph.D. ELEN-PHD 0 0
Engineering, Ph.D. ENGR-PHD 86 87 98 99 92 96 91 89 95 95
Fall Databook | Institutional Research | Jan 2018
9 | P a g e
Engineering, M.S. MAEG-MENG 53 54 55 55 54 55
83
86 105 106
Geography GEOG-MA 10 12 17 17 22 22 14 14 17 17
History HIST-MA 33 33 32 32 36 36 41 42 41 41
Leadership LEAD-MA 78 80 102 104 100 99 89 89 101 99
Master of Sciences:
Biochemistry MSBC-MSC 1 1 4 4
Biology MSBI-MSC 10 12 8 9 13 13 17 17 21 21
Chemistry MSCH-MSC 5 5 7 7 11 11 8 8 10 10
Education MSED-MSC 5 5 5 5 3 3 3 3 1 1
Forensic Science MSFS-MSC 0 0
Health Promotion MSHP-MSC 12 12 12 12 12 12 12 12 8 8
Mathematics MSMA-MSC 4 4 4 4 1 2 3 3 1 1
Physics MSPH-MSC 10 10 7 7 6 6 3 3
Sport Nutrition MSSN-MSC 16 16 17 17 17 17 16 16 13 13
Sports Medicine MSSM-MSC 28 28 32 32 35 35 35 35 34 34
Mechanical Engineering MEEN-MS 28 27 30 30 17 17 21 21 21 21
Nursing NURS-MS 108 108 113 113 127 127 173 172 203 202
Nursing Practice NRSD-DNP 13 13 13 13 11 11 26 26 17 18
Psychology, M.A. PSYC-MA 35 35 41 41 38 38 35 37 26 28
Psychology, Ph.D. PSYC-PHD 13 13 16 16 16 17 20 20 21 21
Public Administration PADM-MPAD 92 92 91 91 99 98 120 120 123 123
Sociology SOCI-MA 35 35 41 43 35 36 35 36 23 23
Special Education SPED-MA 52 55 52 52 27 27 20 20 47 47
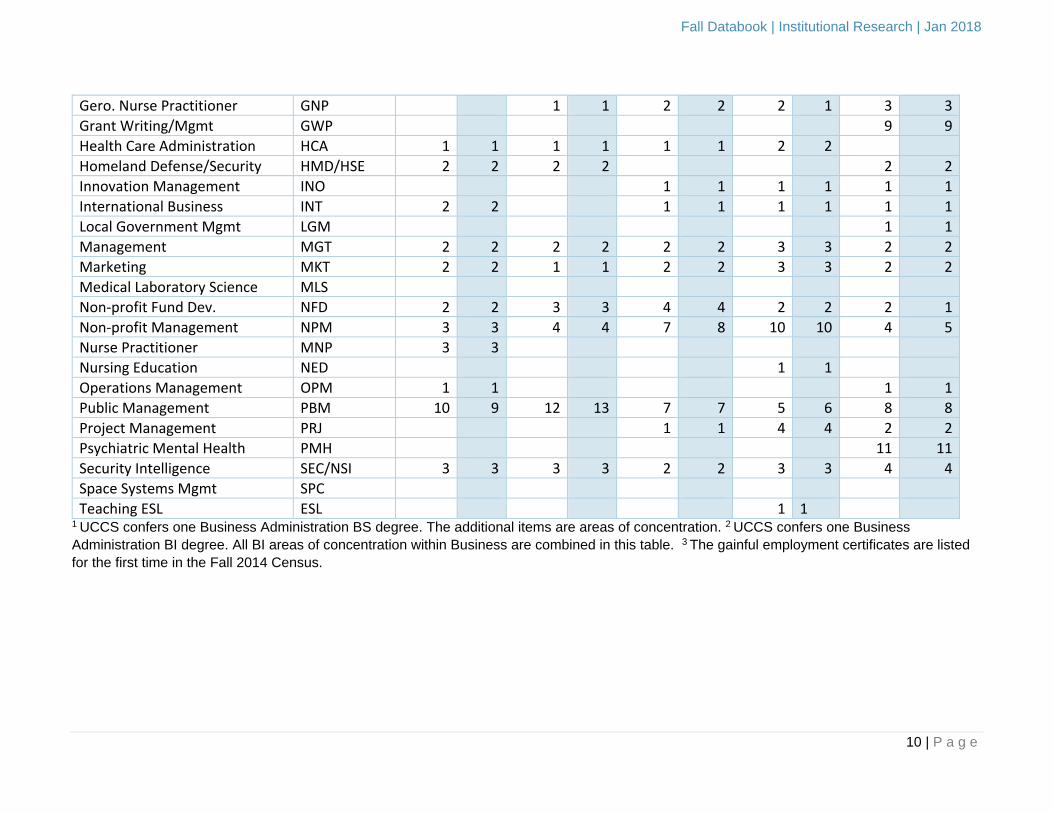
Gainful Employment Certs:3
Accounting ACC 5 5 8 8 5 5 3 3 6 6
Criminal Justice CRJ 5 5 6 6 4 4 4 4 2 2
Disaster Public Health DPH 1
Finance FIN 1 1 1 1 2 3 1 1 2 2
Forensic Nursing FRN 1 1
Family Nurse Practitioner FNP 2 2 3 3 11 11 10 11
Fall Databook | Institutional Research | Jan 2018
10 | P a g e
Gero. Nurse Practitioner GNP 1 1 2 2 2 1 3 3
Grant Writing/Mgmt GWP 9 9
Health Care Administration HCA 1 1 1 1 1 1 2 2
Homeland Defense/Security HMD/HSE 2 2 2 2 2 2
Innovation Management INO 1 1 1 1 1 1
International Business INT 2 2 1 1 1 1 1 1
Local Government Mgmt LGM 1 1
Management MGT 2 2 2 2 2 2 3 3 2 2
Marketing MKT 2 2 1 1 2 2 3 3 2 2
Medical Laboratory Science MLS
Non-profit Fund Dev. NFD 2 2 3 3 4 4 2 2 2 1
Non-profit Management NPM 3 3 4 4 7 8 10 10 4 5
Nurse Practitioner MNP 3 3
Nursing Education NED 1 1
Operations Management OPM 1 1 1 1
Public Management PBM 10 9 12 13 7 7 5 6 8 8
Project Management PRJ 1 1 4 4 2 2
Psychiatric Mental Health PMH 11 11
Security Intelligence SEC/NSI 3 3 3 3 2 2 3 3 4 4
Space Systems Mgmt SPC
Teaching ESL ESL 1 1 1 UCCS confers one Business Administration BS degree. The additional items are areas of concentration. 2 UCCS confers one Business
Administration BI degree. All BI areas of concentration within Business are combined in this table. 3 The gainful employment certificates are listed
for the first time in the Fall 2014 Census.
Fall Databook | Institutional Research | Jan 2018
11 | P a g e
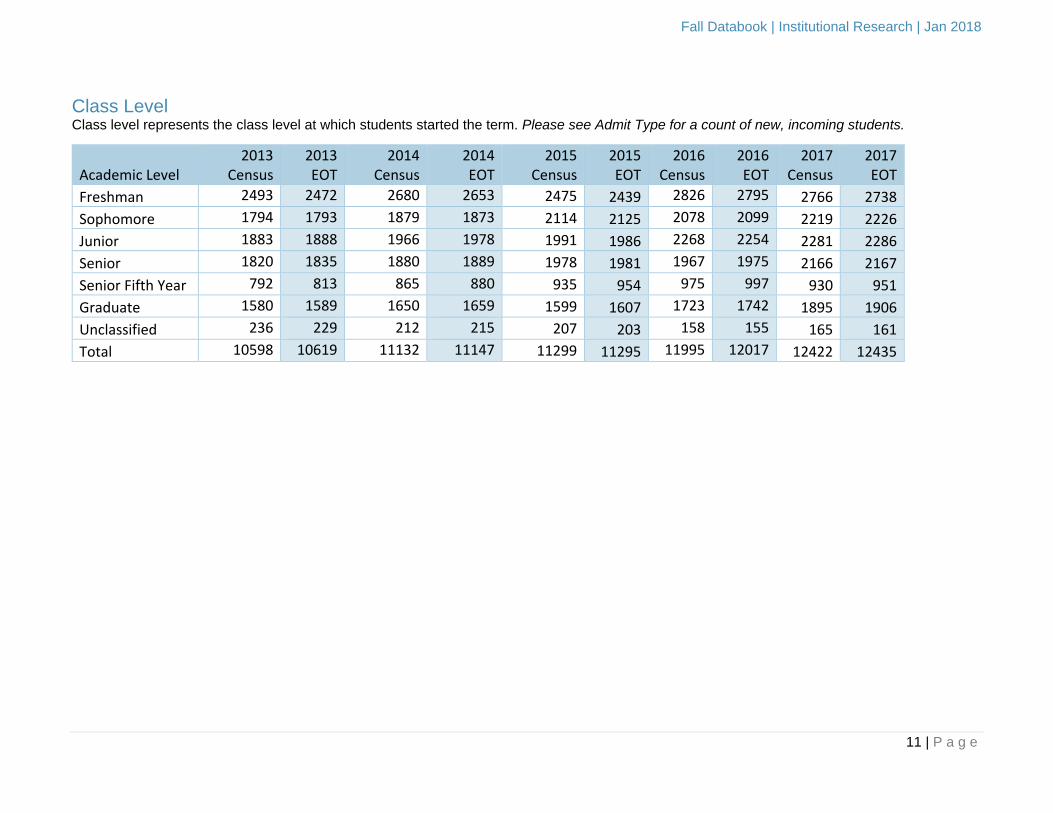
Class Level Class level represents the class level at which students started the term. Please see Admit Type for a count of new, incoming students.
Academic Level 2013
Census 2013 EOT
2014 Census
2014 EOT
2015 Census
2015 EOT
2016 Census
2016 EOT
2017 Census
2017 EOT
Freshman 2493 2472 2680 2653 2475 2439 2826 2795 2766 2738
Sophomore 1794 1793 1879 1873 2114 2125 2078 2099 2219 2226
Junior 1883 1888 1966 1978 1991 1986 2268 2254 2281 2286
Senior 1820 1835 1880 1889 1978 1981 1967 1975 2166 2167
Senior Fifth Year 792 813 865 880 935 954 975 997 930 951
Graduate 1580 1589 1650 1659 1599 1607 1723 1742 1895 1906
Unclassified 236 229 212 215 207 203 158 155 165 161
Total 10598 10619 11132 11147 11299 11295 11995 12017 12422 12435
Fall Databook | Institutional Research | Jan 2018
12 | P a g e
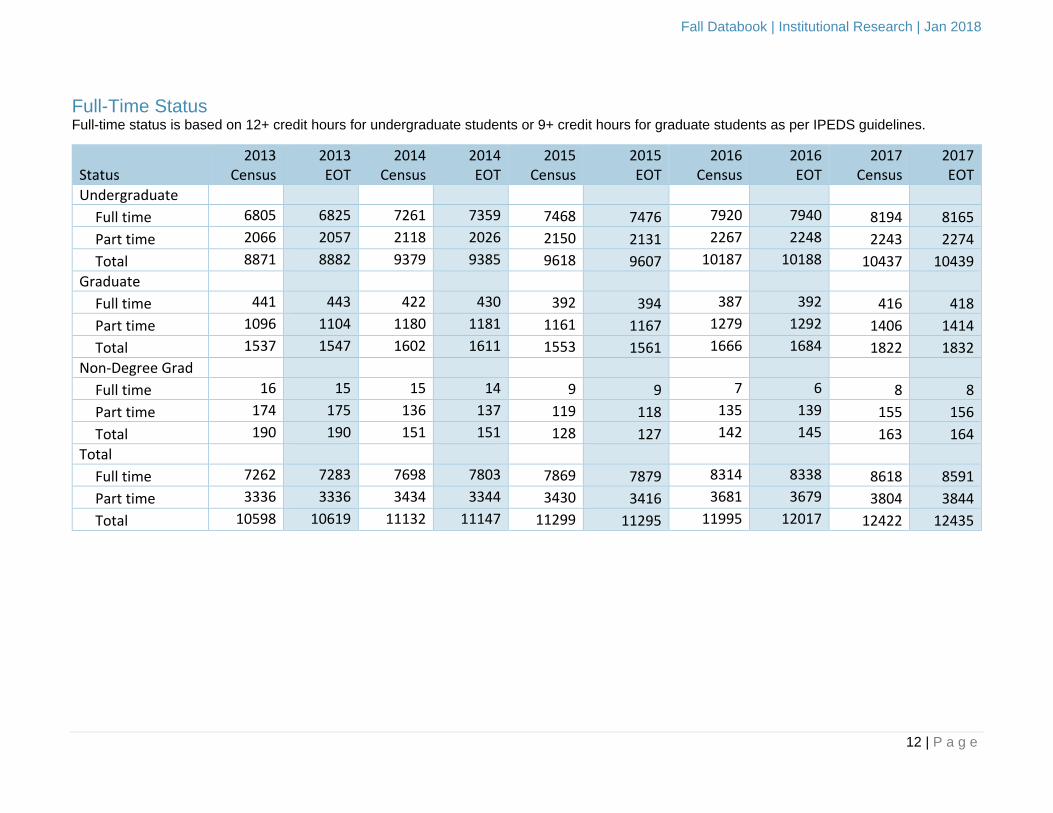
Full-Time Status Full-time status is based on 12+ credit hours for undergraduate students or 9+ credit hours for graduate students as per IPEDS guidelines.
Status 2013
Census 2013 EOT
2014 Census
2014 EOT
2015 Census
2015 EOT
2016 Census
2016 EOT
2017 Census
2017 EOT
Undergraduate
Full time 6805 6825 7261 7359 7468 7476 7920 7940 8194 8165
Part time 2066 2057 2118 2026 2150 2131 2267 2248 2243 2274
Total 8871 8882 9379 9385 9618 9607 10187 10188 10437 10439
Graduate
Full time 441 443 422 430 392 394 387 392 416 418
Part time 1096 1104 1180 1181 1161 1167 1279 1292 1406 1414
Total 1537 1547 1602 1611 1553 1561 1666 1684 1822 1832
Non-Degree Grad
Full time 16 15 15 14 9 9 7 6 8 8
Part time 174 175 136 137 119 118 135 139 155 156
Total 190 190 151 151 128 127 142 145 163 164
Total
Full time 7262 7283 7698 7803 7869 7879 8314 8338 8618 8591
Part time 3336 3336 3434 3344 3430 3416 3681 3679 3804 3844
Total 10598 10619 11132 11147 11299 11295 11995 12017 12422 12435

Fall Databook | Institutional Research | Jan 2018
13 | P a g e
Admit Types Students newly admitted to UCCS for the term will have an Admit Type determined by the Admissions Office. Students who entered in prior terms
are shown as Continuing.
Group 2013
Census 2013 EOT
2014 Census
2014 EOT
2015 Census
2015 EOT
2016 Census
2016 EOT
2017 Census
2017 EOT
Freshman 1582 1580 1724 1722 1638 1632 2056 2052 2020 2016
Master's 334 336 348 351 293 294 331 336 489 489
Doctorate 45 46 43 43 37 38 43 43 45 47
Readmit 89 97 100 101 96 93 75 76 82 80
Nondegree 155 156 168 176 150 151 149 152 159 160
Transfer 1082 1083 1074 1070 946 945 1110 1107 1077 1078
Continuing 7303 7321 7675 7684 8139 8142 8231 8251 8550 8565
Total 10598 10619 11132 11147 11299 11295 11995 12017 12422 12435

Fall Databook | Institutional Research | Jan 2018
14 | P a g e
Residency There are several types of residencies and residency exceptions. This table shows Tuition Residency and Tuition Residency Exceptions.
Tuition Residency 2013
Census 2013 EOT
2014 Census
2014 EOT
2015 Census
2015 EOT
2016 Census
2016 EOT
2017 Census
2017 EOT
Non-Resident 1187 1176 1408 1396 1378 1368 1597 1586 1749 1732
Asset Pending 3 2 3 2
Exchange Agreement 14 14 17 16
Nonresident 765 756 969 956 923 911 936 928 975 961
Online 4 4 7 7 15 15 145 144 197 196
Pres. Scholar 21 21 20 20 23 23 34 33 47 47
Pres. Scholar Athlete 6 6 9 9 10 10 17 17 28 28
WUE 391 389 403 404 407 409 448 448 482 482
Resident 9376 9442 9666 9747 9852 9907 10283 10413 10612 10695
Resident 8629 8681 8754 8822 8821 8862 9162 9267 9508 9561
Active Duty Deps. 7 7 18 18
Active Duty Permanent 442 448 466 473 471 476 442 448 388 394
Asset 13 15 23 22 24 24 28 29 30 30
Canadian Military 2 2 1 1 2 2 3 3
Colorado Natl Guard 3 3 5 5 8 7 7 7 2 3
Dependents 10-12 Yr 19 19 26 28 21 21
Economic Incentive 1 1 1 1 4 4
Exchange Agreement 3 3 7 7 6 6 9 9 5 4
Hon. Discharged Vet 220 224 266 272 288 293 292 296 278 287
Hon. Disch. Vet Deps. 5 5 7 7 8 8 7 7 5 5
Olympic Athlete 25 26 21 20 18 18 16 17 16 16
Online 23 24 80 82 150 151 199 203 207 210
Vet Deps Choice Act 15 19 74 80 124 136
West Region Grad 4 4 18 18 23 23 18 19 21 21
Extended Studies 2 1 4 3 2 0 1 1 3
Exchange (no tuition) 18 18
Fall Databook | Institutional Research | Jan 2018
15 | P a g e
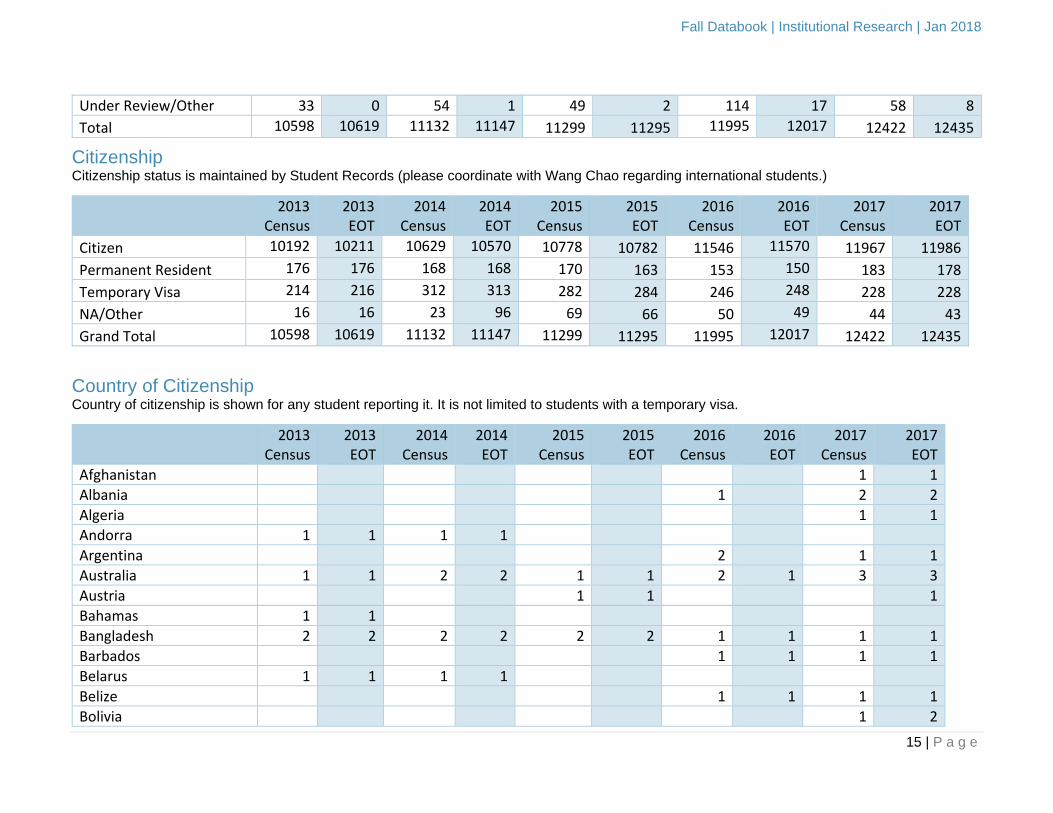
Under Review/Other 33 0 54 1 49 2 114 17 58 8
Total 10598 10619 11132 11147 11299 11295 11995 12017 12422 12435
Citizenship Citizenship status is maintained by Student Records (please coordinate with Wang Chao regarding international students.)
2013 Census
2013 EOT
2014 Census
2014 EOT
2015 Census
2015 EOT
2016 Census
2016 EOT
2017 Census
2017 EOT
Citizen 10192 10211 10629 10570 10778 10782 11546 11570 11967 11986
Permanent Resident 176 176 168 168 170 163 153 150 183 178
Temporary Visa 214 216 312 313 282 284 246 248 228 228
NA/Other 16 16 23 96 69 66 50 49 44 43
Grand Total 10598 10619 11132 11147 11299 11295 11995 12017 12422 12435
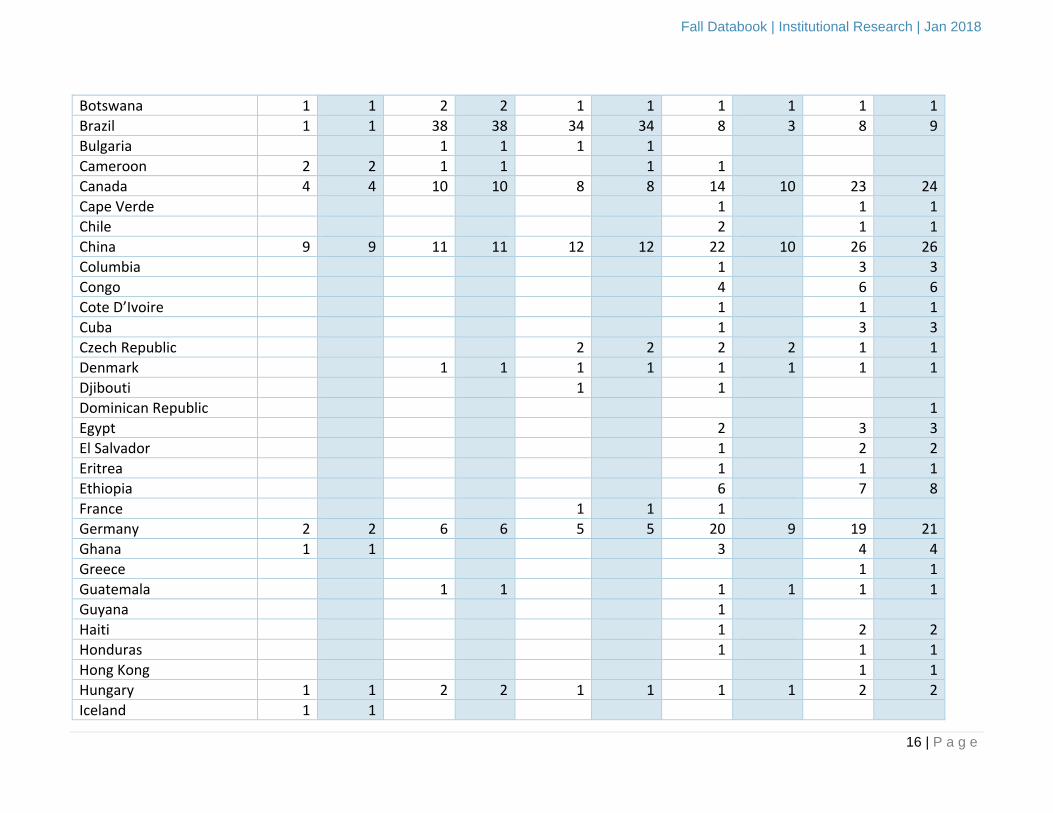
Country of Citizenship Country of citizenship is shown for any student reporting it. It is not limited to students with a temporary visa.
2013
Census 2013 EOT
2014 Census
2014 EOT
2015 Census
2015 EOT
2016 Census
2016 EOT
2017 Census
2017 EOT
Afghanistan 1 1
Albania 1 2 2
Algeria 1 1
Andorra 1 1 1 1
Argentina 2 1 1
Australia 1 1 2 2 1 1 2 1 3 3
Austria 1 1 1
Bahamas 1 1
Bangladesh 2 2 2 2 2 2 1 1 1 1
Barbados 1 1 1 1
Belarus 1 1 1 1
Belize 1 1 1 1
Bolivia 1 2
Fall Databook | Institutional Research | Jan 2018
16 | P a g e
Botswana 1 1 2 2 1 1 1 1 1 1
Brazil 1 1 38 38 34 34 8 3 8 9
Bulgaria
1 1 1 1
Cameroon 2 2 1 1 1 1
Canada 4 4 10 10 8 8 14 10 23 24
Cape Verde 1 1 1
Chile 2 1 1
China 9 9 11 11 12 12 22 10 26 26
Columbia 1 3 3
Congo 4 6 6
Cote D’Ivoire 1 1 1
Cuba 1 3 3
Czech Republic 2 2 2 2 1 1
Denmark
1 1 1 1 1 1 1 1
Djibouti 1 1
Dominican Republic 1
Egypt 2 3 3
El Salvador
1 2 2
Eritrea 1 1 1
Ethiopia 6 7 8
France
1 1 1
Germany 2 2 6 6 5 5 20 9 19 21
Ghana 1 1
3 4 4
Greece 1 1
Guatemala
1 1 1 1 1 1
Guyana 1
Haiti 1 2 2
Honduras
1 1 1
Hong Kong 1 1
Hungary 1 1 2 2 1 1 1 1 2 2
Iceland 1 1

Fall Databook | Institutional Research | Jan 2018
17 | P a g e
India 25 26 49 49 46 46 51 42 57 57
Indonesia
1 1 1 1 3 3 4 4
Iran
1 1 2 2 6 3 9 9
Iraq 4 4 7 4 6 5
Ireland 1 1 1 1
Italy 1 1
2 2 2
Jamaica 3 1 2 2
Japan
2 2 2 2 4 4 4
Jordan 2 2
Kazakhstan 1 1 1 1 1 1 1 1
Kenya 1 1 2 2 2 2 7 1 4 4
Korea, Dem.People’s Rep 1 1
Korea, Republic of 6 6 5 5 5 5 14 2 17 17
Kuwait
1 1 4 4 10 9 9 9
Latvia 1 1 1 1 2 2 2
Lebanon 2 1 2 2
Libya
12 12 13 13 11 12 4 4
Libyan Arab Jamahiriya 11 11
Mexico 3 3 3 3 42 1 46 47
Mongolia 2 1 1 1
Morocco 1 1 2 1 1 1
Nepal 1 1
5 8 8
Netherlands
1 1 1 1 2 2 1 1
New Zealand 1 1 1 1 1 1 1
Nigeria
1 1 1 1 5 2 5 5
Norway 2 2 2 2
Oman
1 1
Panama 2 3 3
Peru 2 2 2
Philippines 3 11 12
Poland
1 1 2 2 3 1 3 3

Fall Databook | Institutional Research | Jan 2018
18 | P a g e
Qatar 2 2
1 1 1 1
Romania 1 1 1 1 1 1
Russian Federation
1 1 1 1 3 1 2 2
Rwanda 1
Saudi Arabia 114 114 123 124 99 101 81 83 60 60
Senegal
1
1 2 2
Seychelles 1 1
Singapore
2 2 2 2 2 2 1 1
South Africa 1 1 2 2 1 1 1 1 1 1
Spain 1 1 4 4 7 7 14 12 13 13
Sri Lanka 1 1 1 1 1 1 2 2
Sudan 1
Sweden 1 1 2 2 3 3 5 3 3 3
Switzerland 1 1
Syria 1 1
Taiwan 3 3 2 2 2 2 3 3 3 3
Thailand 1 1
1 1 1
Tonga 1 1 1
Tunisia 1
Turkey 1 1
Uganda 1 1 1 1
Ukraine 2 2 2 2 2 2 2 2 4 4
United Arab Emirates
United Kingdom 2 2 2 2 7 3 11 12
Uruguay 1 1
Uzbekistan 1 1 1
Venezuela 2 2 3 3 1 1 2 1 1 1
Viet Nam 2 2 4 4 3 3 8 2 12 12
Yugoslavia
1 1 1 1
Zimbabwe 1 1 1

Fall Databook | Institutional Research | Jan 2018
19 | P a g e
Gender Gender is self-reported. For IPEDS reporting, we must assign unknowns to male or female and we do so by student’s name.
Career 2013
Census 2013 EOT
2014 Census
2014 EOT
2015 Census
2015 EOT
2016 Census
2016 EOT
2017 Census
2017 EOT
Female
Undergraduate 4712 4714 4904 4910 4958 4951 5298 5300 5425 5431
Graduate 814 820 863 865 836 839 905 914 1012 1015
Graduate Non-degree 121 120 83 87 74 73 79 81 100 99
Total, Female 5647 5654 5850 5862 5868 5863 6282 6295 6537 6545
Male
Undergraduate 4159 4168 4470 4475 4649 4647 4878 4877 5005 5002
Graduate 723 727 736 746 709 714 748 757 797 803
Graduate Non-degree 69 70 61 64 52 52 60 62 63 63
Total, Male 4951 4965 5267 5285 5410 5413 5686 5696 5865 5868
Unknown 0 0 15 0 21 19 27 26 20 22
Total 10598 10619 11132 11147 11299 11295 11995 12017 12422 12435
Fall Databook | Institutional Research | Jan 2018
20 | P a g e
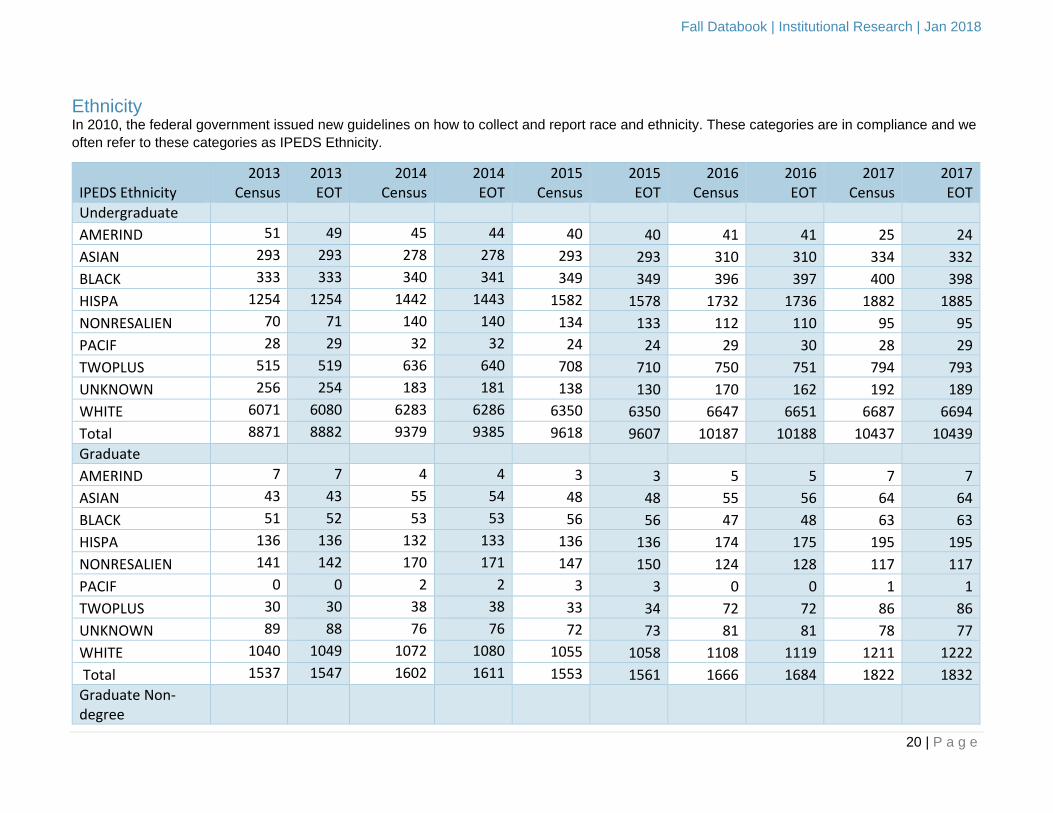
Ethnicity In 2010, the federal government issued new guidelines on how to collect and report race and ethnicity. These categories are in compliance and we
often refer to these categories as IPEDS Ethnicity.
IPEDS Ethnicity 2013
Census 2013 EOT
2014 Census
2014 EOT
2015 Census
2015 EOT
2016 Census
2016 EOT
2017 Census
2017 EOT
Undergraduate
AMERIND 51 49 45 44 40 40 41 41 25 24
ASIAN 293 293 278 278 293 293 310 310 334 332
BLACK 333 333 340 341 349 349 396 397 400 398
HISPA 1254 1254 1442 1443 1582 1578 1732 1736 1882 1885
NONRESALIEN 70 71 140 140 134 133 112 110 95 95
PACIF 28 29 32 32 24 24 29 30 28 29
TWOPLUS 515 519 636 640 708 710 750 751 794 793
UNKNOWN 256 254 183 181 138 130 170 162 192 189
WHITE 6071 6080 6283 6286 6350 6350 6647 6651 6687 6694
Total 8871 8882 9379 9385 9618 9607 10187 10188 10437 10439
Graduate
AMERIND 7 7 4 4 3 3 5 5 7 7
ASIAN 43 43 55 54 48 48 55 56 64 64
BLACK 51 52 53 53 56 56 47 48 63 63
HISPA 136 136 132 133 136 136 174 175 195 195
NONRESALIEN 141 142 170 171 147 150 124 128 117 117
PACIF 0 0 2 2 3 3 0 0 1 1
TWOPLUS 30 30 38 38 33 34 72 72 86 86
UNKNOWN 89 88 76 76 72 73 81 81 78 77
WHITE 1040 1049 1072 1080 1055 1058 1108 1119 1211 1222
Total 1537 1547 1602 1611 1553 1561 1666 1684 1822 1832
Graduate Non-degree

Fall Databook | Institutional Research | Jan 2018
21 | P a g e
AMERIND 0 0 2 2 0 0 0 0 0 0
ASIAN 10 10 8 9 6 6 4 4 3 3
BLACK 4 4 7 5 1 1 5 5 11 11
HISPA 18 18 19 19 13 12 12 13 16 15
NONRESALIEN 3 3 2 2 1 1 10 10 16 16
PACIF 1 1 1 0 1 1 0 0
TWOPLUS 4 4 2 3 3 4 7 7 11 11
UNKNOWN 17 16 12 10 11 11 13 12 11 10
WHITE 134 135 98 100 92 92 90 93 95 98
Total 190 190 151 151 128 127 142 145 163 164
Grand Total 10598 10619 11132 11147 11299 11295 11995 12017 12422 12435
UGRD % Minority 28% 28% 30% 30% 31% 31% 32% 32% 33% 33%
GRAD % Minority 18% 18% 18% 18% 18% 18% 21% 21% 23% 23%
Age Average age is calculated once per semester.
2011 2012 2013 2014 2015 2016 2017
Undergraduate 23.3 23.3 23.2 23.2 23.5 23.5 23.4
Graduate 33.8 33.9 33.5 33.8 33.8 34.2 34.2
Graduate Non-degree 35.7 35.4 36.4 35.6 37.4 36.5 34.9
Grand Total 25.4 25.1 25.0 24.9 25.0 25.1 25.1
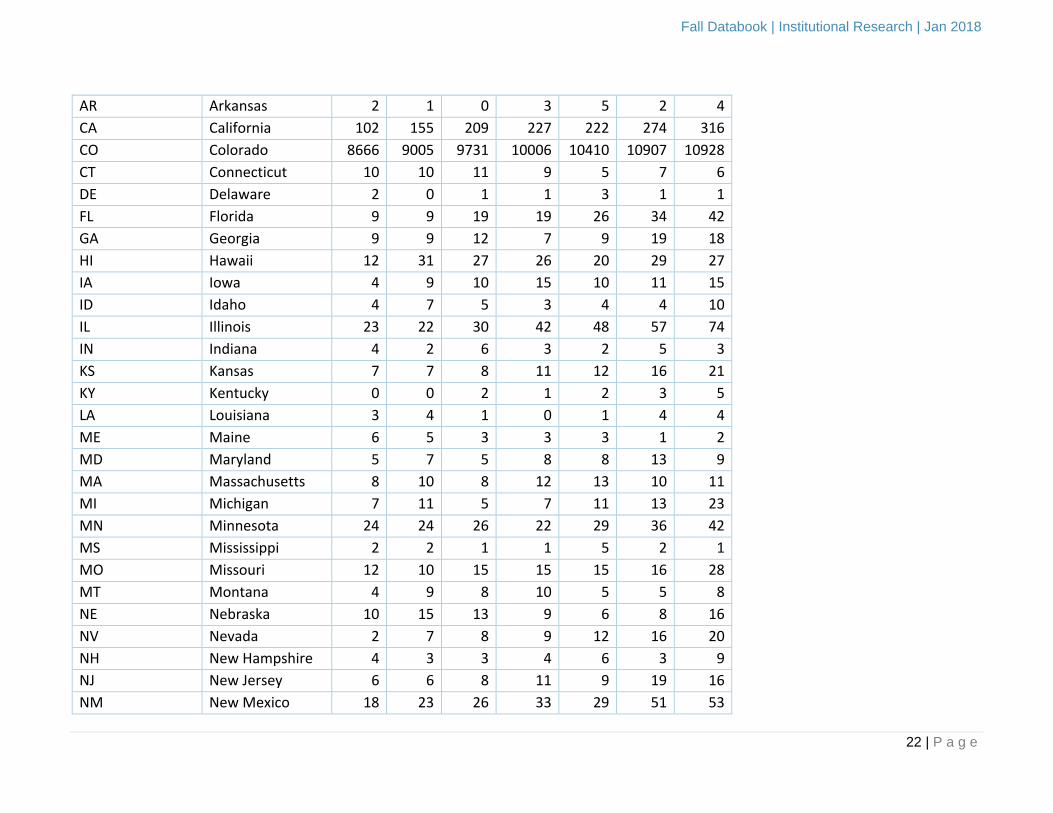
Home State The table includes only students whose home country is the United States. Home state is calculated once per semester.
State Code State 2011 2012 2013 2014 2015 2016 2017
AK Alaska 18 18 19 16 10 8 9
AL Alabama 4 3 1 3 4 7 7
AZ Arizona 27 25 26 24 31 47 53
Fall Databook | Institutional Research | Jan 2018
22 | P a g e
AR Arkansas 2 1 0 3 5 2 4
CA California 102 155 209 227 222 274 316
CO Colorado 8666 9005 9731 10006 10410 10907 10928
CT Connecticut 10 10 11 9 5 7 6
DE Delaware 2 0 1 1 3 1 1
FL Florida 9 9 19 19 26 34 42
GA Georgia 9 9 12 7 9 19 18
HI Hawaii 12 31 27 26 20 29 27
IA Iowa 4 9 10 15 10 11 15
ID Idaho 4 7 5 3 4 4 10
IL Illinois 23 22 30 42 48 57 74
IN Indiana 4 2 6 3 2 5 3
KS Kansas 7 7 8 11 12 16 21
KY Kentucky 0 0 2 1 2 3 5
LA Louisiana 3 4 1 0 1 4 4
ME Maine 6 5 3 3 3 1 2
MD Maryland 5 7 5 8 8 13 9
MA Massachusetts 8 10 8 12 13 10 11
MI Michigan 7 11 5 7 11 13 23
MN Minnesota 24 24 26 22 29 36 42
MS Mississippi 2 2 1 1 5 2 1
MO Missouri 12 10 15 15 15 16 28
MT Montana 4 9 8 10 5 5 8
NE Nebraska 10 15 13 9 6 8 16
NV Nevada 2 7 8 9 12 16 20
NH New Hampshire 4 3 3 4 6 3 9
NJ New Jersey 6 6 8 11 9 19 16
NM New Mexico 18 23 26 33 29 51 53

Fall Databook | Institutional Research | Jan 2018
23 | P a g e
NY New York 10 10 16 9 12 13 21
NC North Carolina 2 5 6 5 12 11 17
ND North Dakota 5 5 2 7 8 11 16
OH Ohio 7 11 7 12 14 15 14
OK Oklahoma 6 8 10 10 11 18 22
OR Oregon 12 14 12 12 12 15 16
PA Pennsylvania 7 13 11 14 12 8 19
RI Rhode Island 0 2 1 2 1 4
SC South Carolina 1 2 1 2 5 4 6
SD South Dakota 8 9 5 10 7 10 7
TN Tennessee 4 5 7 5 6 6 5
TX Texas 36 49 56 88 87 111 163
UT Utah 4 3 5 2 4 12 11
VT Vermont 2 2 3 1 4 4 3
VA Virgina 3 12 11 17 8 12 28
WA Washington 16 23 25 24 24 24 34
DC Washington DC 0 0 1 0 0
WV West Virginia 1 0 2 1 3 2 3
WI Wisconsin 15 17 16 26 20 23 22
WY Wyoming 6 5 7 11 10 9 5
Athletics These data are drawn from student group records stored in ISIS and maintained by the Athletic Department. These may not reflect actual team
rosters for NCAA purposes. Data are counted once per semester.
2011 2012 2013 2014 2015 2016 2017
Men’s Baseball 53 57
Men's Basketball 23 17 19 17 17 16 16
Men's Cross Country 17 19 21 23 29 33 30
Fall Databook | Institutional Research | Jan 2018
24 | P a g e
Men's Golf 13 10 10 10 7 7 8
Men's Indoor Track/Field 44 33 10 8 5 32 35
Men's Outdoor Track/Field 53 31 2
Men's Soccer 40 21 29 30 29 27 29
Women's Basketball 21 18 23 19 17 15 16
Women's Cross Country 8 14 14 16 21 22 24
Women's Golf NA NA 6 7 6 8 9
Women’s Lacrosse 26 26
Women's Indoor Track/Field 22 17 7 6 5 25 35
Women's Outdoor Track/Field 33 17 2
Women's Soccer 34 26 27 23 29 27 26
Women's Softball 29 21 17 21 22 22 22
Women's Volleyball 26 15 14 14 12 16 15
Total 363 259 197 194 199 333 349
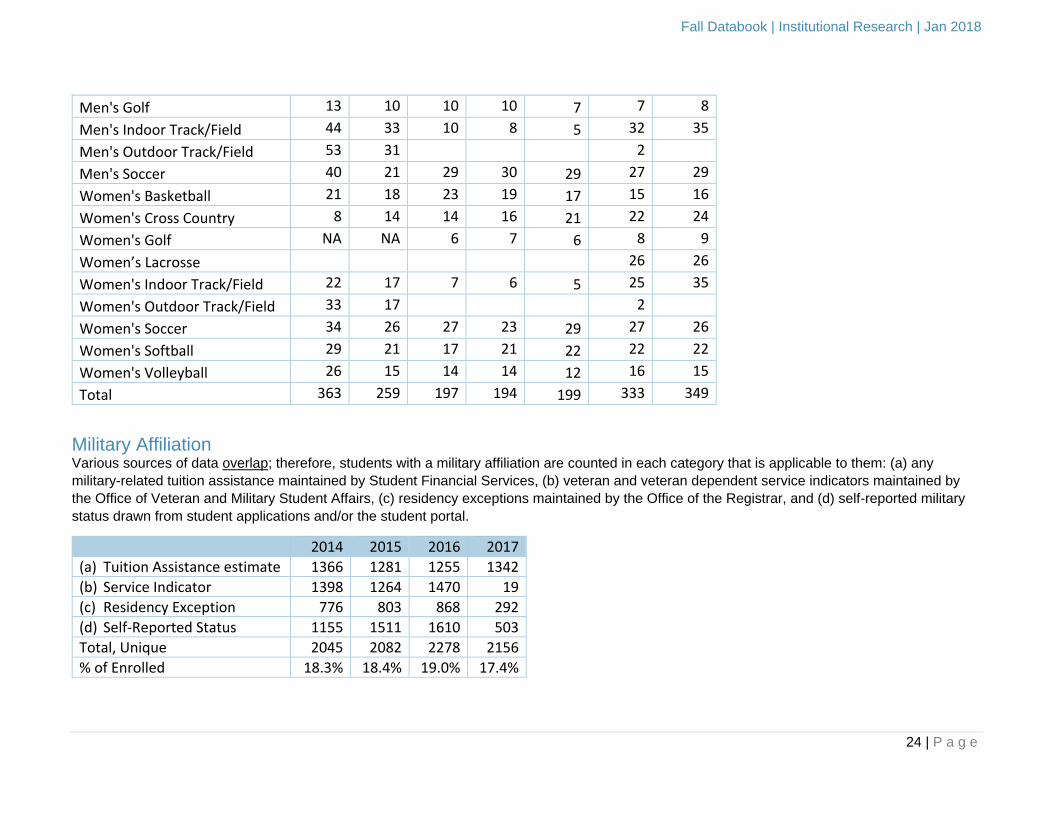
Military Affiliation Various sources of data overlap; therefore, students with a military affiliation are counted in each category that is applicable to them: (a) any
military-related tuition assistance maintained by Student Financial Services, (b) veteran and veteran dependent service indicators maintained by
the Office of Veteran and Military Student Affairs, (c) residency exceptions maintained by the Office of the Registrar, and (d) self-reported military
status drawn from student applications and/or the student portal.
2014 2015 2016 2017
(a) Tuition Assistance estimate 1366 1281 1255 1342
(b) Service Indicator 1398 1264 1470 19
(c) Residency Exception 776 803 868 292
(d) Self-Reported Status 1155 1511 1610 503
Total, Unique 2045 2082 2278 2156
% of Enrolled 18.3% 18.4% 19.0% 17.4%

Fall Databook | Institutional Research | Jan 2018
25 | P a g e
Online Instruction Online instruction is shown for end-of-term unless otherwise noted. Extended studies online instruction is included if the student is a main campus
student.
2011 2012 2013 2014 2015 2016 2017
Students: 9339 9798 10619 11147 11295 12017 12435
100% online hours 467 504 681 743 814 1069 1195
Some online hours 964 1228 1810 1585 1869 2235 2651
No online hours 7908 8066 8128 8819 8612 8713 8589
Online Credit Hours:
By GRAD students 2074 2032 2436 2566 2490 3049 3338
By NDGR students 105 180 277 214 172 210 339
By UGRD students 3983 5335 7899 7603 9400 12280 14534
Total online hours 6162 7547 10612 10383 12062 15539 18211
Online Hrs as % of Main Hrs 5.7% 6.6% 8.6% 8.0% 9.2% 11.1% 12.7%
First Generation Status First-Generation Status is based on application and financial aid documents and is defined here as a student whose parent(s) do not have a 4-year
degree. Students who have not reported the education levels of their parent(s) are not considered first-generation students due to missing data.
2011 2012 2013 2014 2015 2016 2017
Undergraduate 2649
(34.4%) 2676
(32.8%) 2849
(32.1%) 2808
(29.9%) 2838
(29.5%) 2932
(28.8%) 3139
(30.1%)
Graduate 272
(18.2%) 274
(18.5%) 293
(18.9%) 312
(19.4%) 312
(20.0%) 342
(20.5%) 424
(23.1%)
Graduate Non-degree 9
6.2%) 12
(8.2%) 19
(10.0%) 19
(12.6%) 20
(15.7%) 19
(13.4%) 30
(18.3%)
Total 2930
(31.4%) 2962
(30.2%) 3161
(29.8%) 3139
(28.2%) 3147
(28.0%) 3293
(27.5%) 3593
(28.9%)
Fall Databook | Institutional Research | Jan 2018
26 | P a g e
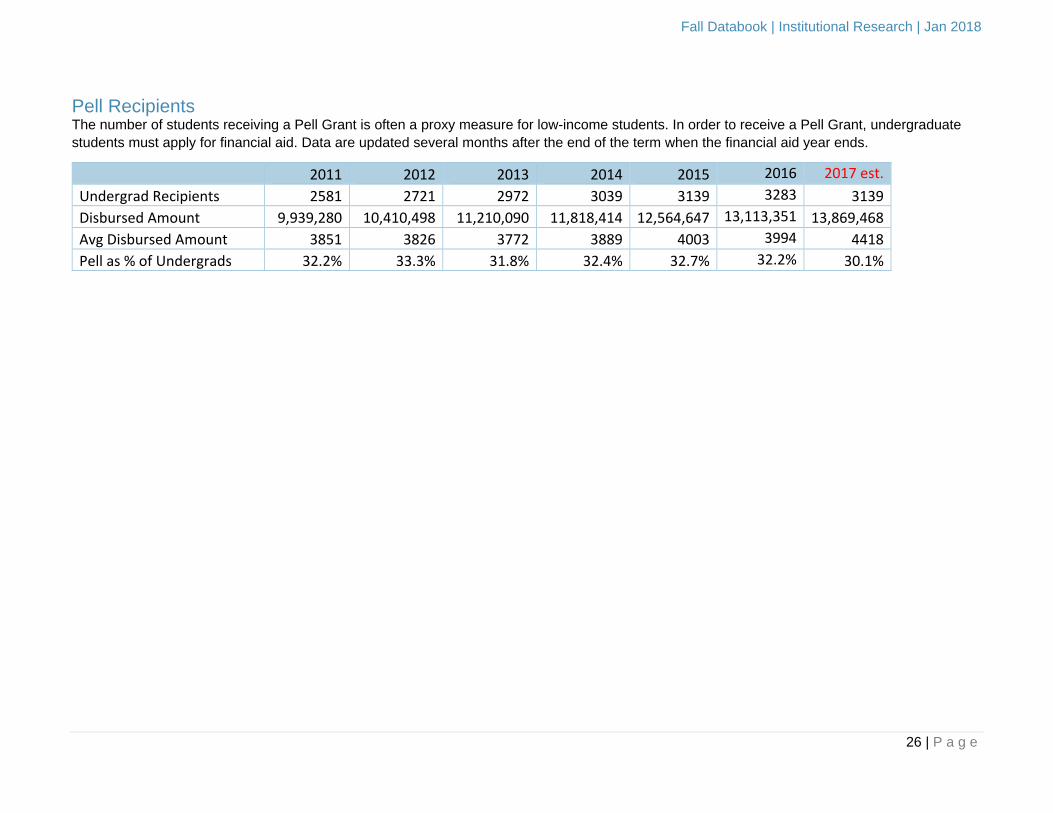
Pell Recipients The number of students receiving a Pell Grant is often a proxy measure for low-income students. In order to receive a Pell Grant, undergraduate
students must apply for financial aid. Data are updated several months after the end of the term when the financial aid year ends.
2011 2012 2013 2014 2015 2016 2017 est.
Undergrad Recipients 2581 2721 2972 3039 3139 3283 3139
Disbursed Amount 9,939,280 10,410,498 11,210,090 11,818,414 12,564,647 13,113,351 13,869,468
Avg Disbursed Amount 3851 3826 3772 3889 4003 3994 4418
Pell as % of Undergrads 32.2% 33.3% 31.8% 32.4% 32.7% 32.2% 30.1%

Fall Databook | Institutional Research | Jan 2018
27 | P a g e
Student Persistence & Performance Admissions Index & Test Scores These data are drawn directly from the Campus Solutions Warehouse and do not necessarily reflect data reported to SURDS, IPEDS, or other
external entities. Averages do not include students with missing data.
2012 2013 2014 2015 2016 2017
Enrolled as Freshmen Admit 1408 1562 1707 1636 2056 2008
Average ACT 23.3 23.4 23.4 23.3 23.2 23.3
Average SAT 1086 1064 1084 1072 1068 1023
Average Index 107 107 108 108 108 109
Undergraduate Persistence Undergraduate students’ status after one year is shown. The students may have graduated, transferred, or continued to be enrolled. Cohorts are
drawn from the end-of-term snapshots for main campus undergraduate students and their persistence status is determined at the following fall
census snapshot.
Cohorts --> 2011 2012 2013 2014 2015 2016
All Main Campus Undergrads 7702 8170 8882 9385 9607 10188
Graduated 1328 1172 1431 1386 1457 1689
Transferred Out 602 576 504 692 481 782
Still Enrolled at UCCS 4616 5103 5464 5925 5944 6195
% Unaccounted for 1 year later 15.0% 16.1% 16.7% 14.6% 18.0% 14.9%
Fall Databook | Institutional Research | Jan 2018
28 | P a g e
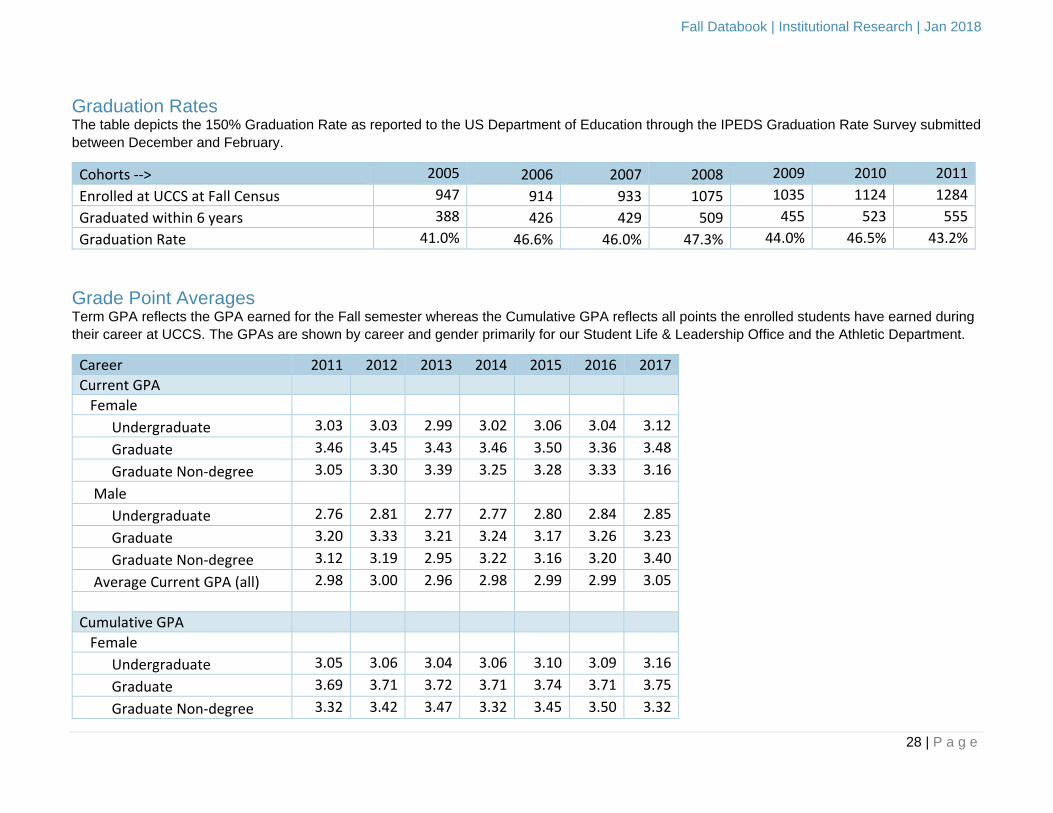
Graduation Rates The table depicts the 150% Graduation Rate as reported to the US Department of Education through the IPEDS Graduation Rate Survey submitted
between December and February.
Cohorts --> 2005 2006 2007 2008 2009 2010 2011
Enrolled at UCCS at Fall Census 947 914 933 1075 1035 1124 1284
Graduated within 6 years 388 426 429 509 455 523 555
Graduation Rate 41.0% 46.6% 46.0% 47.3% 44.0% 46.5% 43.2%
Grade Point Averages Term GPA reflects the GPA earned for the Fall semester whereas the Cumulative GPA reflects all points the enrolled students have earned during
their career at UCCS. The GPAs are shown by career and gender primarily for our Student Life & Leadership Office and the Athletic Department.
Career 2011 2012 2013 2014 2015 2016 2017
Current GPA
Female
Undergraduate 3.03 3.03 2.99 3.02 3.06 3.04 3.12
Graduate 3.46 3.45 3.43 3.46 3.50 3.36 3.48
Graduate Non-degree 3.05 3.30 3.39 3.25 3.28 3.33 3.16
Male
Undergraduate 2.76 2.81 2.77 2.77 2.80 2.84 2.85
Graduate 3.20 3.33 3.21 3.24 3.17 3.26 3.23
Graduate Non-degree 3.12 3.19 2.95 3.22 3.16 3.20 3.40
Average Current GPA (all) 2.98 3.00 2.96 2.98 2.99 2.99 3.05
Cumulative GPA
Female
Undergraduate 3.05 3.06 3.04 3.06 3.10 3.09 3.16
Graduate 3.69 3.71 3.72 3.71 3.74 3.71 3.75
Graduate Non-degree 3.32 3.42 3.47 3.32 3.45 3.50 3.32

Fall Databook | Institutional Research | Jan 2018
29 | P a g e
Male
Undergraduate 2.82 2.84 2.85 2.85 2.88 2.90 2.93
Graduate 3.58 3.64 3.62 3.62 3.65 3.67 3.65
Graduate Non-degree 3.21 3.26 3.15 3.34 3.35 3.28 3.43
Average Cumulative GPA (all) 3.06 3.07 3.06 3.07 3.10 3.10 3.15
Degrees Conferred Conferrals shown for the Fall semester only. Data are extracted from the Campus Solutions Warehouse and might not correspond to IPEDS or
other external reports that rely on EOT snapshots and/or fiscal year conferrals. Please see www.uccs.edu/ir/data/outcomes.html for a full report.
Degree Academic Plan 2011 2012 2013 2014 2015 2016 2017
TBD
BA ANTH-ADL 2 1 ANTH-BA 11 4 8 5 7 5 BCBA-ADL 1 BCBA-BA 3 BIOL-ADL 1 BIOL-BA 1 2 2 2 5 CHEM-ADL 1 1 CHEM-BA 2 4 7 3 2 4 COMM-ADL 1 3 1 1 COMM-BA 35 38 39 44 59 48 CRJU-BA 11 18 26 42 26 25 DIST-BA 1 1 2 ECON-BA 9 10 1 1 13 3 ECON-ADL 1 ENGL-ADL 1 ENGL-BA 23 15 17 17 18 23 GEEV-ADL 1 1 1 1 GEEV-BA 10 24 28 27 21 19 HIST-ADL 1 2 3 HIST-BA 16 14 16 12 9 6

Fall Databook | Institutional Research | Jan 2018
30 | P a g e
MTBA-BA 6 1 3 2 3 4 PHIL-ADL 1 1 1 1 2 2 PHIL-BA 5 2 7 3 4 9 PSCI-ADL 1 1 PSCI-BA 5 12 16 11 11 5 PSYC-ADL 2 1 1 1 PSYC-BA 40 32 49 37 48 38 SOCI-ADL 1 2 SOCI-BA 16 16 19 14 12 13 SPAN-BA 1 2 1 1 1 3 VAPA-BA 9 11 9 9 10 8 WEST-ADL 3 2 2 WEST-BA 1 1 1 5 3 Subtotal 210 214 263 240 257 229
BI BIBU-BI 1 2 2 2 2 2 BICE-BI 1 BICS-BI 1 1 1 2 BIEL-BI 1 2 BIGD-BI 4 4 1 3 3 1 BISC-BI 1 2 1 FNCE-BI 1 1 1 1 HRMG-BI 1 INTB-BI 2 MGMT-BI 1 MKTG-BI 2 1 Subtotal 7 8 6 12 8 10
BS BCBS-BS 1 3 1 5 4 BLBS-BS 23 36 26 30 28 51 CMBS-BS 1 1 1 1 CPEN-BS 2 2 5 6 CSCI-BS 6 9 9 10 15 12 ELEN-BS 6 9 14 4 16 7 HCSC-BS 13 16 21 20 17 21

Fall Databook | Institutional Research | Jan 2018
31 | P a g e
MEEN-BS 18 14 19 11 16 33 MTBS-BS 2 1 3 1 4 5 NURS-BS 11 4 9 23 19 38 PHES-ADL 1 PHES-BS 1 2 1 6 6 6 Subtotal 84 91 106 109 103 183
BSBU ACCT-ADL 2 1 1 ACCT-BSBU 21 13 18 11 16 16 BUAD-BSBU 12 12 16 14 12 22 FNCE-ADL 3 3 2 4 3 FNCE-BSBU 9 8 11 16 25 21 GENB-BSBU 7 8 2 2 2 2 HRMG-ADL 1 1 1 HRMG-BSBU 4 3 8 2 3 8 INFS-ADL 1 INFS-BSBU 7 4 1 2 1 2 INTB-ADL 1 2 1 INTB-BSBU 4 4 6 3 7 2 MGMT-ADL 2 1 2 MGMT-BSBU 11 16 10 8 10 18 MKTG-ADL 3 1 1 3 1 MKTG-BSBU 19 14 20 17 18 18 SPTM-BSBU 7 8 3 5 5 6 SVMG-BSBU 4 5 3 5 4 3 Subtotal 114 100 100 93 114 124
DNP NRSD-DNP 1 1 1 3 3 Subtotal 1 1 1 3 0 3
MA COMM-MA 2 2 4 2 1 1 COUN-MA 1 3 CURR-MA 14 11 14 14 6 9 GEOG-MA 1 2 1 2 1 HIST-MA 4 3 2 1 6 LEAD-MA 4 9 4 11 7 10

Fall Databook | Institutional Research | Jan 2018
32 | P a g e
PSYC-MA 8 1 8 1 4 SOCI-MA 2 8 2 5 2 5 SPED-MA 19 14 7 7 7 1 TESL-MA 3 5 3 Subtotal 47 57 38 51 31 40
MBA MBAD-MBA 23 27 26 28 15 23 MBAE-MBA 19 20 9 10 7 5 Subtotal 42 47 35 38 22 28
MCJ CRJU-MCJ 2 2 4 1 1 Subtotal 2 2 4 1 1
MENG MAEG-MENG 13 18 13 4 10 12 Subtotal 13 18 13 4 10 12
MPAD PADM-MPAD 6 11 13 13 9 13 Subtotal 6 11 13 13 9 13
MSA MACC-MSA 2 Subtotal 2
MS AMTH-MS 2 2 1 1 1 CSCI-MS 7 5 7 3 6 4 ELEN-MS 1 4 5 2 4 5 MEEN-MS 6 9 3 7 4 4 NURS-MS 16 3 8 11 11 11 Subtotal 32 23 24 23 26 25
MSC MSBI-MSC 1 3 1 1 MSCH-MSC 1 1 MSED-MSC 3 2 1 MSFS-MSC 2 MSHP-MSC 3 MSMA-MSC 2 1 MSPH-MSC 1 1 1 1 MSSM-MSC 3 1 1 MSSN-MSC 1 5 2 1 Subtotal 9 12 8 4 5 2 ASPY-PHD 1 1

Fall Databook | Institutional Research | Jan 2018
33 | P a g e
PHD ENGR-PHD 1 3 5 1 3 LERP-PHD 3 2 2 2 4 3 PSYC-PHD 2 1 1 Subtotal 3 5 7 7 7 6
Total 570 587 616 601 631 678
Academic Instruction & Credit Hours Additional student credit hour (SCH) census reports are posted online at http://www.uccs.edu/ir/data/enrollment-and-credit-hours.html.
Instruction Mode Credit hours taken by students per campus and instruction mode at the end of the semester unless noted. EXSTU includes non-credit units.
2011 2012 2013 2014 2015 2016 2017
COSPG: MAIN CAMPUS
In Person 101240.5 105415 111910 115802 115481 119385.5 119617
Online 5936 7342 9225 10287 12026 16358 19483
Hybrid Online/Classroom 429 603 1323 2606 3139 3362 3738
Independent Study 397 469 431 342 341 372 364
Total 108002.5 113829 122889 129037 130987 139477.5 143,202
EXSTU: EXTENDED STUDIES
In Person 2281.4 2489.1 4028 3755 2881.95 2164 2723
Online 1802 1437 1199 1010 901.8 282 287
Correspondence 378 578.5 187.5 263 228.5 3
Hybrid Online/Classroom 18 198 300 113 21
Independent Study 56 76 104 80 91 72 76
Total 4517.4 4598.6 5716.5 5408 4216.25 2543 3086
UCCS TOTAL 112519.9 118427.6 128605.5 134445 135203 142020.5 146,288

Fall Databook | Institutional Research | Jan 2018
34 | P a g e
Session Sessions depict common schedules f courses within a semester. Credit hours are shown at the end of the semester unless noted.
Spring Sessions 2011 2012 2013 2014
2015 2016 2017
COSPG: MAIN CAMPUS
Main Campus Sem 99005.5 103891 112161 116973 118635 125449.5 130216
Freshman/Gateway Sem 2974 3285 3746 5174 5146 5847 5583
Pre-Term 977 855 702 627 725 798 757
Weekend Univ 1249 1968 2406 2318 2454 2226 2168
Intensive 1114 1544 2038 2037 2240 2867 2132
First 8-Wks/Session A 1250 950 738 672 674 709 1242
Second 8-Wks/Session B 941 850 609 663 534 654 1104
DMBA 495 486 483 570 579 927
Total 108002.5 113829 122883 129034 130987 139477.5 143202
EXSTU: EXTENDED STUDIES
ES CU Succeed 475 452 762 1058 838
Non-Cred Intensive 490.8 780 2137.5 2357.5 1109.75 606
ES Campus Sem 1830 1867 2018 1609 1454 911 880
ES Intensive 1249 1323.5 760.5 642.5 572.5 556 645
Non-Credit Sem 424.6 201.6 19 107 114 117
ES Campus Sem (DMBA) 507 363 249 243 204 18
ES Correspondence 63.5 63.5
Not Available 16
Total 4517.4 4598.6 5722.5 5411 4216.25 2543 3086
UCCS TOTAL 112519.9 118427.6 128605.5 134445.0 135203 142020.5 146288
Fall Databook | Institutional Research | Jan 2018
35 | P a g e
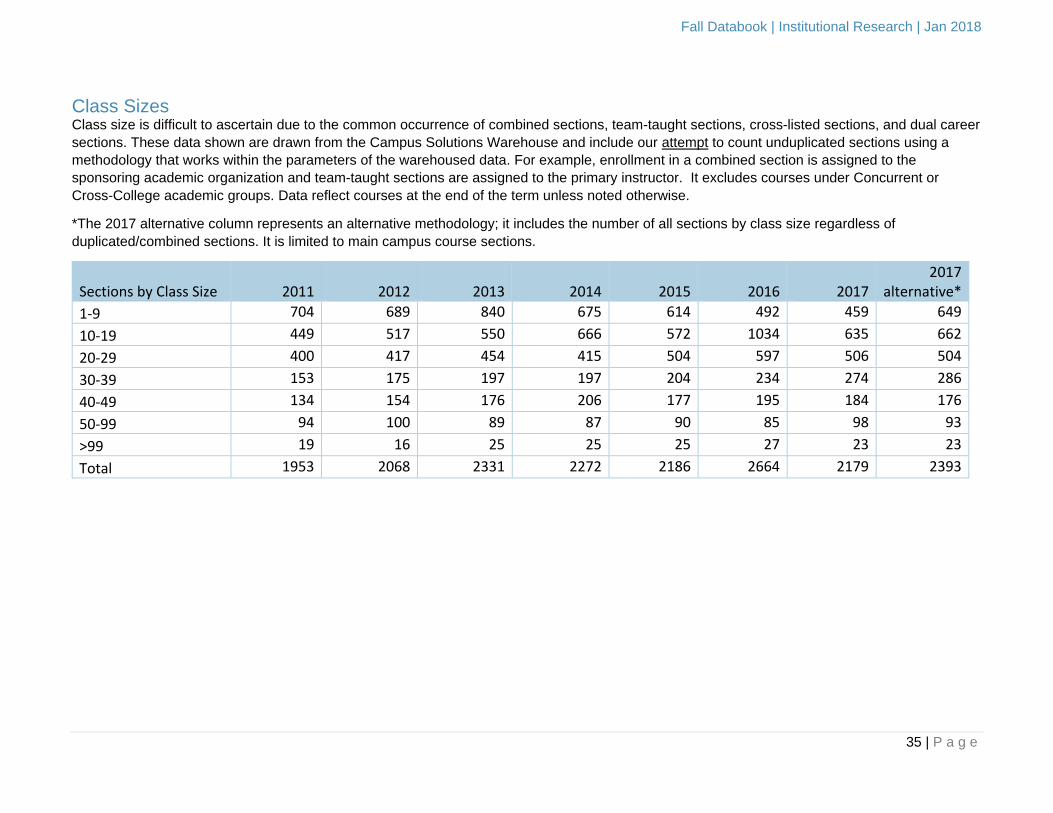
Class Sizes Class size is difficult to ascertain due to the common occurrence of combined sections, team-taught sections, cross-listed sections, and dual career
sections. These data shown are drawn from the Campus Solutions Warehouse and include our attempt to count unduplicated sections using a
methodology that works within the parameters of the warehoused data. For example, enrollment in a combined section is assigned to the
sponsoring academic organization and team-taught sections are assigned to the primary instructor. It excludes courses under Concurrent or
Cross-College academic groups. Data reflect courses at the end of the term unless noted otherwise.
*The 2017 alternative column represents an alternative methodology; it includes the number of all sections by class size regardless of
duplicated/combined sections. It is limited to main campus course sections.
Sections by Class Size 2011 2012 2013 2014 2015 2016 2017 2017
alternative*
1-9 704 689 840 675 614 492 459 649
10-19 449 517 550 666 572 1034 635 662
20-29 400 417 454 415 504 597 506 504
30-39 153 175 197 197 204 234 274 286
40-49 134 154 176 206 177 195 184 176
50-99 94 100 89 87 90 85 98 93
>99 19 16 25 25 25 27 23 23
Total 1953 2068 2331 2272 2186 2664 2179 2393
Fall Databook | Institutional Research | Jan 2018
36 | P a g e
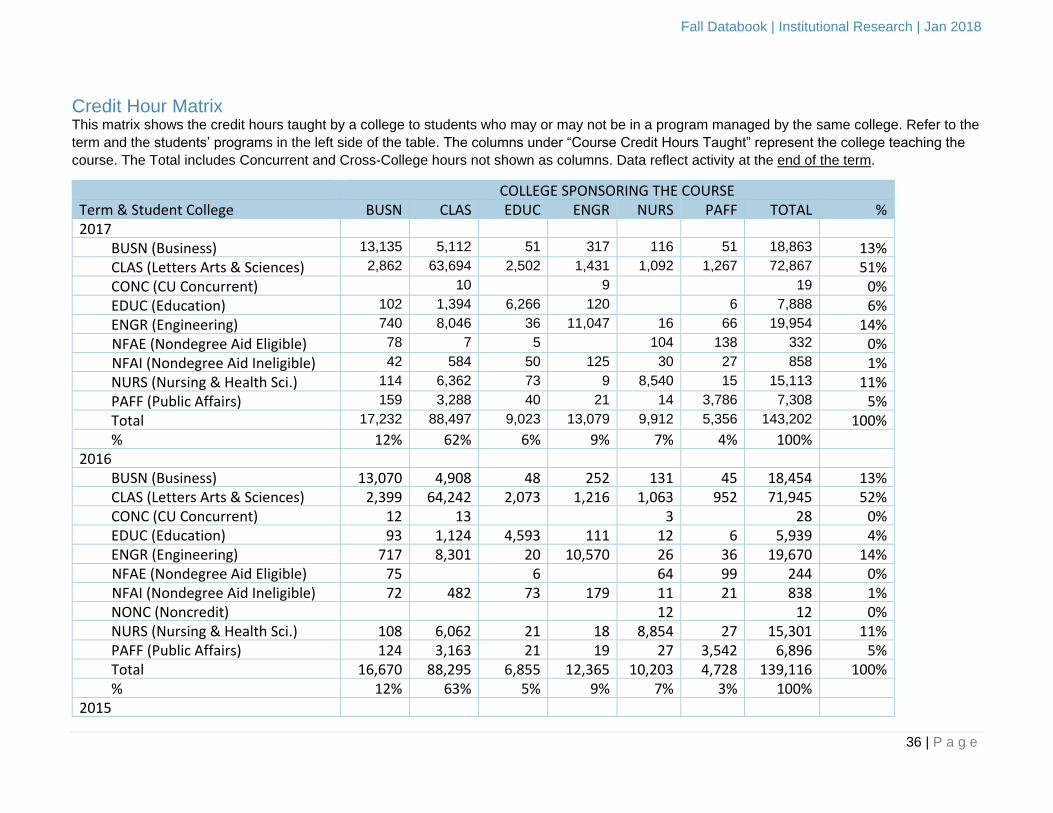
Credit Hour Matrix This matrix shows the credit hours taught by a college to students who may or may not be in a program managed by the same college. Refer to the
term and the students’ programs in the left side of the table. The columns under “Course Credit Hours Taught” represent the college teaching the
course. The Total includes Concurrent and Cross-College hours not shown as columns. Data reflect activity at the end of the term.
COLLEGE SPONSORING THE COURSE Term & Student College BUSN CLAS EDUC ENGR NURS PAFF TOTAL % 2017
BUSN (Business) 13,135 5,112 51 317 116 51 18,863 13% CLAS (Letters Arts & Sciences) 2,862 63,694 2,502 1,431 1,092 1,267 72,867 51% CONC (CU Concurrent) 10 9 19 0% EDUC (Education) 102 1,394 6,266 120 6 7,888 6% ENGR (Engineering) 740 8,046 36 11,047 16 66 19,954 14%
NFAE (Nondegree Aid Eligible) 78 7 5 104 138 332 0% NFAI (Nondegree Aid Ineligible) 42 584 50 125 30 27 858 1%
NURS (Nursing & Health Sci.) 114 6,362 73 9 8,540 15 15,113 11% PAFF (Public Affairs) 159 3,288 40 21 14 3,786 7,308 5% Total 17,232 88,497 9,023 13,079 9,912 5,356 143,202 100% % 12% 62% 6% 9% 7% 4% 100%
2016 BUSN (Business) 13,070 4,908 48 252 131 45 18,454
13%
CLAS (Letters Arts & Sciences) 2,399 64,242 2,073 1,216 1,063 952 71,945 52% CONC (CU Concurrent) 12 13 3 28 0% EDUC (Education) 93 1,124 4,593 111 12 6 5,939 4% ENGR (Engineering) 717 8,301 20 10,570 26 36 19,670 14%
NFAE (Nondegree Aid Eligible) 75 6 64 99 244 0% NFAI (Nondegree Aid Ineligible) 72 482 73 179 11 21 838 1%
NONC (Noncredit) 12 12 0% NURS (Nursing & Health Sci.) 108 6,062 21 18 8,854 27 15,301 11% PAFF (Public Affairs) 124 3,163 21 19 27 3,542 6,896 5% Total 16,670 88,295 6,855 12,365 10,203 4,728 139,116 100% % 12% 63% 5% 9% 7% 3% 100%
2015

Fall Databook | Institutional Research | Jan 2018
37 | P a g e
BUSN (Business) 12,326 4,413 40 239 100 24 17,184 13% CLAS (Letters Arts & Sciences) 2,412 61,604 2,343 899 975 785 69,030 53% CONC (CU Concurrent) 9 8 6 23 0% EDUC (Education) 81 323 3,708 126 9 12 4,259 3% ENGR (Engineering) 585 7,748 15 10,075 16 57 18,496 14%
NFAE (Nondegree Aid Eligible) 60 28 126 214 0% NFAI (Nondegree Aid Ineligible) 102 793 39 405 20 39 1,398 1%
NONC (Noncredit) 14 24 38 0% NURS (Nursing & Health Sci.) 109 5,596 19 3 8,406 15 14,148 11% PAFF (Public Affairs) 127 2,860 40 8 28 3,180 6,243 5% Total 15,811 83,359 6,204 11,755 9,612 3,180 131,033 100% % 12% 64% 5% 9% 7% 3% 100%
2014 BUSN (Business) 12,223 4,535 7 147 62 22 16,996 13% CLAS (Letters Arts & Sciences) 2,488 62,846 1,667 2,083 1,008 737 70,829 55% CONC (CU Concurrent) 6 4 9 3 22 0% EDUC (Education) 60 318 3,913 93 12 9 4,405 3% ENGR (Engineering) 346 5,990 9 8,444 18 54 14,861 12%
NFAE (Nondegree Aid Eligible) 45 9 18 138 210 0% NFAI (Nondegree Aid Ineligible) 131 800 49 503 9 36 1,528 1%
NONC (Noncredit) 3 36 9 18 6 72 0% NURS (Nursing & Health Sci.) 132 5,726 3 3 7,987 25 13,876 11% PAFF (Public Affairs) 110 2,922 6 54 36 3,181 6,309 5% Total 15,544 83,186 5,663 11,354 9,159 4,202 129,108 100% % 12% 64% 4% 9% 7% 3% 100%
2013 BUSN (Business) 11,315 4,209 6 130 74 27 15,761 13% CLAS (Letters Arts & Sciences) 2,296 62,106 1,732 2,316 1,155 689 70,294 57% CONC (CU Concurrent) 6 6 12 6 30 0% EDUC (Education) 127 3,678 24 3,829 3% ENGR (Engineering) 400 4,316 6 7,470 8 12 12,212 10%
NFAE (Nondegree Aid Eligible) 54 16 109 179 0% NFAI (Nondegree Aid Ineligible) 87 740 171 122 40 57 1,217 1%
Fall Databook | Institutional Research | Jan 2018
38 | P a g e
NONC (Noncredit) 9 52 3 8 27 99 0% NURS (Nursing & Health Sci.) 176 5,619 19 7,787 21 13,622 11% PAFF (Public Affairs) 130 2,553 6 3 36 3,035 5,763 5% Total 14,473 79,722 5,621 10,055 9,155 3,980 123,006 100% % 12% 65% 5% 8% 7% 3% 100%
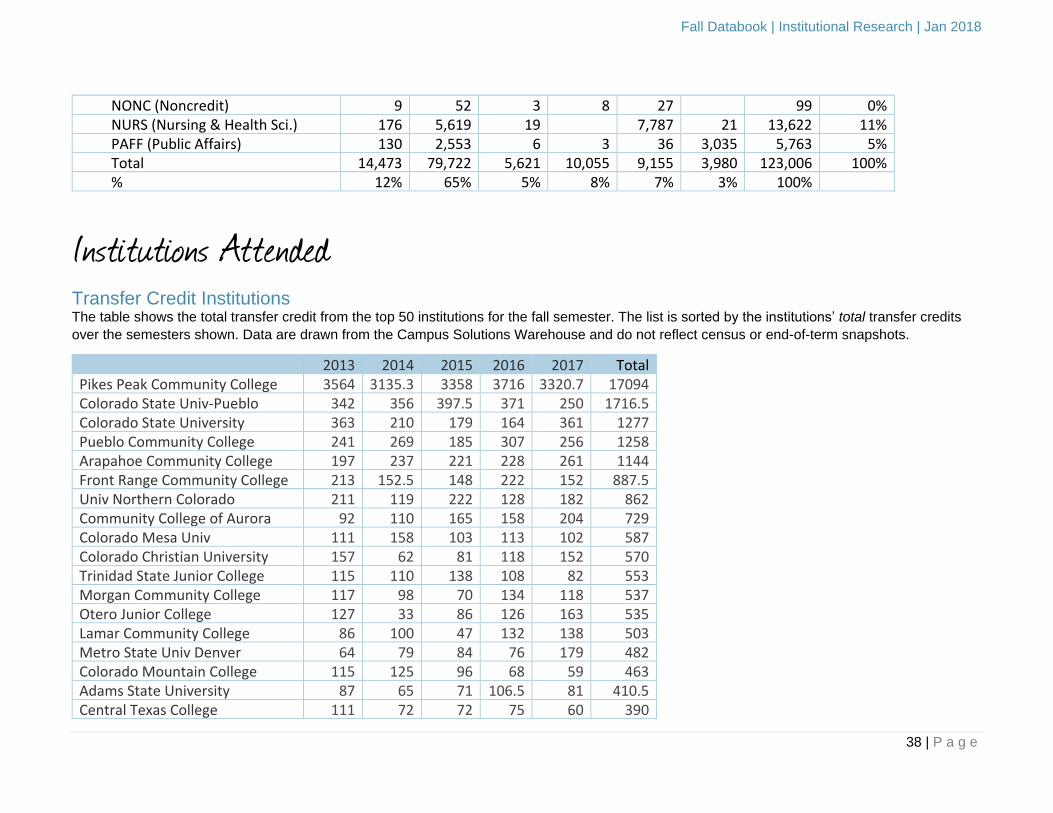
Institutions Attended Transfer Credit Institutions The table shows the total transfer credit from the top 50 institutions for the fall semester. The list is sorted by the institutions’ total transfer credits
over the semesters shown. Data are drawn from the Campus Solutions Warehouse and do not reflect census or end-of-term snapshots.
2013 2014 2015 2016 2017 Total (5yrs) Pikes Peak Community College 3564 3135.3 3358 3716 3320.7 17094
Colorado State Univ-Pueblo 342 356 397.5 371 250 1716.5 Colorado State University 363 210 179 164 361 1277 Pueblo Community College 241 269 185 307 256 1258 Arapahoe Community College 197 237 221 228 261 1144 Front Range Community College 213 152.5 148 222 152 887.5 Univ Northern Colorado 211 119 222 128 182 862 Community College of Aurora 92 110 165 158 204 729 Colorado Mesa Univ 111 158 103 113 102 587 Colorado Christian University 157 62 81 118 152 570 Trinidad State Junior College 115 110 138 108 82 553 Morgan Community College 117 98 70 134 118 537 Otero Junior College 127 33 86 126 163 535 Lamar Community College 86 100 47 132 138 503 Metro State Univ Denver 64 79 84 76 179 482 Colorado Mountain College 115 125 96 68 59 463 Adams State University 87 65 71 106.5 81 410.5 Central Texas College 111 72 72 75 60 390

Fall Databook | Institutional Research | Jan 2018
39 | P a g e
Red Rocks Community College 80 81 72 91 52 376 Univ Maryland-Univ College 81 94 78 49 68 370 Western State Colorado Univ 50 100 53 53 39 295 Community College of Denver 57 40 65 39 91 292 Aims Community College 44 64.6 24 63 84 279.6 Colorado Technical University 98.7 78.4 31.9 47.9 21.1 278 Fort Lewis College 32 93 50 75 20 270 Colorado School of Mines 10.5 23.5 81 52.5 78 245.5 Non-US College 40 55.7 69.5 23 44.8 233 Univ Kansas 13 23 170 7 213 Kansas State University 26 139 28 6 199 Defense Language Institute 18 54 48 69 9 198 Univ New Mexico 21 43 40 44 50 198 New Mexico State University 15 120 24 28 187 Hawaii Pacific University 18 128 9 6 4 165 Moorpark College 65 16.5 44 10 29 164.5 Univ Phoenix 24 24 50 24 34 156 Cochise College 19 49 21 51 15 155 Univ Minn: Twin Cities 8 44 35 27.3 39 153.3 Michigan State University 13 120 8 10 151 Calvin College 10 13 125 148 Colorado College 44 31 21 51 147 Saddleback College 27 25.5 17 43 26.3 138.8 Northeastern Junior College 34.5 22 29 40 10 135.5 Duke University 135 135 Purdue Univ 120 4 9 133 Barton County Comm College 12 30 35 35 18 130 Univ Alaska Anchorage 42 16 25 29 18 130 Middle Tenn State Univ 18 99 3 7 127 Air Univ-Comm Coll Air Force 96 30 126 Univ New Hampshire Durham 125 125 Univ Cincinnati: Raymond Walte 125 125

Fall Databook | Institutional Research | Jan 2018
40 | P a g e
High Schools Among fall semester students in the freshmen academic level, the following 50 high schools were the most common over the past 5 years.
High School City State 2013 2014 2015 2016 2017 Total Thomas B Doherty High School Colorado Springs Colorado 117 91 81 84 101 474 Rampart High School Colorado Springs Colorado 87 75 84 90 85 421 William J Palmer High School Colorado Springs Colorado 88 99 79 67 51 384 Liberty High School Colorado Springs Colorado 69 78 68 68 58 341 Vista Ridge High School Colorado Springs Colorado 65 66 70 82 56 339 Pine Creek High School Colorado Springs Colorado 64 65 67 73 70 339 Cheyenne Mountain High School Colorado Springs Colorado 69 60 55 61 68 313 Air Academy High School USAF Academy Colorado 67 56 59 61 64 307 Sand Creek High School Colorado Springs Colorado 56 59 56 53 39 263 Coronado High School Colorado Springs Colorado 46 55 44 55 57 257 Falcon High School Peyton Colorado 50 70 40 45 39 244 Lewis-Palmer High School Monument Colorado 42 44 40 32 54 212 Palmer Ridge High School Monument Colorado 29 45 35 43 35 187 Discovery Canyon Campus Sch Colorado Springs Colorado 35 32 32 50 37 186 Fountain-Fort Carson High Sch Fountain Colorado 33 35 29 31 43 171 Widefield High School Colorado Springs Colorado 40 32 25 33 41 171 Mesa Ridge High School Colorado Springs Colorado 24 27 24 38 38 151 The Classical Academy Colorado Springs Colorado 39 28 30 19 35 151 Castle View High School Castle Rock Colorado 20 22 34 35 39 150 Harrison High School Colorado Springs Colorado 34 30 20 26 29 139 James Irwin Charter HS Colorado Springs Colorado 29 37 26 30 15 137 Manitou Springs High School Manitou Springs Colorado 25 29 39 24 17 134 Woodland Park High School Woodland Park Colorado 32 29 26 28 16 131 Sierra High School Colorado Springs Colorado 18 25 25 23 28 119 William Mitchell High School Colorado Springs Colorado 30 25 25 22 17 119 Douglas County High School Castle Rock Colorado 18 28 16 34 21 117 Saint Marys High School Colorado Springs Colorado 23 23 11 20 23 100 Chaparral High School Parker Colorado 20 19 25 20 12 96 Colorado Springs Chrstn Sch Colorado Springs Colorado 33 14 13 21 12 93

Fall Databook | Institutional Research | Jan 2018
41 | P a g e
Legend High School Parker Colorado 9 19 8 25 30 91 Cherokee Trail High School Aurora Colorado 19 11 8 24 28 90 Rangeview High School Aurora Colorado 7 10 15 25 20 77 Grandview High School Aurora Colorado 22 21 9 15 8 75 Eaglecrest High School Centennial Colorado 16 20 15 11 12 74 Rock Canyon High School Highlands Ranch Colorado 5 18 14 18 15 70 Vanguard School Colorado Springs Colorado 12 16 15 13 13 69 Pueblo West High School Pueblo West Colorado 10 19 11 15 14 69 Thunderridge High School Highlands Ranch Colorado 4 18 21 14 12 69 Legacy High School Broomfield Colorado 10 9 12 16 19 66 Overland High School Aurora Colorado 6 8 20 16 14 64 Mountain Vista High School Highlands Ranch Colorado 14 13 7 12 15 61 Centennial High School Pueblo Colorado 12 8 8 12 19 59 Arapahoe High School Centennial Colorado 5 13 10 13 14 55 Ponderosa High School Parker Colorado 23 14 4 6 7 54 Elizabeth High School Elizabeth Colorado 12 9 11 8 12 52 Cherry Creek High School Greenwood Village Colorado 12 11 8 8 13 52 Canon City Senior High School Canon City Colorado 11 10 8 14 8 51 Montrose High School Montrose Colorado 13 5 10 9 14 51 Heritage High School Littleton Colorado 14 8 8 8 10 48 Ralston Valley High School Arvada Colorado 4 10 15 10 7 46


![INDEX [assets.tequipment.net] · INDEX 491 A Abbreviations, ... ANSI B94.25 391 ANSI keyseat dimensions 262 ... ANSI/ASME B1.13M-1983 280, 396 ANSI/ASME B18.3 314](https://img.pdfslide.us/doc/110x75/5b6991367f8b9a68538e3fe0/index-index-491-a-abbreviations-ansi-b9425-391-ansi-keyseat-dimensions.jpg)