Embed Size (px)
Citation preview
Fairfield UniversityFinancial StatementsJune 30, 2014 and 2013
Fairfield UniversityIndexJune 30, 2014 and 2013
Page(s)
Independent Auditor’s Report ..............................................................................................................1–2
Financial Statements
Statements of Financial Position..................................................................................................................3
Statements of Activities............................................................................................................................4–5
Statements of Cash Flows ...........................................................................................................................6
Notes to Financial Statements ...............................................................................................................7–25
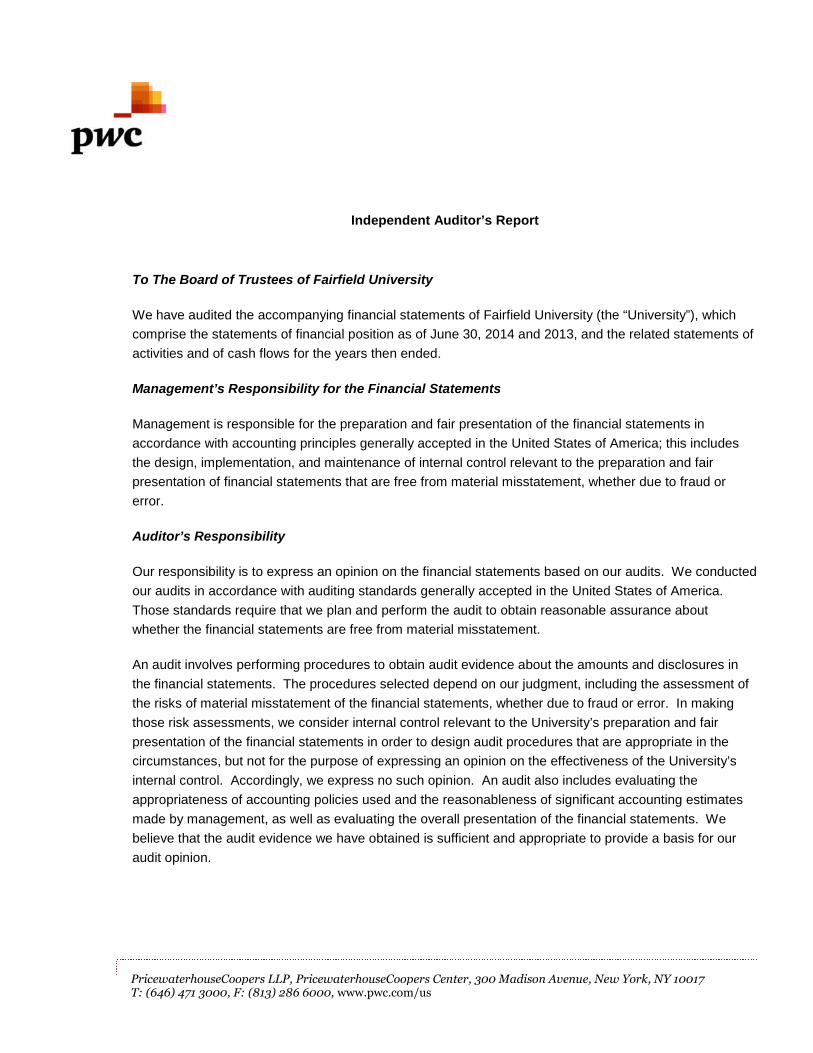
Independent Auditor’s Report
To The Board of Trustees of Fairfield University
We have audited the accompanying financial statements of Fairfield University (the “University”), which
comprise the statements of financial position as of June 30, 2014 and 2013, and the related statements of
activities and of cash flows for the years then ended.
Management’s Responsibility for the Financial Statements
Management is responsible for the preparation and fair presentation of the financial statements in
accordance with accounting principles generally accepted in the United States of America; this includes
the design, implementation, and maintenance of internal control relevant to the preparation and fair
presentation of financial statements that are free from material misstatement, whether due to fraud or
error.
Auditor’s Responsibility
Our responsibility is to express an opinion on the financial statements based on our audits. We conducted
our audits in accordance with auditing standards generally accepted in the United States of America.
Those standards require that we plan and perform the audit to obtain reasonable assurance about
whether the financial statements are free from material misstatement.
An audit involves performing procedures to obtain audit evidence about the amounts and disclosures in
the financial statements. The procedures selected depend on our judgment, including the assessment of
the risks of material misstatement of the financial statements, whether due to fraud or error. In making
those risk assessments, we consider internal control relevant to the University’s preparation and fair
presentation of the financial statements in order to design audit procedures that are appropriate in the
circumstances, but not for the purpose of expressing an opinion on the effectiveness of the University’s
internal control. Accordingly, we express no such opinion. An audit also includes evaluating the
appropriateness of accounting policies used and the reasonableness of significant accounting estimates
made by management, as well as evaluating the overall presentation of the financial statements. We
believe that the audit evidence we have obtained is sufficient and appropriate to provide a basis for our
audit opinion.
PricewaterhouseCoopers LLP, PricewaterhouseCoopers Center, 300 Madison Avenue, New York, NY 10017T: (646) 471 3000, F: (813) 286 6000, www.pwc.com/us

2
Opinion
In our opinion, the financial statements referred to above present fairly, in all material respects, thefinancial position of Fairfield University at June 30, 2014 and 2013, and the results of its operations and itscash flows for the years then ended in accordance with accounting principles generally accepted in theUnited States of America.
October 6, 2014
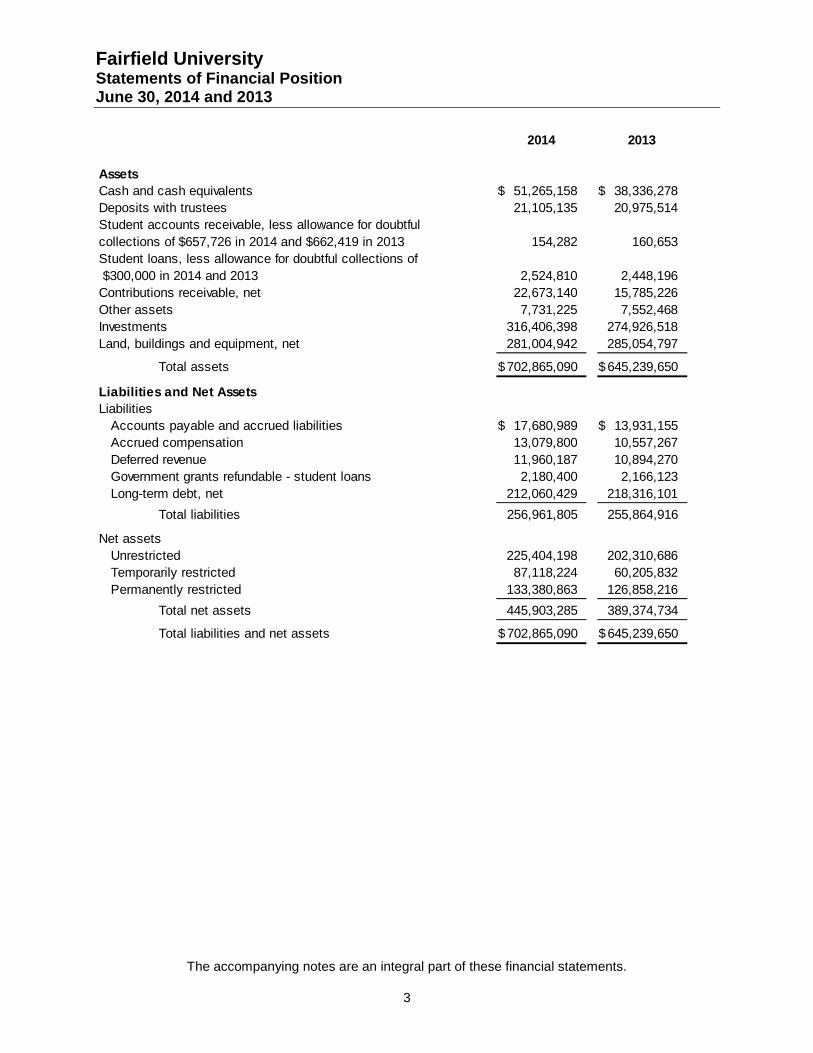
Fairfield UniversityStatements of Financial PositionJune 30, 2014 and 2013
The accompanying notes are an integral part of these financial statements.
3
2014 2013
Assets
Cash and cash equivalents 51,265,158$ 38,336,278$
Deposits with trustees 21,105,135 20,975,514
Student accounts receivable, less allowance for doubtful
collections of $657,726 in 2014 and $662,419 in 2013 154,282 160,653
Student loans, less allowance for doubtful collections of
$300,000 in 2014 and 2013 2,524,810 2,448,196
Contributions receivable, net 22,673,140 15,785,226
Other assets 7,731,225 7,552,468
Investments 316,406,398 274,926,518
Land, buildings and equipment, net 281,004,942 285,054,797
Total assets 702,865,090$ 645,239,650$
Liabilities and Net Assets
Liabilities
Accounts payable and accrued liabilities 17,680,989$ 13,931,155$
Accrued compensation 13,079,800 10,557,267
Deferred revenue 11,960,187 10,894,270
Government grants refundable - student loans 2,180,400 2,166,123
Long-term debt, net 212,060,429 218,316,101
Total liabilities 256,961,805 255,864,916
Net assets
Unrestricted 225,404,198 202,310,686
Temporarily restricted 87,118,224 60,205,832
Permanently restricted 133,380,863 126,858,216
Total net assets 445,903,285 389,374,734
Total liabilities and net assets 702,865,090$ 645,239,650$
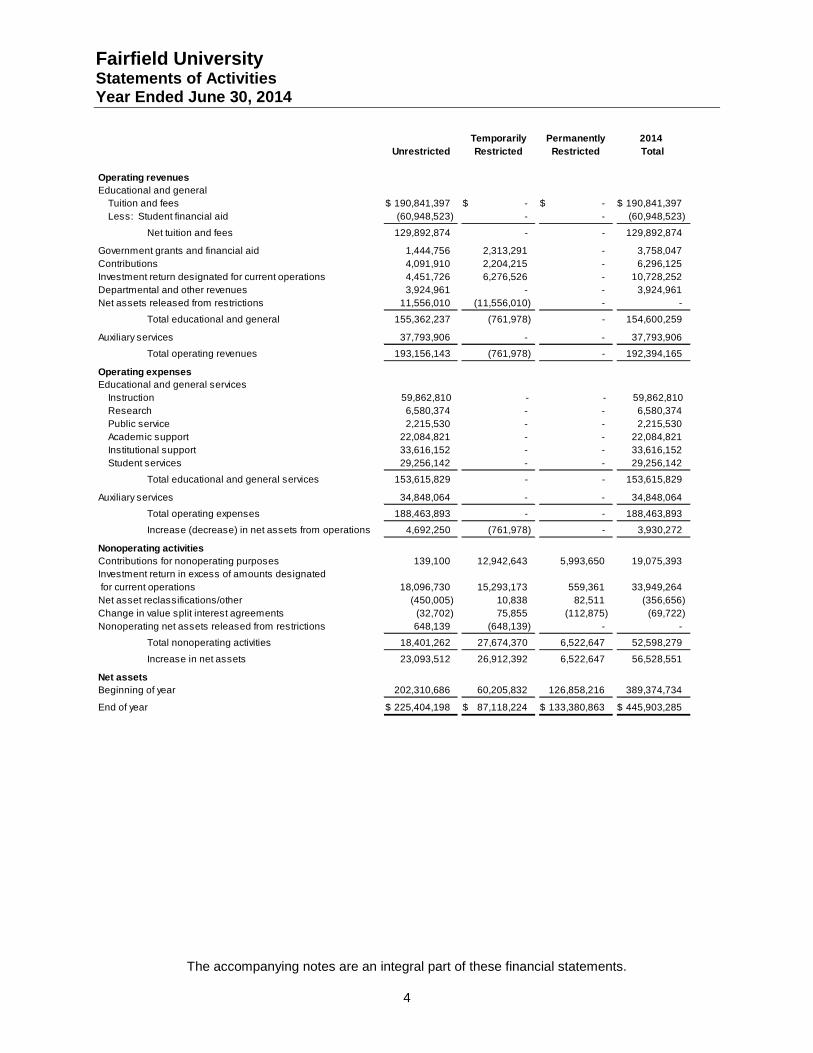
Fairfield UniversityStatements of ActivitiesYear Ended June 30, 2014
The accompanying notes are an integral part of these financial statements.
4
Temporarily Permanently 2014
Unrestricted Restricted Restricted Total
Operating revenues
Educational and general
Tuition and fees 190,841,397$ -$ -$ 190,841,397$
Less: Student financial aid (60,948,523) - - (60,948,523)
Net tuition and fees 129,892,874 - - 129,892,874
Government grants and financial aid 1,444,756 2,313,291 - 3,758,047
Contributions 4,091,910 2,204,215 - 6,296,125
Investment return designated for current operations 4,451,726 6,276,526 - 10,728,252
Departmental and other revenues 3,924,961 - - 3,924,961
Net assets released from restrictions 11,556,010 (11,556,010) - -
Total educational and general 155,362,237 (761,978) - 154,600,259
Auxiliary services 37,793,906 - - 37,793,906
Total operating revenues 193,156,143 (761,978) - 192,394,165
Operating expenses
Educational and general services
Instruction 59,862,810 - - 59,862,810
Research 6,580,374 - - 6,580,374
Public service 2,215,530 - - 2,215,530
Academic support 22,084,821 - - 22,084,821
Institutional support 33,616,152 - - 33,616,152
Student services 29,256,142 - - 29,256,142
Total educational and general services 153,615,829 - - 153,615,829
Auxiliary services 34,848,064 - - 34,848,064
Total operating expenses 188,463,893 - - 188,463,893
Increase (decrease) in net assets from operations 4,692,250 (761,978) - 3,930,272
Nonoperating activities
Contributions for nonoperating purposes 139,100 12,942,643 5,993,650 19,075,393
Investment return in excess of amounts designated
for current operations 18,096,730 15,293,173 559,361 33,949,264
Net asset reclassifications/other (450,005) 10,838 82,511 (356,656)
Change in value split interest agreements (32,702) 75,855 (112,875) (69,722)
Nonoperating net assets released from restrictions 648,139 (648,139) - -
Total nonoperating activities 18,401,262 27,674,370 6,522,647 52,598,279
Increase in net assets 23,093,512 26,912,392 6,522,647 56,528,551
Net assets
Beginning of year 202,310,686 60,205,832 126,858,216 389,374,734
End of year 225,404,198$ 87,118,224$ 133,380,863$ 445,903,285$
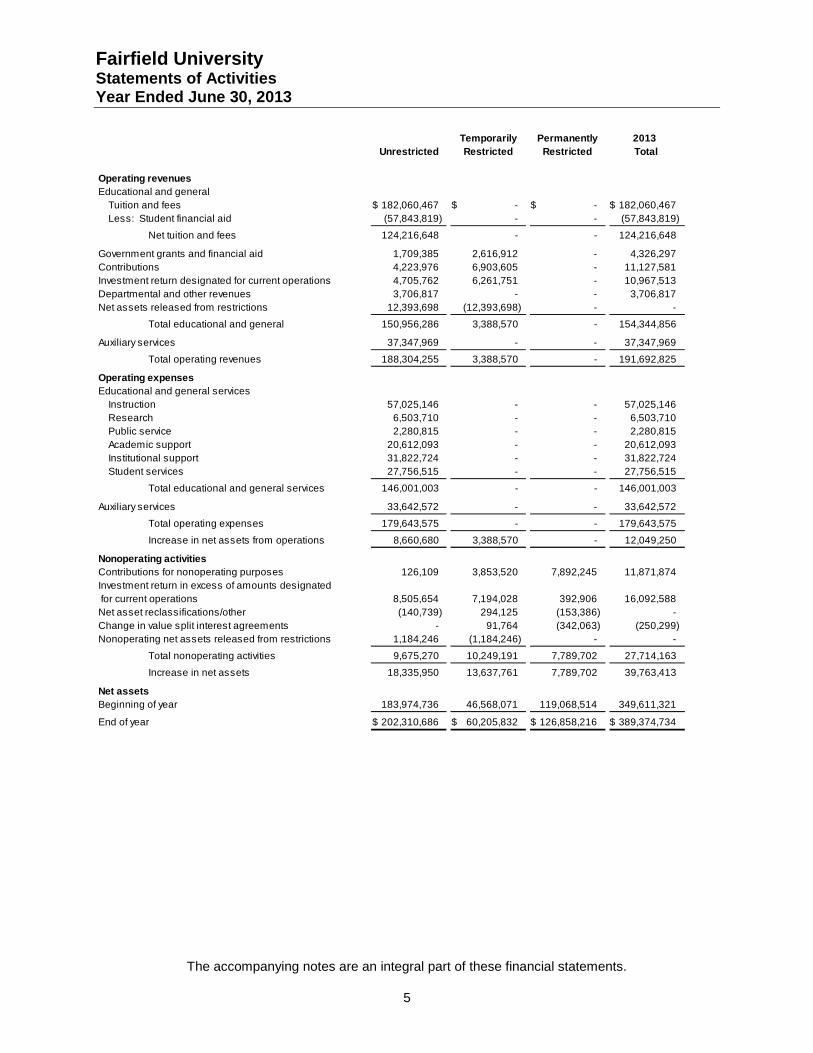
Fairfield UniversityStatements of ActivitiesYear Ended June 30, 2013
The accompanying notes are an integral part of these financial statements.
5
Temporarily Permanently 2013
Unrestricted Restricted Restricted Total
Operating revenues
Educational and general
Tuition and fees 182,060,467$ -$ -$ 182,060,467$
Less: Student financial aid (57,843,819) - - (57,843,819)
Net tuition and fees 124,216,648 - - 124,216,648
Government grants and financial aid 1,709,385 2,616,912 - 4,326,297
Contributions 4,223,976 6,903,605 - 11,127,581
Investment return designated for current operations 4,705,762 6,261,751 - 10,967,513
Departmental and other revenues 3,706,817 - - 3,706,817
Net assets released from restrictions 12,393,698 (12,393,698) - -
Total educational and general 150,956,286 3,388,570 - 154,344,856
Auxiliary services 37,347,969 - - 37,347,969
Total operating revenues 188,304,255 3,388,570 - 191,692,825
Operating expenses
Educational and general services
Instruction 57,025,146 - - 57,025,146
Research 6,503,710 - - 6,503,710
Public service 2,280,815 - - 2,280,815
Academic support 20,612,093 - - 20,612,093
Institutional support 31,822,724 - - 31,822,724
Student services 27,756,515 - - 27,756,515
Total educational and general services 146,001,003 - - 146,001,003
Auxiliary services 33,642,572 - - 33,642,572
Total operating expenses 179,643,575 - - 179,643,575
Increase in net assets from operations 8,660,680 3,388,570 - 12,049,250
Nonoperating activities
Contributions for nonoperating purposes 126,109 3,853,520 7,892,245 11,871,874
Investment return in excess of amounts designated
for current operations 8,505,654 7,194,028 392,906 16,092,588
Net asset reclassifications/other (140,739) 294,125 (153,386) -
Change in value split interest agreements - 91,764 (342,063) (250,299)
Nonoperating net assets released from restrictions 1,184,246 (1,184,246) - -
Total nonoperating activities 9,675,270 10,249,191 7,789,702 27,714,163
Increase in net assets 18,335,950 13,637,761 7,789,702 39,763,413
Net assets
Beginning of year 183,974,736 46,568,071 119,068,514 349,611,321
End of year 202,310,686$ 60,205,832$ 126,858,216$ 389,374,734$
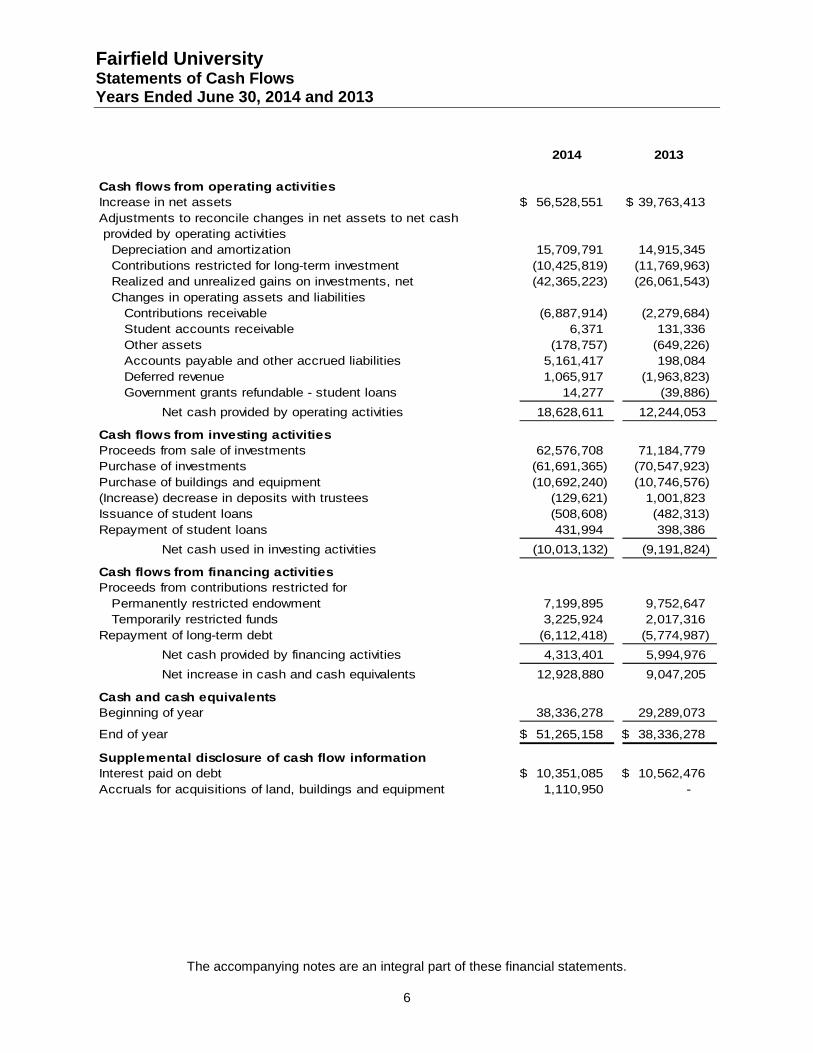
Fairfield UniversityStatements of Cash FlowsYears Ended June 30, 2014 and 2013
The accompanying notes are an integral part of these financial statements.
6
2014 2013
Cash flows from operating activities
Increase in net assets 56,528,551$ 39,763,413$
Adjustments to reconcile changes in net assets to net cash
provided by operating activities
Depreciation and amortization 15,709,791 14,915,345
Contributions restricted for long-term investment (10,425,819) (11,769,963)
Realized and unrealized gains on investments, net (42,365,223) (26,061,543)
Changes in operating assets and liabilities
Contributions receivable (6,887,914) (2,279,684)
Student accounts receivable 6,371 131,336
Other assets (178,757) (649,226)
Accounts payable and other accrued liabilities 5,161,417 198,084
Deferred revenue 1,065,917 (1,963,823)
Government grants refundable - student loans 14,277 (39,886)
Net cash provided by operating activities 18,628,611 12,244,053
Cash flows from investing activities
Proceeds from sale of investments 62,576,708 71,184,779
Purchase of investments (61,691,365) (70,547,923)
Purchase of buildings and equipment (10,692,240) (10,746,576)
(Increase) decrease in deposits with trustees (129,621) 1,001,823
Issuance of student loans (508,608) (482,313)
Repayment of student loans 431,994 398,386
Net cash used in investing activities (10,013,132) (9,191,824)
Cash flows from financing activities
Proceeds from contributions restricted for
Permanently restricted endowment 7,199,895 9,752,647
Temporarily restricted funds 3,225,924 2,017,316
Repayment of long-term debt (6,112,418) (5,774,987)
Net cash provided by financing activities 4,313,401 5,994,976
Net increase in cash and cash equivalents 12,928,880 9,047,205
Cash and cash equivalents
Beginning of year 38,336,278 29,289,073
End of year 51,265,158$ 38,336,278$
Supplemental disclosure of cash flow information
Interest paid on debt 10,351,085$ 10,562,476$
Accruals for acquisitions of land, buildings and equipment 1,110,950 -

Fairfield UniversityNotes to Financial StatementsJune 30, 2014 and 2013
7
1. Summary of Significant Accounting Policies
BackgroundFounded in 1942, Fairfield University is a private, Jesuit institution that provides undergraduate,graduate and continuing studies in five distinct schools to its students. The accompanying financialstatements, which include the accounts of Fairfield University and its Preparatory School (the“University”), which together are a 501(c)(3) tax-exempt institution, have been prepared on theaccrual basis and in conformity with accounting principles generally accepted in the United Statesof America (“GAAP”).
Basis of Presentation
GeneralNet assets, revenues, gains and losses are classified based on the existence or absence ofdonor-imposed restrictions. Accordingly, net assets and changes therein are classified as follows:
Permanently restricted net assets – Net assets subject to donor-imposed stipulations that theybe maintained permanently by the University. Generally, the donor of these assets permitsthe University to use all or part of the return on the related investments.
Temporarily restricted net assets – Net assets subject to donor-imposed stipulations that willbe met by actions of the University or the passage of time.
Unrestricted net assets – Net assets not subject to donor-imposed stipulations.
Revenues are reported as increases in unrestricted net assets unless use of the related assets islimited by donor-imposed restrictions. Expenses are reported as decreases in unrestricted netassets. Gains and losses on investments and other assets or liabilities are reported as increasesor decreases in unrestricted net assets unless their use is restricted by explicit donor stipulations orlaw. Expirations of temporary restrictions on net assets, that is, the donor-imposed stipulatedpurpose has been accomplished or the stipulated time period has elapsed, are reported as netassets released from restrictions. Donor contributions restricted for capital expenditures arereleased to unrestricted net assets when the assets are placed in service and time restrictions havebeen met.
Contributions ReceivableContributions, including unconditional promises to give, are recognized as revenues in the periodreceived at their fair value. Promises to give that are scheduled to be received after the date of thestatement of financial position are shown as increases in temporarily restricted net assets and arereleased to unrestricted net assets when the purpose or time restrictions are met. Promises to givesubject to donor-imposed stipulations that the Corpus be maintained permanently are recognizedas increases in permanently restricted net assets.
Conditional promises to give are not recognized until they become unconditional, that is, when theconditions on which they depend are substantially met. Contributions of assets other than cash arerecorded at their estimated fair value. Contributions to be received after one year are discountedbased upon a risk free interest rate. Amortization of the discount is recorded as additionalcontribution revenue in accordance with the donor-imposed restrictions, if any, on the contributions.
Fairfield UniversityNotes to Financial StatementsJune 30, 2014 and 2013
8
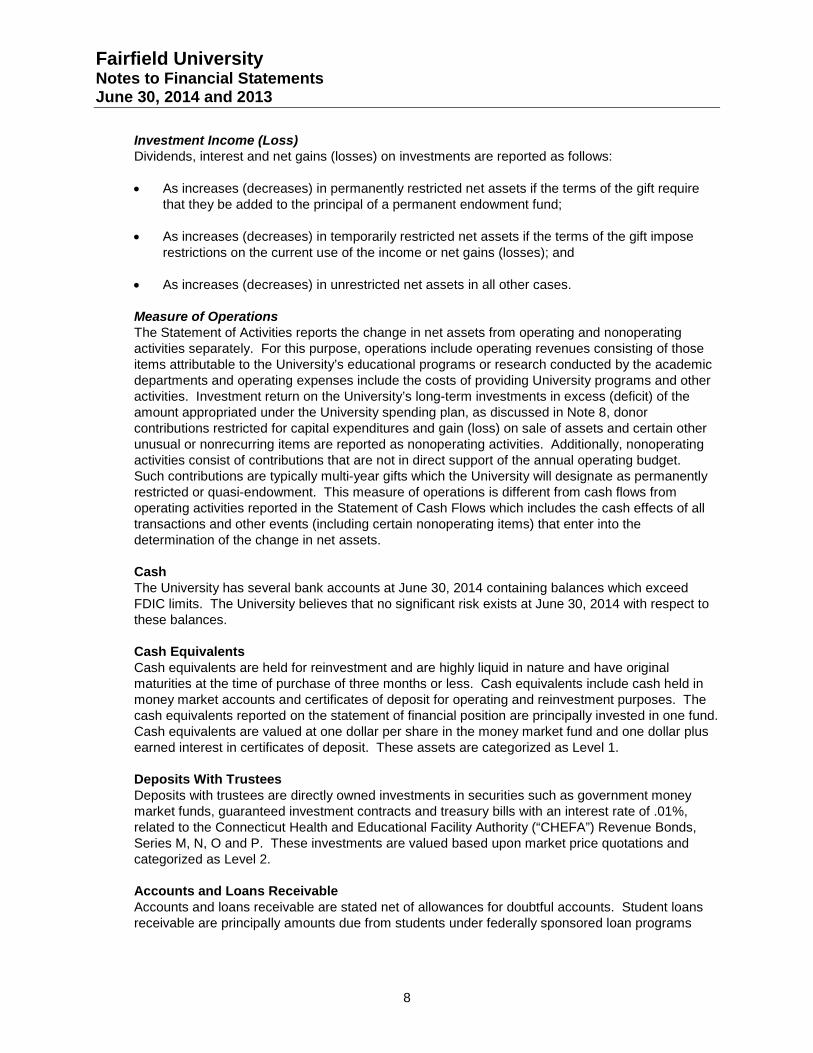
Investment Income (Loss)Dividends, interest and net gains (losses) on investments are reported as follows:
As increases (decreases) in permanently restricted net assets if the terms of the gift requirethat they be added to the principal of a permanent endowment fund;
As increases (decreases) in temporarily restricted net assets if the terms of the gift imposerestrictions on the current use of the income or net gains (losses); and
As increases (decreases) in unrestricted net assets in all other cases.
Measure of OperationsThe Statement of Activities reports the change in net assets from operating and nonoperatingactivities separately. For this purpose, operations include operating revenues consisting of thoseitems attributable to the University’s educational programs or research conducted by the academicdepartments and operating expenses include the costs of providing University programs and otheractivities. Investment return on the University’s long-term investments in excess (deficit) of theamount appropriated under the University spending plan, as discussed in Note 8, donorcontributions restricted for capital expenditures and gain (loss) on sale of assets and certain otherunusual or nonrecurring items are reported as nonoperating activities. Additionally, nonoperatingactivities consist of contributions that are not in direct support of the annual operating budget.Such contributions are typically multi-year gifts which the University will designate as permanentlyrestricted or quasi-endowment. This measure of operations is different from cash flows fromoperating activities reported in the Statement of Cash Flows which includes the cash effects of alltransactions and other events (including certain nonoperating items) that enter into thedetermination of the change in net assets.
CashThe University has several bank accounts at June 30, 2014 containing balances which exceedFDIC limits. The University believes that no significant risk exists at June 30, 2014 with respect tothese balances.
Cash EquivalentsCash equivalents are held for reinvestment and are highly liquid in nature and have originalmaturities at the time of purchase of three months or less. Cash equivalents include cash held inmoney market accounts and certificates of deposit for operating and reinvestment purposes. Thecash equivalents reported on the statement of financial position are principally invested in one fund.Cash equivalents are valued at one dollar per share in the money market fund and one dollar plusearned interest in certificates of deposit. These assets are categorized as Level 1.
Deposits With TrusteesDeposits with trustees are directly owned investments in securities such as government moneymarket funds, guaranteed investment contracts and treasury bills with an interest rate of .01%,related to the Connecticut Health and Educational Facility Authority (“CHEFA”) Revenue Bonds,Series M, N, O and P. These investments are valued based upon market price quotations andcategorized as Level 2.
Accounts and Loans ReceivableAccounts and loans receivable are stated net of allowances for doubtful accounts. Student loansreceivable are principally amounts due from students under federally sponsored loan programs
Fairfield UniversityNotes to Financial StatementsJune 30, 2014 and 2013
9
which are subject to significant restrictions. Accordingly, it is not practicable to determine the fairvalue of such amounts.
Fair Value AccountingThe University records its applicable assets and liabilities at fair value. Fair value is defined as theprice that would be received to sell an asset or paid to transfer a liability (i.e. “exit price”) in anorderly transaction between market participants at the measurement date.
GAAP establishes a fair value hierarchy that prioritizes the inputs to valuation techniques used tomeasure fair value. The hierarchy gives the highest priority to unadjusted quoted prices in activemarkets for identical assets or liabilities (Level 1 measurements) and the lowest priority tounobservable inputs (Level 3 measurements). The three Levels of the fair value hierarchy underGAAP are as follows:
Level 1 Inputs that reflect unadjusted quoted prices in active market for identical assets orliabilities that the University has the ability to access at the measurement date.
Level 2 Inputs other than quoted prices that are observable for the asset or liability eitherdirectly or indirectly, including inputs in markets that are not considered to be active.
Level 3 Inputs that are unobservable.
Inputs are used in applying the various valuation techniques and broadly refer to the assumptionsthat market participants use to make valuation decisions, including assumptions about risk. Inputsmay include price information, volatility statistics, specific and broad credit data, liquidity statistics,and other factors. A financial instrument’s Level within the fair value hierarchy is based on thelowest Level of any input that is significant to the fair value measurement; however, thedetermination of what constitutes “observable” requires significant judgment. The Universityconsiders observable data to be that market data which is readily available, regularly distributed orupdated, reliable and verifiable, not proprietary, and provided by independent sources that areactively involved in the relevant market. The categorization of a financial instrument within thehierarchy is based upon the pricing transparency of the instrument and does not necessarilycorrespond to the University’s perceived risk of that instrument.
The availability of observable inputs can vary from product to product and is affected by a widevariety of factors, including for example, the type of product, whether the product is new and not yetestablished in the marketplace, the liquidity of markets and other characteristics particular to thetransaction. To the extent that valuation is based on models or inputs that are less observable orunobservable in the market, the determination of fair value requires more judgment. Accordingly,the degree of judgment exercised by the University in determining fair value is greatest forinstruments categorized in Level 3.
In certain cases, the inputs used to measure fair value may fall into different Levels of the fair valuehierarchy. In such cases, for disclosure purposes, the Level in the fair value hierarchy within whichthe fair value measurement falls in its entirety is determined based on the lowest Level input that issignificant to the fair value measurement in its entirety.
In determining an instrument’s placement within the hierarchy, the University separates theinvestment portfolio and other fair valued assets and liabilities into the following categories: cashequivalents, deposits with trustees, Corporate stocks, fixed income securities, private equity andother funds, equity funds, bond funds, hedge fund of funds, and multi-asset strategy funds.
Fairfield UniversityNotes to Financial StatementsJune 30, 2014 and 2013
10
The University utilizes the “practical expedient” to estimate the fair value of investments in variousinvestment funds that have a calculated value of their capital account or net asset value (NAV) inaccordance with, or in a manner consistent with GAAP whereby there is limited market activity.The practical expedient is permitted under GAAP to estimate the fair value of an investment at themeasurement date using the reported NAV without further adjustment unless the entity expects tosell the investment at a value other than NAV or if the NAV is not calculated in accordance withGAAP.
The University performs additional procedures including due diligence reviews on its investments ininvestment companies and other procedures with respect to the capital account or NAV provided toensure conformity with GAAP. The University has assessed factors including, but not limited to,managers’ compliance with fair value measurement standard, price transparency and valuationprocedures in place, the ability to redeem at NAV at the measurement date, and existence ofcertain redemption restrictions at the measurement date.
The guidance also requires additional disclosures to enable the user of the financial statements tounderstand the nature and risk of the University’s financial statements (Note 3). Furthermore,investments which can be redeemed at NAV by the University on the measurement date or in thenear term are classified as Level 2. Investments which cannot be redeemed on the measurementdate or in the near term are classified as Level 3.
There were no transfers in and out of Levels 1 and 2 in 2014 and all other disclosures are includedin Note 6.
InvestmentsInvestments are reflected in the financial statements at fair value. Quoted market prices are usedto value short-term investments, fixed income securities, and equity securities. Values forinvestments in limited partnerships, which are generally subject to certain withdrawal restrictions,are provided by the general partner, and may be based on historical cost, appraisals, obtainableprices for similar assets, or other estimates. Because of the inherent uncertainty of the valuationfor the University’s investments in investment partnerships and for certain underlying investmentsheld by the investment partnerships, values for those investments may differ significantly fromvalues that would have been used had a ready market for the investments existed. Unrealizedgains or losses are determined by comparison of cost to fair value at the beginning and end of thereporting period. Purchases and sales of securities are reflected on a trade-date basis. Gains orlosses on sales of securities are based on average cost.
Corporate StocksCorporate stocks include investments in actively traded equity securities and exchangetraded funds which are listed on a national exchange are valued at the last price quoted bythe exchange and are generally categorized as Level 1. The fair values of other equitysecurities are based upon market price quotations, and are generally categorized as Level 1.
Fixed Income SecuritiesFixed income securities include investments in various U.S. treasury instruments, Corporatedebt, structured products (such as mortgage-backed securities and asset-backed securities,and bank debt). Fixed income securities values are estimated based upon market pricequotations and are generally categorized as Level 2 because there is the ability to redeem ator near June 30, 2014.
Fairfield UniversityNotes to Financial StatementsJune 30, 2014 and 2013
11
Private Equity and OtherPrivate equity and other include equity positions in a variety of private equity funds withvarious strategies, private real estate funds that hold real property holdings, and directinvestments in real estate funds through partnership interests. These securities are valuedby the investment managers and the NAVs are recorded under GAAP utilizing the practicalexpedient. There are no active markets or significant observable data and are, therefore,categorized as Level 3.
Equity Funds (Registered and Nonregistered)Equities in investment funds include mutual funds (registered under the Investors’ 1940 Act)and hedge funds (nonregistered under the Investors’ 1940 Act). Mutual funds are principallyinvested in exchange traded securities. These hedge funds are invested principally inexchange traded and over the counter securities. The University has opted to utilize theNAV practical expedient for valuing hedge fund investments. Five of these investments arecategorized as Level 2 because there is the ability to redeem at or near June 30, 2014. Twoof these investments are categorized as Level 3 because there is no ability to redeem at ornear June 30, 2014.
Bond Funds (Registered)Bonds in investment funds include mutual funds (registered under the Investors’ 1940 Act).Mutual funds are principally invested in fixed income securities and trade in over the countermarket. These securities are valued by the investment manager and NAVs are recordedunder GAAP utilizing the practical expedient. These investments are categorized as Level 2because there is the ability to redeem at or near June 30, 2014.
Hedge Fund of FundsHedge fund of funds are nonregistered funds whereby the investment managers areinvesting in various underlying hedge funds that principally invest in exchange traded andover the counter securities. These securities are valued by the investment manager andNAVs are recorded under GAAP utilizing the practical expedient. Two of these investmentsare categorized as Level 3 because there is no ability to redeem at or near June 30, 2014.One of these investments is categorized as Level 2 because there is the ability to redeem ator near June 30, 2014.
Multi Asset Strategy FundsMulti asset fund is an investment in a hedge fund (nonregistered under the Investors’ 1940Act) with a multi-strategy approach. These securities are valued by the investment managerand the NAVs are recorded under GAAP utilizing the practical expedient. This investment iscategorized as Level 2 because there is the ability to redeem at or near June 30, 2014.
Land, Buildings and EquipmentLand, buildings and equipment, net is stated at cost less accumulated depreciation, computed on astraight-line basis over the estimated useful lives of buildings (40-60 years), building improvements(15-30 years) and equipment and library books (3-7 years). Depreciation expense is $15,853,045and $15,290,245 for the years ended June 30, 2014 and 2013, respectively. The Universityrecognized $89,638 and $109,748 of expenses relating to the accretion of liabilities associated withthe retirement of long-lived assets, for the years ended June 30, 2014 and 2013, respectively.Conditional asset retirement obligations included in accrued liabilities are $2,943,081 and$2,853,443 as of June 30, 2014 and 2013, respectively.
Fairfield UniversityNotes to Financial StatementsJune 30, 2014 and 2013
12
Tuition and FeesThe University recognizes revenues from student tuition and fees predominantly within the fiscalyear in which the academic term is conducted. Therefore, student advance payments for tuition,room and board are deferred and then recorded as unrestricted revenues when earned.
Government Grants and Financial AidRevenues associated with Government grants for educational purposes and contracts arerecognized as the related direct costs are incurred and are accounted for in unrestricted net assets.The University records reimbursement of indirect costs relating to such grants and financial aidcontracts at authorized rates for each fiscal year as unrestricted revenue.
Allocation of Certain ExpensesThe financial statements report expenses by functional classification. Certain natural expensesassociated with the operation and maintenance of University plant assets are allocated to therespective functional classifications based on square footage occupancy. The expenses areallocated as follows for the years ended June 30:
Included in institutional support expenses are fund raising costs of $5,411,957 and $4,883,357 infiscal 2014 and 2013, respectively.
New Authoritative Accounting PronouncementsIn October 2012, the FASB issued ASU No.2012-05, Statement of Cash Flows (Topic 230): Not-for-Profit Entities: Classification of the Sale Proceeds of Donated Financial Assets in the Statementof Cash Flows (a consensus of the FASB EITF). This guidance requires not-for-profit entities toclassify cash receipts from the sale of donated financial assets consistently with cash donationsreceived in the statement of cash flows if those cash receipts were from the sale of donatedfinancial assets that upon receipt were directed without any not-for-profit entity imposed limitationsfor sale and were converted nearly immediately into cash. Accordingly, the cash receipts from thesale of those financial assets should be classified as cash inflows from operating activities, unlessthe donor restricted the use of the contributed resources to long-term purposed, in which casethose cash receipts from the sale of donated financial assets should be classified as cash flowsfrom financing activities. Otherwise, cash receipts from the sale of donated financial assets shouldbe classified as cash flows from investing activities by the not-for-profit entity. The guidance iseffective prospectively (with retrospective application permitted) for fiscal years beginning afterJune 15, 2013, and early adoption is permitted. The University adopted this in fiscal 2014.
Use of EstimatesThe preparation of financial statements in conformity with GAAP requires management to makeestimates and assumptions that affect the reported amounts of assets and liabilities and disclosureof contingent assets and liabilities at the date of the financial statements and the reported amountsof revenues and expenses during the reporting period. The most significant estimates includevaluation of investments, allowance for doubtful accounts on student accounts and loanreceivables, and asset retirement obligations. Actual results could differ from those estimates.
2014 2013
Plant operations and maintenance 16,217,546$ 15,291,372$
Depreciation 15,853,045 15,290,246
Interest on indebtedness 10,295,279 10,275,023
Fairfield UniversityNotes to Financial StatementsJune 30, 2014 and 2013
13
Subsequent EventsThe University has performed an evaluation of subsequent events through October 6, 2014, whichis the date the financial statements were issued.
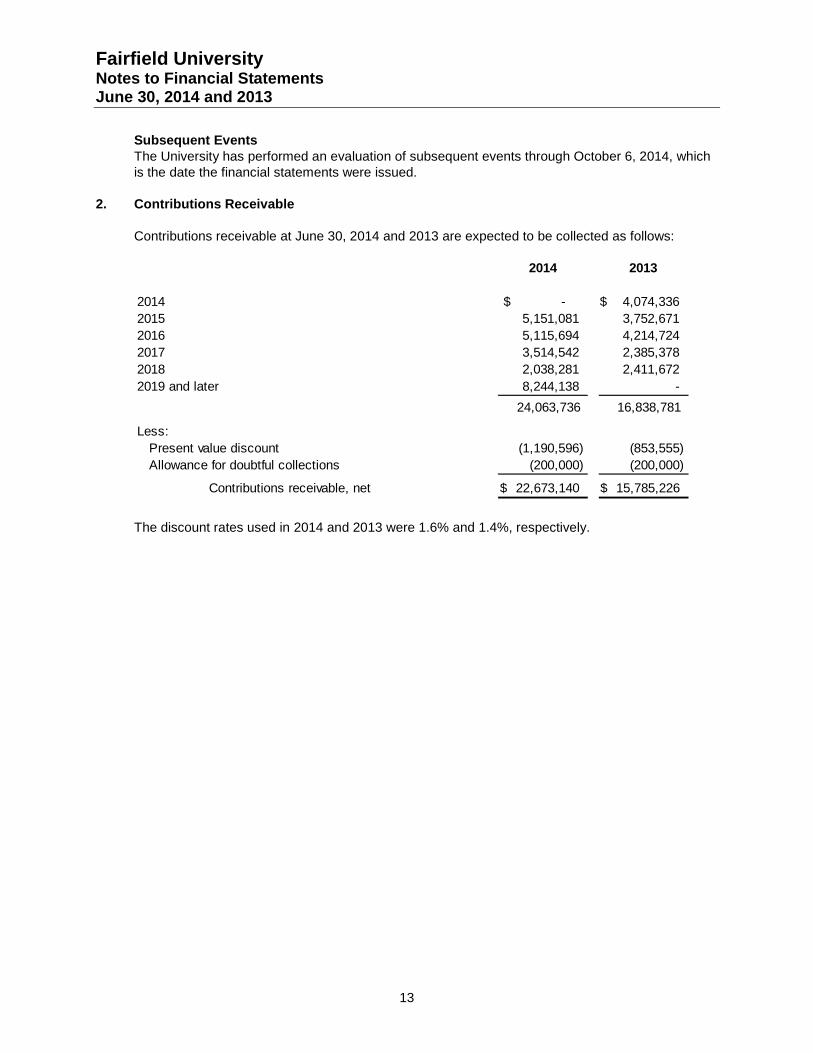
2. Contributions Receivable
Contributions receivable at June 30, 2014 and 2013 are expected to be collected as follows:
2014 2013
2014 -$ 4,074,336$
2015 5,151,081 3,752,671
2016 5,115,694 4,214,724
2017 3,514,542 2,385,378
2018 2,038,281 2,411,672
2019 and later 8,244,138 -
24,063,736 16,838,781
Less:
Present value discount (1,190,596) (853,555)
Allowance for doubtful collections (200,000) (200,000)
Contributions receivable, net 22,673,140$ 15,785,226$
The discount rates used in 2014 and 2013 were 1.6% and 1.4%, respectively.
Fairfield UniversityNotes to Financial StatementsJune 30, 2014 and 2013
14
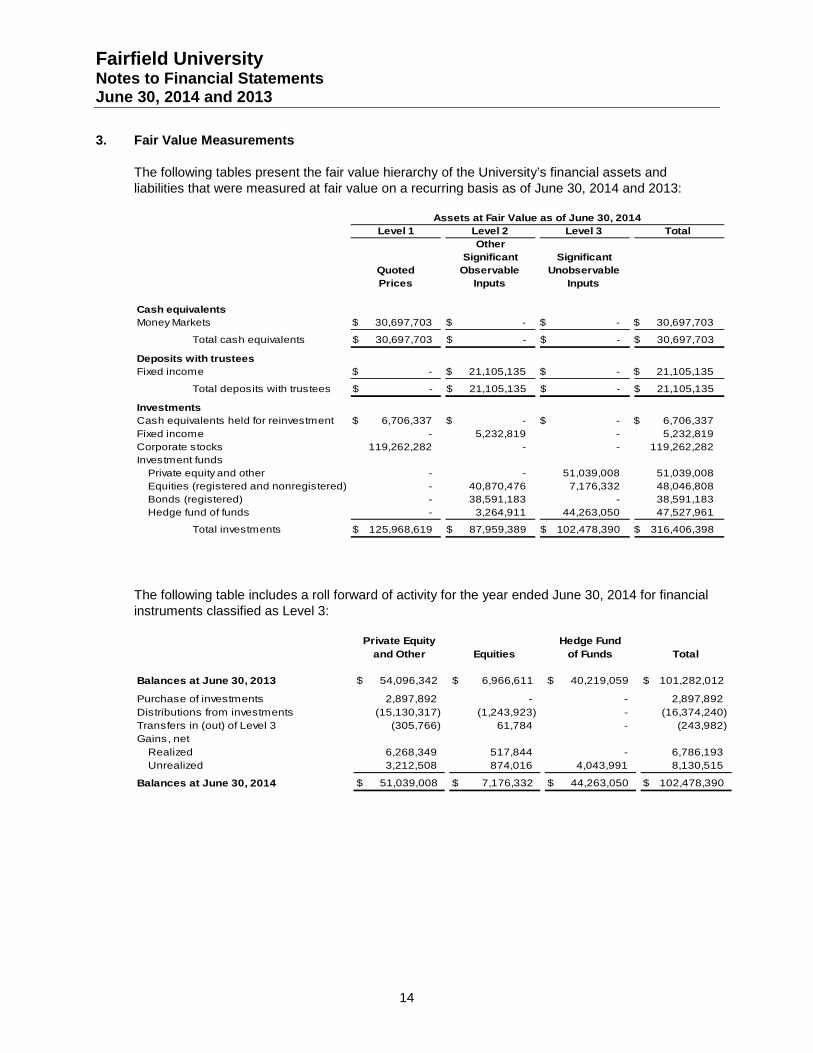
3. Fair Value Measurements
The following tables present the fair value hierarchy of the University’s financial assets andliabilities that were measured at fair value on a recurring basis as of June 30, 2014 and 2013:
Level 1 Level 2 Level 3 Total
Other
Significant Significant
Quoted Observable Unobservable
Prices Inputs Inputs
Cash equivalents
Money Markets 30,697,703$ -$ -$ 30,697,703$
Total cash equivalents 30,697,703$ -$ -$ 30,697,703$
Deposits with trustees
Fixed income -$ 21,105,135$ -$ 21,105,135$
Total deposits with trustees -$ 21,105,135$ -$ 21,105,135$
Investments
Cash equivalents held for reinvestment 6,706,337$ -$ -$ 6,706,337$
Fixed income - 5,232,819 - 5,232,819
Corporate stocks 119,262,282 - - 119,262,282
Investment funds
Private equity and other - - 51,039,008 51,039,008
Equities (registered and nonregistered) - 40,870,476 7,176,332 48,046,808
Bonds (registered) - 38,591,183 - 38,591,183
Hedge fund of funds - 3,264,911 44,263,050 47,527,961
Total investments 125,968,619$ 87,959,389$ 102,478,390$ 316,406,398$
Assets at Fair Value as of June 30, 2014
The following table includes a roll forward of activity for the year ended June 30, 2014 for financialinstruments classified as Level 3:
Private Equity Hedge Fund
and Other Equities of Funds Total
Balances at June 30, 2013 54,096,342$ 6,966,611$ 40,219,059$ 101,282,012$
Purchase of investments 2,897,892 - - 2,897,892
Distributions from investments (15,130,317) (1,243,923) - (16,374,240)
Transfers in (out) of Level 3 (305,766) 61,784 - (243,982)
Gains, net
Realized 6,268,349 517,844 - 6,786,193
Unrealized 3,212,508 874,016 4,043,991 8,130,515
Balances at June 30, 2014 51,039,008$ 7,176,332$ 44,263,050$ 102,478,390$
Fairfield UniversityNotes to Financial StatementsJune 30, 2014 and 2013
15
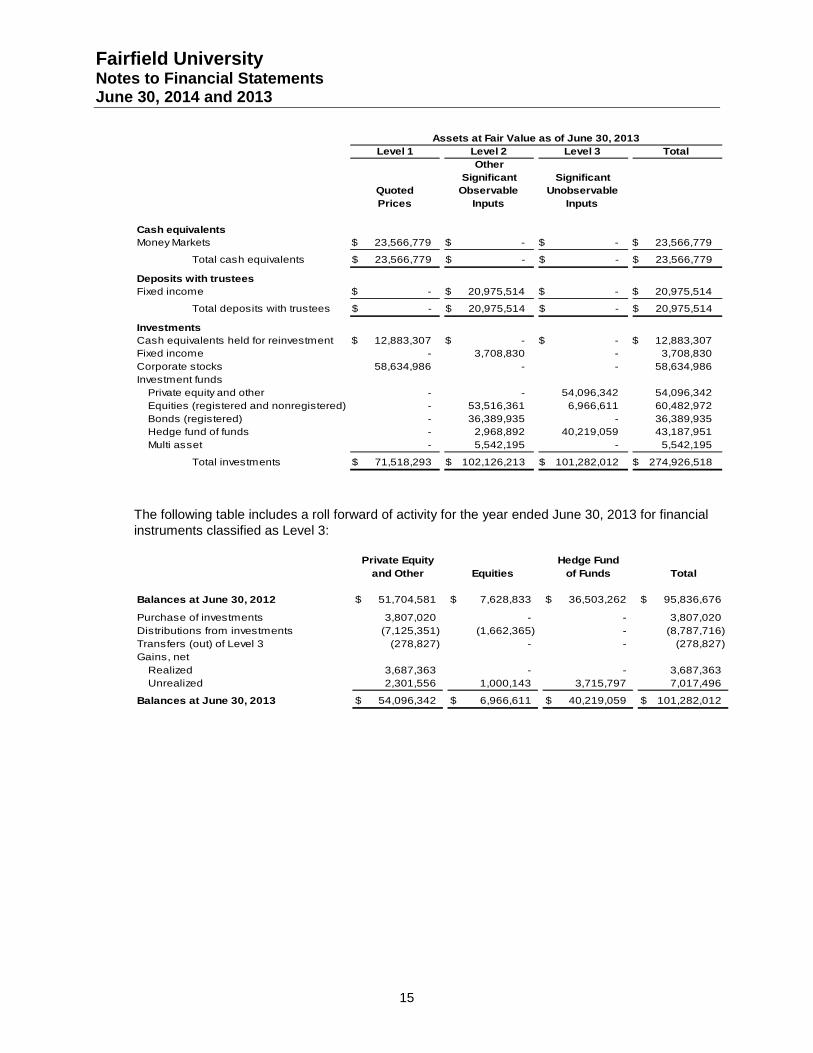
Level 1 Level 2 Level 3 Total
Other
Significant Significant
Quoted Observable Unobservable
Prices Inputs Inputs
Cash equivalents
Money Markets 23,566,779$ -$ -$ 23,566,779$
Total cash equivalents 23,566,779$ -$ -$ 23,566,779$
Deposits with trustees
Fixed income -$ 20,975,514$ -$ 20,975,514$
Total deposits with trustees -$ 20,975,514$ -$ 20,975,514$
Investments
Cash equivalents held for reinvestment 12,883,307$ -$ -$ 12,883,307$
Fixed income - 3,708,830 - 3,708,830
Corporate stocks 58,634,986 - - 58,634,986
Investment funds
Private equity and other - - 54,096,342 54,096,342
Equities (registered and nonregistered) - 53,516,361 6,966,611 60,482,972
Bonds (registered) - 36,389,935 - 36,389,935
Hedge fund of funds - 2,968,892 40,219,059 43,187,951
Multi asset - 5,542,195 - 5,542,195
Total investments 71,518,293$ 102,126,213$ 101,282,012$ 274,926,518$
Assets at Fair Value as of June 30, 2013
The following table includes a roll forward of activity for the year ended June 30, 2013 for financialinstruments classified as Level 3:
Private Equity Hedge Fund
and Other Equities of Funds Total
Balances at June 30, 2012 51,704,581$ 7,628,833$ 36,503,262$ 95,836,676$
Purchase of investments 3,807,020 - - 3,807,020
Distributions from investments (7,125,351) (1,662,365) - (8,787,716)
Transfers (out) of Level 3 (278,827) - - (278,827)
Gains, net
Realized 3,687,363 - - 3,687,363
Unrealized 2,301,556 1,000,143 3,715,797 7,017,496
Balances at June 30, 2013 54,096,342$ 6,966,611$ 40,219,059$ 101,282,012$
Fairfield UniversityNotes to Financial StatementsJune 30, 2014 and 2013
16
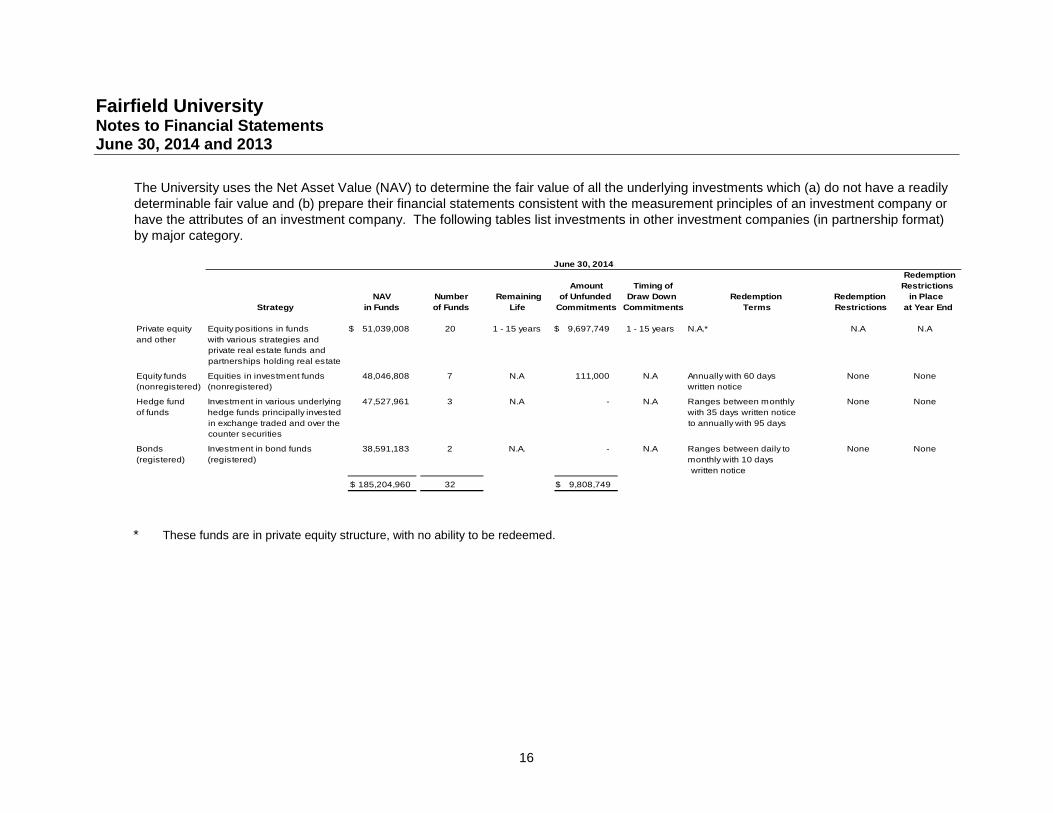
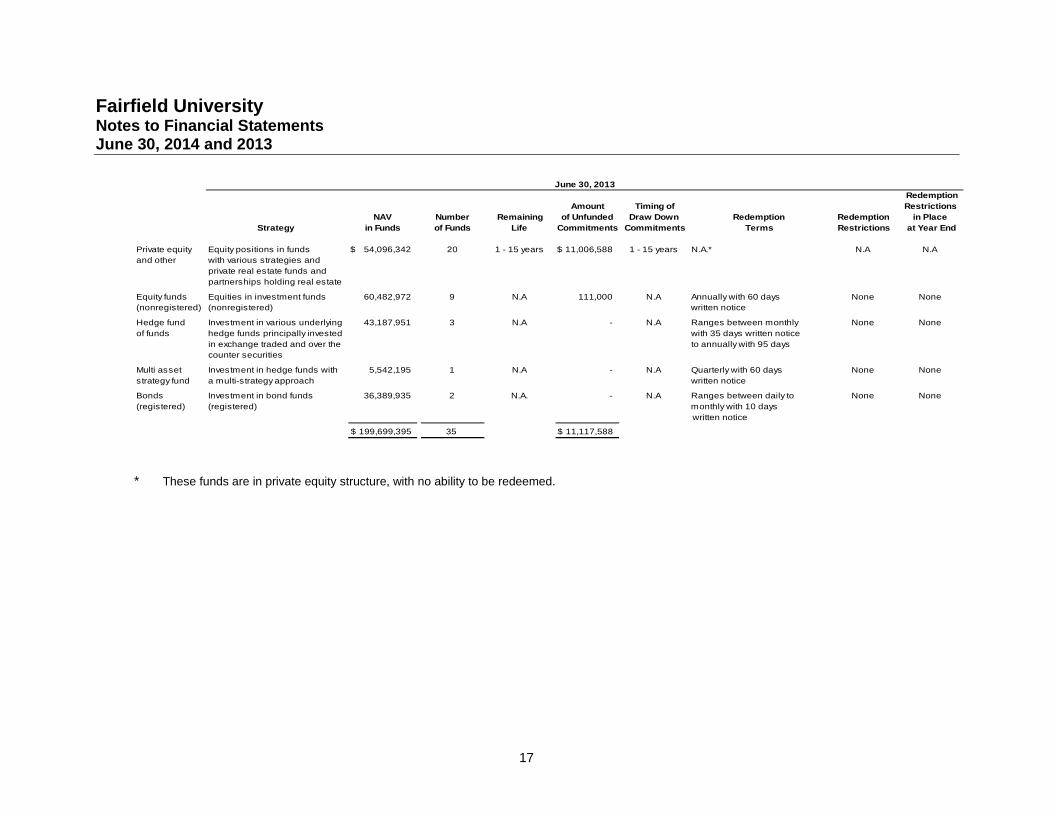
The University uses the Net Asset Value (NAV) to determine the fair value of all the underlying investments which (a) do not have a readilydeterminable fair value and (b) prepare their financial statements consistent with the measurement principles of an investment company orhave the attributes of an investment company. The following tables list investments in other investment companies (in partnership format)by major category.
Redemption
Amount Timing of Restrictions
NAV Number Remaining of Unfunded Draw Down Redemption Redemption in Place
Strategy in Funds of Funds Life Commitments Commitments Terms Restrictions at Year End
Private equity Equity positions in funds 51,039,008$ 20 1 - 15 years 9,697,749$ 1 - 15 years N.A.* N.A N.A
and other with various strategies and
private real estate funds and
partnerships holding real estate
Equity funds Equities in investment funds 48,046,808 7 N.A 111,000 N.A Annually with 60 days None None
(nonregistered) (nonregistered) written notice
Hedge fund Investment in various underlying 47,527,961 3 N.A - N.A Ranges between monthly None None
of funds hedge funds principally invested with 35 days written notice
in exchange traded and over the to annually with 95 days
counter securities
Bonds Investment in bond funds 38,591,183 2 N.A. - N.A Ranges between daily to None None
(registered) (registered) monthly with 10 days
written notice
185,204,960$ 32 9,808,749$
June 30, 2014
* These funds are in private equity structure, with no ability to be redeemed.
Fairfield UniversityNotes to Financial StatementsJune 30, 2014 and 2013
17
Redemption
Amount Timing of Restrictions
NAV Number Remaining of Unfunded Draw Down Redemption Redemption in Place
Strategy in Funds of Funds Life Commitments Commitments Terms Restrictions at Year End
Private equity Equity positions in funds 54,096,342$ 20 1 - 15 years 11,006,588$ 1 - 15 years N.A.* N.A N.A
and other with various strategies and
private real estate funds and
partnerships holding real estate
Equity funds Equities in investment funds 60,482,972 9 N.A 111,000 N.A Annually with 60 days None None
(nonregistered) (nonregistered) written notice
Hedge fund Investment in various underlying 43,187,951 3 N.A - N.A Ranges between monthly None None
of funds hedge funds principally invested with 35 days written notice
in exchange traded and over the to annually with 95 days
counter securities
Multi asset Investment in hedge funds with 5,542,195 1 N.A - N.A Quarterly with 60 days None None
strategy fund a multi-strategy approach written notice
Bonds Investment in bond funds 36,389,935 2 N.A. - N.A Ranges between daily to None None
(registered) (registered) monthly with 10 days
written notice
199,699,395$ 35 11,117,588$
June 30, 2013
* These funds are in private equity structure, with no ability to be redeemed.
Fairfield UniversityNotes to Financial StatementsJune 30, 2014 and 2013
18
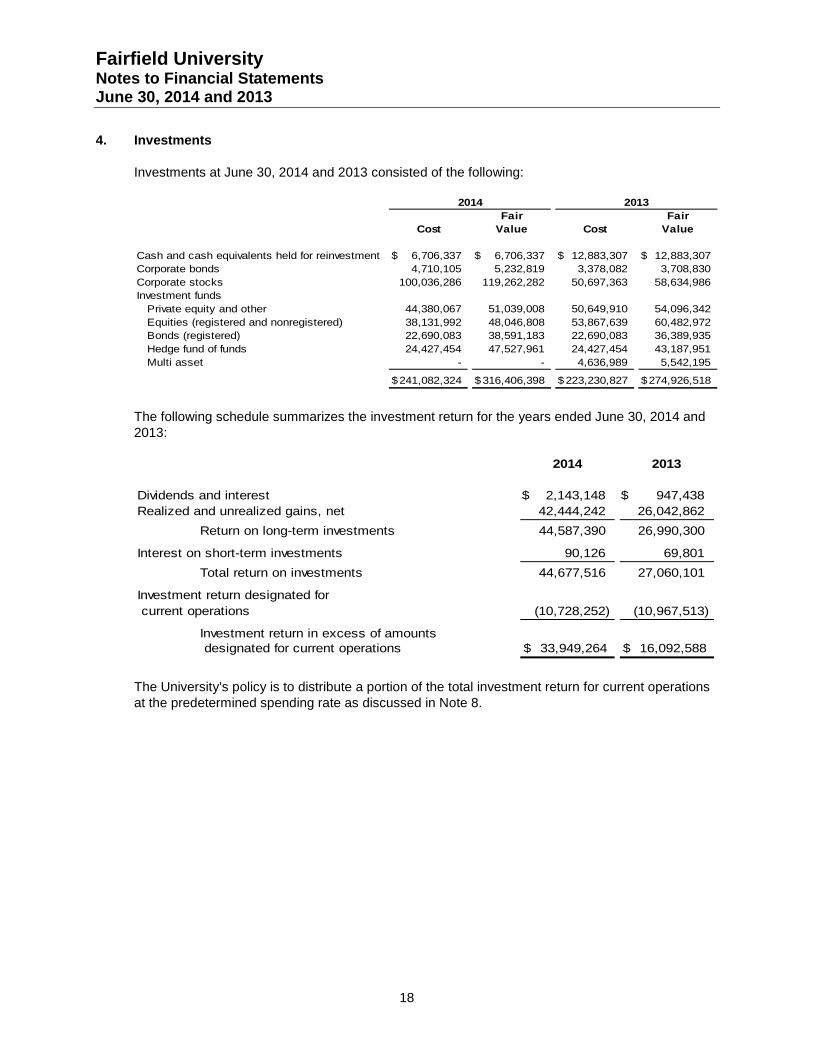
4. Investments
Investments at June 30, 2014 and 2013 consisted of the following:
Fair Fair
Cost Value Cost Value
Cash and cash equivalents held for reinvestment 6,706,337$ 6,706,337$ 12,883,307$ 12,883,307$
Corporate bonds 4,710,105 5,232,819 3,378,082 3,708,830
Corporate stocks 100,036,286 119,262,282 50,697,363 58,634,986
Investment funds
Private equity and other 44,380,067 51,039,008 50,649,910 54,096,342
Equities (registered and nonregistered) 38,131,992 48,046,808 53,867,639 60,482,972
Bonds (registered) 22,690,083 38,591,183 22,690,083 36,389,935
Hedge fund of funds 24,427,454 47,527,961 24,427,454 43,187,951
Multi asset - - 4,636,989 5,542,195
241,082,324$ 316,406,398$ 223,230,827$ 274,926,518$
2014 2013
The following schedule summarizes the investment return for the years ended June 30, 2014 and2013:
2014 2013
Dividends and interest 2,143,148$ 947,438$
Realized and unrealized gains, net 42,444,242 26,042,862
Return on long-term investments 44,587,390 26,990,300
Interest on short-term investments 90,126 69,801
Total return on investments 44,677,516 27,060,101
Investment return designated for
current operations (10,728,252) (10,967,513)
Investment return in excess of amountsdesignated for current operations 33,949,264$ 16,092,588$
The University’s policy is to distribute a portion of the total investment return for current operationsat the predetermined spending rate as discussed in Note 8.
Fairfield UniversityNotes to Financial StatementsJune 30, 2014 and 2013
19
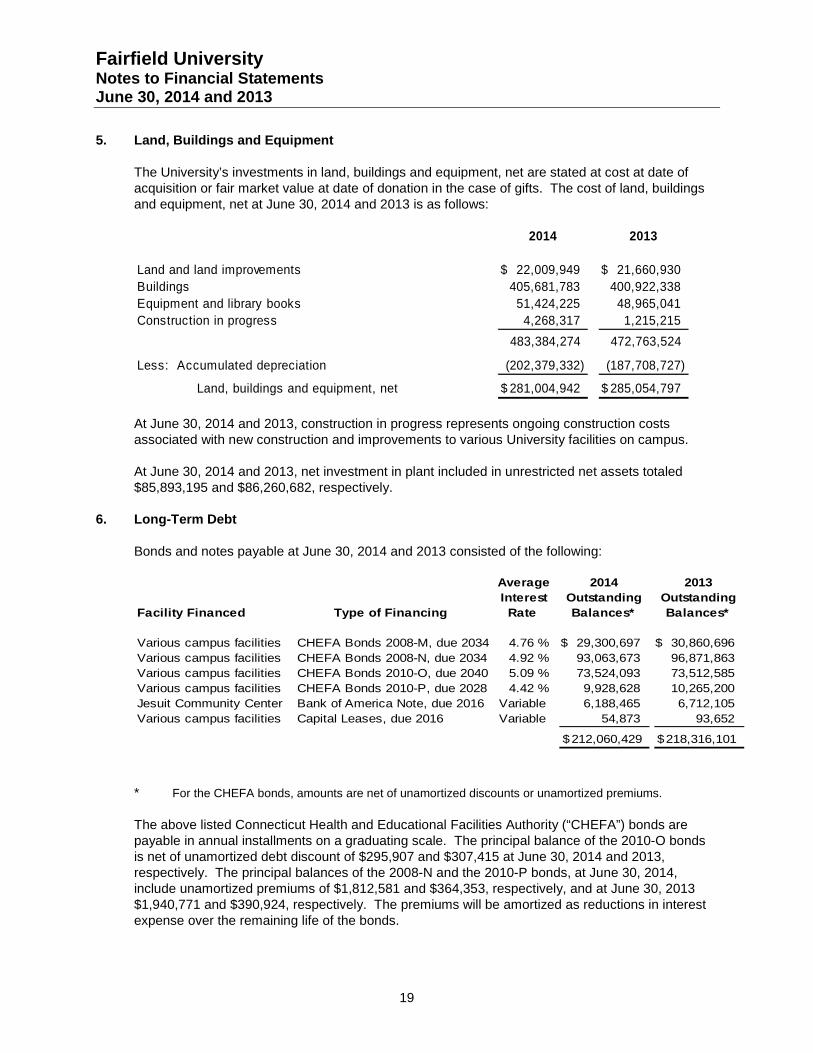
5. Land, Buildings and Equipment
The University’s investments in land, buildings and equipment, net are stated at cost at date ofacquisition or fair market value at date of donation in the case of gifts. The cost of land, buildingsand equipment, net at June 30, 2014 and 2013 is as follows:
At June 30, 2014 and 2013, construction in progress represents ongoing construction costsassociated with new construction and improvements to various University facilities on campus.
At June 30, 2014 and 2013, net investment in plant included in unrestricted net assets totaled$85,893,195 and $86,260,682, respectively.
6. Long-Term Debt
Bonds and notes payable at June 30, 2014 and 2013 consisted of the following:
Average 2014 2013
Interest Outstanding Outstanding
Facility Financed Type of Financing Rate Balances* Balances*
Various campus facilities CHEFA Bonds 2008-M, due 2034 4.76 % 29,300,697$ 30,860,696$
Various campus facilities CHEFA Bonds 2008-N, due 2034 4.92 % 93,063,673 96,871,863
Various campus facilities CHEFA Bonds 2010-O, due 2040 5.09 % 73,524,093 73,512,585
Various campus facilities CHEFA Bonds 2010-P, due 2028 4.42 % 9,928,628 10,265,200
Jesuit Community Center Bank of America Note, due 2016 Variable 6,188,465 6,712,105
Various campus facilities Capital Leases, due 2016 Variable 54,873 93,652
212,060,429$ 218,316,101$
* For the CHEFA bonds, amounts are net of unamortized discounts or unamortized premiums.
The above listed Connecticut Health and Educational Facilities Authority (“CHEFA”) bonds arepayable in annual installments on a graduating scale. The principal balance of the 2010-O bondsis net of unamortized debt discount of $295,907 and $307,415 at June 30, 2014 and 2013,respectively. The principal balances of the 2008-N and the 2010-P bonds, at June 30, 2014,include unamortized premiums of $1,812,581 and $364,353, respectively, and at June 30, 2013$1,940,771 and $390,924, respectively. The premiums will be amortized as reductions in interestexpense over the remaining life of the bonds.
2014 2013
Land and land improvements 22,009,949$ 21,660,930$
Buildings 405,681,783 400,922,338
Equipment and library books 51,424,225 48,965,041
Construction in progress 4,268,317 1,215,215
483,384,274 472,763,524
Less: Accumulated depreciation (202,379,332) (187,708,727)
Land, buildings and equipment, net 281,004,942$ 285,054,797$
Fairfield UniversityNotes to Financial StatementsJune 30, 2014 and 2013
20
In February 2009, the University entered into an agreement and note with Bank of America for anonrestoring line of credit in the amount of $7,933,930. This represents a portion of the costsassociated with the on campus construction of a Jesuit Community Center. The loan matures in2016 and will be repaid on a 15 year schedule beginning in 2011. Interest on the borrowings isbased on the LIBOR rate plus .80% at June 30, 2014.
In accordance with each of the bond indentures, the University maintains a sinking fund with banktrustees at an amount sufficient to pay interest and principal during the succeeding twelve months.The amounts in deposits with trustee in the statement of financial position are $2,960,179 and$9,938,250 required by the Series M and N bond indentures and $1,065,750 as required by theSeries P bond indentures as of June 30, 2014 and June 30, 2013. The amounts in deposit withtrustee for the Series O indenture are $7,125,506 and $7,011,335 as of June 30, 2014 and June30, 2013, respectively.
The University’s long-term debt agreements contain various covenants which may restrict theability of the University to incur or guarantee debt. These agreements also require the University tomeet a debt service ratio as defined in the agreements. The University was in compliance with thedebt covenants at June 30, 2014.
The fair values of the University’s long-term debt at June 30, 2014 and 2013 are based on marketinformation for underlying debt securities and are classified as Level 2. The fair value of theUniversity’s bonds at June 30, 2014 and 2013 is $223,111,018 and $223,371,751, respectively.
Interest expense and amortization of bond discount and premium for the years ended June 30,2014 and 2013 was $10,295,279 and $10,275,023, respectively.
The aggregate amount of principal due with respect to long-term debt within each of the five fiscalyears subsequent to June 30, 2014 is as follows:
2015 6,100,204$
2016 12,038,134
2017 6,395,000
2018 6,705,000
2019 7,020,000
Thereafter 171,921,063
210,179,401$
7. Retirement Benefits
The University has a 403(b) defined contribution retirement plan which covers substantially all of itsemployees, other than those of the Jesuit Community, and which is funded through directpayments to the Teachers’ Insurance and Annuity Association and College Retirement EquitiesFund and/or Fidelity Investment Tax Exempt Services Company for the purchase of individualannuities. For each eligible employee, the University generally contributes an amount equal tobetween 8% and 10% of the employee’s salary or base compensation and the employeecontributes 2-1/2%. With respect to faculty and administrative members of the Jesuit Community,an equivalent between 8% and 10% of their salaries are paid directly to the Jesuit Community.Retirement contributions paid by the University and charged to unrestricted operations for the yearsended June 30, 2014 and 2013 were $4,740,336 and $4,630,264, respectively.
Fairfield UniversityNotes to Financial StatementsJune 30, 2014 and 2013
21
8. Endowment Funds
In August 2008, the FASB issued “Endowments of Not-For-Profit Organizations: Net AssetClassification of Funds Subject to an Enacted Version of the Uniform Prudent Management ofInstitutional Funds Act and Enhanced Disclosure for all Endowment Funds”. This pronouncementprovides guidance on the net asset classification of donor-restricted endowment funds for anot-for-profit organization that is subject to an enacted version of the Uniform Prudent Managementof Institutional Funds Act of 2006 (UPMIFA). Connecticut adopted the Uniform Management ofInstitutional Funds Act effective October 1, 2007 (CUPMIFA). This pronouncement requiresdisclosures about an organization’s endowment funds (both donor-restricted and board-designatedendowment funds), whether or not the organization is subject to UPMIFA.
The University’s endowment is an aggregation of gifts provided by donors with the requirementthey be held in perpetuity to generate earnings now and in future years to support the University’sprograms of instruction, research and public service and funds designated by the Board ofTrustees to function as endowment. Earnings from endowment investments support scholarships,chairs, professorships, fellowships, basic research, as well as academic and public serviceprograms. The endowment should provide stability since the principal is invested and earnings aregenerated year after year. Net assets associated with endowment funds, including fundsdesignated by the Board of Trustees to function as endowments, are classified and reported basedon the existence or absence of donor-imposed restrictions.
To accomplish these goals, the University relies on a total return strategy in which investmentreturns are achieved through both capital appreciation (realized and unrealized) and current yield(interest and dividends). The primary investment objective of the endowment is to attain anaverage annual total return in excess of the spending rate (currently at 4.25% of the average fairmarket value of total endowment assets for the preceding twelve quarters); over the long-term,defined as rolling five-year periods that should be achieved within acceptable risk levels, whileavoiding large short-term declines in market value. Actual returns in any given year may vary fromthis amount. The University targets a diversified asset allocation that places a greater emphasis onequity-based and alternative investments to achieve its long-term objective within prudent riskconstraints.
The Board of Trustees after consideration of the factors provided in CUPMIFA approved a policythat, absent specific donor imposed directions, University management may decide to spend aportion of or the entire spending amount on funds which are underwater. For the year endedJune 30, 2014 and 2013, funds were distributed in total according to the spending formula.Although CUPMIFA permits prudent spending from the individual underwater endowments,University management chose not to spend from those funds but to fund this spending from theUniversity unrestricted quasi endowment.
Assets of the endowment and quasi-endowment are pooled on a market value basis, with eachindividual asset subscribing to or disposing of units on the basis of the market value per unit at theend of the quarter within which the transaction takes place.
Fairfield UniversityNotes to Financial StatementsJune 30, 2014 and 2013
22
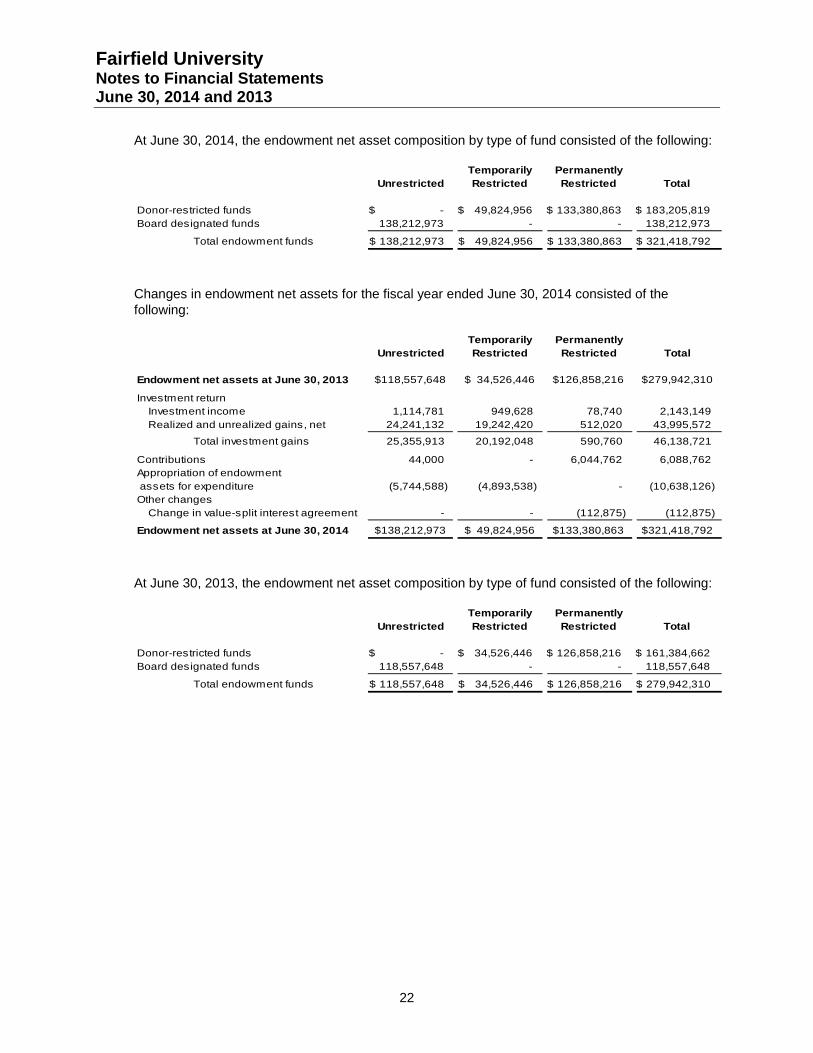
At June 30, 2014, the endowment net asset composition by type of fund consisted of the following:
Temporarily Permanently
Unrestricted Restricted Restricted Total
Donor-restricted funds -$ 49,824,956$ 133,380,863$ 183,205,819$
Board designated funds 138,212,973 - - 138,212,973
Total endowment funds 138,212,973$ 49,824,956$ 133,380,863$ 321,418,792$
Changes in endowment net assets for the fiscal year ended June 30, 2014 consisted of thefollowing:
Temporarily Permanently
Unrestricted Restricted Restricted Total
Endowment net assets at June 30, 2013 118,557,648$ 34,526,446$ 126,858,216$ 279,942,310$
Investment return
Investment income 1,114,781 949,628 78,740 2,143,149
Realized and unrealized gains, net 24,241,132 19,242,420 512,020 43,995,572
Total investment gains 25,355,913 20,192,048 590,760 46,138,721
Contributions 44,000 - 6,044,762 6,088,762
Appropriation of endowment
assets for expenditure (5,744,588) (4,893,538) - (10,638,126)
Other changes
Change in value-split interest agreement - - (112,875) (112,875)
Endowment net assets at June 30, 2014 138,212,973$ 49,824,956$ 133,380,863$ 321,418,792$
At June 30, 2013, the endowment net asset composition by type of fund consisted of the following:
Temporarily Permanently
Unrestricted Restricted Restricted Total
Donor-restricted funds -$ 34,526,446$ 126,858,216$ 161,384,662$
Board designated funds 118,557,648 - - 118,557,648
Total endowment funds 118,557,648$ 34,526,446$ 126,858,216$ 279,942,310$
Fairfield UniversityNotes to Financial StatementsJune 30, 2014 and 2013
23
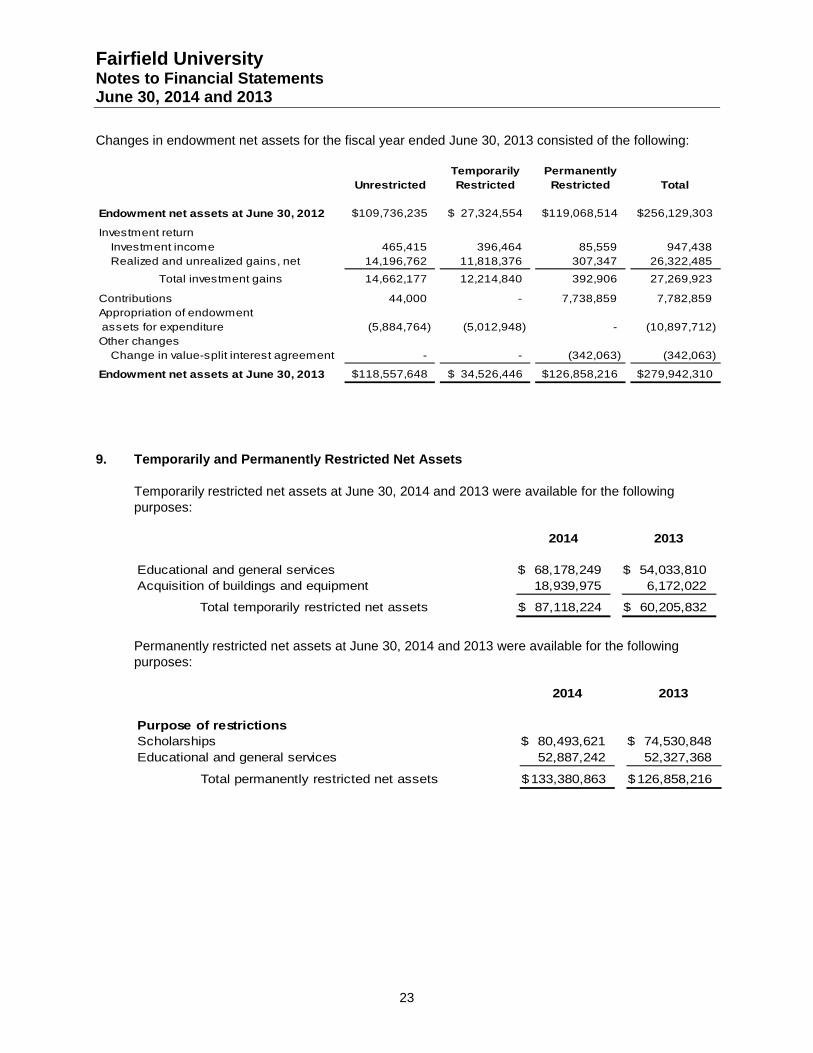
Changes in endowment net assets for the fiscal year ended June 30, 2013 consisted of the following:
Temporarily Permanently
Unrestricted Restricted Restricted Total
Endowment net assets at June 30, 2012 109,736,235$ 27,324,554$ 119,068,514$ 256,129,303$
Investment return
Investment income 465,415 396,464 85,559 947,438
Realized and unrealized gains, net 14,196,762 11,818,376 307,347 26,322,485
Total investment gains 14,662,177 12,214,840 392,906 27,269,923
Contributions 44,000 - 7,738,859 7,782,859
Appropriation of endowment
assets for expenditure (5,884,764) (5,012,948) - (10,897,712)
Other changes
Change in value-split interest agreement - - (342,063) (342,063)
Endowment net assets at June 30, 2013 118,557,648$ 34,526,446$ 126,858,216$ 279,942,310$
9. Temporarily and Permanently Restricted Net Assets
Temporarily restricted net assets at June 30, 2014 and 2013 were available for the followingpurposes:
2014 2013
Educational and general services 68,178,249$ 54,033,810$
Acquisition of buildings and equipment 18,939,975 6,172,022
Total temporarily restricted net assets 87,118,224$ 60,205,832$
Permanently restricted net assets at June 30, 2014 and 2013 were available for the followingpurposes:
2014 2013
Purpose of restrictions
Scholarships 80,493,621$ 74,530,848$
Educational and general services 52,887,242 52,327,368
Total permanently restricted net assets 133,380,863$ 126,858,216$
Fairfield UniversityNotes to Financial StatementsJune 30, 2014 and 2013
24
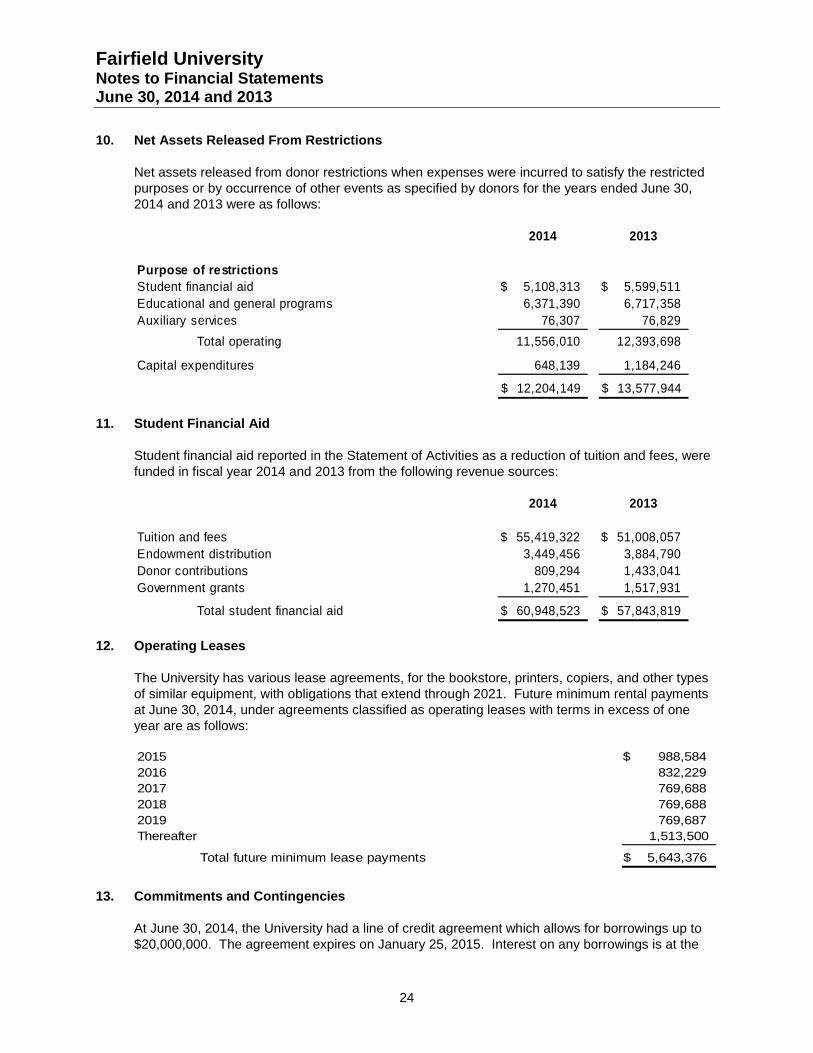
10. Net Assets Released From Restrictions
Net assets released from donor restrictions when expenses were incurred to satisfy the restrictedpurposes or by occurrence of other events as specified by donors for the years ended June 30,2014 and 2013 were as follows:
11. Student Financial Aid
Student financial aid reported in the Statement of Activities as a reduction of tuition and fees, werefunded in fiscal year 2014 and 2013 from the following revenue sources:
12. Operating Leases
The University has various lease agreements, for the bookstore, printers, copiers, and other typesof similar equipment, with obligations that extend through 2021. Future minimum rental paymentsat June 30, 2014, under agreements classified as operating leases with terms in excess of oneyear are as follows:
2015 988,584$
2016 832,229
2017 769,688
2018 769,688
2019 769,687
Thereafter 1,513,500
Total future minimum lease payments 5,643,376$
13. Commitments and Contingencies
At June 30, 2014, the University had a line of credit agreement which allows for borrowings up to$20,000,000. The agreement expires on January 25, 2015. Interest on any borrowings is at the
2014 2013
Purpose of restrictions
Student financial aid 5,108,313$ 5,599,511$
Educational and general programs 6,371,390 6,717,358
Auxiliary services 76,307 76,829
Total operating 11,556,010 12,393,698
Capital expenditures 648,139 1,184,246
12,204,149$ 13,577,944$
2014 2013
Tuition and fees 55,419,322$ 51,008,057$
Endowment distribution 3,449,456 3,884,790
Donor contributions 809,294 1,433,041
Government grants 1,270,451 1,517,931
Total student financial aid 60,948,523$ 57,843,819$

Fairfield UniversityNotes to Financial StatementsJune 30, 2014 and 2013
25
LIBOR rate plus .80%. There is an unused commitment fee of .30% per annum. There are nooutstanding borrowings at June 30, 2014.
The University is involved in various legal actions, arising in the normal course of operations. TheUniversity is of the opinion that the resolution of these matters will not have a significant effect onthe financial condition of the University.


![The Big Picture - Fairfield University · The Big Picture FAIRFIELD UNIVERSITYFAIRFIELD UNIVERSITY. FAIRFIELD UNIVERSITY ___ NIQZÅMTL ML] 1 Y ... Biochemistry Biology chemistry communication](https://img.pdfslide.us/doc/110x75/5f5ce6f6442979647317c439/the-big-picture-fairfield-university-the-big-picture-fairfield-universityfairfield.jpg)