Embed Size (px)
Citation preview
The Guide To
Fair State and Local Taxes2011
Institute on Taxation and Economic Policy1616 P Street, NW, Suite 201, Washington, DC 20036 | 202-299-1066 | www.itepnet.org | [email protected]

iiiThe iTep Guide To Fair State and LocaL taxeS: about
About the GuideThe ITEP Guide to Fair State and Local Taxes is designed to provide a basic overview of the most important issues in state and local
tax policy, in simple and straightforward language.
The Guide is also available to read or download on ITEP’s website at www.itepnet.org. The web version of the Guide includes
a series of appendices for each chapter with regularly updated state-by-state data on selected state and local tax policies.
Additionally, ITEP has published a series of policy briefs that provide supplementary information to the topics discussed in the
Guide. These briefs are also available on ITEP’s website.
The Guide is the result of the diligent work of many ITEP staffers. Those primarily responsible for the guide are Carl Davis, Kelly
Davis, Matthew Gardner, Jeff McLynch, and Meg Wiehe. The Guide also benefitted from the valuable feedback of researchers and
advocates around the nation. Special thanks to Michael Mazerov at the Center on Budget and Policy Priorities.
About ITEPFounded in 1980, the Institute on Taxation and Economic Policy (ITEP) is a non-profit, non-partisan research organization, based
in Washington, DC, that focuses on federal and state tax policy. ITEP’s mission is to inform policymakers and the public of the
effects of current and proposed tax policies on tax fairness, government budgets, and sound economic policy. Among its many
publications on state and local tax policy is Who Pays? A Distributional Analysis of the Tax Systems in All 50 States
Copyright© by the Institute on Taxation and Economic Policy, 2011.


vThe iTep Guide To Fair State and LocaL taxeS: contentS
The Guide ToFair State and Local TaxesChapTer 1 tax FairneSS FundamentaLS ............ 1 Why Tax Fairness Matters ............................................... 3
Federal Taxes Matter, Too ............................................... 4
ChapTer 2 baSic PrinciPLeS and termS .............. 5 Tax Policy Principles: An Introduction ..................... 5
Nuts and Bolts: Basic Tax Policy Terms .................. 7
The Interaction of State and Local Taxes with Federal Income Taxes.......................................................... 9
ChapTer 3 SaLeS and exciSe taxeS..................... 11 How Sales Taxes Work .................................................. 11
Sales Tax on Business—Who Pays? ........................ 13
Sales Tax Reform: Issues and Options................... 15
How Excise Taxes Work .................................................. 21
Excise Tax Reform: Issues and Options ................ 23
ChapTer 4 ProPerty taxeS ................................... 25 How Property Taxes Work ..............................................26
Business Property Taxes ................................................ 27
Residential Rental Property ........................................ 28
Personal Property Taxes ..................................................28
Property Tax Relief Options ..........................................29
Property Tax Reform: Issues and Options .......... 33
ChapTer 5 PerSonaL income taxeS .................... 35 How Personal Income Taxes Work ......................... 35
Local Income Taxes .......................................................... 40
Personal Income Tax Reform: Issues and Options.............................................................41
ChapTer 6 corPorate income taxeS .................. 44
Why Tax Corporations? .................................................. 44
How Corporate Income Taxes Work ...................... 45
Corporate Income Tax Reform: Issues and Options........................................................... 47
Corporate Minimum Taxes............................................51
Corporate Disclosure: An Important Tool for Tax Fairness ......................................................................52
ChapTer 7 other revenue SourceS ................... 53
User Fees ................................................................................ 53
Estate and Inheritance Taxes ..................................... 54
Gambling Revenues ....................................................... 55
Borrowing From the Future: Debt and Other Strategies .......................................... 56
ChapTer 8 taxeS and economic deveLoPment .. 57 Assessing Claims That Taxes Affect State
Economies .............................................................................57
Low Tax Strategies Aren’t Effective ..........................58
Types of Tax Breaks Offered ........................................ 59
Ensuring Accountability in Economic Development Strategies .............................................. 60
ChapTer 9 other StePS toward (or away From) Fair taxeS ............... 62
Tax Expenditure Reports .............................................. 62
Tax Incidence Analysis ................................................... 63
Rainy Day Funds ................................................................ 64
Tax and Expenditure Limitations (TELs) .............. 64
ChapTer 10 achieving tax reForm: next StePS . 66 Why Tax Reform is Necessary ......................................66
Strategies for Tax Reform ............................................. 67
Resources for Further Investigation ...................... 68
Glossary ............................................................... 71

1ONE: Tax Fairness FundamenTals
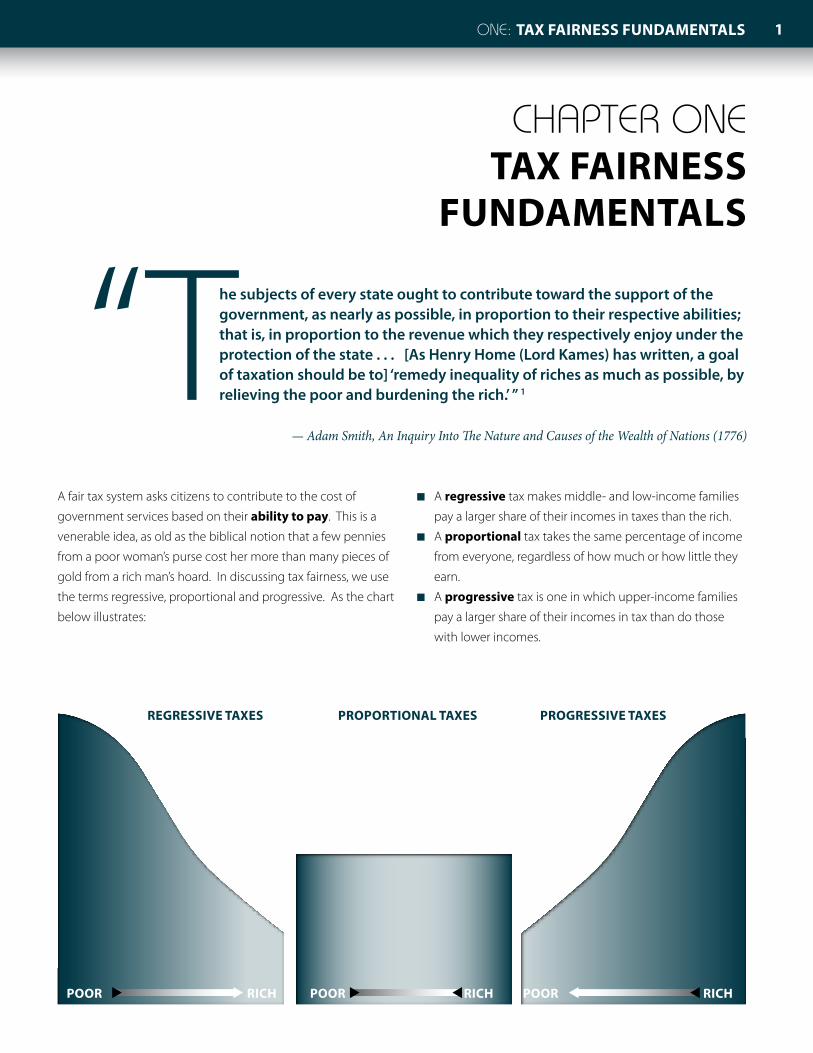
A fair tax system asks citizens to contribute to the cost of
government services based on their ability to pay. This is a
venerable idea, as old as the biblical notion that a few pennies
from a poor woman’s purse cost her more than many pieces of
gold from a rich man’s hoard. In discussing tax fairness, we use
the terms regressive, proportional and progressive. As the chart
below illustrates:
■ A regressive tax makes middle- and low-income families
pay a larger share of their incomes in taxes than the rich.
■ A proportional tax takes the same percentage of income
from everyone, regardless of how much or how little they
earn.
■ A progressive tax is one in which upper-income families
pay a larger share of their incomes in tax than do those
with lower incomes.
Poor rich
regressive Taxes
Poor rich
ProPorTional Taxes
Poor rich
Progressive Taxes
u u u t uu
CHAPTER ONETax Fairness
FundamenTals
“The subjects of every state ought to contribute toward the support of the government, as nearly as possible, in proportion to their respective abilities; that is, in proportion to the revenue which they respectively enjoy under the protection of the state . . . [As Henry Home (Lord Kames) has written, a goal of taxation should be to] ‘remedy inequality of riches as much as possible, by relieving the poor and burdening the rich.’ ” 1
— Adam Smith, An Inquiry Into The Nature and Causes of the Wealth of Nations (1776)
2 THE ITEP GuIdE TO Fair sTaTe and local Taxes2
Few people would consider a tax system to be fair if the
poorer you are, the more of your income you pay in taxes.
But that’s exactly what regressive taxes do. They require
middle- and low-income families to pay a much greater share
of their incomes in taxes than the wealthy. Fairness is, of
course, in the eye of the beholder. Yet almost anyone would
agree that the best-off families should pay at a tax rate at least
equal to what low- and middle-income families pay. State
and local taxes pay for the schools, safe neighborhoods, clean
water and air, public transportation and other things that make
for a better community and enhance quality of life. Because
these investments benefit everyone, it is imperative that every
household pay its fair share.
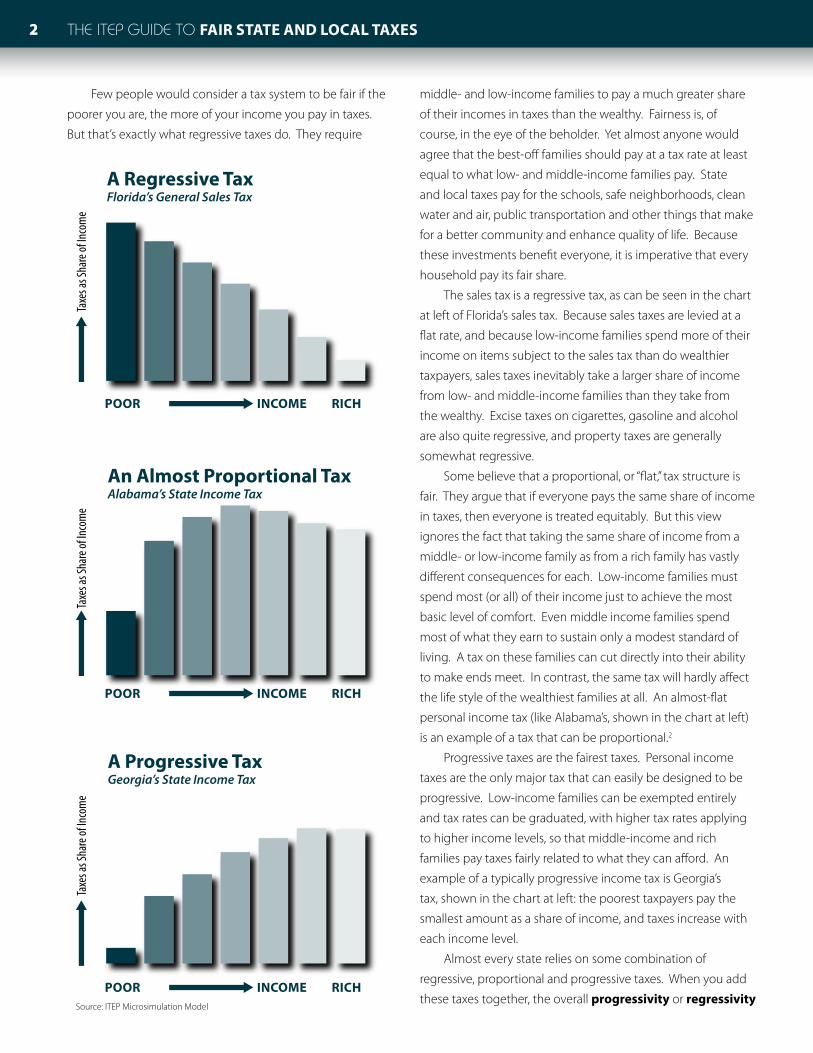
The sales tax is a regressive tax, as can be seen in the chart
at left of Florida’s sales tax. Because sales taxes are levied at a
flat rate, and because low-income families spend more of their
income on items subject to the sales tax than do wealthier
taxpayers, sales taxes inevitably take a larger share of income
from low- and middle-income families than they take from
the wealthy. Excise taxes on cigarettes, gasoline and alcohol
are also quite regressive, and property taxes are generally
somewhat regressive.
Some believe that a proportional, or “flat,” tax structure is
fair. They argue that if everyone pays the same share of income
in taxes, then everyone is treated equitably. But this view
ignores the fact that taking the same share of income from a
middle- or low-income family as from a rich family has vastly
different consequences for each. Low-income families must
spend most (or all) of their income just to achieve the most
basic level of comfort. Even middle income families spend
most of what they earn to sustain only a modest standard of
living. A tax on these families can cut directly into their ability
to make ends meet. In contrast, the same tax will hardly affect
the life style of the wealthiest families at all. An almost-flat
personal income tax (like Alabama’s, shown in the chart at left)
is an example of a tax that can be proportional.2
Progressive taxes are the fairest taxes. Personal income
taxes are the only major tax that can easily be designed to be
progressive. Low-income families can be exempted entirely
and tax rates can be graduated, with higher tax rates applying
to higher income levels, so that middle-income and rich
families pay taxes fairly related to what they can afford. An
example of a typically progressive income tax is Georgia’s
tax, shown in the chart at left: the poorest taxpayers pay the
smallest amount as a share of income, and taxes increase with
each income level.
Almost every state relies on some combination of
regressive, proportional and progressive taxes. When you add
these taxes together, the overall progressivity or regressivity
A Regressive TaxFlorida’s General Sales Tax
An Almost Proportional TaxAlabama’s State Income Tax
A Progressive TaxGeorgia’s State Income Tax
Poor income rich
Poor income rich
Poor income rich
Taxe
s as S
hare
of In
com
eTa
xes a
s Sha
re of
Inco
me
Taxe
s as S
hare
of In
com
e
Source: ITEP Microsimulation Model

3ONE: Tax Fairness FundamenTals
of a tax system is determined by (1) the degree of progressivity
or regressivity of each tax within the system and (2) how heavily
a state relies on each tax. Thus, a state that relies on regressive
sales, excise and property taxes more heavily than its mildly
progressive income tax will end up with a very regressive tax
system overall. An example of a state like this is Illinois. At the
other end of the spectrum, even the most progressive income
taxes are only sufficient to make a state’s tax system roughly
proportional overall. An example of a state that achieves this
result by relying more on its progressive income tax than on
regressive sales, excise and property taxes is Vermont. The
charts below illustrate Illinois and Vermont’s tax systems.
Why Tax Fairness mattersTax fairness is an important goal for state policymakers, for
several reasons. For one thing, a regressive tax system raises
money from the people who have the least of it. This is
illogical at best. The wealthiest one percent of Americans have
more income than the poorest 40 percent put together. And
the best-off 20 percent of Americans make more than the
remaining 80 percent combined. Soaking the poor just doesn’t
yield much revenue compared to modest taxes on the rich.
Fair taxes are essential to adequate funding of public services
because they tax those who have the most to give.
This flaw in using a “soak the poor,” regressive tax system
for raising revenue has been compounded in recent years.
The wealthiest Americans have gotten much richer, while just
about everyone else has gotten squeezed. The richest one
percent of families in the United States saw their average pre-
tax income rise by 281 percent in the twenty-one years from
1979 to 2007—that’s in “constant dollars” (meaning it’s adjusted
for inflation)! Meanwhile, middle-income earnings grew by 25
percent over this period, and the poorest twenty percent saw
their real pretax incomes grow by just 16 percent.3
It’s no wonder that so many states with regressive tax
structures are facing long-term structural budget deficits.
They’re continually imposing higher taxes on people without
much money—the very people who have experienced the
most meager growth in income over the past thirty years.
These states are largely bypassing—that is, by taxing at very
low rates—the people whose incomes have grown the fastest:
the rich. In the long run, progressive taxes like the income tax
are a more dependable source of revenue for state and local
governments precisely because they tax the wealthy state
+16%
Poorest 20% Middle20% Top 1%
3
2.5
2
1.5
1
0.5
0
+25%
+281%
The Rich Get Richer:Real Income Growth, 1979 - 2007
Source: Congressional Budget Office, “Data on the Average Federal Taxes by Income Group,” June 2010.
Poor income rich
Taxe
s as S
hare
of In
com
eTa
xes a
s Sha
re of
Inco
me
Vermont State & Local TaxesAs Shares of Family Income
Illinois State & Local TaxesAs Shares of Family Income
Poor Income rIch
Source: ITEP Microsimulation Model
4 THE ITEP GuIdE TO Fair sTaTe and local Taxes4
residents who have enjoyed the largest income gains in recent
decades.
Fair taxes also help government in its relations with its
citizens. The public accepts taxes because it values the services
that government provides. When a tax system is unfair,
however, there is a limit to the taxes the public will tolerate.
It’s one thing to ask people to pay taxes. It is another to ask
them to pay more because others aren’t paying their fair share.
When states choose to balance their budgets by hiking taxes
on the low- and middle-income families who are hit hardest
by the current tax system, while giving the best-off families a
free pass, this obvious unfairness undermines public support
for revenue-raising tax reforms even when they are most
desperately needed.
Finally, a fair tax system is important as a very real moral
imperative. Taxes can amount to real money for any family. But
for poorer families, it’s money that could otherwise be used
for food, clothing, a trip to the doctor or some other necessity.
When a state decides to tax the poor at a high rate, it is forcing
these families to make choices that no family should have to
make—choices that are far harder than those faced by upper-
income families.
Federal Taxes matter, Too When we evaluate the fairness of a tax system, we should
also consider overlapping tax systems that affect the same
taxpayers. It is important, in particular, to consider state and
local tax policy in the context of federal tax policy.
While the rich have seen their incomes go up substantially
faster than others, federal taxes on the wealthy have gone way
down—resulting in an overall tax system that is much less
progressive. In 2009, the wealthiest 1 percent of Americans
paid 30.8 percent of their income in combined federal, state
and local taxes, down sharply from 37.1 percent before the
George W. Bush administration. By comparison, the other
99 percent of Americans paid, on average, 28.2 percent of
their income in total taxes—almost as much as the wealthiest
taxpayers.
So as states determine which taxes to raise and on whom,
they should consider that federal taxes have been getting
significantly less progressive. A state that raises taxes on the
rich will almost certainly still leave them better off than they
were before their huge tax cuts on the federal level. Raising
taxes on middle- and low-income taxpayers, however, will
compound the injustice of the federal tax shift that has taken
place in the past decade.
Are Your State’s Taxes Unfair?
A November 2009 ITEP report, Who Pays?, measures the fairness of state and local taxes in each of the 50 states and the District of Columbia. The report finds that almost every state requires its poorest citizens to pay more of their income in taxes than any other income group—and allows the wealthiest taxpayers to pay the least. Who Pays? is available on ITEP’s website at www.itepnet.org/whopays
1 Smith, Adam. An Inquiry into the Nature and Causes of the Wealth of Nations. New York: Random House, 1937.2 Alabama’s income tax has a nominally graduated rate structure, but the top income tax rate applies to all taxable income over $6,000 for a married couples. As a result, 70 percent of Alabamans paid income tax at the top rate in 2009, making it an effectively flat income tax for most families.3 Congressional Budget Office, “Average Federal Taxes by Income Group,” June 2010. http://www.cbo.gov/publications/collections/collections.cfm?collect=13 .

5Two: Basic PrinciPles and terms
tax Policy Principles: an introductionTax fairness is a primary consideration in evaluating state and
local tax systems. But there are other important criteria that
must also be considered. This section explains five of the
most commonly cited tax policy principles: equity, adequacy,
simplicity, exportability, and neutrality.
Equity: Two Kinds of Tax FairnessWhen people discuss tax “fairness,” they’re talking about equity.
Tax equity can be looked at in two important ways: vertical equity and horizontal equity. Vertical equity addresses how
a tax affects different families from the bottom of the income
spectrum to the top—from poor to rich. When we discussed
regressive and progressive taxes in Chapter One, we were
looking at vertical equity issues.
Horizontal equity is a measure of whether taxpayers in
similar circumstances pay similar amounts of tax. For example,
if one family pays higher taxes than a similar-income family
next door, that violates “horizontal” fairness. This sort of
unjustified disparity undermines public support for the tax
system and diminishes people’s willingness to file honest
tax returns. It would be hard to defend a tax system that
intentionally taxed left-handed people at higher rates than
right-handed people. Likewise, a tax that hits a wage-earner
harder than an investor (as the federal income tax currently
does), even if their total incomes are the same, fails the test of
horizontal equity.
AdequacyAn adequate tax system raises enough funds to sustain the
level of public services demanded by citizens and policymakers.
At the end of the day, adequacy is what separates successful
tax systems from unsuccessful tax systems. Of course, at any
given time, the primary concern for state lawmakers is short-
term adequacy—making sure there’s enough revenue to fund
public services in the upcoming fiscal year. But it’s equally
vital for good-government advocates and lawmakers to seek
This chapter introduces some basic principles for evaluating your state’s tax system—and walks you through some of the “nuts and bolts” necessary for a basic understanding of tax policy issues. This chapter does not attempt to turn anyone into a tax attorney. Rather, our goal—here and throughout this guide—is to make the reader sufficiently knowledgeable about tax policy to
effectively participate in important tax policy debates.
CHAPTER TwoBasic PrinciPles
and terms
Important Tax Policy Principlesn Equity: Does your tax system treat people at different income
levels, and people at the same income level, fairly?
n Adequacy: Does the tax system raise enough money, in the
short run and the long run, to finance public services?
n Simplicity: Does the tax system allow confusing tax
loopholes? Is it easy to understand how your state’s taxes
work?
n Exportability: Individuals and companies based in other
states benefit from your state’s public services. Do they pay
their fair share?
n Neutrality: Does the tax system interfere with the investment
and spending decisions of businesses and workers?
THE ITEP GuIdE To Fair state and local taxes6
strategies that will achieve long-term adequacy, balancing
budgets not just this year and next, but five years and ten years
down the road.
Two factors that contribute to the adequacy of a tax
are its stability and its elasticity. A stable tax is one that
grows at a predictable pace. Predictable growth makes it
easier for lawmakers to put together budgets that match
anticipated revenues to anticipated spending. But stability
by itself is not enough to achieve adequacy in the long run.
For example, property taxes grow predictably—but tend to
grow more slowly than the cost of the services that state and
local governments provide. Elasticity is a measure of whether
the growth in a specific tax keeps up with the economy—an
important consideration because the cost of providing public
services usually grows at least as fast as the economy. An
elastic tax is one for which tax revenue grows faster than the
economy over the long run.
There is some inherent tension between the goals of
elasticity and stability. Elastic taxes, like the personal income
tax, are more likely to ensure adequate revenues in the long
run, but may fluctuate more from year to year. Academic
research has shown that the long-term growth of the personal
income tax is substantially greater than that of the sales tax,
even though the income tax is more volatile in the short
run.1 This makes it vital for these taxes to be accompanied by
prudent fiscal management to smooth out the ups and downs
associated with normal economic cycles (for instance, by
creating and maintaining a “rainy day fund” —see Chapter Nine
for more details). Prudently managed, income taxes will likely
provide a more sustainable funding source over the long run
than is possible with sales or property taxes. Stable taxes, like
the property tax, will grow predictably, but the slower growth
rate of these taxes may mean that in the long run tax hikes will
probably be necessary to fund services at the same level.
SimplicitySimplicity is often touted as a goal for tax reform—and it’s an
important one. Complicated tax rules make the tax system
difficult for citizens to understand. Complexity also makes it
harder for governments to monitor and enforce tax collections,
and makes it easier for lawmakers to enact (and conceal)
targeted tax breaks benefitting particular groups. A tax system
full of loopholes gives those who can afford clever accountants
an advantage over those who must wade through the tax code
on their own.
But beware. Tax reform proposals described as
“simplification” measures are often nothing of the kind. For
example, anti-tax advocates frequently seek to “simplify” the
income tax by eliminating the graduated rate structure and
instituting a flat-rate tax. This is a red herring: a graduated tax
system is no more complicated than a flat-rate tax, and generally
doesn’t add even one extra line to your state income tax form.
What makes filing taxes more complicated—and makes the
tax forms longer and longer each year—is the proliferation of
special tax breaks. The right way to make income taxes simple is
to eliminate tax loopholes, not to flatten the rates.
The “Benefits Principle” of TaxationNot all taxes are based on ability to pay. Governments sometimes levy taxes and user fees designed to make people pay in accordance with the benefit they receive from certain public services. This idea is known as the benefits principle of taxation. For example, states raise money for highway maintenance by imposing a gasoline tax. Since the amount of gasoline a driver purchases is a reasonable proxy for the benefit that driver receives from publicly maintained roads, the gas tax follows the benefits principle of taxation.
But there are limits to the usefulness of the benefits principle. First, taxing according to the benefits principle can lead to a regressive result: gasoline taxes take a larger share of income from low-income taxpayers than from the wealthy. Second, for many of the most important functions performed by governments, such as education, health care and anti-poverty programs, and police and homeland security, it can be hard to quantify the benefits of these services for individual taxpayers. Third, many of the services provided by state governments are explicitly designed to redistribute resources to low-income taxpayers. Social welfare programs exist partially because low-income taxpayers cannot afford to pay for these programs themselves, so requiring these taxpayers to pay for the programs according to the benefits principle would defeat their purpose.

7Two: Basic PrinciPles and terms
ExportabilityThe public services provided by state tax revenues are enjoyed
by individuals and businesses from other states—including
businesses that hire a state’s high school and college graduates
and tourists who use a state’s transportation infrastructure. This
is why state tax systems are often designed to make multi-state
businesses and residents of other states pay their fair share
of the state’s taxes. An exportable tax is one that is at least
partially paid by these non-residents.
There are broadly three ways in which taxes can be
exported: by having non-residents pay the tax directly (sales
taxes on items purchased by tourists, for example); by levying
taxes on businesses which are then passed on to non-residents;
and through interaction with the federal income tax. (See
“The Interaction of State and Local Taxes with Federal Income
Taxes” on page 9.) All taxes are at least partially paid by non-
residents—and policy makers have the power to effectively
adjust the percentage of taxes “exported” to residents of other
states.
NeutralityThe principle of neutrality (sometimes called “efficiency”) tells
us that a tax system should stay out of the way of economic
decisions. Tax policies that systematically favor one kind of
economic activity or another can lead to the misallocation of
resources or, worse, to schemes whose sole aim is to exploit
such preferential tax treatment. If individuals or businesses
make their investment or spending decisions based on the
tax code rather than basing them on their own preferences,
that’s a violation of the neutrality principle, and can lead
to negative economic consequences in the long run. For
example, the big tax breaks that the Reagan administration
provided for commercial real estate in the early 1980s led to
far too much office construction and the phenomenon of
“see-through office buildings” that nobody wanted to rent.
These wasteful investments came, of course, at the expense of
more productive investments—and were paid for by all other
taxpayers.
The tax principles outlined here are not the only criteria
used by policymakers in evaluating tax changes—and these
principles sometimes come into conflict. But almost everyone
would agree that advocates of tax reform should keep each
of these goals in mind as they seek to improve their state’s tax
system.
nuts and Bolts: Basic tax Policy termsThe tax principles described so far are essential to a broad
understanding of why one type of tax is preferable to another.
But there is also a basic set of terms you’ll need to understand
in order to understand how each of these taxes work. This
section explores the “nuts and bolts” of state and local tax
policy.
The Tax BaseThe tax base is all the items or activities subject to a tax. For
any tax, it’s worth distinguishing between the potential tax
base—the set of items that would be taxed if there were no
special exemptions—and the actual tax base used by a given
state. The potential tax base of a general sales tax, for instance,
is everything that a state’s consumers purchase in a given year
for their own personal use. But in every state levying a sales
tax, the actual tax base is much smaller than that, because of
exemptions for everything from groceries to haircuts.
Tax bases are usually measured as a dollar amount to
which a tax rate is applied—for example, the total dollar
amount of taxable income, in the case of the personal income
tax, or the total dollar value of real estate, in the case of the real
property tax. Taxes that are measured this way are called ad valorem, or value-based, taxes.
But not all taxes are calculated based on value: excise
taxes on cigarettes, gasoline and beer are usually calculated
on a per-unit basis. For these excise taxes, the amount of tax
collected depends not on the value of the tax base, but on the
number of items in the tax base. Cigarette taxes, for instance,
typically are applied on a per-pack basis (the tax owed is a
certain number of cents per pack of cigarettes sold). Thus, for a
cigarette tax, the tax base is usually the number of packs sold.
Taxes that are levied on a per-unit basis have one critical flaw—
tax revenues only increase when the number of units sold goes
up. By contrast, ad valorem taxes tend to grow with inflation
even when the number of units sold is unchanged, because
inflation drives the value of the base upwards.
Taxes are often described as having a broad base or a
narrow base. A broad-based tax is one that taxes most of the
potential tax base. For example, a broad-based sales tax is one
that applies to almost all purchases of goods and services. A
narrow-based tax applies to fewer items. A typical narrow-
based sales tax applies only to goods, not services, and has
exemptions for things like food, housing and medicine.
In general, broader tax bases are a good idea. At any
given tax rate, a broad-based tax will raise more revenue than
7Two: Basic PrinciPles and terms
THE ITEP GuIdE To Fair state and local taxes8
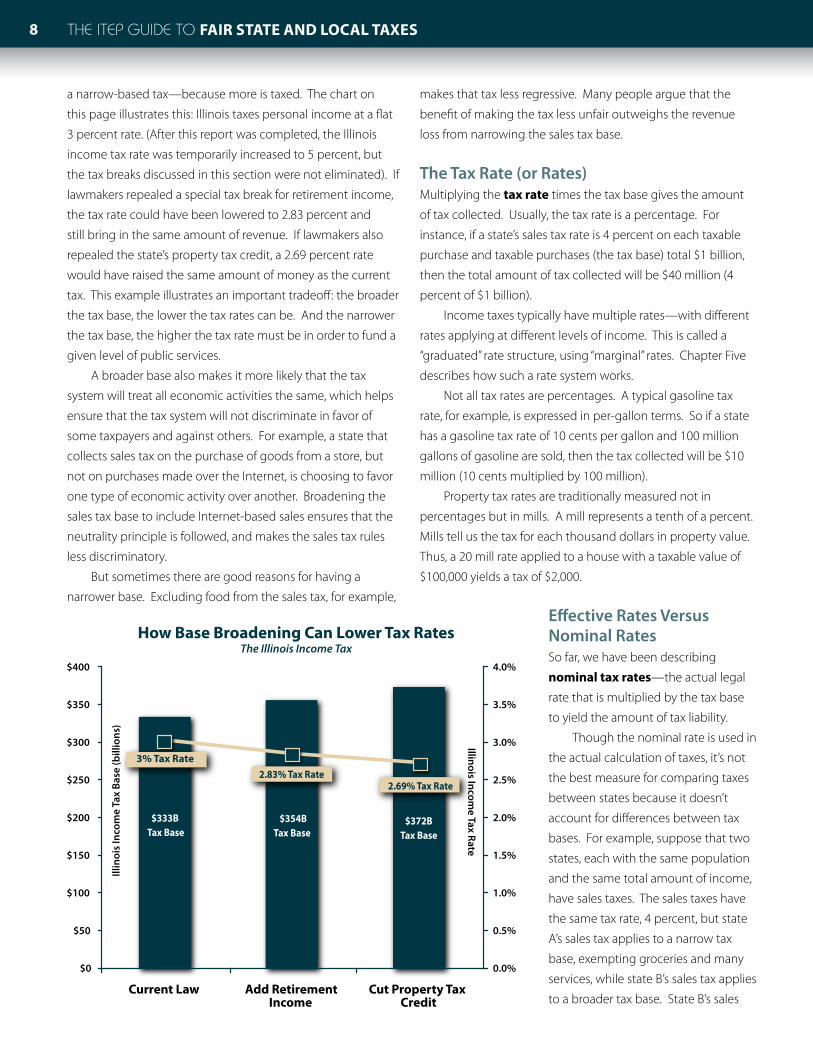
a narrow-based tax—because more is taxed. The chart on
this page illustrates this: Illinois taxes personal income at a flat
3 percent rate. (After this report was completed, the Illinois
income tax rate was temporarily increased to 5 percent, but
the tax breaks discussed in this section were not eliminated). If
lawmakers repealed a special tax break for retirement income,
the tax rate could have been lowered to 2.83 percent and
still bring in the same amount of revenue. If lawmakers also
repealed the state’s property tax credit, a 2.69 percent rate
would have raised the same amount of money as the current
tax. This example illustrates an important tradeoff: the broader
the tax base, the lower the tax rates can be. And the narrower
the tax base, the higher the tax rate must be in order to fund a
given level of public services.
A broader base also makes it more likely that the tax
system will treat all economic activities the same, which helps
ensure that the tax system will not discriminate in favor of
some taxpayers and against others. For example, a state that
collects sales tax on the purchase of goods from a store, but
not on purchases made over the Internet, is choosing to favor
one type of economic activity over another. Broadening the
sales tax base to include Internet-based sales ensures that the
neutrality principle is followed, and makes the sales tax rules
less discriminatory.
But sometimes there are good reasons for having a
narrower base. Excluding food from the sales tax, for example,
makes that tax less regressive. Many people argue that the
benefit of making the tax less unfair outweighs the revenue
loss from narrowing the sales tax base.
The Tax Rate (or Rates)Multiplying the tax rate times the tax base gives the amount
of tax collected. Usually, the tax rate is a percentage. For
instance, if a state’s sales tax rate is 4 percent on each taxable
purchase and taxable purchases (the tax base) total $1 billion,
then the total amount of tax collected will be $40 million (4
percent of $1 billion).
Income taxes typically have multiple rates—with different
rates applying at different levels of income. This is called a
“graduated” rate structure, using “marginal” rates. Chapter Five
describes how such a rate system works.
Not all tax rates are percentages. A typical gasoline tax
rate, for example, is expressed in per-gallon terms. So if a state
has a gasoline tax rate of 10 cents per gallon and 100 million
gallons of gasoline are sold, then the tax collected will be $10
million (10 cents multiplied by 100 million).
Property tax rates are traditionally measured not in
percentages but in mills. A mill represents a tenth of a percent.
Mills tell us the tax for each thousand dollars in property value.
Thus, a 20 mill rate applied to a house with a taxable value of
$100,000 yields a tax of $2,000.
Effective Rates Versus Nominal RatesSo far, we have been describing
nominal tax rates—the actual legal
rate that is multiplied by the tax base
to yield the amount of tax liability.
Though the nominal rate is used in
the actual calculation of taxes, it’s not
the best measure for comparing taxes
between states because it doesn’t
account for differences between tax
bases. For example, suppose that two
states, each with the same population
and the same total amount of income,
have sales taxes. The sales taxes have
the same tax rate, 4 percent, but state
A’s sales tax applies to a narrow tax
base, exempting groceries and many
services, while state B’s sales tax applies
to a broader tax base. State B’s sales
How Base Broadening Can Lower Tax RatesThe Illinois Income Tax
Credit
$333B Tax Base
$354B Tax Base
$372B Tax Base
2.83% Tax Rate2.69% Tax Rate
3% Tax Rate
Current Law Add RetirementIncome
Cut Property Tax
$0
$50
$100
$150
$200
$250
$300
$350
$400
0.0%
0.5%
1.0%
1.5%
2.0%
2.5%
3.0%
3.5%
4.0%
Illin
ois
Inco
me
Tax
Base
(bill
ions
)
Illinois Income Tax Rate
9Two: Basic PrinciPles and terms
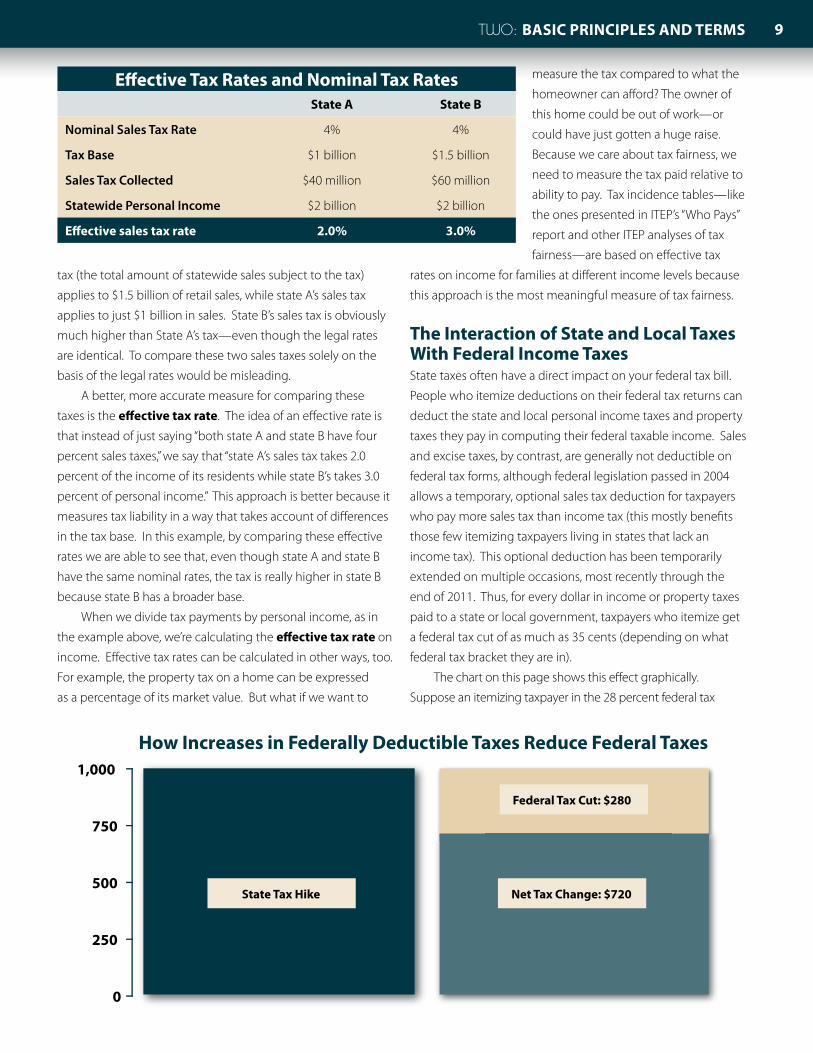
tax (the total amount of statewide sales subject to the tax)
applies to $1.5 billion of retail sales, while state A’s sales tax
applies to just $1 billion in sales. State B’s sales tax is obviously
much higher than State A’s tax—even though the legal rates
are identical. To compare these two sales taxes solely on the
basis of the legal rates would be misleading.
A better, more accurate measure for comparing these
taxes is the effective tax rate. The idea of an effective rate is
that instead of just saying “both state A and state B have four
percent sales taxes,” we say that “state A’s sales tax takes 2.0
percent of the income of its residents while state B’s takes 3.0
percent of personal income.” This approach is better because it
measures tax liability in a way that takes account of differences
in the tax base. In this example, by comparing these effective
rates we are able to see that, even though state A and state B
have the same nominal rates, the tax is really higher in state B
because state B has a broader base.
When we divide tax payments by personal income, as in
the example above, we’re calculating the effective tax rate on
income. Effective tax rates can be calculated in other ways, too.
For example, the property tax on a home can be expressed
as a percentage of its market value. But what if we want to
measure the tax compared to what the
homeowner can afford? The owner of
this home could be out of work—or
could have just gotten a huge raise.
Because we care about tax fairness, we
need to measure the tax paid relative to
ability to pay. Tax incidence tables—like
the ones presented in ITEP’s “Who Pays”
report and other ITEP analyses of tax
fairness—are based on effective tax
rates on income for families at different income levels because
this approach is the most meaningful measure of tax fairness.
the interaction of state and local taxes With Federal income taxesState taxes often have a direct impact on your federal tax bill.
People who itemize deductions on their federal tax returns can
deduct the state and local personal income taxes and property
taxes they pay in computing their federal taxable income. Sales
and excise taxes, by contrast, are generally not deductible on
federal tax forms, although federal legislation passed in 2004
allows a temporary, optional sales tax deduction for taxpayers
who pay more sales tax than income tax (this mostly benefits
those few itemizing taxpayers living in states that lack an
income tax). This optional deduction has been temporarily
extended on multiple occasions, most recently through the
end of 2011. Thus, for every dollar in income or property taxes
paid to a state or local government, taxpayers who itemize get
a federal tax cut of as much as 35 cents (depending on what
federal tax bracket they are in).
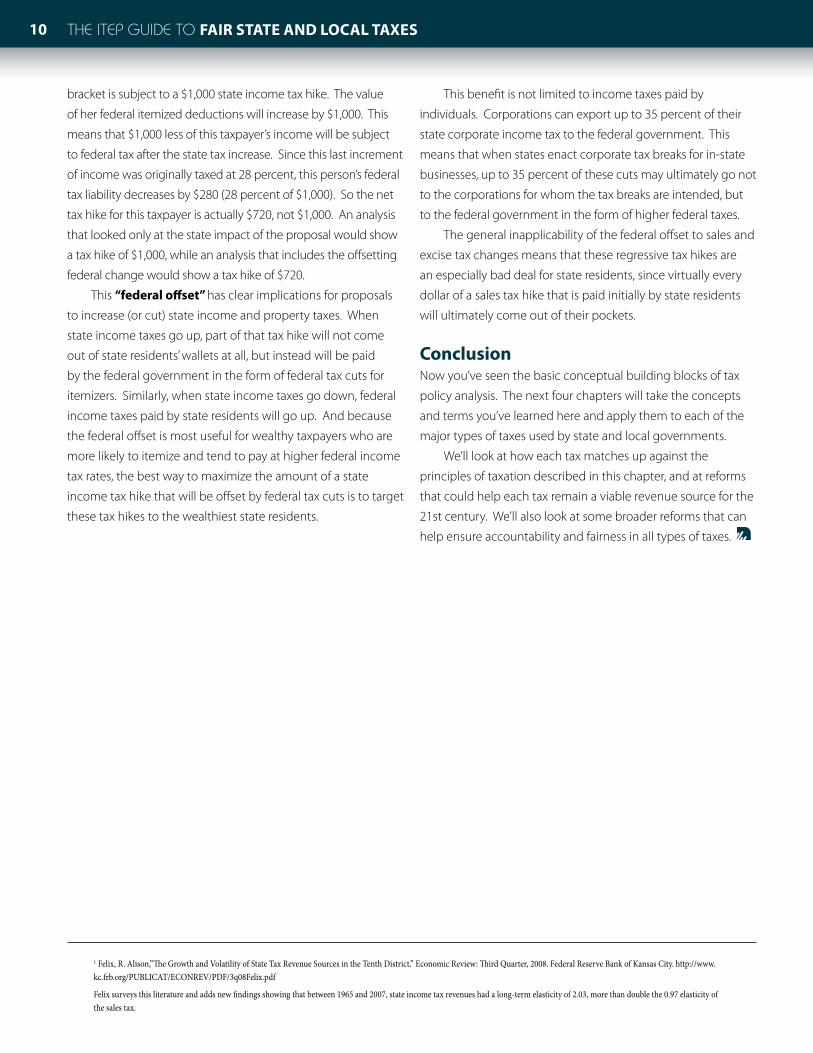
The chart on this page shows this effect graphically.
Suppose an itemizing taxpayer in the 28 percent federal tax
9Two: Basic PrinciPles and terms
effective tax rates and nominal tax ratesstate a state B
Nominal Sales Tax Rate 4% 4%
Tax Base $1 billion $1.5 billion
Sales Tax Collected $40 million $60 million
Statewide Personal Income $2 billion $2 billion
effective sales tax rate 2.0% 3.0%
How Increases in Federally Deductible Taxes Reduce Federal Taxes
Federal Tax Cut: $280
State Tax Hike Net Tax Change: $720
0
250
500
750
1,000
THE ITEP GuIdE To Fair state and local taxes10
bracket is subject to a $1,000 state income tax hike. The value
of her federal itemized deductions will increase by $1,000. This
means that $1,000 less of this taxpayer’s income will be subject
to federal tax after the state tax increase. Since this last increment
of income was originally taxed at 28 percent, this person’s federal
tax liability decreases by $280 (28 percent of $1,000). So the net
tax hike for this taxpayer is actually $720, not $1,000. An analysis
that looked only at the state impact of the proposal would show
a tax hike of $1,000, while an analysis that includes the offsetting
federal change would show a tax hike of $720.
This “federal offset” has clear implications for proposals
to increase (or cut) state income and property taxes. When
state income taxes go up, part of that tax hike will not come
out of state residents’ wallets at all, but instead will be paid
by the federal government in the form of federal tax cuts for
itemizers. Similarly, when state income taxes go down, federal
income taxes paid by state residents will go up. And because
the federal offset is most useful for wealthy taxpayers who are
more likely to itemize and tend to pay at higher federal income
tax rates, the best way to maximize the amount of a state
income tax hike that will be offset by federal tax cuts is to target
these tax hikes to the wealthiest state residents.
This benefit is not limited to income taxes paid by
individuals. Corporations can export up to 35 percent of their
state corporate income tax to the federal government. This
means that when states enact corporate tax breaks for in-state
businesses, up to 35 percent of these cuts may ultimately go not
to the corporations for whom the tax breaks are intended, but
to the federal government in the form of higher federal taxes.
The general inapplicability of the federal offset to sales and
excise tax changes means that these regressive tax hikes are
an especially bad deal for state residents, since virtually every
dollar of a sales tax hike that is paid initially by state residents
will ultimately come out of their pockets.
conclusionNow you’ve seen the basic conceptual building blocks of tax
policy analysis. The next four chapters will take the concepts
and terms you’ve learned here and apply them to each of the
major types of taxes used by state and local governments.
We’ll look at how each tax matches up against the
principles of taxation described in this chapter, and at reforms
that could help each tax remain a viable revenue source for the
21st century. We’ll also look at some broader reforms that can
help ensure accountability and fairness in all types of taxes.
1 Felix, R. Alison,”The Growth and Volatility of State Tax Revenue Sources in the Tenth District.” Economic Review: Third Quarter, 2008. Federal Reserve Bank of Kansas City. http://www.kc.frb.org/PUBLICAT/ECONREV/PDF/3q08Felix.pdf
Felix surveys this literature and adds new findings showing that between 1965 and 2007, state income tax revenues had a long-term elasticity of 2.03, more than double the 0.97 elasticity of the sales tax.
11Three: SaleS and exciSe TaxeS
ChAPTer ThreeSaleS and
exciSe TaxeS
How Sales Taxes WorkSales taxes apply to items we purchase every day, including
goods (such as furniture and automobiles) and services (such
as car repairs and dry cleaning). To compute the sales tax on a
taxable item, the cost of the item is multiplied by the tax rate.
For example, in Michigan, where the sales tax rate is six percent,
the sales tax on a $10 book is sixty cents.1 The cost of the book to
the consumer, after tax, is $10.60. The sales tax base is the total
amount paid for all the goods and services subject to the tax.
The sales tax is an example of an ad valorem tax—that is, a tax
based on the price of the item sold.
In theory, the sales tax applies to all retail transactions—
or sales to the final consumer—but most states tax only a
fraction of household consumption. Some items that can be
thought of as “essentials” are often exempted from the sales tax,
including rent, medicine, utilities, and groceries. But not all sales
tax exemptions apply to “essentials.” Politically powerful business
groups often carve out exemptions for their products, and in
many states, the tax base does not include personal services
such as haircuts and car repairs. A large number of Internet
transactions are also currently untaxed by the states.
States often have more than one sales tax rate. Some
states apply lower tax rates to items such as groceries or
utilities, as a means of providing low-income tax relief.
Other states apply a higher tax rate to goods and services
consumed primarily by tourists, such as hotels or rental cars,
with the goal of “exporting” part of the sales tax to residents of
other states.
Many states also have local sales taxes. These usually (but
not always) apply to the same items as the state sales tax. Thus,
calculating the total state and local sales tax is generally simply a
matter of adding the state rate to the local rate and multiplying
it by the cost of taxable items.
Every state with a sales tax also has a use tax, which applies
to items that are bought outside a state for use within a state.
The use tax is designed to prevent state residents from avoiding
the sales tax by purchasing goods in other states. Residents who
purchase such goods are legally required to report and pay tax
on those purchases, though that requirement is rarely enforced.
Many states are now attempting to boost use tax compliance,
both by passing so-called “Amazon laws” (discussed on page 19)
and by allowing residents to pay the tax through their regular
income tax forms—but enforcement remains a serious problem.
Most states have more than one type of sales tax. They
have a general sales tax (which is what most people mean
when they talk about their state’s “sales tax”), and selective sales taxes on particular goods or services. A typical selective
sales tax—which may have a different rate than the general
sales tax—is a tax on the purchase of alcohol, tobacco or
gasoline, or a tax on utilities, such as electricity and telephone
service. Selective sales taxes, also known as excise taxes, are
discussed later in this chapter.
Sales and excise taxes, or consumption taxes, are an important revenue source, comprising close to half of all state tax revenues in 2010. But these taxes are inevitably regressive, falling far more heavily on low- and middle income taxpayers than on the wealthy. Consumption taxes also face structural problems that threaten their future viability. This chapter looks at
how these taxes work, and outlines options for making consumption taxes somewhat less unfair and more sustainable.
12 The ITeP GuIde To Fair STaTe and local TaxeS12
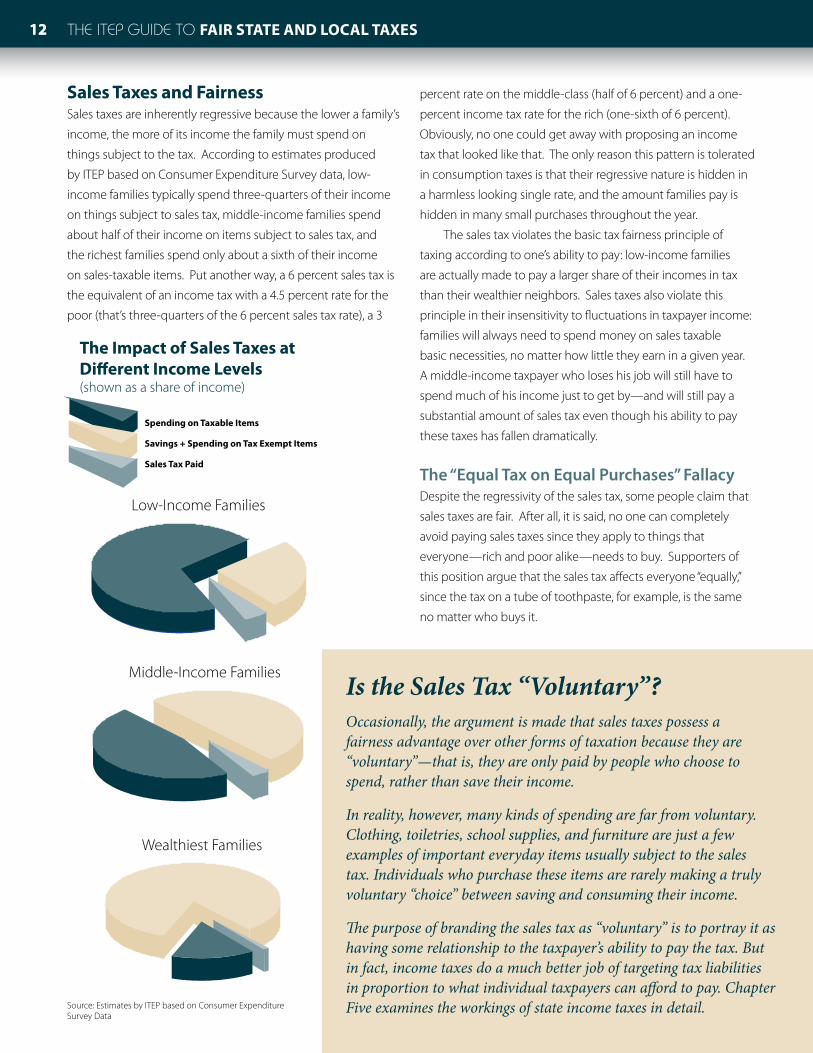
Sales Taxes and FairnessSales taxes are inherently regressive because the lower a family’s
income, the more of its income the family must spend on
things subject to the tax. According to estimates produced
by ITEP based on Consumer Expenditure Survey data, low-
income families typically spend three-quarters of their income
on things subject to sales tax, middle-income families spend
about half of their income on items subject to sales tax, and
the richest families spend only about a sixth of their income
on sales-taxable items. Put another way, a 6 percent sales tax is
the equivalent of an income tax with a 4.5 percent rate for the
poor (that’s three-quarters of the 6 percent sales tax rate), a 3
percent rate on the middle-class (half of 6 percent) and a one-
percent income tax rate for the rich (one-sixth of 6 percent).
Obviously, no one could get away with proposing an income
tax that looked like that. The only reason this pattern is tolerated
in consumption taxes is that their regressive nature is hidden in
a harmless looking single rate, and the amount families pay is
hidden in many small purchases throughout the year.
The sales tax violates the basic tax fairness principle of
taxing according to one’s ability to pay: low-income families
are actually made to pay a larger share of their incomes in tax
than their wealthier neighbors. Sales taxes also violate this
principle in their insensitivity to fluctuations in taxpayer income:
families will always need to spend money on sales taxable
basic necessities, no matter how little they earn in a given year.
A middle-income taxpayer who loses his job will still have to
spend much of his income just to get by—and will still pay a
substantial amount of sales tax even though his ability to pay
these taxes has fallen dramatically.
The “Equal Tax on Equal Purchases” FallacyDespite the regressivity of the sales tax, some people claim that
sales taxes are fair. After all, it is said, no one can completely
avoid paying sales taxes since they apply to things that
everyone—rich and poor alike—needs to buy. Supporters of
this position argue that the sales tax affects everyone “equally,”
since the tax on a tube of toothpaste, for example, is the same
no matter who buys it.
Spending on Taxable Items
Savings + Spending on Tax Exempt Items
Sales Tax Paid
Wealthiest Families
The Impact of Sales Taxes atDi�erent Income Levels(shown as a share of income)
Low-Income Families
Middle-Income FamiliesIs the Sales Tax “Voluntary”?Occasionally, the argument is made that sales taxes possess a fairness advantage over other forms of taxation because they are “voluntary”—that is, they are only paid by people who choose to spend, rather than save their income.
In reality, however, many kinds of spending are far from voluntary. Clothing, toiletries, school supplies, and furniture are just a few examples of important everyday items usually subject to the sales tax. Individuals who purchase these items are rarely making a truly voluntary “choice” between saving and consuming their income.
The purpose of branding the sales tax as “voluntary” is to portray it as having some relationship to the taxpayer’s ability to pay the tax. But in fact, income taxes do a much better job of targeting tax liabilities in proportion to what individual taxpayers can afford to pay. Chapter Five examines the workings of state income taxes in detail.Source: Estimates by ITEP based on Consumer Expenditure
Survey Data
13Three: SaleS and exciSe TaxeS
But this so-called “equality” is precisely why sales taxes fail
the test of fairness. The cost of toothpaste, and therefore the
sales tax on it, is the same for a rich person as for a poor person.
But since the rich person has many times more income, the
amount that he or she pays in tax on that tube of toothpaste is
a much less significant expense—that is, a much smaller share
of his or her income—than the same tax on a middle- or low-
income family.
Of course, a rich family does consume more and thus pays
more sales tax in dollars than does a less well-off family. But in
terms of what those dollars mean to rich families—as a portion
of their income and how it affects their standard of living—the
sales tax has a much less significant effect on the rich than it
does on middle- and low-income families.
Sales Taxes on Business—Who Pays?Most state sales taxes are designed to exempt purchases made
by businesses, on the theory that the sales tax is supposed to
be a tax on final personal consumption. But the distinction
between business and individual purchases is often difficult to
make, and as a result every state applies its sales tax to some
business purchases. These business-input sales taxes add to
the cost of producing goods and services, and therefore mostly
passed forward to consumers in the form of higher retail prices.
In other words, taxing business inputs through the sales tax is
generally akin to taxing the consumer more than once on the
same retail sale. As a result, expanding the sales tax base to
include business inputs will usually hurt low-income taxpayers.
Because some of the sales tax paid by businesses is
exported to out-of-state consumers, lawmakers may find it
politically appealing to apply the sales tax to business purchases.
A manufacturer will likely be able to pass through most of the
sales tax it pays on its inputs to consumers in other states, which
means only a little of the tax will hit state residents.
For more on the issues associated with sales taxes on
businesses, see page 20.
revenue and StabilitySales taxes are a mainstay of state budgets nationwide. But
during times of economic uncertainty, sales tax collections can
be volatile. When the most recent economic recession began in
2008, for example, state sales tax collections were the first major
revenue source to suffer. Sales tax revenues can also decline
when people are simply afraid a downturn may be coming. If
a family thinks it may face hard times soon, it may delay some
spending in anticipation of the worst. Purchases of big-ticket
The “Fair Tax”: Anything But FairSome national and state-level policymakers have unfortunately become enamored with the idea of replacing existing sales, income and corporate taxes with a single high-rate sales tax on virtually everything we consume. This approach is referred to as the “Fair Tax” by its supporters. But its name is only one of the misleading features of this regressive plan.
For example, “fair tax” advocates generally give absurdly low estimates of the sales tax rate that would be necessary to replace existing state taxes. A plan considered in Missouri in 2009 would have created a “fair tax” at a 5.11 percent rate–but an ITEP analysis found that the rate would actually need to be more than twice as high to raise the advertised amount of revenue.
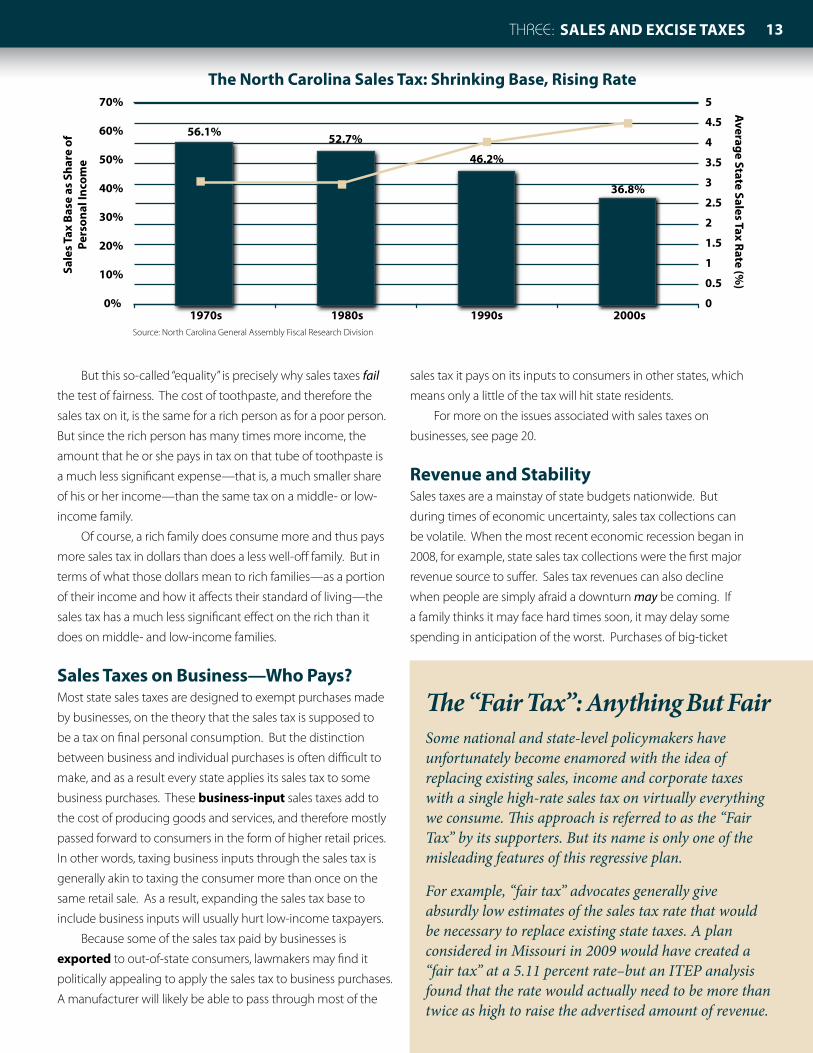
52.7%
The North Carolina Sales Tax: Shrinking Base, Rising Rate
56.1%
46.2%
36.8%
0%
10%
20%
30%
40%
50%
60%
70%
1970s 1980s 1990s 2000s
Sale
s Tax
Bas
e as
Sha
re o
fPe
rson
al In
com
e
0
0.5
1
1.5
2
2.5
3
3.5
4
4.5
5
Average State Sales Tax Rate (%
)
Source: North Carolina General Assembly Fiscal Research Division
14 The ITeP GuIde To Fair STaTe and local TaxeS14
items like new cars are particularly likely to be postponed. As
a result, sales tax revenues can fall during periods of economic
uncertainty—even before a recession has set in.
Even in good economic times, the sales tax usually is not
a fast-growing tax. In large part, this is due to the antiquated
sales tax base used in most states. In 2007, services represented
about 65 percent of individual spending nationally, and are
currently the fastest-growing area of consumption.2 But services
remain largely untaxed by the vast majority of states, and sales
tax collections have noticeably suffered as a result. Furthermore,
failing to tax services also has the potential to increase the
volatility of the sales tax, as the consumption of services is
generally a more stable tax base than sales of big-ticket items,
which make up a significant share of total sales taxes on goods.
The slow growth nature of sales tax revenues frequently
forces lawmakers to increase the sales tax rate just to keep tax
revenues growing with inflation over the long-term. The chart
on the preceding page shows how North Carolina’s declining
sales tax base (fueled both by the increasing prominence of
services and the addition of new exemptions for items like
groceries) has resulted in a higher sales tax rate over time.
Federal deductibilityHeavy reliance on sales taxes brings with it a big disadvantage
for states: the uncertain future of the federal itemized deduction
for sales taxes. Ever since the enactment of the Tax Reform Act
of 1986, sales taxes, unlike income and property taxes, have not
been available as an itemized deduction on federal tax forms.
Federal legislation enacted in 2004 temporarily changed this
fact for tax years 2004 and 2005, and since then the deduction
has been repeatedly extended on a temporary basis. Because
the structure of the deduction forces one to choose between
deducting sales taxes and deducting income taxes, this break
generally only benefits itemizers living in states that lack an
income tax.
Unfortunately for states lacking an income tax, the sales tax
deduction is not nearly as useful as the income tax deduction.
As ITEP recently found in a report titled Leaving Money on
the Table, the handful of states without an income tax could
reduce their residents’ federal tax bills by billions of dollars in the
aggregate by shifting away from sales taxes and toward income
taxes.3 This is because such a shift would raise taxes mostly on
the high-income earners best able to take advantage of the
federal deduction for state tax payments.
But as bad a deal as the sales tax deduction is today, states
lacking an income tax could find themselves in an even worse
situation if the deduction is allowed to lapse entirely. As of this
writing, the deduction has been temporarily extended through
the end of 2011, though the bleakness of the federal budgetary
outlook increases the possibility that the deduction may
disappear at some point in the not-so-distant future. For more
detail on the “federal offset” effect, see page 9.
Gross receipts Taxes: Sales Taxes by another nameBefore moving on to discuss the major issues confronting
sales taxes, it is worth noting that some states levy a variation
of the sales tax, known as a gross receipts tax (GRT). The
main difference is that sales taxes apply (in theory, anyway)
only to retail sales, while a GRT applies to the sales made by
companies at every stage of the production process, including
manufacturing companies, wholesalers, and retailers. In
other words, a GRT is a sales tax that applies to more types
of transactions. From the consumer’s perspective, the major
distinction between gross receipts taxes and retail sales
taxes is that gross receipts taxes are not necessarily itemized
on customers’ bills—though they are nonetheless paid by
customers in the form of higher prices.
The gross receipts taxes currently used by states typically
only apply to the sales receipts from certain types of products,
with utilities and insurance being the most common targets. In
fiscal year 2008, state and local governments raised more than
$40 billion in gross receipts taxes on utilities and insurance—
about twice as much as what the states raised from excise taxes
on alcohol and tobacco.
When state policymakers propose a gross receipts tax as a
proposal for comprehensive tax reform, what they usually have
in mind is something very different from the single-item gross
receipts taxes that most states currently use. These proposals
typically would impose a very low tax rate on a very broad base
of economic activity. For example, in 2005 Ohio enacted a “tax
swap” that, among other things, replaced its corporate income
tax with a gross receipts tax of 0.26 percent on all business
revenues over $150,000 a year.
This sort of gross receipts tax is quite rare on the state level.
The most comprehensive current GRT is the Washington State
Business and Occupation Tax, which taxes the gross receipts of
most companies doing business in Washington at rates ranging
from 0.47 percent to 1.8 percent.
There are three main problems with GRTs. First, like any
sales tax, a GRT hits low-income taxpayers the hardest. Second,
because GRTs are based on the amount that a business sells
15Three: SaleS and exciSe TaxeS
rather than on its profit, a GRT is not sensitive to a business’
ability to pay. In fact, some of the strongest opposition to
Washington’s GRT comes from businesses that engage in high-
volume, low-profit-margin activities—and those that frequently
don’t turn a profit at all. And third, GRTs lead to severe
pyramiding problems, because the tax applies not just to retail
sales but to all stages of the production process. As a result of
this last problem, it doesn’t make much sense to compare the
tax rate of a broad-based GRT to the tax rate of a general sales
tax: a GRT is a multi-stage tax, whereas the sales tax is a single-
stage tax. So, for example, if a GRT of 0.25 percent applies to four
stages in the production of a product, that’s roughly equivalent
to a retail sales tax of one percent.
Perhaps worst of all, many lawmakers erroneously view
GRTs as replacements for state corporate income taxes, simply
because businesses are responsible for remitting these taxes to
the state. But since GRTs are levied on sales, rather than profits,
they are ultimately passed through to consumers like a sales tax,
with all the same regressive effects.
Sales Tax reform: issues and optionsAs lawmakers struggle to modernize the sales tax, they face two
general problems: how to define the tax base, and how to make
the sales tax less unfair. This section surveys a variety of specific
issues falling under these two headings, with special emphasis
on the solutions those issues demand.
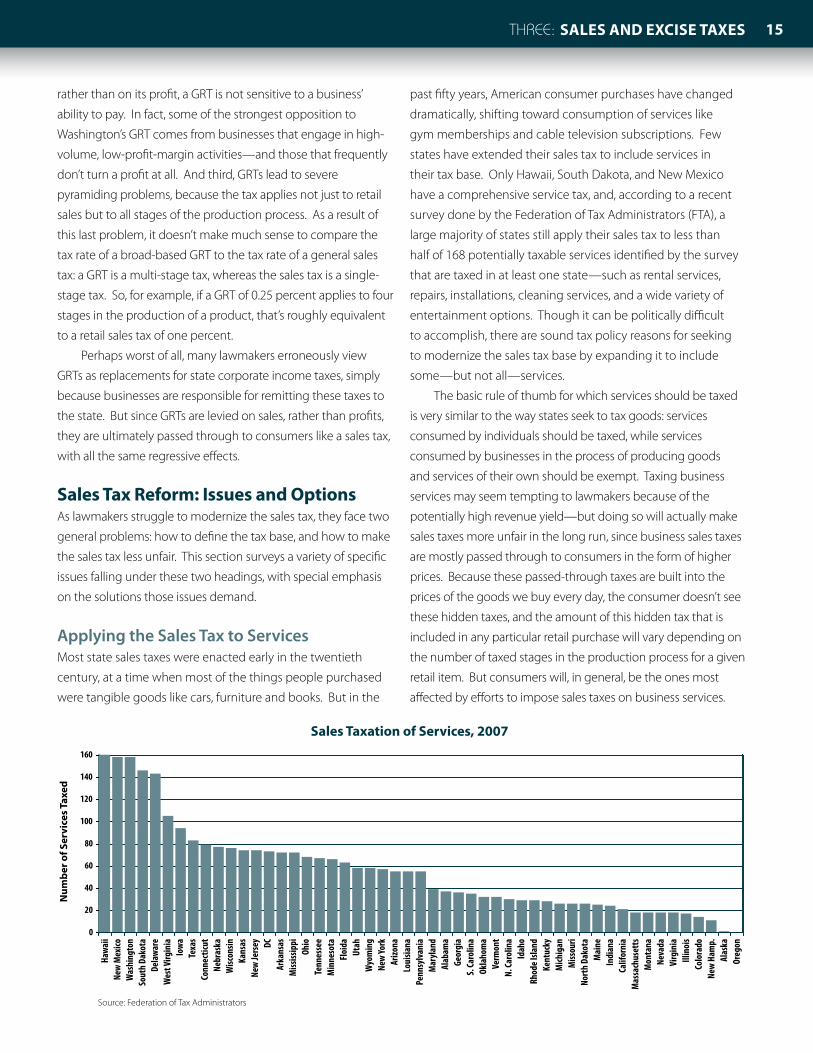
Applying the Sales Tax to ServicesMost state sales taxes were enacted early in the twentieth
century, at a time when most of the things people purchased
were tangible goods like cars, furniture and books. But in the
past fifty years, American consumer purchases have changed
dramatically, shifting toward consumption of services like
gym memberships and cable television subscriptions. Few
states have extended their sales tax to include services in
their tax base. Only Hawaii, South Dakota, and New Mexico
have a comprehensive service tax, and, according to a recent
survey done by the Federation of Tax Administrators (FTA), a
large majority of states still apply their sales tax to less than
half of 168 potentially taxable services identified by the survey
that are taxed in at least one state—such as rental services,
repairs, installations, cleaning services, and a wide variety of
entertainment options. Though it can be politically difficult
to accomplish, there are sound tax policy reasons for seeking
to modernize the sales tax base by expanding it to include
some—but not all—services.
The basic rule of thumb for which services should be taxed
is very similar to the way states seek to tax goods: services
consumed by individuals should be taxed, while services
consumed by businesses in the process of producing goods
and services of their own should be exempt. Taxing business
services may seem tempting to lawmakers because of the
potentially high revenue yield—but doing so will actually make
sales taxes more unfair in the long run, since business sales taxes
are mostly passed through to consumers in the form of higher
prices. Because these passed-through taxes are built into the
prices of the goods we buy every day, the consumer doesn’t see
these hidden taxes, and the amount of this hidden tax that is
included in any particular retail purchase will vary depending on
the number of taxed stages in the production process for a given
retail item. But consumers will, in general, be the ones most
affected by efforts to impose sales taxes on business services.
Sales Taxation of Services, 2007
Haw
aii
New
Mex
icoW
ashi
ngto
nSo
uth
Dako
taDe
law
are
Wes
t Virg
inia
Iow
aTe
xas
Conn
ectic
utNe
bras
kaW
iscon
sinKa
nsas
New
Jers
ey DCAr
kans
asM
ississ
ippi
Ohio
Tenn
esse
eM
inne
sota
Floi
daUt
ahW
yom
ing
New
York
Arizo
naLo
uisia
naPe
nnsy
lvan
iaM
aryl
and
Alab
ama
Geor
gia
S. Ca
rolin
aOk
laho
ma
Verm
ont
N. Ca
rolin
aId
aho
Rhod
e Isla
ndKe
ntuc
kyM
ichig
anM
issou
riNo
rth
Dako
taM
aine
Indi
ana
Calif
orni
aM
assa
chus
etts
Mon
tana
Neva
daVi
rgin
iaIll
inoi
sCo
lora
doNe
w H
amp.
Alas
kaOr
egon
Num
ber o
f Ser
vice
s Tax
ed
0
20
40
60
80
100
120
140
160
Source: Federation of Tax Administrators

16 The ITeP GuIde To Fair STaTe and local TaxeS16
Taxing personal services, in contrast, can make the sales tax
more fair in two ways. First, taxing services helps ensure that the
amount of sales tax anyone owes will depend primarily on how
much they spend—not what they spend it on. There is nothing
inherently better (or worse) for society in spending money on
services as opposed to goods. Taxing goods but not services
discriminates in favor of consumers who prefer services, and
discriminates against those who prefer goods.
Second, if done carefully, expanding the tax base to
include more services typically thought of as “luxuries” has the
potential to make the sales tax less regressive. This is because
these services tend to be purchased more frequently by
higher-income households. Of course, the sales tax will still be
regressive overall no matter how broad the tax base is made.
But taxing services, in combination with the types of income tax
credits discussed on page 39, could represent an important step
towards tax fairness.
More fundamentally for state lawmakers facing long-term
fiscal crises, taxing services will also increase the amount of
sales tax revenue collected at any given tax rate—which makes
it less likely that lawmakers will be forced to raise the sales
tax rate to balance budgets. And broadening the tax base
makes sales tax revenues more stable in the long run, because
declines in one area of taxable consumption will be offset by
gains in another.
Addressing Sales Tax ExemptionsEvery state’s sales tax allows targeted exemptions. These
exemptions are usually intended to make the sales tax less
unfair. Sales taxes can be made less regressive by taxing more
of the things the wealthy consume the most and fewer of the
things on which middle- and low-income families spend their
money (e.g. taxing restaurant meals, but not groceries). Of
course, every state and local general sales tax is regressive. But
the degree of unfairness ranges substantially—from moderately
regressive in states like Vermont to extremely regressive in states
like Tennessee.
The most important factor affecting regressivity is whether
groceries are taxed. Taxing food is extremely regressive because
such a high portion of the income of poorer families goes to
mere sustenance.
But there are reasons to be concerned about the long-term
impact of sales tax exemptions. Economists generally argue
that the sales tax base should be as broad as possible, for several
reasons:
■ Exemptions are poorly targeted. The poorest 40 percent
of taxpayers typically receive about 25 percent of the bene-
fit from exempting food. The rest goes to wealthier taxpay-
ers.
■ While exemptions can make the sales tax less regressive,
they also create a new source of unfairness: different treatment of taxpayers who earn similar amounts of income. By exempting food while taxing other retail sales,
lawmakers are discriminating against taxpayers who spend
more of their money on things other than food.
■ Exemptions tend to make sales tax collections fluctuate more, because changes in particular economic
sectors can have a larger effect on tax collections. A
broader tax base will allow tax revenues to be less sensitive
to sudden swings in retail purchases of particular items
since those swings will generally be offset by changes in
purchases of other items.
■ Because they offer tax relief to everyone regardless of their
individual need, exemptions are very costly. Exempting
groceries, for example, has the potential to reduce the
revenue yield of each penny of sales tax by nearly twenty
percent. This requires that lawmakers increase tax rates in
order to offset the reduction in the tax base.
■ Exemptions are an administrative challenge to
policymakers, tax administrators, and retailers because
any exemption requires a way of distinguishing between
taxable and exempt products. For example, in some states,
a particular food item may be taxed based only on whether
or not the seller provides eating utensils with the item.
Exemptions require policymakers and tax administrators to
make countless decisions of this sort, and retailers must be
familiar with all of these rules.
■ In states that allow local sales taxes, lawmakers must decide whether exemptions should apply to
Sales Taxes as a Share of Income in North Dakota and South Dakota
0%1%
2%3%4%5%
6%7%8%
9%
North Dakota South Dakota
Bot 20 Next 20 Mid 20 4th 20 Next 15 Next 4 Top 1
Source: ITEP Microsimulation Model
17Three: SaleS and exciSe TaxeS
local taxes as well. Doing so can be costly to local
governments, but not doing so creates more complication
for retailers and tax administrators.
In addition to each of these problems, many states offer
a variety of poorly-conceived sales tax exemptions with no
purpose other than to assist favored special interests. While
the sales tax is well enough understood that special interest
loopholes in the tax law tend to get noticed (especially
compared to some of the more complex tax breaks that are
sometimes hidden in the income tax), that doesn’t mean that
special interests don’t work hard to win preferential sales tax
treatment. In some cases, these exemptions cross into the
absurd, such as the exemption for products made from trees
infested by pine beetles in Colorado, or the Arkansas exemption
for vehicles purchased by blind veterans.
With few exceptions, exemptions of personal consumption
items from the sales tax are not necessary. At best, exemptions
for necessities can be described as a second-best option
to income tax credits for reducing regressivity. At worst,
unwarranted exemptions can be described as expensive,
wasteful, inefficient, unfair, and overly complex.
Sales Tax Holidays—Boon or Boondoggle?In recent years, lawmakers in over a dozen states have sought to
lessen the regressive impact of sales taxes by enacting “sales tax
holidays.” These are temporary sales tax exemptions for clothing,
computers, school supplies, and other “back to school” expenses.
Most sales tax holidays last only a few days.
Virtually any sales tax cut will provide larger benefits, as a
share of income, to low-income taxpayers than to the wealthy.
But sales tax holidays are a problematic way of achieving low-
income tax relief, for several reasons:
■ A three day sales tax holiday for selected items still forces
taxpayers to pay sales tax on these items during the
other 362 days of the year, leaving a regressive tax system
basically unchanged.
■ Sales tax holidays are poorly targeted, providing tax breaks
to both wealthy taxpayers and nonresidents.
■ Sales tax holidays do not stimulate the economy. The
increased consumption observed during such holidays has
been shown to be primarily the result of consumers shifting
the timing of their purchases.
■ Many low-income taxpayers don’t have the luxury of timing
their purchases to coincide with brief sales tax holidays. By
contrast, wealthier taxpayers are likely to be able to time
their purchases appropriately.
■ Retailers know that consumers will shift their spending
toward sales tax holidays to take advantage of the
temporary tax exemption. Savvy retailers can take
advantage of this shift by hiking prices during the holiday.
■ Any sales tax exemption creates administrative difficulties
for state governments, and for the retailers who must
collect the tax. But a temporary exemption requires retailers
and tax administrators to wade through a sheaf of red tape
for an exemption that lasts only a few days.
■ Perhaps most important for cash-strapped lawmakers, sales
tax holidays are costly. Revenue lost through sales tax holi-
days will ultimately have to be made up somewhere else.
Sales tax holidays do have advantages, of course. The
biggest beneficiaries from a sales tax cut are the low- and
middle-income families affected most by sales taxes. And
the heavily-publicized manner in which sales tax holidays are
typically administered means that taxpayers will be very aware
of the tax cut they receive—and will know that state lawmakers
are responsible for it.
But in the long run, sales tax holidays are simply too insig-
nificant to change the regressive nature of a state’s tax system—
and may lull lawmakers into believing that they have resolved
the unfairness of sales taxes. Ultimately, sales tax holidays are
much more political gimmick than reasoned tax policy.
Sales Tax CreditsLawmakers seeking to make the sales tax less unfair without
breaking the bank do have an increasingly popular alternative
to broad-based exemptions of the “essentials”: targeted sales
tax credits. Usually administered through the income tax,
these credits generally provide a flat dollar amount for each
member of a family, and are available only to taxpayers with
income below a certain threshold. These credits are also
usually refundable, meaning that the value of the credit does
not depend on the amount of taxes a claimant pays (for more
on refundability, see page 40). This approach offers several
advantages over sales tax exemptions, among them: credits
can be targeted to state residents only, and they can be
designed to apply to whichever income groups are deemed
to be in need of tax relief. The chart on the next page shows
the details of one such program, the Kansas food sales tax
refund. Low-income Kansas taxpayers over 55 years old, and
non-elderly Kansans with children, can claim up to $90 for each
18 The ITeP GuIde To Fair STaTe and local TaxeS18
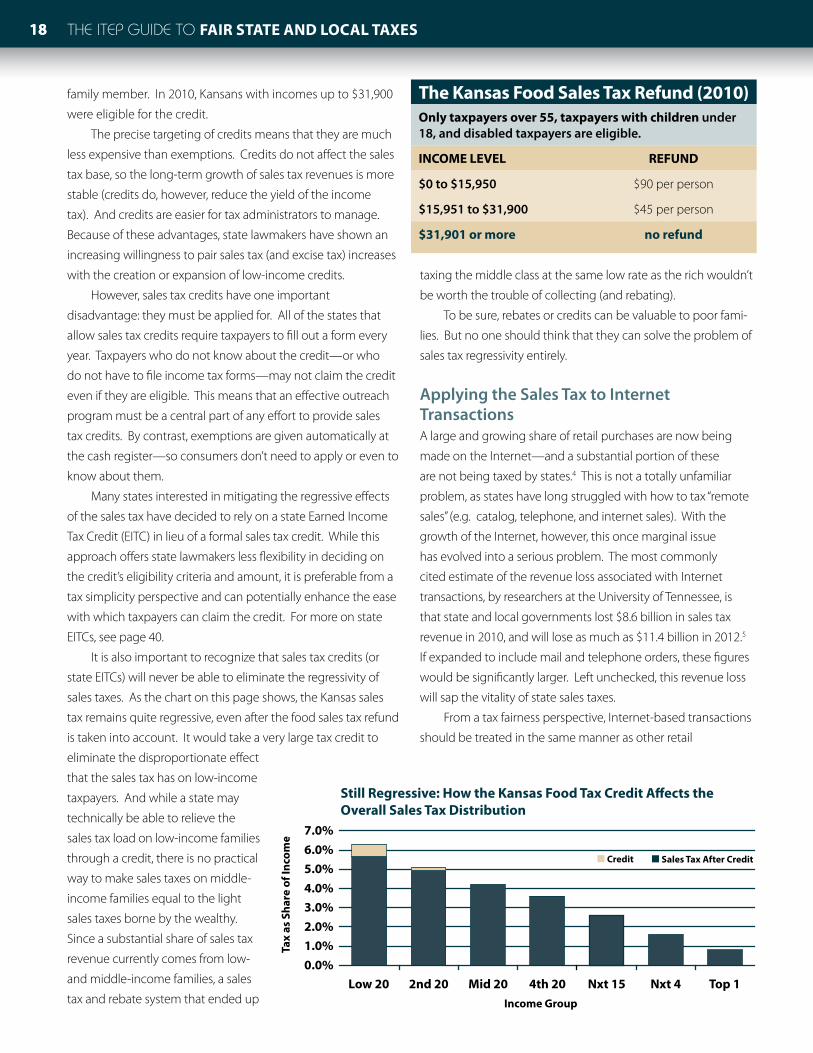
family member. In 2010, Kansans with incomes up to $31,900
were eligible for the credit.
The precise targeting of credits means that they are much
less expensive than exemptions. Credits do not affect the sales
tax base, so the long-term growth of sales tax revenues is more
stable (credits do, however, reduce the yield of the income
tax). And credits are easier for tax administrators to manage.
Because of these advantages, state lawmakers have shown an
increasing willingness to pair sales tax (and excise tax) increases
with the creation or expansion of low-income credits.
However, sales tax credits have one important
disadvantage: they must be applied for. All of the states that
allow sales tax credits require taxpayers to fill out a form every
year. Taxpayers who do not know about the credit—or who
do not have to file income tax forms—may not claim the credit
even if they are eligible. This means that an effective outreach
program must be a central part of any effort to provide sales
tax credits. By contrast, exemptions are given automatically at
the cash register—so consumers don’t need to apply or even to
know about them.
Many states interested in mitigating the regressive effects
of the sales tax have decided to rely on a state Earned Income
Tax Credit (EITC) in lieu of a formal sales tax credit. While this
approach offers state lawmakers less flexibility in deciding on
the credit’s eligibility criteria and amount, it is preferable from a
tax simplicity perspective and can potentially enhance the ease
with which taxpayers can claim the credit. For more on state
EITCs, see page 40.
It is also important to recognize that sales tax credits (or
state EITCs) will never be able to eliminate the regressivity of
sales taxes. As the chart on this page shows, the Kansas sales
tax remains quite regressive, even after the food sales tax refund
is taken into account. It would take a very large tax credit to
eliminate the disproportionate effect
that the sales tax has on low-income
taxpayers. And while a state may
technically be able to relieve the
sales tax load on low-income families
through a credit, there is no practical
way to make sales taxes on middle-
income families equal to the light
sales taxes borne by the wealthy.
Since a substantial share of sales tax
revenue currently comes from low-
and middle-income families, a sales
tax and rebate system that ended up
taxing the middle class at the same low rate as the rich wouldn’t
be worth the trouble of collecting (and rebating).
To be sure, rebates or credits can be valuable to poor fami-
lies. But no one should think that they can solve the problem of
sales tax regressivity entirely.
Applying the Sales Tax to Internet TransactionsA large and growing share of retail purchases are now being
made on the Internet—and a substantial portion of these
are not being taxed by states.4 This is not a totally unfamiliar
problem, as states have long struggled with how to tax “remote
sales” (e.g. catalog, telephone, and internet sales). With the
growth of the Internet, however, this once marginal issue
has evolved into a serious problem. The most commonly
cited estimate of the revenue loss associated with Internet
transactions, by researchers at the University of Tennessee, is
that state and local governments lost $8.6 billion in sales tax
revenue in 2010, and will lose as much as $11.4 billion in 2012.5
If expanded to include mail and telephone orders, these figures
would be significantly larger. Left unchecked, this revenue loss
will sap the vitality of state sales taxes.
From a tax fairness perspective, Internet-based transactions
should be treated in the same manner as other retail
Still Regressive: How the Kansas Food Tax Credit A�ects theOverall Sales Tax Distribution
0.0%1.0%2.0%3.0%4.0%5.0%6.0%7.0%
Low 20 2nd 20 Mid 20 4th 20 Nxt 15 Nxt 4 Top 1
Credit Sales Tax After Credit
Tax
as S
hare
of I
ncom
e
Income Group
The Kansas Food Sales Tax refund (2010)only taxpayers over 55, taxpayers with children under 18, and disabled taxpayers are eligible.
incoMe leVel reFUnd
$0 to $15,950 $90 per person
$15,951 to $31,900 $45 per person
$31,901 or more no refund
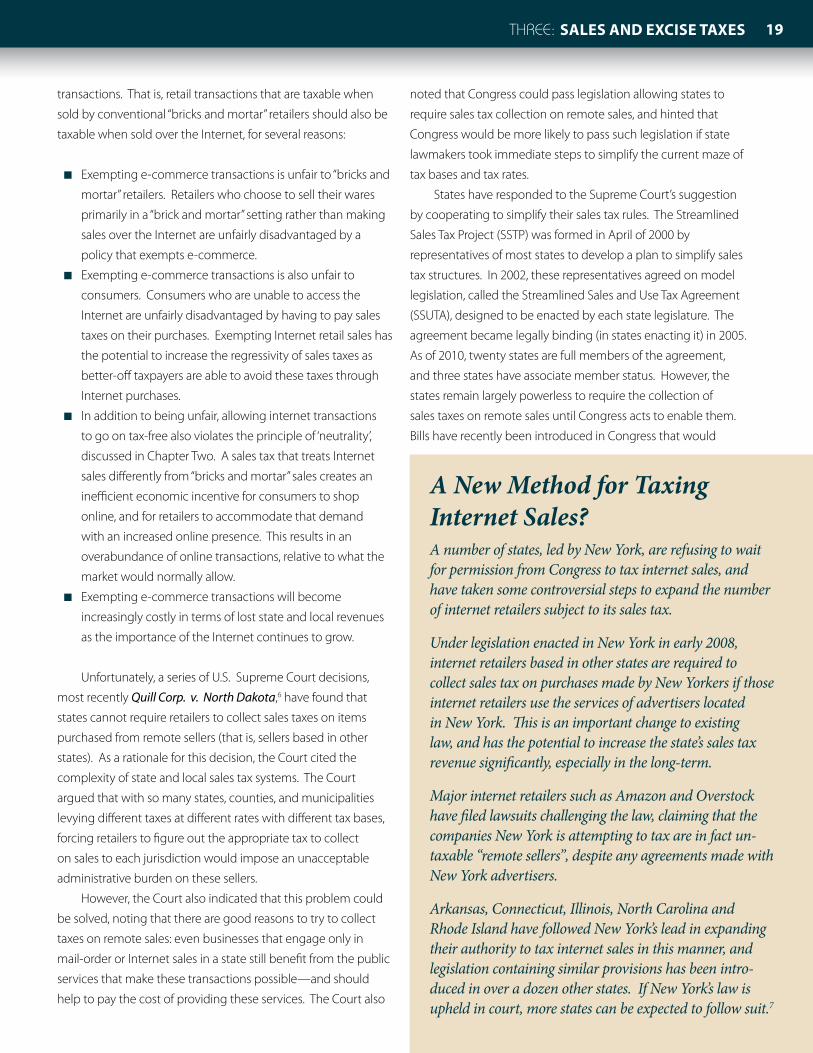
19Three: SaleS and exciSe TaxeS
transactions. That is, retail transactions that are taxable when
sold by conventional “bricks and mortar” retailers should also be
taxable when sold over the Internet, for several reasons:
■ Exempting e-commerce transactions is unfair to “bricks and
mortar” retailers. Retailers who choose to sell their wares
primarily in a “brick and mortar” setting rather than making
sales over the Internet are unfairly disadvantaged by a
policy that exempts e-commerce.
■ Exempting e-commerce transactions is also unfair to
consumers. Consumers who are unable to access the
Internet are unfairly disadvantaged by having to pay sales
taxes on their purchases. Exempting Internet retail sales has
the potential to increase the regressivity of sales taxes as
better-off taxpayers are able to avoid these taxes through
Internet purchases.
■ In addition to being unfair, allowing internet transactions
to go on tax-free also violates the principle of ‘neutrality’,
discussed in Chapter Two. A sales tax that treats Internet
sales differently from “bricks and mortar” sales creates an
inefficient economic incentive for consumers to shop
online, and for retailers to accommodate that demand
with an increased online presence. This results in an
overabundance of online transactions, relative to what the
market would normally allow.
■ Exempting e-commerce transactions will become
increasingly costly in terms of lost state and local revenues
as the importance of the Internet continues to grow.
Unfortunately, a series of U.S. Supreme Court decisions,
most recently Quill Corp. v. North Dakota,6 have found that
states cannot require retailers to collect sales taxes on items
purchased from remote sellers (that is, sellers based in other
states). As a rationale for this decision, the Court cited the
complexity of state and local sales tax systems. The Court
argued that with so many states, counties, and municipalities
levying different taxes at different rates with different tax bases,
forcing retailers to figure out the appropriate tax to collect
on sales to each jurisdiction would impose an unacceptable
administrative burden on these sellers.
However, the Court also indicated that this problem could
be solved, noting that there are good reasons to try to collect
taxes on remote sales: even businesses that engage only in
mail-order or Internet sales in a state still benefit from the public
services that make these transactions possible—and should
help to pay the cost of providing these services. The Court also
noted that Congress could pass legislation allowing states to
require sales tax collection on remote sales, and hinted that
Congress would be more likely to pass such legislation if state
lawmakers took immediate steps to simplify the current maze of
tax bases and tax rates.
States have responded to the Supreme Court’s suggestion
by cooperating to simplify their sales tax rules. The Streamlined
Sales Tax Project (SSTP) was formed in April of 2000 by
representatives of most states to develop a plan to simplify sales
tax structures. In 2002, these representatives agreed on model
legislation, called the Streamlined Sales and Use Tax Agreement
(SSUTA), designed to be enacted by each state legislature. The
agreement became legally binding (in states enacting it) in 2005.
As of 2010, twenty states are full members of the agreement,
and three states have associate member status. However, the
states remain largely powerless to require the collection of
sales taxes on remote sales until Congress acts to enable them.
Bills have recently been introduced in Congress that would
A New Method for Taxing Internet Sales?A number of states, led by New York, are refusing to wait for permission from Congress to tax internet sales, and have taken some controversial steps to expand the number of internet retailers subject to its sales tax.
Under legislation enacted in New York in early 2008, internet retailers based in other states are required to collect sales tax on purchases made by New Yorkers if those internet retailers use the services of advertisers located in New York. This is an important change to existing law, and has the potential to increase the state’s sales tax revenue significantly, especially in the long-term.
Major internet retailers such as Amazon and Overstock have filed lawsuits challenging the law, claiming that the companies New York is attempting to tax are in fact un-taxable “remote sellers”, despite any agreements made with New York advertisers.
Arkansas, Connecticut, Illinois, North Carolina and Rhode Island have followed New York’s lead in expanding their authority to tax internet sales in this manner, and legislation containing similar provisions has been intro-duced in over a dozen other states. If New York’s law is upheld in court, more states can be expected to follow suit.7
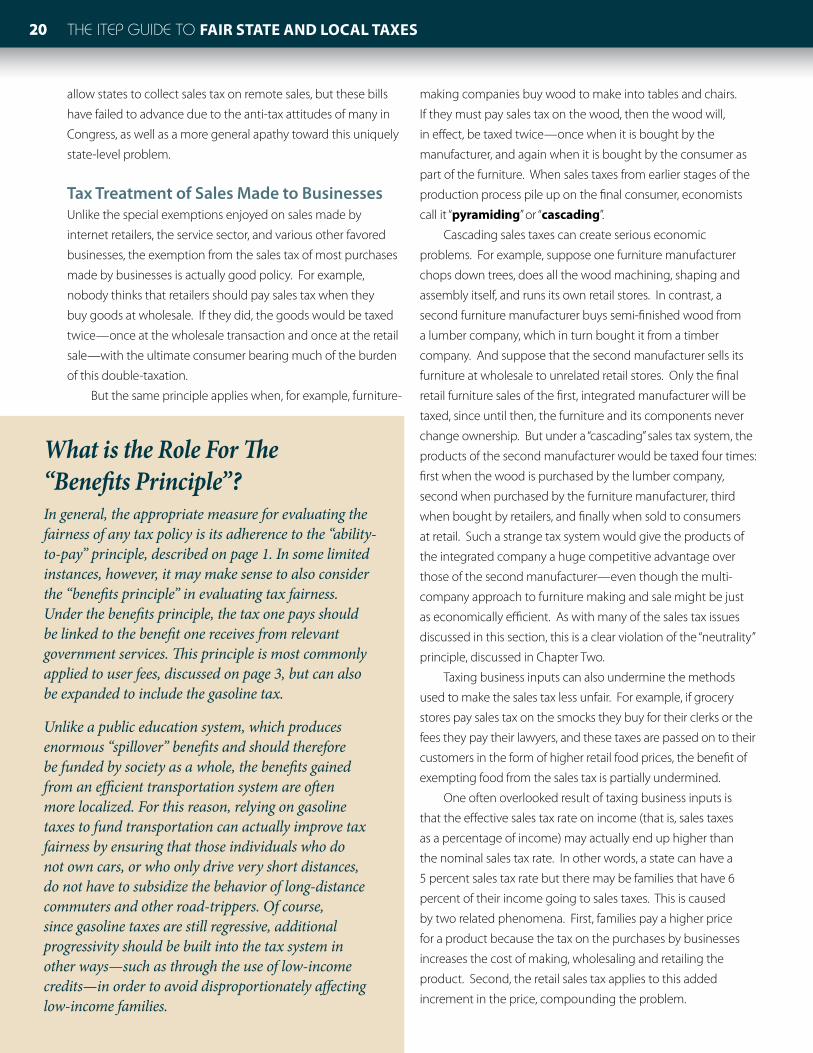
20 The ITeP GuIde To Fair STaTe and local TaxeS20
allow states to collect sales tax on remote sales, but these bills
have failed to advance due to the anti-tax attitudes of many in
Congress, as well as a more general apathy toward this uniquely
state-level problem.
Tax Treatment of Sales Made to BusinessesUnlike the special exemptions enjoyed on sales made by
internet retailers, the service sector, and various other favored
businesses, the exemption from the sales tax of most purchases
made by businesses is actually good policy. For example,
nobody thinks that retailers should pay sales tax when they
buy goods at wholesale. If they did, the goods would be taxed
twice—once at the wholesale transaction and once at the retail
sale—with the ultimate consumer bearing much of the burden
of this double-taxation.
But the same principle applies when, for example, furniture-
making companies buy wood to make into tables and chairs.
If they must pay sales tax on the wood, then the wood will,
in effect, be taxed twice—once when it is bought by the
manufacturer, and again when it is bought by the consumer as
part of the furniture. When sales taxes from earlier stages of the
production process pile up on the final consumer, economists
call it “pyramiding” or “cascading”.
Cascading sales taxes can create serious economic
problems. For example, suppose one furniture manufacturer
chops down trees, does all the wood machining, shaping and
assembly itself, and runs its own retail stores. In contrast, a
second furniture manufacturer buys semi-finished wood from
a lumber company, which in turn bought it from a timber
company. And suppose that the second manufacturer sells its
furniture at wholesale to unrelated retail stores. Only the final
retail furniture sales of the first, integrated manufacturer will be
taxed, since until then, the furniture and its components never
change ownership. But under a “cascading” sales tax system, the
products of the second manufacturer would be taxed four times:
first when the wood is purchased by the lumber company,
second when purchased by the furniture manufacturer, third
when bought by retailers, and finally when sold to consumers
at retail. Such a strange tax system would give the products of
the integrated company a huge competitive advantage over
those of the second manufacturer—even though the multi-
company approach to furniture making and sale might be just
as economically efficient. As with many of the sales tax issues
discussed in this section, this is a clear violation of the “neutrality”
principle, discussed in Chapter Two.
Taxing business inputs can also undermine the methods
used to make the sales tax less unfair. For example, if grocery
stores pay sales tax on the smocks they buy for their clerks or the
fees they pay their lawyers, and these taxes are passed on to their
customers in the form of higher retail food prices, the benefit of
exempting food from the sales tax is partially undermined.
One often overlooked result of taxing business inputs is
that the effective sales tax rate on income (that is, sales taxes
as a percentage of income) may actually end up higher than
the nominal sales tax rate. In other words, a state can have a
5 percent sales tax rate but there may be families that have 6
percent of their income going to sales taxes. This is caused
by two related phenomena. First, families pay a higher price
for a product because the tax on the purchases by businesses
increases the cost of making, wholesaling and retailing the
product. Second, the retail sales tax applies to this added
increment in the price, compounding the problem.
What is the Role For The “Benefits Principle”?In general, the appropriate measure for evaluating the fairness of any tax policy is its adherence to the “ability-to-pay” principle, described on page 1. In some limited instances, however, it may make sense to also consider the “benefits principle” in evaluating tax fairness. Under the benefits principle, the tax one pays should be linked to the benefit one receives from relevant government services. This principle is most commonly applied to user fees, discussed on page 3, but can also be expanded to include the gasoline tax.
Unlike a public education system, which produces enormous “spillover” benefits and should therefore be funded by society as a whole, the benefits gained from an efficient transportation system are often more localized. For this reason, relying on gasoline taxes to fund transportation can actually improve tax fairness by ensuring that those individuals who do not own cars, or who only drive very short distances, do not have to subsidize the behavior of long-distance commuters and other road-trippers. Of course, since gasoline taxes are still regressive, additional progressivity should be built into the tax system in other ways—such as through the use of low-income credits—in order to avoid disproportionately affecting low-income families.

21Three: SaleS and exciSe TaxeS
With only a few minor exceptions, a sales tax on business
inputs is no more fair than any other kind of regressive sales tax,
with the added drawback that it distorts the economy.
How excise Taxes WorkExcise taxes are sales taxes that apply to particular products.
Compared to income, property, and general sales taxes, excise
taxes constitute a fairly small portion of state revenues. This is
because excise taxes lack a broad base, and are instead levied
on only a few specific products—typically tobacco, fuel, and
alcohol. In part because of its narrow base, the tobacco tax in
particular has become a popular source of revenue even among
politicians that are generally opposed to raising taxes—though
health concerns have also contributed to this popularity.
Unlike general sales taxes, excise taxes are usually applied
on a per-unit basis instead of as a percentage of the purchase
price. For instance, cigarette excise taxes are calculated in cents
per pack. And most gasoline excise taxes are imposed in cents
per gallon. As is explained in the next section, this structure
contributes to the extreme regressivity of excise taxes.
Because excise taxes are generally not itemized on
consumer receipts, they tend to be invisible to the taxpayer.
Nonetheless, while most states levy general sales taxes, every
state levies excise taxes on tobacco, alcohol, and gasoline.
excise Taxes and FairnessLike sales taxes, excise taxes as a share of personal income fall
more heavily on middle- and low-income families than on the
rich, and thus violate the principle of “vertical equity,” explained
on page 5. In fact, excise taxes tend to be even more regressive
than general sales taxes. This is because excise taxes are
unrelated to the price of the item purchased. Under a typical
sales tax, a wealthy person purchasing an expensive Mercedes
would pay more—in dollars—than a middle-income family
purchasing a less expensive Chevrolet. But excise taxes do not
work this way because of their per-unit basis. The excise tax paid
on premium wine, beer, and cigarettes is the same as that paid
on less expensive brands.
The regressivity of cigarette excise taxes is especially
pronounced due to an additional factor: lower-income
individuals are far more likely to smoke than are wealthy
individuals. Unlike most categories of products and services—
where wealthier individuals tend to spend more than lower- and
middle-income families—cigarette consumption is actually
concentrated among the less wealthy members of society.
Taxes on cigarettes, therefore, are particularly regressive.
Why levy excise Taxes?In addition to violating the principle of “vertical equity,” excise
taxes on their face also appear to violate the principle of
“horizontal equity” (explained on page 5) by singling out those
taxpayers who chose to spend a portion of their income on
items subject to excise taxes. In reality, however, the rationale for
levying most excise taxes is that consumers of these products
are in some way not similar to other consumers, and are thus
deserving of differential treatment under the tax law. The
following three reasons for levying excise taxes are each based
on this assumption.
Levying “Sin Taxes” to Discourage ConsumptionExcise taxes are commonly referred to as “sin taxes” because
they are applied to items whose consumption is deemed to be
detrimental to society (e.g. alcohol, tobacco, and gasoline). By
singling out these products for excise taxation, their price can
be increased in order to discourage both their consumption and
the societal ills associated with such consumption—including
drunk-driving, second-hand smoke, vehicle emission pollution,
etc. Extending this idea further, proposals to impose excise taxes
on soda in order to reduce obesity, and its associated strain on
the nation’s health care system, have recently received attention
at both the state and federal levels.
While pursuing social policy goals such as these through
the tax code can be controversial, this strategy has proven
effective in some circumstances. Cigarette taxes, for example,
have been shown to have a meaningful impact on reducing
smoking, especially among younger people.8 But even under a
cigarette tax levied at a high rate, the vast majority of smokers
will simply pay the higher tax and continue in their habit. This
is even more true of gasoline taxes, which at current levels
have been shown to be relatively ineffective at reducing
consumption.9
Levying “Sin Taxes” to Pay for Societal CostsBecause some individuals will always continue to consume
certain products despite the presence of “sin taxes,” such taxes
can also provide revenues with which to compensate society for
the burdens imposed by these goods. A smoker whose second-
hand smoke affects the health of current or future Medicare
recipients, for example, is necessitating higher spending on the
part of government due to her decision to smoke.10 A similar
argument can be made regarding the plethora of environmental
costs associated with gasoline consumption—and in fact, a
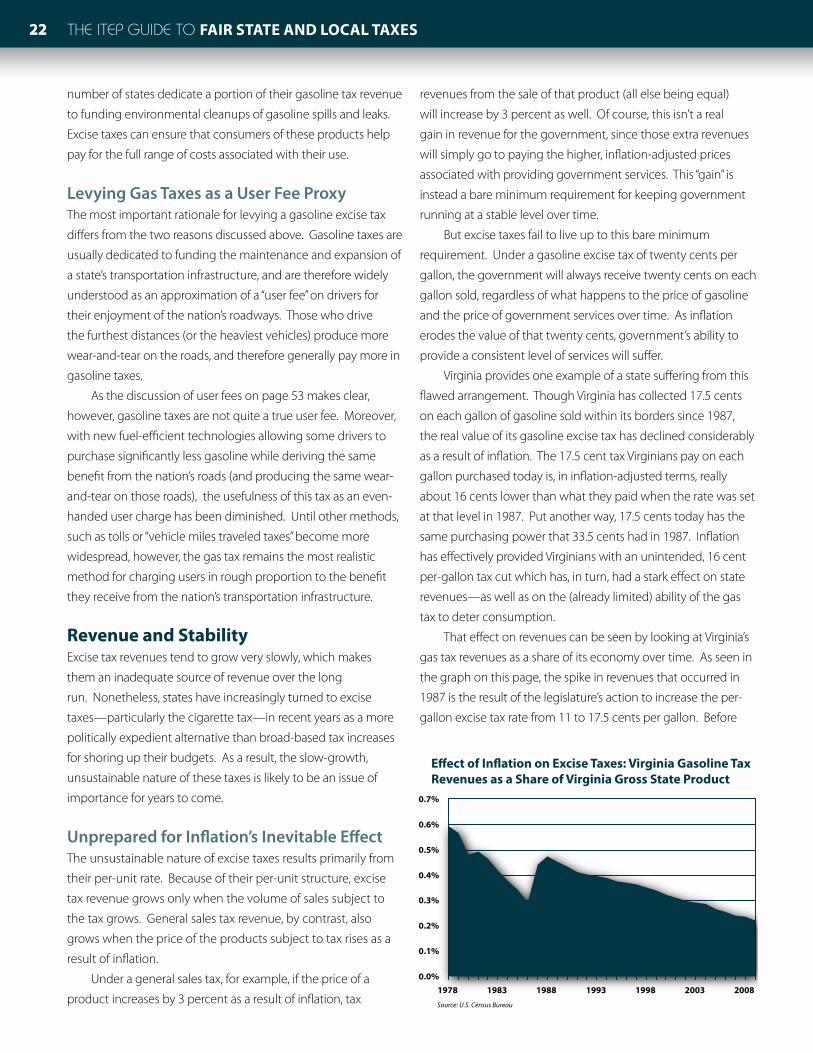
22 The ITeP GuIde To Fair STaTe and local TaxeS22
number of states dedicate a portion of their gasoline tax revenue
to funding environmental cleanups of gasoline spills and leaks.
Excise taxes can ensure that consumers of these products help
pay for the full range of costs associated with their use.
Levying Gas Taxes as a User Fee ProxyThe most important rationale for levying a gasoline excise tax
differs from the two reasons discussed above. Gasoline taxes are
usually dedicated to funding the maintenance and expansion of
a state’s transportation infrastructure, and are therefore widely
understood as an approximation of a “user fee” on drivers for
their enjoyment of the nation’s roadways. Those who drive
the furthest distances (or the heaviest vehicles) produce more
wear-and-tear on the roads, and therefore generally pay more in
gasoline taxes.
As the discussion of user fees on page 53 makes clear,
however, gasoline taxes are not quite a true user fee. Moreover,
with new fuel-efficient technologies allowing some drivers to
purchase significantly less gasoline while deriving the same
benefit from the nation’s roads (and producing the same wear-
and-tear on those roads), the usefulness of this tax as an even-
handed user charge has been diminished. Until other methods,
such as tolls or “vehicle miles traveled taxes” become more
widespread, however, the gas tax remains the most realistic
method for charging users in rough proportion to the benefit
they receive from the nation’s transportation infrastructure.
revenue and StabilityExcise tax revenues tend to grow very slowly, which makes
them an inadequate source of revenue over the long
run. Nonetheless, states have increasingly turned to excise
taxes—particularly the cigarette tax—in recent years as a more
politically expedient alternative than broad-based tax increases
for shoring up their budgets. As a result, the slow-growth,
unsustainable nature of these taxes is likely to be an issue of
importance for years to come.
Unprepared for Inflation’s Inevitable EffectThe unsustainable nature of excise taxes results primarily from
their per-unit rate. Because of their per-unit structure, excise
tax revenue grows only when the volume of sales subject to
the tax grows. General sales tax revenue, by contrast, also
grows when the price of the products subject to tax rises as a
result of inflation.
Under a general sales tax, for example, if the price of a
product increases by 3 percent as a result of inflation, tax
revenues from the sale of that product (all else being equal)
will increase by 3 percent as well. Of course, this isn’t a real
gain in revenue for the government, since those extra revenues
will simply go to paying the higher, inflation-adjusted prices
associated with providing government services. This “gain” is
instead a bare minimum requirement for keeping government
running at a stable level over time.
But excise taxes fail to live up to this bare minimum
requirement. Under a gasoline excise tax of twenty cents per
gallon, the government will always receive twenty cents on each
gallon sold, regardless of what happens to the price of gasoline
and the price of government services over time. As inflation
erodes the value of that twenty cents, government’s ability to
provide a consistent level of services will suffer.
Virginia provides one example of a state suffering from this
flawed arrangement. Though Virginia has collected 17.5 cents
on each gallon of gasoline sold within its borders since 1987,
the real value of its gasoline excise tax has declined considerably
as a result of inflation. The 17.5 cent tax Virginians pay on each
gallon purchased today is, in inflation-adjusted terms, really
about 16 cents lower than what they paid when the rate was set
at that level in 1987. Put another way, 17.5 cents today has the
same purchasing power that 33.5 cents had in 1987. Inflation
has effectively provided Virginians with an unintended, 16 cent
per-gallon tax cut which has, in turn, had a stark effect on state
revenues—as well as on the (already limited) ability of the gas
tax to deter consumption.
That effect on revenues can be seen by looking at Virginia’s
gas tax revenues as a share of its economy over time. As seen in
the graph on this page, the spike in revenues that occurred in
1987 is the result of the legislature’s action to increase the per-
gallon excise tax rate from 11 to 17.5 cents per gallon. Before
E�ect of In�ation on Excise Taxes: Virginia Gasoline TaxRevenues as a Share of Virginia Gross State Product
Source: U.S. Census Bureau
0.0%
0.1%
0.2%
0.3%
0.4%
0.5%
0.6%
0.7%
1978 1983 1988 1993 1998 2003 2008
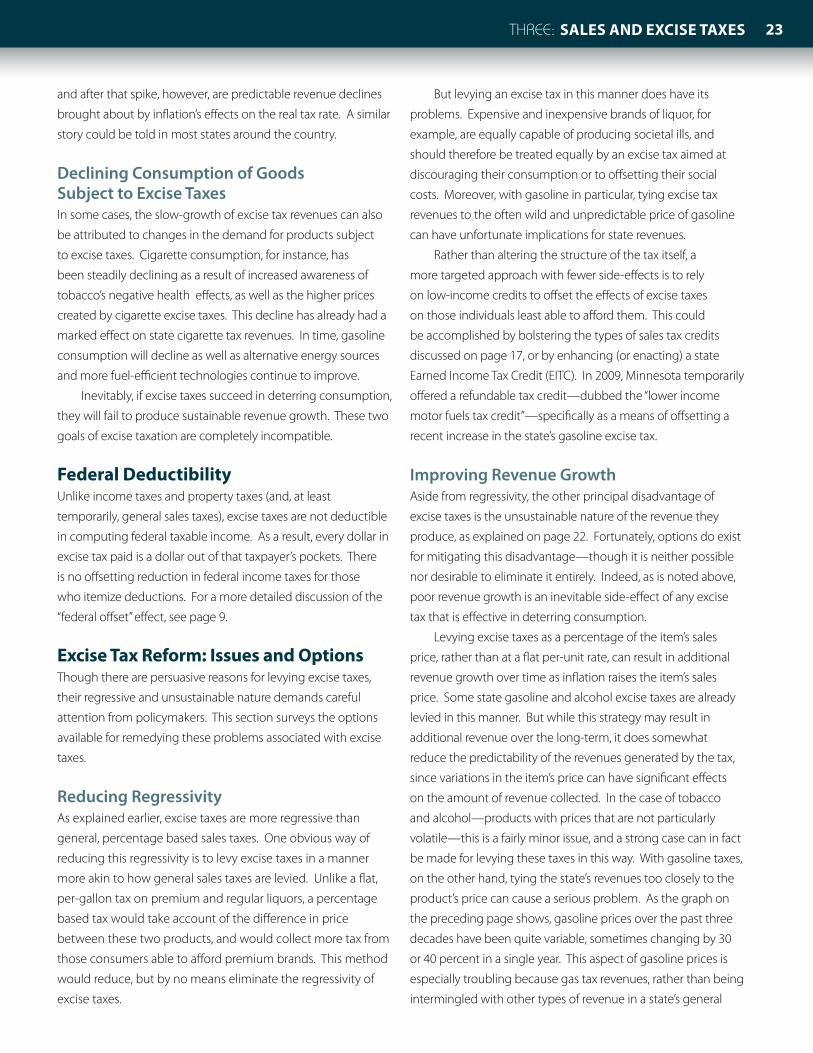
23Three: SaleS and exciSe TaxeS
and after that spike, however, are predictable revenue declines
brought about by inflation’s effects on the real tax rate. A similar
story could be told in most states around the country.
Declining Consumption of Goods Subject to Excise TaxesIn some cases, the slow-growth of excise tax revenues can also
be attributed to changes in the demand for products subject
to excise taxes. Cigarette consumption, for instance, has
been steadily declining as a result of increased awareness of
tobacco’s negative health effects, as well as the higher prices
created by cigarette excise taxes. This decline has already had a
marked effect on state cigarette tax revenues. In time, gasoline
consumption will decline as well as alternative energy sources
and more fuel-efficient technologies continue to improve.
Inevitably, if excise taxes succeed in deterring consumption,
they will fail to produce sustainable revenue growth. These two
goals of excise taxation are completely incompatible.
Federal deductibilityUnlike income taxes and property taxes (and, at least
temporarily, general sales taxes), excise taxes are not deductible
in computing federal taxable income. As a result, every dollar in
excise tax paid is a dollar out of that taxpayer’s pockets. There
is no offsetting reduction in federal income taxes for those
who itemize deductions. For a more detailed discussion of the
“federal offset” effect, see page 9.
excise Tax reform: issues and optionsThough there are persuasive reasons for levying excise taxes,
their regressive and unsustainable nature demands careful
attention from policymakers. This section surveys the options
available for remedying these problems associated with excise
taxes.
Reducing RegressivityAs explained earlier, excise taxes are more regressive than
general, percentage based sales taxes. One obvious way of
reducing this regressivity is to levy excise taxes in a manner
more akin to how general sales taxes are levied. Unlike a flat,
per-gallon tax on premium and regular liquors, a percentage
based tax would take account of the difference in price
between these two products, and would collect more tax from
those consumers able to afford premium brands. This method
would reduce, but by no means eliminate the regressivity of
excise taxes.
But levying an excise tax in this manner does have its
problems. Expensive and inexpensive brands of liquor, for
example, are equally capable of producing societal ills, and
should therefore be treated equally by an excise tax aimed at
discouraging their consumption or to offsetting their social
costs. Moreover, with gasoline in particular, tying excise tax
revenues to the often wild and unpredictable price of gasoline
can have unfortunate implications for state revenues.
Rather than altering the structure of the tax itself, a
more targeted approach with fewer side-effects is to rely
on low-income credits to offset the effects of excise taxes
on those individuals least able to afford them. This could
be accomplished by bolstering the types of sales tax credits
discussed on page 17, or by enhancing (or enacting) a state
Earned Income Tax Credit (EITC). In 2009, Minnesota temporarily
offered a refundable tax credit—dubbed the “lower income
motor fuels tax credit”—specifically as a means of offsetting a
recent increase in the state’s gasoline excise tax.
Improving Revenue GrowthAside from regressivity, the other principal disadvantage of
excise taxes is the unsustainable nature of the revenue they
produce, as explained on page 22. Fortunately, options do exist
for mitigating this disadvantage—though it is neither possible
nor desirable to eliminate it entirely. Indeed, as is noted above,
poor revenue growth is an inevitable side-effect of any excise
tax that is effective in deterring consumption.
Levying excise taxes as a percentage of the item’s sales
price, rather than at a flat per-unit rate, can result in additional
revenue growth over time as inflation raises the item’s sales
price. Some state gasoline and alcohol excise taxes are already
levied in this manner. But while this strategy may result in
additional revenue over the long-term, it does somewhat
reduce the predictability of the revenues generated by the tax,
since variations in the item’s price can have significant effects
on the amount of revenue collected. In the case of tobacco
and alcohol—products with prices that are not particularly
volatile—this is a fairly minor issue, and a strong case can in fact
be made for levying these taxes in this way. With gasoline taxes,
on the other hand, tying the state’s revenues too closely to the
product’s price can cause a serious problem. As the graph on
the preceding page shows, gasoline prices over the past three
decades have been quite variable, sometimes changing by 30
or 40 percent in a single year. This aspect of gasoline prices is
especially troubling because gas tax revenues, rather than being
intermingled with other types of revenue in a state’s general
24 The ITeP GuIde To Fair STaTe and local TaxeS24
fund, are often dedicated to a separate transportation trust fund.
Needless to say, when gas prices plummet, a trust fund reliant
on a percentage-of-price gas tax can be expected to suffer as a
result. Many states that previously levied their gasoline taxes in
a percentage-based manner have since abandoned this method
precisely because of this threat.
So if a percentage-of-price levy is not a good fit for the
gasoline tax, what is? The most obvious answer is to index the
per-unit rate based on the economy’s overall rate of inflation. As
the above graph shows, inflation provides a much more stable
and predictable measure than the price of gasoline itself. Maine
and Florida currently index their gas tax rates to the general
inflation rate, and the idea has been discussed in many other
states.
For states not interested in indexing, there is one other
alternative. Nebraska regularly adjusts its gasoline tax rate based
on a number of factors, including most notably the budget
the legislature has authorized for
the Department of Roads. When
the legislature decides that the
Department needs additional
funding to adequately maintain
Nebraska’s roads, this linkage
provides a straightforward way for
securing the necessary revenue
without having to reduce spending
on education, public safety, or
other priorities. This is arguably
the best option available for avoiding unforseen shortfalls in the
transportation budget, though it can create a reluctance among
lawmakers to spend adequately on transportation since their
spending decisions translate directly into sometimes politically
unpopular gas tax increases.
conclusionDespite all their flaws, sales and excise taxes are an important
component of state and local tax systems. Sales and excise tax
reform should focus both on improving the sustainability of the
revenues generated by these taxes, as well as on reducing the
inevitable regressivity associated with these forms of taxation.
But while much can be done to improve sales and excise taxes
in these respects, policymakers must recognize that neither of
these characteristics is the strong suit of these taxes, and for that
reason, no state tax system should ever come to rely too heavily
upon them.
Annual Percentage Change in the Price of Gasoline, and in the Overall In�ation Rate
-40%
-30%
-20%
-10%
0%
10%
20%
30%
40%
1975 1985 1995 2005 2010
In�ation Gasoline
1990 20001980
1 In many states, a small portion of this tax is actually pocketed by retailers through programs known as “vendor discounts.” These “discounts” are ostensibly designed to compensate retailers for the costs associated with collecting and remitting sales tax payments, though in many states the compensation provided arguably exceeds the actual costs to retailers. For more information see: Good Jobs First, “Skimming the Sales Tax.” November 2008. http://www.goodjobsfirst.org/pdf/skimming.pdf2 This figure represents household consumption expenditures for services as a share of personal consumption expenditures, as found in the Bureau of Economic Analysis’ National Income and Product Account Tables (NIPA), available at: http://www.bea.gov/national/nipaweb/index.asp3 “Leaving Money on the Table: ‘Federal Offset’ Provides Incentive for States to Rely on Progressive Income Taxes.” Institute on Taxation and Economic Policy, April 2010. http://www.itepnet.org/pdf/leavingmoney.pdf4 This is not to be confused with taxing internet access itself, which the Internet Tax Freedom Act (ITFA) prohibits in most states through 2014 based on the dubious claim that exempting internet access encourages more households to purchase high-speed internet service.5 Bruce, Donald, William Fox,and LeAnn Luna, “State and Local Government Sales Tax Revenue Losses from Electronic Commerce.” Center for Business and Economic Research, The University of Tennessee, April 13, 2009. http://cber.utk.edu/ecomm/ecom0409.pdf6 Quill Corp. v. North Dakota (91-0194), 504 U.S. 298 (1992). http://www.law.cornell.edu/supct/html/91-0194.ZO.html (1992)7 For more information see Michael Mazerov, Amazon’s Arguments Against Collecting Sales Taxes Do Not Withstand Scrutiny.” Center on Budget and Policy Priorities, November 2010.http://www.cbpp.org/cms/index.cfm?fa=view&id=29908 This has been shown in numerous studies, including: Carpenter, Christopher and Philip J. Cook, “Cigarette Taxes and Youth Smoking: New Evidence from National, State, and Local Youth Risk Behavior Surveys.” Journal of Health Economics, Vol. 27(2), March 2008.9 Hughes, Johnathan E., Christopher R. Knittel, and Daniel Sperling, “Evidence of a Shift in the Short-Run Price Elasticity of Gasoline Demand.” The Energy Journal, Vol. 29(1), January 2008.10 Lindblom, Eric, “Toll of Tobacco in the United States of America.” Campaign for Tobacco Free Kids, June 2008.
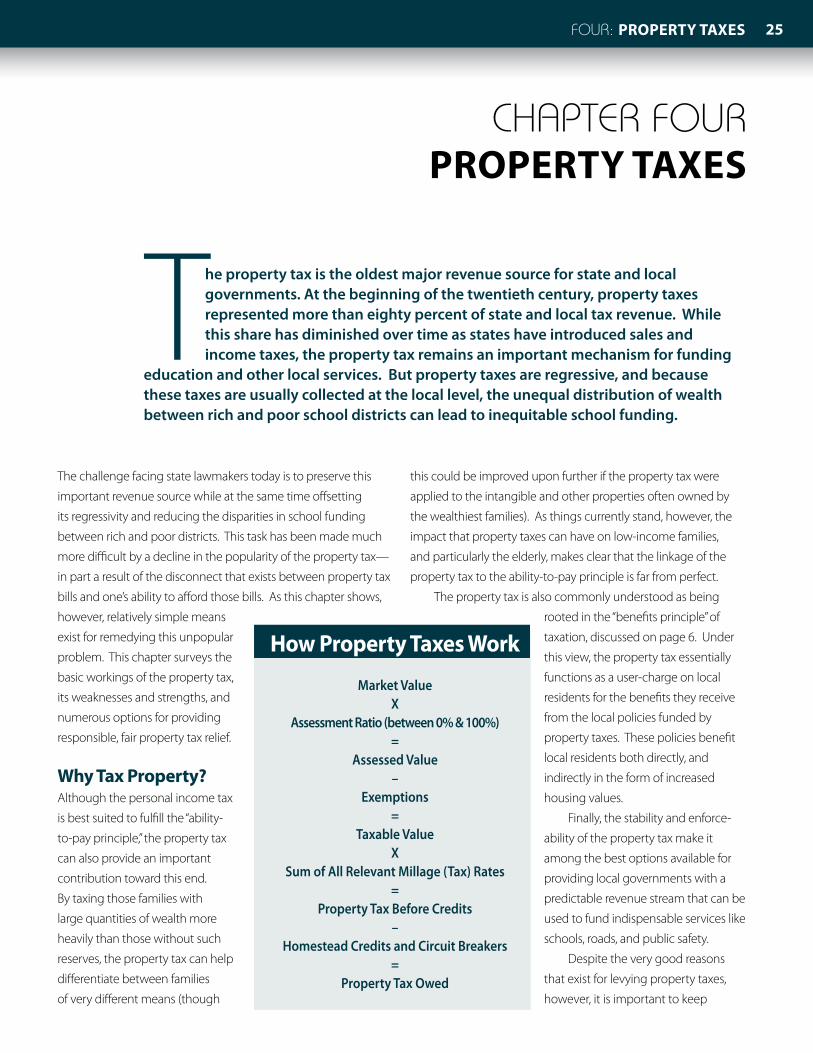
25Four: ProPerty taxes
CHAPTEr FourProPerty taxes
The challenge facing state lawmakers today is to preserve this
important revenue source while at the same time offsetting
its regressivity and reducing the disparities in school funding
between rich and poor districts. This task has been made much
more difficult by a decline in the popularity of the property tax—
in part a result of the disconnect that exists between property tax
bills and one’s ability to afford those bills. As this chapter shows,
however, relatively simple means
exist for remedying this unpopular
problem. This chapter surveys the
basic workings of the property tax,
its weaknesses and strengths, and
numerous options for providing
responsible, fair property tax relief.
Why tax Property?Although the personal income tax
is best suited to fulfill the “ability-
to-pay principle,” the property tax
can also provide an important
contribution toward this end.
By taxing those families with
large quantities of wealth more
heavily than those without such
reserves, the property tax can help
differentiate between families
of very different means (though
this could be improved upon further if the property tax were
applied to the intangible and other properties often owned by
the wealthiest families). As things currently stand, however, the
impact that property taxes can have on low-income families,
and particularly the elderly, makes clear that the linkage of the
property tax to the ability-to-pay principle is far from perfect.
The property tax is also commonly understood as being
rooted in the “benefits principle” of
taxation, discussed on page 6. Under
this view, the property tax essentially
functions as a user-charge on local
residents for the benefits they receive
from the local policies funded by
property taxes. These policies benefit
local residents both directly, and
indirectly in the form of increased
housing values.
Finally, the stability and enforce-
ability of the property tax make it
among the best options available for
providing local governments with a
predictable revenue stream that can be
used to fund indispensable services like
schools, roads, and public safety.
Despite the very good reasons
that exist for levying property taxes,
however, it is important to keep
How Property taxes Work
Market Value X
Assessment Ratio (between 0% & 100%) =
Assessed Value –
Exemptions =
Taxable Value X
Sum of All Relevant Millage (Tax) Rates =
Property Tax Before Credits –
Homestead Credits and Circuit Breakers =
Property Tax Owed
The property tax is the oldest major revenue source for state and local governments. At the beginning of the twentieth century, property taxes represented more than eighty percent of state and local tax revenue. While this share has diminished over time as states have introduced sales and income taxes, the property tax remains an important mechanism for funding
education and other local services. But property taxes are regressive, and because these taxes are usually collected at the local level, the unequal distribution of wealth between rich and poor school districts can lead to inequitable school funding.
26 THE ITEP GuIdE To Fair state and LocaL taxes26
in mind that property taxes are regressive, and that targeted
property tax relief must be provided as a result.
How Property taxes WorkHistorically, property taxes applied to two kinds of property: real property, which includes land and buildings, and personal property, which includes moveable items such as cars, boats
and the value of stocks and bonds. Most states have moved
away from taxing personal property and now impose taxes
primarily on real property. In its simplest form, the real property
tax is calculated by multiplying the value of land and buildings by
the tax rate. Property tax rates are normally expressed in mills.
A mill is one-tenth of one percent. In the most basic system, an
owner of a property worth $100,000 that is subject to a 25 mill
(that is, 2.5 percent) tax rate would pay $2,500 in property taxes.
In reality, however, property taxes are often more
complicated than this. The first step in the property tax process
is determining a property’s value for tax purposes. In most cases,
this means estimating the property’s market value, the amount
the property would likely sell for.
The second step is determining the property’s assessed value, its value for tax purposes. This is done by multiplying
the property’s market value by an assessment ratio, which is
a percentage ranging from zero to one hundred. Many states
base their taxes upon actual market value—in other words, these
states use a 100 percent assessment ratio.
A large number of states, however, assess property at only a
fraction of its actual value. New Mexico assesses homes at 33.3
percent of their market value, and Arkansas uses a 20 percent
assessment ratio. Some states place a cap on increases in a
home’s assessed value in any given year, which in many cases
can lead to vastly different assessment ratios among similarly
valued homes (see page 34 for more on this issue). And even
when the law says properties should be assessed at 100 percent
of their value, local assessors at times systematically under-assess
property, reporting assessed values that are substantially less
than the real market value of the property.
After the assessment ratio has been factored in, many
states reduce a property’s assessed value further by allowing
exemptions. For example, Ohio allows an exemption for the
first $25,000 of home value. Subtracting all exemptions yields the
taxable value of a property.
The next step in the process is applying a property tax rate,
also known as a millage rate, to the property’s taxable value.
The millage rate is usually the sum of several tax rates applied by
several different jurisdictions: for example, one property might be
subject to a municipal tax, a county tax, and a school district tax.
This calculation yields the property tax owed.
Many states allow property tax credits that either
directly reduce the property tax bill, or that reimburse part of
the property tax bill separately when taxpayers apply for them.
Subtracting these credits is the final step in calculating one’s
property tax bill—though taxpayers are often required to pay the
pre-credit property tax amount, only to later have the amount
of the credit refunded to them. These “property tax relief”
mechanisms are described later in this chapter.
Before moving on, it is worth noting one potentially
confusing result created by the complicated process described
above. The tax rate most property owners are familiar with is
known as the “nominal rate”—that is, the actual millage rate
used in calculating your bill. But when comparing property
taxes across districts or across states, analysts generally find the
“effective” property tax rate to be much more useful. This rate
is usually calculated by expressing the property tax as a share
of market value. Expressing property taxes this way gives us a
better sense of the true rate being paid per dollar of property
owned, without the confusions associated with the wide variety
of exemptions, assessment ratios, and credits utilized in each
state. For example, the owner of a $100,000 home subject to
a 25 mill (or 2.5 percent) nominal tax rate will almost always
owe less than 2.5 percent of that home’s value in tax. An 80
percent assessment ratio and $10,000 homestead exemption, for
instance, would drop the home’s effective tax rate to just 1.75%.
Property taxes and FairnessAlthough sales and excise taxes are the most regressive taxes,
they are rarely as maligned as the property tax. The “sticker
shock” effect of the property tax is partly to blame for this: it’s
a large, very noticeable payment that is made once or twice
a year, while sales taxes are spread throughout the year on
hundreds of purchases. Homeowners with mortgages are often
less shocked than other homeowners, since their property tax
payments are usually lumped into their mortgage payments,
but once their homes are paid off these bills become harder to
overlook. For these homeowners, the property tax can seem
more oppressive and more unfair than it actually is, simply
because it’s more visible.
That said, there is no denying that the property tax is
generally regressive. Nationwide, low-income families paid
3.7 percent of their income in property taxes in 2007, while
middle-income families paid 2.9 percent of their income and the
wealthiest taxpayers paid just 1.4 percent.1
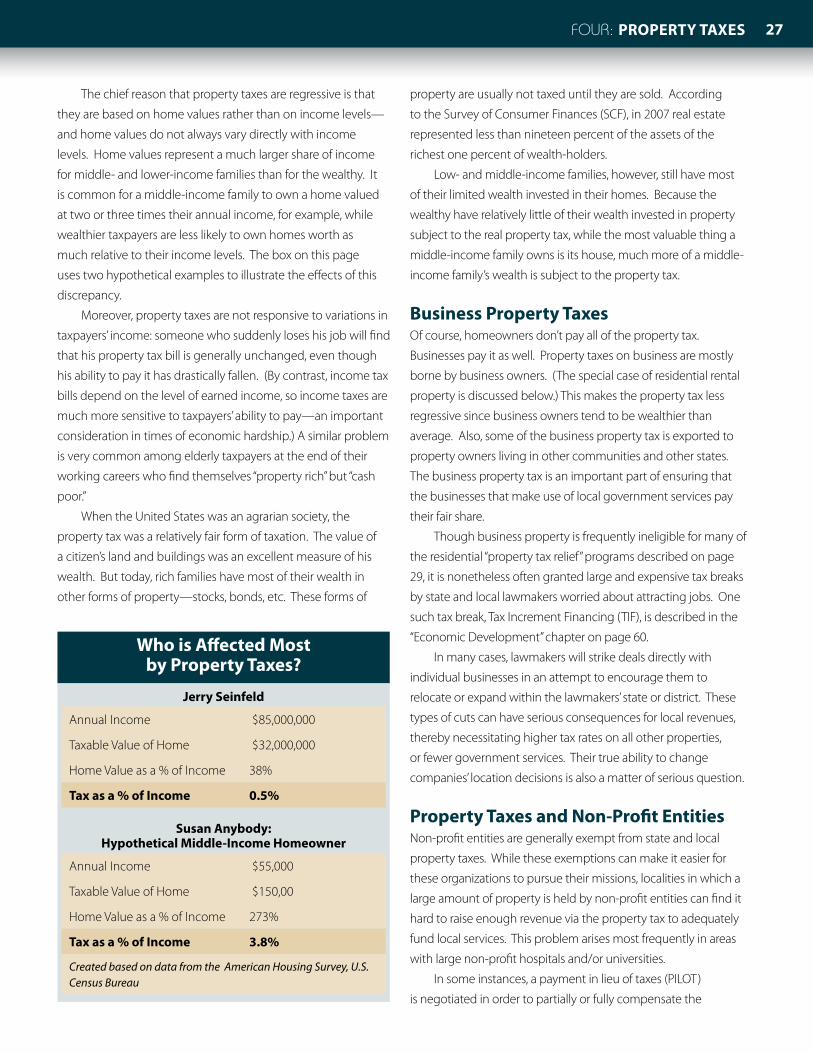
27Four: ProPerty taxes
The chief reason that property taxes are regressive is that
they are based on home values rather than on income levels—
and home values do not always vary directly with income
levels. Home values represent a much larger share of income
for middle- and lower-income families than for the wealthy. It
is common for a middle-income family to own a home valued
at two or three times their annual income, for example, while
wealthier taxpayers are less likely to own homes worth as
much relative to their income levels. The box on this page
uses two hypothetical examples to illustrate the effects of this
discrepancy.
Moreover, property taxes are not responsive to variations in
taxpayers’ income: someone who suddenly loses his job will find
that his property tax bill is generally unchanged, even though
his ability to pay it has drastically fallen. (By contrast, income tax
bills depend on the level of earned income, so income taxes are
much more sensitive to taxpayers’ ability to pay—an important
consideration in times of economic hardship.) A similar problem
is very common among elderly taxpayers at the end of their
working careers who find themselves “property rich” but “cash
poor.”
When the United States was an agrarian society, the
property tax was a relatively fair form of taxation. The value of
a citizen’s land and buildings was an excellent measure of his
wealth. But today, rich families have most of their wealth in
other forms of property—stocks, bonds, etc. These forms of
property are usually not taxed until they are sold. According
to the Survey of Consumer Finances (SCF), in 2007 real estate
represented less than nineteen percent of the assets of the
richest one percent of wealth-holders.
Low- and middle-income families, however, still have most
of their limited wealth invested in their homes. Because the
wealthy have relatively little of their wealth invested in property
subject to the real property tax, while the most valuable thing a
middle-income family owns is its house, much more of a middle-
income family’s wealth is subject to the property tax.
Business Property taxesOf course, homeowners don’t pay all of the property tax.
Businesses pay it as well. Property taxes on business are mostly
borne by business owners. (The special case of residential rental
property is discussed below.) This makes the property tax less
regressive since business owners tend to be wealthier than
average. Also, some of the business property tax is exported to
property owners living in other communities and other states.
The business property tax is an important part of ensuring that
the businesses that make use of local government services pay
their fair share.
Though business property is frequently ineligible for many of
the residential “property tax relief” programs described on page
29, it is nonetheless often granted large and expensive tax breaks
by state and local lawmakers worried about attracting jobs. One
such tax break, Tax Increment Financing (TIF), is described in the
“Economic Development” chapter on page 60.
In many cases, lawmakers will strike deals directly with
individual businesses in an attempt to encourage them to
relocate or expand within the lawmakers’ state or district. These
types of cuts can have serious consequences for local revenues,
thereby necessitating higher tax rates on all other properties,
or fewer government services. Their true ability to change
companies’ location decisions is also a matter of serious question.
Property taxes and non-Profit entitiesNon-profit entities are generally exempt from state and local
property taxes. While these exemptions can make it easier for
these organizations to pursue their missions, localities in which a
large amount of property is held by non-profit entities can find it
hard to raise enough revenue via the property tax to adequately
fund local services. This problem arises most frequently in areas
with large non-profit hospitals and/or universities.
In some instances, a payment in lieu of taxes (PILOT)
is negotiated in order to partially or fully compensate the
Who is affected Most by Property taxes?
Jerry seinfeld
Annual Income $85,000,000
Taxable Value of Home $32,000,000
Home Value as a % of Income 38%
tax as a % of income 0.5%
susan anybody: Hypothetical Middle-income Homeowner
Annual Income $55,000
Taxable Value of Home $150,00
Home Value as a % of Income 273%
tax as a % of income 3.8%
Created based on data from the American Housing Survey, U.S. Census Bureau
28 THE ITEP GuIdE To Fair state and LocaL taxes28
government for the revenue loss associated with a non-profit
organization’s tax exempt status. Because PILOTs are usually
voluntary, however, non-profit organizations often have little
incentive to sit down with government officials to negotiate
such agreements. As a result, PILOTs are typically negotiated only
when the organization in question needs the local government’s
help in some matter (such as amending a zoning law), or if the
organization simply wishes to see the quality of public services in
the area improve.
In order to improve the quality of PILOT negotiations that do
take place, the Institute for Wisconsin’s Future (IWF) recommends
that localities take care to update available data on the value
of tax-exempt properties.2 IWF also recommends that states
develop systematic and enforceable criteria for determining
which entities are truly deserving of tax exempt status.
residential rental PropertyWhile the public’s attention to property taxes is usually focused
on the taxes paid by homeowners, the property tax also affects
taxpayers who rent, rather than own, their home. Who ultimately
pays the property taxes levied on residential rental properties is
disputed. Some economists believe that it is mostly borne by the
landlords who own these rental properties. Others argue that it
is mostly passed through to tenants in the form of higher rents.
It is generally agreed that the answer partially depends on the
rental market. When residential rental property is in short supply,
landlords are more likely to pass their property taxes on to renters
in the form of higher rents. But if rental property is abundant,
landlords may find this more difficult.
Of course, most rental markets are not purely dominated
by either tenants or landlords—so the answer probably is
somewhere in between. And the matter is confused further
because many rental markets cross municipal boundaries so that
taxes vary on rental units in different parts of the market. Absent
significant differences in the local government services renters
care most about, landlords in higher tax jurisdictions can’t simply
raise rents to pay their property taxes if they have to compete
with apartments in nearby, lower tax jurisdictions.
Two things are certain about property taxes on rental
property. First, lawmakers consistently neglect renters in
designing property tax relief, despite the fact that renters are
paying some share of the property taxes levied on rental property.
Second, data from the U.S. Census indicates that renters generally
have incomes about half the size of their homeowner neighbors.
“Property tax relief” paid directly to renters is therefore progressive
in nature. The discussion of “circuit-breakers” on page 30 looks at
how one can go about distributing tax relief to a group that only
indirectly pays property taxes.
Personal Property taxesPersonal property is all property other than real estate. Personal
property taxes usually apply to tangible property such as
individually-owned cars and trucks or business equipment. The
tax can also apply to intangible property such as stocks and
bonds.
Taxing tangible personal property is relatively
straightforward, in theory. In the case of cars and trucks, the tax
is usually a percentage of the “blue book” value of the vehicle.
Since people have to register their vehicles, it’s hard to avoid the
tax. And business equipment can be assessed based on income
tax return data for depreciation deductions.
The most common type of state personal property tax is
on individually-owned cars and trucks. Although at first glance
this tax may appear to be progressive (rich people have more
expensive cars), it is not. Personal property taxes on automobiles
are regressive for the same reason residential property taxes
are regressive: the value of a person’s car (or home), as a share
of their income, is higher for low-income people than for the
wealthy. Personal property taxes on vehicles are, however,
generally preferable to most “vehicle registration fees”, which are
sometimes proposed as substitutes to the car tax. While some
states like to brag that they lack a car tax, these registration fees
can be equally as burdensome to low-income families. Unlike a
flat-amount vehicle registration fee, the property tax paid on a
middle-income individual’s $20,000 Chevrolet is actually less than
what is paid by a wealthier individual on his $50,000 Mercedes
(though as a share of income, the tax on the middle-income
person will still often be higher). Though this isn’t enough to
make the tax progressive, it is preferable to a flat fee. Making
matters worse, these fees cannot be taken as an itemized
deduction when computing one’s federal tax bill, so even upper-
income taxpayers—who are more likely to itemize their returns—
may not benefit as much as one would expect (see page 37 for
On the other hand, business personal property taxes and,
especially, intangible property taxes on stocks and bonds are
progressive because the wealthy own far more business property
and intangible assets than do middle- and low-income people.
It’s also easy to exempt low- and middle-income people from an
intangible property tax by providing generous exemptions.
But as a result of difficulties many states had with enforcing
the intangible property tax, no state levies such a tax at this time.

29Four: ProPerty taxes
In 2007, Florida became the last state to repeal its intangibles
tax. Unfortunately, the movement against the intangibles tax
proved to be short-sighted. The rise of the digital age and other
advances in technology have greatly improved the potential for
states to enforce an intangibles tax. Any state bold enough to
reinstate its intangibles tax has a lot to gain, not only in terms of
improved tax progressivity, but also in the form of a substantial
revenue boost. Before reducing the intangibles tax rate shortly
before its repeal, Florida brought in as much as $1 billion annually
from the tax.
revenue and stabilityProperty taxes are generally more stable over time than the
income or sales tax. This is because property tax revenue
depends on property values, not income. When personal
income grows rapidly, property taxes will generally not grow as
fast (the recent housing bubble being the obvious exception)—
and slower personal income growth is not always reflected in
slow property tax growth. If property values are inflated prior to
a recession, they will tend to fall once a recession starts. If an area
is particularly hard hit by an economic downturn—if a town loses
its leading industry, for example—property values also probably
will fall. On the other hand, where property values were not
inflated and a downturn is not catastrophic, it is not uncommon
for property values to hold relatively steady during a recession.
Most localities also have at least some ability to further
stabilize property tax revenues by adjusting the tax rate to
offset changes in property values. This is an important benefit
of relying on property taxes to finance local governments, as it
allows for a stable level of local police, fire, and education services
even during periods of great volatility in the housing market.
Unfortunately, property tax stability also means that people
who are hardest hit during a recession—people who lose their
jobs—don’t get any relief. Property taxes are insensitive to
variations in taxpayers’ income: a taxpayer who suddenly becomes
unemployed will find that her property tax bill is unchanged,
even though her ability to pay it has fallen. By contrast, income
taxes vary with income, so income taxes are more sensitive to
taxpayers’ ability to pay. Adding an income test to the calculation
of property tax bills, such as the “circuit-breaker” credit described
on page 30, can somewhat alleviate this problem.
Federal deductibility Property taxes, like state and local income taxes, are deductible
in calculating federal taxable income for those who itemize
their returns.3 This means, in effect, that a portion of some
state residents’ property tax bills is “exported” to the federal
government in the form of reduced federal income taxes for
itemizers, and never comes out of those residents’ pockets. For a
more detailed discussion of this “federal offset” effect, see page 9.
Because property taxes are much more regressive than
income taxes, however, a substantial share of property taxes is
paid by low- and middle-income taxpayers who are much less
likely to itemize than their wealthier neighbors. This means that
property taxes offer a lower “bang for the buck” than income
taxes in terms of reducing taxpayers’ federal tax bills.
Interestingly, vehicle property taxes are deductible, but only
when they are calculated as a percentage of the car’s value. Car
taxes that are based on a flat dollar amount cannot be deducted.
This is an important distinction because almost all states levy
flat-dollar car “registration fees” that cannot be deducted. Doing
away with such fees and replacing the lost revenue with a
property tax on car value would result in federal tax cuts for many
car owners.
Property tax relief optionsAs states have moved away from heavy reliance on property
taxes, a variety of different mechanisms have been introduced
for providing residential tax “relief”. These mechanisms vary
significantly in their methods, as well as in their quality. Unfortu-
nately, the trend in many states has been in favor of blunt, poorly
targeted tax relief, rather than towards more carefully targeted
policies that can help those in need without requiring large cuts
in government services. The implementation of poorly targeted
relief programs have in many cases given the greatest benefits
to the wealthy, and have often created grave inequities between
neighbors’ property tax bills as well. In this way, poorly designed
property tax relief programs have frequently violated both the
vertical and horizontal equity principles discussed on page 5.
My Federal Tax Bill Did What?Federal deductibility can be a confusing concept. In 1998, Utah decided to repeal its car tax and replace it with a vehicle registration fee. Soon thereafter, lawmakers were surprised to learn that their constituents would be facing a $12 million federal income tax hike, as well as a $3 million state income tax hike, because vehicle fees cannot be taken as an itemized deduction unless they are related to the price of the vehicle. The editorial pages of some of the state’s largest newspapers sensibly criticized lawmakers for this embarrassing oversight.
30 THE ITEP GuIdE To Fair state and LocaL taxes30
This section surveys each of the major property tax relief
mechanisms available to the states. The first three discussed here
can actually make the tax less regressive in a well-targeted and
fiscally responsible manner. These options include homestead
exemptions, circuit-breakers, and deferral programs.
In contrast, split-roll property taxes, income tax breaks (espe-
cially deductions), and property tax caps have reduced property
tax revenues substantially, while doing little to help those who
need it most. Lawmakers have at times used imagery of resi-
dents being “taxed out of their homes” as reason to enact broad
cuts that are by no means targeted to those vulnerable individu-
als for whom this possibility is most real. State policymakers and
voters should not be swayed by this empty rhetoric.
Homestead Exemptions
More than forty states now allow some form of a homestead exemption, which reduces property taxes for
homeowners by sheltering a certain amount of a home’s value
from tax. Homestead exemptions are a progressive approach
to property tax relief, providing the largest tax cuts as a share
of income to lower- and middle-income taxpayers. These
exemptions are usually funded by local governments, so their
cost is often made up through higher property tax rates than
would otherwise be the case.
There are two broad types of homestead exemptions: flat
dollar and percentage exemptions. The more common type,
flat dollar exemptions, are calculated by exempting a specified
dollar amount from the value of a home before a property tax
rate is applied. A flat dollar exemption is especially beneficial to
low-income homeowners because it represents a larger share
of property taxes (and of income) for low-income taxpayers.
Percentage exemptions give the same percentage tax cut to all
income levels. This form of exemption is much less effective at
targeting relief to those in need than are flat exemptions.
If neglected by lawmakers, flat dollar exemptions can
become less valuable to homeowners over time if home values
rise while the homestead exemption amount remains constant.
A flat dollar homestead exemption that is not regularly updated
will gradually become less able to protect a portion of a home’s
value from taxation, and property taxes will effectively increase
as a result. Indexing the exemption (that is, automatically
increasing it with inflation every year), is a simple way to avoid
this unintentional tax hike.
While homestead exemptions are a progressive approach to
property tax relief, even indexed exemptions have two important
flaws: first, they provide no tax relief to renters, even though
renters are generally agreed to pay some property tax indirectly
in the form of higher rents. Second, exemptions are poorly
targeted and costly. Because most homestead exemptions
are not targeted to low- and middle-income taxpayers, but are
available to even the wealthiest homeowners, they are especially
costly—and provide little “bang for the buck” to low-income
taxpayers.
Expanding homestead exemptions to include rental
properties would in most cases be prohibitively costly to local
governments. And for lawmakers interested in providing
targeted property tax relief to those in need, there are
much more effective tools than a means-tested homestead
exemption. For these reasons, a modest, broad-based, flat dollar
homestead exemption that is available to homeowners of all
ages and income levels can provide a good base of property
tax relief upon which to build with a circuit breaker program,
discussed next.
Circuit BreakersThe property tax circuit breaker is a less expensive, more
targeted approach to tax relief. Its name reflects its design:
circuit breakers protect low-income residents from a property tax
“overload”, just like an electric circuit breaker. When a property
tax bill exceeds a certain percentage of a taxpayer’s income, the
circuit breaker offsets property taxes in excess of this “overload”
level. Circuit breakers are usually funded by state, rather than
local governments, so their existence rarely puts any upward
pressure on local property tax rates.
Circuit breakers usually give homeowners (and oftentimes
renters as well) a credit equal to the amount by which their prop-
erty tax bill exceeds a certain percentage of their income, though
sometimes only a fixed percentage of that amount is given, and
there is usually a cap limiting the total amount of credit allowed.
Circuit breakers are usually made available only to low-income
taxpayers, on the premise that this group is most in need of “relief.”
Limiting circuit breaker eligibility based on income is far prefer-
able to limiting it based on age—as many states do in restricting
their programs to elderly taxpayers—because low-income tax-
payers of very different ages can be equally in need of relief.
Because it is generally agreed that renters pay property tax
indirectly in the form of higher rents, many states now extend
their circuit breaker credit to renters as well. The calculation is
the same as for a homeowner, except that some percentage of
the rent you pay is assumed to be the property tax paid. Renters
in Michigan, for instance, use 20 percent of their rent as their
assumed property tax in calculating their circuit breaker credit.
31Four: ProPerty taxes
The ability to target circuit breakers to those taxpayers most
in need means that virtually none of the property tax relief from a
circuit breaker credit will be offset by federal income tax hikes for
itemizers. By contrast, when a homestead exemption reduces the
property tax paid by a wealthy homeowner, that homeowner will
have less property tax to claim as an itemized deduction on his
federal tax return—which means that his federal taxes will go up.
Like the homestead exemption, circuit breakers must be
indexed for inflation in order to preserve the value of this tax
break for low-income taxpayers. For example, if the Illinois circuit
breaker’s maximum income level for eligibility and the maximum
credit amount had been indexed for inflation since it was first
introduced in 1972, the income threshold would have been
$52,000 in tax year 2010—more than double the current value
for unmarried taxpayers—and the maximum value of the credit
would have been about five times its current value.
The main drawback of circuit breakers is that, in general, they
only are given to taxpayers who apply for them. (By contrast,
homestead exemptions are usually given automatically to eligible
taxpayers.) Eligible taxpayers will only apply for tax credits if
they are aware of their existence. This means that an essential
component of a circuit breaker program must be an educational
outreach effort designed to inform state taxpayers of the credit.
In addition, one way of making it easier for eligible taxpayers to
claim the circuit breaker is to make it possible to claim the credit
either on income tax forms or on a separate circuit breaker form
(for those who do not have to file income tax forms).
Deferral ProgramsA number of states allow some homeowners to delay paying
their property tax bills by making use of deferral programs. The vast majority of these programs are restricted to taxpayers
above a certain age. Deferrals can apply to all or part of a
homeowners’ tax bill in a given year, and the maximum amount
that can be deferred over time is often limited to a specific
percentage of the property’s value. Some deferral programs
resemble circuit breakers in that the taxpayer can only defer
the portion of their tax bill exceeding a certain percentage of
their income. Interest is generally owed on the amount of tax
deferred, and payment of the deferred taxes is often made when
the home is sold.
Because the state and/or locality eventually receives
the amount of property taxes deferred, deferrals cost the
government less than any other form of property tax relief. The
cost of deferrals is further limited by the fact that they are often
not widely used. At least two factors contribute to the relative
unpopularity of deferrals among taxpayers. First, many taxpayers
are likely unaware of deferral programs, in part because states
often do a poor job advertising their existence. Second, because
deferred taxes must be paid back with interest, only those
taxpayers in genuine need are likely to take advantage of these
programs. In this way, deferrals are an extremely targeted form of
property tax relief.
Split RollA fourth way to provide property tax relief is a split roll, also
known as a “classified property tax.” Unlike a regular property tax,
which taxes the value of all real property at the same rate, a split
roll property tax applies different effective tax rates to different
types of property. One approach to a split roll property tax is
taken by the District of Columbia, which taxes homes at a lower
rate than business properties. This shifts some of the property tax
load from homeowners to businesses.
A second approach is to assess homeowners at a lower
percentage of their value than other types of property. For
example, Utah assesses all residential properties at 55 percent
of their value, and assesses all other types of property at 100
percent of their value. A single tax rate is then applied to all
properties of all types within each taxing district. This approach
has exactly the same impact on tax fairness as the District of
Columbia approach of using different tax rates.
While split roll taxation is sometimes favored by those
seeking to ensure that businesses pay their fair share, it has three
main shortcomings that severely limit its usefulness. First, it’s
poorly targeted. Every homeowner pays a lower tax rate because
of the split roll, from the very poorest to the very wealthiest. And
the lower rate is available to anyone who owns a property—even
those whose principal residence is in another state. Because of
these flaws, a split roll system is less targeted than either a circuit
breaker or a flat dollar homestead exemption. This latter point
is illustrated in the chart below, which demonstrates how more
expensive homes can benefit disproportionately from a split
Property Tax “Relief” for RentersDistributing property tax relief to renters is critical on fairness grounds. It is widely assumed that some portion of property taxes are usually passed on to renters in the form of higher rents, and depriving this group of relief from those taxes is unfair not only on horizontal equity grounds, but on vertical equity grounds as well (since renters as a class are generally poorer than homeowners).
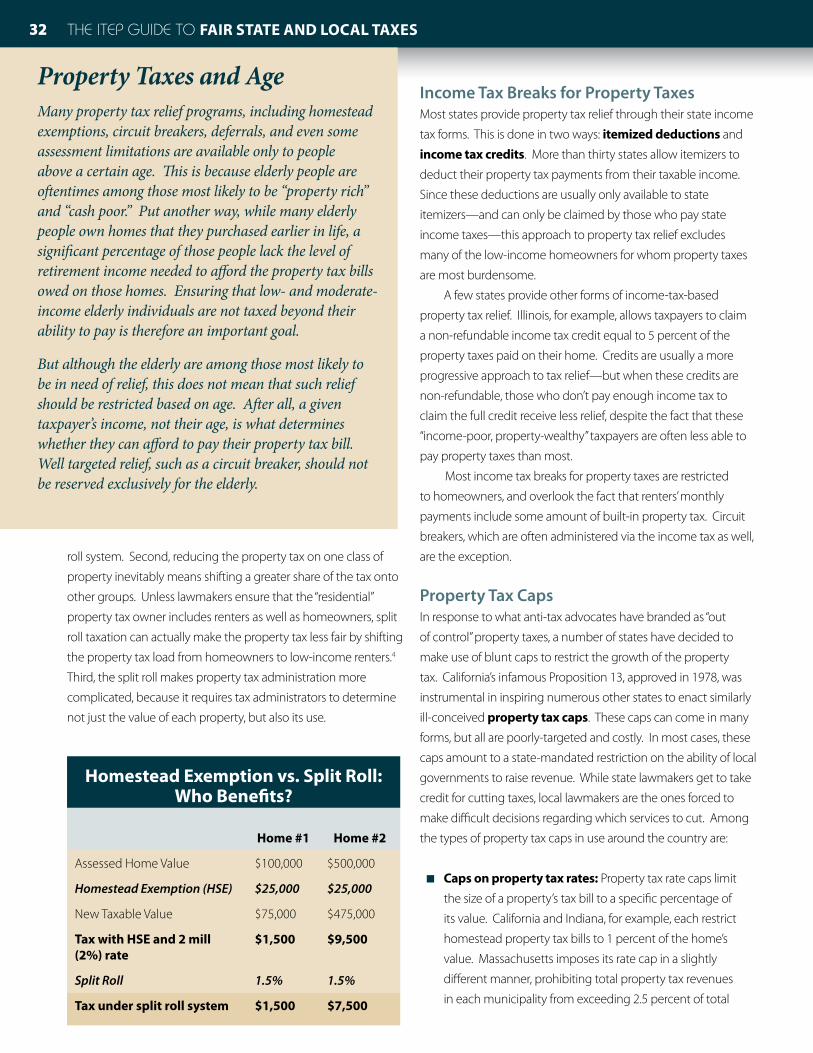
32 THE ITEP GuIdE To Fair state and LocaL taxes32
roll system. Second, reducing the property tax on one class of
property inevitably means shifting a greater share of the tax onto
other groups. Unless lawmakers ensure that the “residential”
property tax owner includes renters as well as homeowners, split
roll taxation can actually make the property tax less fair by shifting
the property tax load from homeowners to low-income renters.4
Third, the split roll makes property tax administration more
complicated, because it requires tax administrators to determine
not just the value of each property, but also its use.
Income Tax Breaks for Property TaxesMost states provide property tax relief through their state income
tax forms. This is done in two ways: itemized deductions and
income tax credits. More than thirty states allow itemizers to
deduct their property tax payments from their taxable income.
Since these deductions are usually only available to state
itemizers—and can only be claimed by those who pay state
income taxes—this approach to property tax relief excludes
many of the low-income homeowners for whom property taxes
are most burdensome.
A few states provide other forms of income-tax-based
property tax relief. Illinois, for example, allows taxpayers to claim
a non-refundable income tax credit equal to 5 percent of the
property taxes paid on their home. Credits are usually a more
progressive approach to tax relief—but when these credits are
non-refundable, those who don’t pay enough income tax to
claim the full credit receive less relief, despite the fact that these
“income-poor, property-wealthy” taxpayers are often less able to
pay property taxes than most.
Most income tax breaks for property taxes are restricted
to homeowners, and overlook the fact that renters’ monthly
payments include some amount of built-in property tax. Circuit
breakers, which are often administered via the income tax as well,
are the exception.
Property Tax CapsIn response to what anti-tax advocates have branded as “out
of control” property taxes, a number of states have decided to
make use of blunt caps to restrict the growth of the property
tax. California’s infamous Proposition 13, approved in 1978, was
instrumental in inspiring numerous other states to enact similarly
ill-conceived property tax caps. These caps can come in many
forms, but all are poorly-targeted and costly. In most cases, these
caps amount to a state-mandated restriction on the ability of local
governments to raise revenue. While state lawmakers get to take
credit for cutting taxes, local lawmakers are the ones forced to
make difficult decisions regarding which services to cut. Among
the types of property tax caps in use around the country are:
■ caps on property tax rates: Property tax rate caps limit
the size of a property’s tax bill to a specific percentage of
its value. California and Indiana, for example, each restrict
homestead property tax bills to 1 percent of the home’s
value. Massachusetts imposes its rate cap in a slightly
different manner, prohibiting total property tax revenues
in each municipality from exceeding 2.5 percent of total
Property Taxes and AgeMany property tax relief programs, including homestead exemptions, circuit breakers, deferrals, and even some assessment limitations are available only to people above a certain age. This is because elderly people are oftentimes among those most likely to be “property rich” and “cash poor.” Put another way, while many elderly people own homes that they purchased earlier in life, a significant percentage of those people lack the level of retirement income needed to afford the property tax bills owed on those homes. Ensuring that low- and moderate-income elderly individuals are not taxed beyond their ability to pay is therefore an important goal.
But although the elderly are among those most likely to be in need of relief, this does not mean that such relief should be restricted based on age. After all, a given taxpayer’s income, not their age, is what determines whether they can afford to pay their property tax bill. Well targeted relief, such as a circuit breaker, should not be reserved exclusively for the elderly.
Homestead exemption vs. split roll: Who Benefits?
Home #1 Home #2
Assessed Home Value $100,000 $500,000
Homestead Exemption (HSE) $25,000 $25,000
New Taxable Value $75,000 $475,000
tax with Hse and 2 mill (2%) rate
$1,500 $9,500
Split Roll 1.5% 1.5%
tax under split roll system $1,500 $7,500
33Four: ProPerty taxes
assessed property value. Rate caps reduce both the revenue
generating potential of the property tax, and the ability of
local lawmakers to stabilize property tax collections through
periodic adjustments in the tax rate. Both of these flaws
cause rate caps to erode local governments’ ability to provide
a consistent and adequate level of services.
■ caps on increases in a property’s assessed value: This type of cap prevents the taxable assessed value of
a homeowner’s residence from rising faster than a pre-
determined rate. In California, Proposition 13 limits increases
in a homeowners’ assessed value to 2 percent per year, or
the overall rate of inflation, whichever is lower. In Florida,
the “Save Our Homes” amendment limits assessed value
increases to the lower of 3 percent or inflation. In addition
to being poorly targeted and costly, these caps also result
in bizarre and unfair differences in the tax bills paid by
neighbors with similarly valued homes. Since a home’s
taxable assessed value is reset upon changing ownership
to reflect its actual value, residents who have recently
moved into a home are required to pay significantly more
in property taxes than their long-term neighbors who have
seen increases in their home’s taxable value capped for many
years. This same phenomenon has also resulted in some
homeowners feeling trapped in their current homes, due
to the fact that they would have to pay much higher taxes
if they were to change residences. Florida recently sought
to address this issue by allowing homeowners to essentially
carry over their tax cap savings to a new residence upon
moving. While some long-term homeowners have been
helped by this change, it has also been an enormously costly
change that has made Florida’s property system much more
complicated, and has done nothing to help first-time home-
buyers.
■ caps on increases in overall revenue collected: The
most restrictive type of property tax caps prevent localities
from increasing overall property tax collections beyond
a certain annual amount. In Massachusetts, for example,
municipalities are prohibited (absent specific approval from
voters) from collecting more than 2.5 percent in additional
property tax revenue beyond what they collected in the
previous year. As is oftentimes the case with caps, there are
some exceptions. Towns, for example, are allowed to tax new
growth within their borders, which does provide a significant
amount of revenue. Nonetheless, since the cost of providing
a stable level of local government services has traditionally
risen at more than 2.5 percent per year, this cap has
noticeably diminished the quality of public services in many
localities. New Jersey recently chose to follow Massachusetts’
lead with a similar 2 percent cap on revenue increases.
Property tax reform: issues and optionsProperty taxes are the most venerable revenue source for state
and local governments—but there is some concern that these
taxes are unsuitable for the needs of the modern state. This
section looks at two such areas of concern: the impact of regional
inequities in property wealth on the quality of public education in
poor districts, and the quality of property tax assessment.
Property Taxes and Education FinancingThe primary purpose of local property taxes is to fund schools.
But property wealth is usually distributed unequally between
taxing districts. As a result, property-poor districts are not able
to fund education as easily as property-wealthy districts. For
example, in 2000 the Lake View school district in Arkansas raised
only $827 per student in local revenue—just over a quarter
of the $3,200 per student raised by the much wealthier Little
Rock school district in that year. Left to their own devices, low-
wealth districts typically have to tax homeowners at a much
higher rate—and still don’t raise as much revenue per-pupil as
a wealthier district can. This sort of inequity between poor and
wealthy districts has been the basis for a series of court cases
challenging the constitutionality of school funding systems in
various states.
Even property-wealthy districts can find it difficult to raise
enough money to fund schools adequately using property taxes.
As a result, almost every state has enacted a program of state aid
to local school districts, designed to provide a guaranteed mini-
mum amount of education spending per pupil while minimizing
the gaps in spending between poor and wealthy districts.
What can go wrong with a school funding system that
works in this way? First, the baseline amount of spending per
pupil may be well short of the amount required to achieve an
adequate education—that is, states can achieve equity without
achieving adequacy. Second, property-wealthy districts can
usually raise more than this state-sponsored amount per pupil
without relying on state help—which means that the amount
spent on education will differ between poor and wealthy districts,
even after taking account of state aid. Some argue that as long
as these differences between poor and wealthy districts remain,
equity will not have been achieved.
One tax reform option for the growing number of states that
are now confronting court mandates to fund schools adequately
34 THE ITEP GuIdE To Fair state and LocaL taxes34
and equitably is to preserve the role of property taxes in funding
schools by replacing some of their current local property taxes
with a statewide property tax levied at a uniform rate. The
statewide property tax requires the same level of effort from all
taxing districts in a state, and reallocates some of the resulting tax
revenue between wealthy and poor districts in a way that, if done
properly, can equalize the revenue-raising ability of all districts.
Assessment PracticesThe most important step in the property tax process is
assessing the value of a property. After all, under the property
tax, home value is the basis for measuring a homeowner’s
ability to pay—so the property tax will only be as fair as the
assessment process. Unfortunately, many jurisdictions don’t
assess property fairly. Some states don’t require regular
reassessment of property. In other states, there can be
significant variation in assessed values between properties that
are actually very similar. When assessment practices are poor,
two families with identical homes and the same income level
could face different property tax bills. This undermines people’s
faith in the fairness of the tax system and erodes public support
for the taxes needed to pay for government services.
Local assessors routinely assess properties at less than what
the law prescribes. For example, a typical state might require
that residential properties be assessed at 100 percent of their
market value, but assessors might actually assess these properties
at an average of 90 percent of their market value. From a tax
collector’s point of view, this approach has two virtues. First, it
gives taxpayers the illusion that government is giving them a
good deal by taxing only part of their home values. This is an
illusion because the underassessment, by necessity, is offset by
a higher property tax rate. Second, underassessment reduces
the likelihood of legal challenges to assessments. Unless
homeowners compare their assessments with those of other
homeowners, even large and unfair discrepancies will not be
detected.
When property is under-assessed not because of poor-
quality assessments but because of legal rules requiring low
assessment ratios, fairness can be undermined as well. If
assessments are at full value, inaccurate assessments stand out.
But if property is legally assessed at (for example) 20 percent
of its true value, it becomes much harder to detect variations
in assessment quality because the assessed value is hard to
compare to a homeowner’s sense of the home’s true value. Thus,
underassessment makes unfair or corrupt assessment practices
more difficult to detect.
Poor or infrequent assessment can also make it difficult for
lawmakers to equalize differences between poor and wealthy
districts’ ability to fund schools. Most state school-aid programs
are based on the property wealth of each district—and poor-
quality assessments make it hard to know which districts are truly
poor and which are simply under-reporting their assessed value.
For this reason, reform of local property assessment practices
must usually be done before school finance reform can be
accomplished at the state level.
Finally, infrequent assessments make it difficult for taxpayers
to plan for their financial future, since large changes in a home’s
property tax bill can occur when a property is finally reassessed
after many years. This can also lead to “sticker shock”—which
erodes support for the property tax—as well as to an increase in
time-consuming legal challenges to assessments, regardless of
whether or not those challenges are justified.
Important steps lawmakers can take to ensure accuracy and
transparency in the property assessment process include hiring
and training professional assessors, making assessed valuation
information publicly available, assessing property at its full market
value so taxpayers can understand how they are being taxed, and
frequently reassessing all properties.5
conclusionProperty taxes are generally regressive, and relying on local
property taxes to fund education can create unfair disparities
between poor and wealthy districts. But despite these
shortcomings, the property tax is truly indispensable in financing
essential local services. Progressive tax reform can help make the
tax a more sustainable—and less unfair—revenue source for the
twenty-first century.
1 “Who Pays? A Distributional Analysis of the Tax Systems in All 50 States.” Institute on Taxation and Economic Policy, November 2009. http://www.itepnet.org/whopays3.pdf2 “Hospitable Taxes: How Non-profit Hospitals Profit from Wisconsin’s Outdated Tax System.” Institute for Wisconsin’s Future, May 2008. http://www.wisconsinsfuture.org/publications_pdfs/tax/hospital_taxes_5_08.pdf3 Sales taxes have also been deductible since 2004, though this deduction is only temporary through tax year 2011. See page 9 for more on the deductibility of sales taxes.4 This was originally true of the D.C. split roll system. Until fairly recently, homeowners paid a tax rate of 0.96 percent and rental properties paid 1.54 percent. But tax changes enacted in 1999 reduced the property tax rate on residential rental real estate to equal the homeowner rate.5 States and localities that lack the resources to frequently reassess all properties can, as a second-best solution, also consider adjusting assessments on an annual basis to reflect changes in the assessed values of a sampling of nearby properties.

35Five: Personal Income Taxes
But in many states, the income tax fails to live up to its potential.
Some states have flat-rate taxes, which apply the same tax rate
to the wealthiest CEO as it does to middle-class workers. Other
states tax the income of families living in poverty. Many states
allow expensive tax breaks that favor wealthier taxpayers. And,
of course, some states don’t currently levy an income tax at all.
This chapter explains the basic workings of the income tax and
discusses important issues that should be addressed in order to
ensure the continued fairness and sustainability of this tax.
How Personal Income Taxes WorkIn most states, the income tax base—that is, the types of
income that are subject to the tax—looks a lot like the federal
income tax base. There’s a straightforward reason for this:
because the income tax is the one major tax levied both by
the states and by the federal government, it provides a unique
opportunity for states to reduce the cost of tax compliance,
both for taxpayers and tax administrators, by “piggybacking” on
the income definitions used in federal law.
In practice, this means that income taxpayers can calculate
their federal taxes first, and then simply copy their total income
from the federal tax forms to their state form. Most states link to
federal adjusted gross income (AGI), which is income before
exemptions and deductions, and then allow their own special
exemptions and deductions. A few states link instead to federal
taxable income, which means that these states adopt the
generous federal exemptions and deductions, and then apply
their own tax rates. A few states do not link to the federal tax
base at all.
Which Income is Taxed—and Which Is Exempt?The federal income tax and most state income taxes apply to
most, but not all, types of money income.1 But different types of
income are, in some systems, taxed differently:
■ The wages and salaries that form the bulk of income for
most middle-income families are almost always fully taxed.
However, all states follow the federal practice of excluding
the “fringe benefits” that are a growing share of workers’
pay packages. For example, the value of employer-paid
health insurance is usually tax-exempt. This is problematic
because two workers with the same total pay can have
different income tax bills depending on whether their pay
all takes the form of salary (in which case it will all be taxed)
or it includes substantial fringe benefits (in which case
much of it will not be taxed).
■ Interest from bank accounts and bonds is generally taxed.
A few states, however, exempt some interest from tax,
usually for senior citizens only. Interest from government
bonds usually gets preferential treatment: interest from
federal treasury bonds is exempt from state taxation, and
interest from state and municipal bonds is exempt from
the federal tax. States usually exempt interest on their own
bonds, while taxing other states’ bonds.
The personal income tax can be—and usually is—the fairest of the main revenue sources relied on by state and local governments. When properly structured, it ensures that wealthier taxpayers pay their fair share, provides lower tax rates on middle-income families, completely exempts the poor and allows “refundable” low-income tax credits that can be used to offset the sales, excise and property
taxes that fall most heavily on low-income families. In this way, the income tax can provide an important counterbalance to these other regressive taxes.
CHAPTeR FivePersonal
Income Taxes

THe iTeP Guide To FaIr sTaTe and local Taxes36
■ Some business income is reported on individual tax
forms. In particular, businesses that are unincorporated
include their taxable profit (or loss) in personal income.
(Incorporated businesses are taxed under the corporate
income tax.) For example, if a self-employed craftsperson,
known as a “sole proprietor,” makes and sells furniture,
she reports her gross proceeds from selling the furniture
minus any deductible expenses such as the cost of wood,
tools and advertising. (Farm profits are reported in the
same way.) If a craftsperson worked jointly with another
craftsperson in a multi-member unincorporated business
called a “partnership”, each member would report her share
of taxable partnership profit. In each case, when these
businesses report losses rather than profits, most or all of
the loss is allowed to offset other positive income sources
on income tax forms.
■ rental income from real estate is also part of the personal
income tax base. As with other business income, gross
rents are allowed to be reduced by various expenses. One
“expense” that is commonly used to reduce taxable rental
income is “depreciation.” For tax purposes, rental real estate
is assumed to gradually lose its value, or depreciate, over
time. (Of course, this is usually a fiction—rental real estate
typically becomes more valuable over time.) For some
real estate professionals (broadly defined), depreciation
expenses can be used to reduce not just rental income, but
other income as well. But for most people, depreciation
can only reduce taxable rental income.
■ capital gains are profits from the sale of assets such as
stocks, bonds and real estate. Income tax on a capital gain
is paid only when the asset is sold. Thus, a stockholder
who owns a stock over many years doesn’t pay any tax as it
increases in value each year. He or she pays tax only when
the stock is sold. At that time, the capital gain is calculated
by taking the difference between the original buying price
and the selling price. Special rules apply to homes that
were a family’s primary residence for at least two of the last
five years, for which the first $250,000 of home value gains
are exempt from tax ($500,000 for a married couple). In
addition, a valuable capital gains tax break called “stepped-
up basis” means that people who inherit property don’t
have to pay any tax on capital gains that accrued during
the original owner’s life.2 The federal government now taxes
capital gains at a far lower rate than wages. A few states
also provide capital-gains tax breaks. State capital-gains tax
breaks are discussed on page 41.
■ Dividends are the part of a corporation’s earnings that are
distributed to its shareholders. Most dividend income
flows to upper-income families: in 2009, the poorest
60 percent of Americans enjoyed about 10 percent of all
dividend income, and the best-off 1 percent received more
than a third of all dividend income. Notwithstanding this,
about half a dozen states misguidedly allow taxpayers
(usually senior citizens) to exclude some of their dividend
income from tax.
■ Transfer payments from governments to individuals are
subject to a variety of different rules. Payments from the
Temporary Assistance to Needy Families (TANF) program
are fully exempt; unemployment compensation is generally
fully taxed, and the federal income tax taxes a fraction of
Social Security benefits above certain income levels. States
always follow the federal lead on TANF benefits, but most
states have chosen to not follow the federal rule on Social
Security benefits and instead completely exempt these
benefits.
■ Pension income is generally taxable at the federal level,
with an offset for already-taxed employee contributions to
pension plans. But many states depart from the federal rule
by excluding all or some pension income from taxation. All
too often, these tax breaks are given even to the best-off
taxpayers, but some states provide targeted pension tax
relief that is available only to lower-income taxpayers.
“Adjustments” and Adjusted Gross IncomeOnce all of a taxpayer’s potentially-taxable income is added
up, adjustments to income are applied. Many adjustments
originate on federal tax forms—and most states following
federal rules will include these adjustments, too. For example,
health insurance payments by self-employed people and
alimony are subtracted from total income as an adjustment
on federal forms, and most states have chosen to conform to
federal rules by allowing the same tax breaks. On federal forms,
adjusted gross income is the income that is subject to tax after
subtracting adjustments.
Of course, states always have the option of “decoupling”
from these federal adjustments, and sometimes do so. For
example, when Congress enacted a temporary subtraction for
the first $2,400 in unemployment benefits in 2009, lawmakers in
Oklahoma and several other states decided not to conform to
this tax break—so Oklahoma tax forms for 2009 require anyone
who benefitted from this federal tax break to add it back to
Oklahoma income.
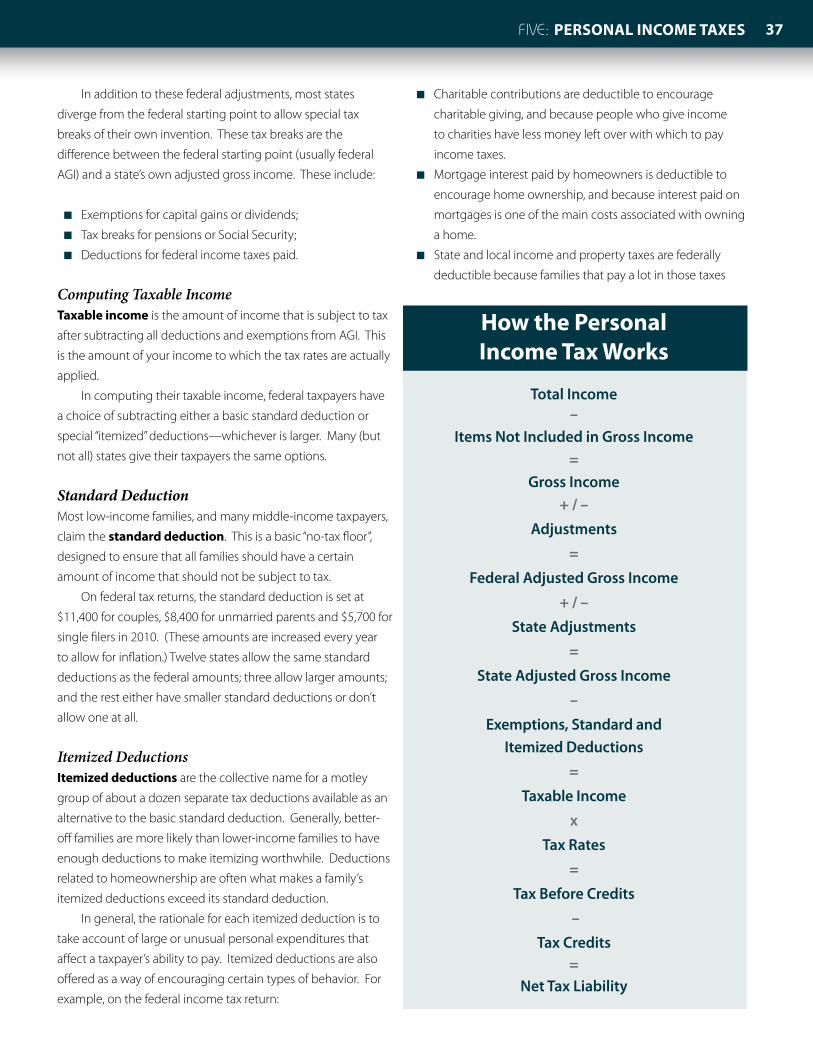
37Five: Personal Income Taxes
In addition to these federal adjustments, most states
diverge from the federal starting point to allow special tax
breaks of their own invention. These tax breaks are the
difference between the federal starting point (usually federal
AGI) and a state’s own adjusted gross income. These include:
■ Exemptions for capital gains or dividends;
■ Tax breaks for pensions or Social Security;
■ Deductions for federal income taxes paid.
Computing Taxable IncomeTaxable income is the amount of income that is subject to tax
after subtracting all deductions and exemptions from AGI. This
is the amount of your income to which the tax rates are actually
applied.
In computing their taxable income, federal taxpayers have
a choice of subtracting either a basic standard deduction or
special “itemized” deductions—whichever is larger. Many (but
not all) states give their taxpayers the same options.
Standard DeductionMost low-income families, and many middle-income taxpayers,
claim the standard deduction. This is a basic “no-tax floor”,
designed to ensure that all families should have a certain
amount of income that should not be subject to tax.
On federal tax returns, the standard deduction is set at
$11,400 for couples, $8,400 for unmarried parents and $5,700 for
single filers in 2010. (These amounts are increased every year
to allow for inflation.) Twelve states allow the same standard
deductions as the federal amounts; three allow larger amounts;
and the rest either have smaller standard deductions or don’t
allow one at all.
Itemized DeductionsItemized deductions are the collective name for a motley
group of about a dozen separate tax deductions available as an
alternative to the basic standard deduction. Generally, better-
off families are more likely than lower-income families to have
enough deductions to make itemizing worthwhile. Deductions
related to homeownership are often what makes a family’s
itemized deductions exceed its standard deduction.
In general, the rationale for each itemized deduction is to
take account of large or unusual personal expenditures that
affect a taxpayer’s ability to pay. Itemized deductions are also
offered as a way of encouraging certain types of behavior. For
example, on the federal income tax return:
■ Charitable contributions are deductible to encourage
charitable giving, and because people who give income
to charities have less money left over with which to pay
income taxes.
■ Mortgage interest paid by homeowners is deductible to
encourage home ownership, and because interest paid on
mortgages is one of the main costs associated with owning
a home.
■ State and local income and property taxes are federally
deductible because families that pay a lot in those taxes
How the Personal Income Tax Works
Total Income –
Items Not Included in Gross Income =
Gross Income+ / –
Adjustments
= Federal Adjusted Gross Income
+ / – State Adjustments
= State Adjusted Gross Income
– Exemptions, Standard and
Itemized Deductions
= Taxable Income
x
Tax Rates
= Tax Before Credits
–
Tax Credits =
Net Tax Liability
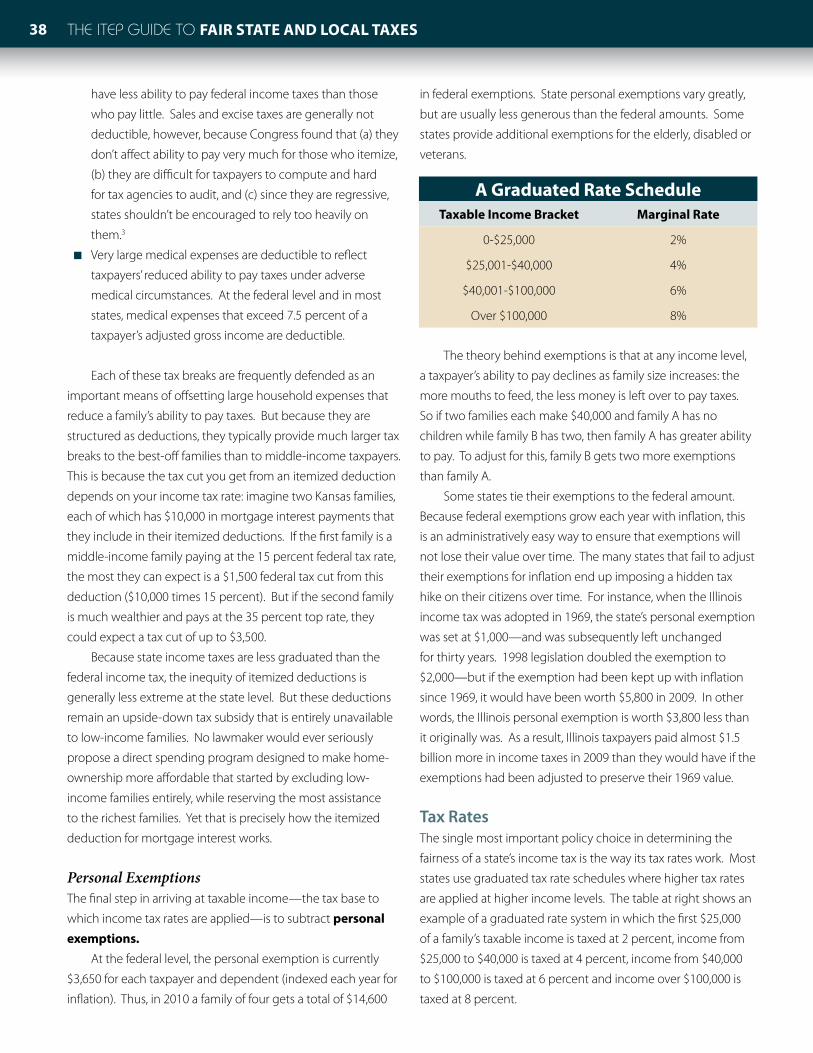
THe iTeP Guide To FaIr sTaTe and local Taxes38
have less ability to pay federal income taxes than those
who pay little. Sales and excise taxes are generally not
deductible, however, because Congress found that (a) they
don’t affect ability to pay very much for those who itemize,
(b) they are difficult for taxpayers to compute and hard
for tax agencies to audit, and (c) since they are regressive,
states shouldn’t be encouraged to rely too heavily on
them.3
■ Very large medical expenses are deductible to reflect
taxpayers’ reduced ability to pay taxes under adverse
medical circumstances. At the federal level and in most
states, medical expenses that exceed 7.5 percent of a
taxpayer’s adjusted gross income are deductible.
Each of these tax breaks are frequently defended as an
important means of offsetting large household expenses that
reduce a family’s ability to pay taxes. But because they are
structured as deductions, they typically provide much larger tax
breaks to the best-off families than to middle-income taxpayers.
This is because the tax cut you get from an itemized deduction
depends on your income tax rate: imagine two Kansas families,
each of which has $10,000 in mortgage interest payments that
they include in their itemized deductions. If the first family is a
middle-income family paying at the 15 percent federal tax rate,
the most they can expect is a $1,500 federal tax cut from this
deduction ($10,000 times 15 percent). But if the second family
is much wealthier and pays at the 35 percent top rate, they
could expect a tax cut of up to $3,500.
Because state income taxes are less graduated than the
federal income tax, the inequity of itemized deductions is
generally less extreme at the state level. But these deductions
remain an upside-down tax subsidy that is entirely unavailable
to low-income families. No lawmaker would ever seriously
propose a direct spending program designed to make home-
ownership more affordable that started by excluding low-
income families entirely, while reserving the most assistance
to the richest families. Yet that is precisely how the itemized
deduction for mortgage interest works.
Personal ExemptionsThe final step in arriving at taxable income—the tax base to
which income tax rates are applied—is to subtract personal exemptions.
At the federal level, the personal exemption is currently
$3,650 for each taxpayer and dependent (indexed each year for
inflation). Thus, in 2010 a family of four gets a total of $14,600
in federal exemptions. State personal exemptions vary greatly,
but are usually less generous than the federal amounts. Some
states provide additional exemptions for the elderly, disabled or
veterans.
The theory behind exemptions is that at any income level,
a taxpayer’s ability to pay declines as family size increases: the
more mouths to feed, the less money is left over to pay taxes.
So if two families each make $40,000 and family A has no
children while family B has two, then family A has greater ability
to pay. To adjust for this, family B gets two more exemptions
than family A.
Some states tie their exemptions to the federal amount.
Because federal exemptions grow each year with inflation, this
is an administratively easy way to ensure that exemptions will
not lose their value over time. The many states that fail to adjust
their exemptions for inflation end up imposing a hidden tax
hike on their citizens over time. For instance, when the Illinois
income tax was adopted in 1969, the state’s personal exemption
was set at $1,000—and was subsequently left unchanged
for thirty years. 1998 legislation doubled the exemption to
$2,000—but if the exemption had been kept up with inflation
since 1969, it would have been worth $5,800 in 2009. In other
words, the Illinois personal exemption is worth $3,800 less than
it originally was. As a result, Illinois taxpayers paid almost $1.5
billion more in income taxes in 2009 than they would have if the
exemptions had been adjusted to preserve their 1969 value.
Tax RatesThe single most important policy choice in determining the
fairness of a state’s income tax is the way its tax rates work. Most
states use graduated tax rate schedules where higher tax rates
are applied at higher income levels. The table at right shows an
example of a graduated rate system in which the first $25,000
of a family’s taxable income is taxed at 2 percent, income from
$25,000 to $40,000 is taxed at 4 percent, income from $40,000
to $100,000 is taxed at 6 percent and income over $100,000 is
taxed at 8 percent.
a Graduated rate scheduleTaxable Income Bracket marginal rate
0-$25,000 2%
$25,001-$40,000 4%
$40,001-$100,000 6%
Over $100,000 8%

39Five: Personal Income Taxes
But not all graduated income taxes are created equal. The
overall progressivity of a state’s rate structure depends on two
factors: the difference between the top and bottom tax rates,
and the width of the tax brackets.
Truly progressive income taxes, like California’s, use broad
income tax brackets to ensure that relatively few taxpayers
are subject to the top rate and also have a fairly wide range
between the lowest and top income tax rates. Some states
fall short of this approach by having relatively low top rates.
For example, Arizona’s top income tax bracket only applies to
married couples with taxable income over $300,000, but the
top rate is just 4.54 percent. Other states use higher tax rates,
but apply them to a much broader swath of the population. For
example, Oregon’s 9 percent marginal rate applies to married
couples with taxable incomes over $15,200.
Still other states don’t use graduated rates at all,
usually because the state’s constitution forbids it. Seven
states (Colorado, Illinois, Indiana, Massachusetts, Michigan,
Pennsylvania and Utah) have flat rate systems that tax all
taxable income at the same rate, with rates ranging from 3.07
percent in Pennsylvania to 5.3 percent in Massachusetts.
Graduated rates are an important step toward tax fairness
because they allow states to apply higher tax rates very precisely
to whichever group they view as “upper-income” taxpayers.
Understanding Marginal Tax RatesTax policy debates sometimes confuse the distinction between
effective tax rates, which tell us what fraction of a taxpayer’s
income goes to income tax overall, and marginal
tax rates, which tell us the tax rate that applied
to the last dollar of income. Anti-income-tax
advocates are only too happy to foster this
confusion—which is why it’s important for clear-
eyed observers to understand this important
distinction. What confuses some people is
that they look at a tax table like the one on the
preceding page, know that they earn $45,000 per
year, for example, and conclude that they must
have to pay 6 percent of their income in tax. But
that isn’t the way it works at all.
First, the tax rate table is based on taxable
income, not total income. Thus, someone making
$45,000 per year probably has taxable income
under $40,000 after deductions and exemptions
are subtracted—and taxable income is what
determines your tax rate. So this person is
probably only paying tax at the 4 percent rate.
Second, because these tax rates are marginal tax rates,
even if a family does have taxable income of $45,000, only the
last $5,000 of that will be taxed at 6 percent. Marginal rates
apply only to taxable income over the amount where the tax
bracket starts. This means that the effective tax rate paid at
any income level (that is, the percentage of your total income
you pay in tax) will always be lower than the top marginal rate.
The chart on this page shows how the effective tax rate on a
married couple with no children compares to the marginal tax
rate at each income level, assuming the state allows a $2,000
personal exemption and no other deductions. The first $25,000
of taxable income is taxed at 2 percent, so the effective tax rate
starts at zero and gradually approaches 2 percent as taxable
income approaches $25,000.4 As the marginal rate increases, the
effective rate increases too—but it always remains well below
the top marginal rate.
CreditsAfter computing the amount of income tax based on the
applicable tax rates, credits (if any) are subtracted. Credits
are taken directly off the tax amount that would otherwise be
owed, as opposed to deductions, which are subtracted from the
amount of income that is subject to tax.
Low-income credits are commonly used at both the federal
and state levels to reduce income taxes on those least able to
pay. Other credits are designed to provide relief from other
taxes. For example, low-income sales tax rebates and property
Taxable Income (Thousands)
10 20 30 40 50 60 70 80 90 100
110
120
130
140
150
160
170
180
190
200
9%
8%
7%
6%
5%
4%
3%
2%
1%
0%
Marginal Versus E�ective Rates: An Example
Marginal Rate
E�ective Rate
Tax
Rate
s
THe iTeP Guide To FaIr sTaTe and local Taxes40
tax circuit breakers are often administered as credits against the
personal income tax.
However, not all low-income tax credits are created
equal. The hallmark of a truly effective low-income credit is
that it is refundable. This means that if the amount of the
credit exceeds the amount of personal income tax you would
otherwise owe, you actually get money back. The best-known
refundable credit is the federal earned-income tax credit (EITC),
which allows low-income working families with children to get
a direct payment from the government if the amount of the
credit exceeds the income taxes they otherwise would owe.
In 2011, 25 states (including the District of Columbia) allowed
earned income tax credits modeled after the federal credit.
Refundability is a vital feature in low-income credits simply
because for most fixed-income families, sales and property
taxes take a much bigger bite out of their wallets than does the
personal income tax. Refundable credits on income tax forms
are the most cost-effective mechanism for partially offsetting the
effects of these other regressive taxes on low-income families.
local Income TaxesIn most states, local taxes are much less diverse than state taxes:
local governments tend to rely mostly on property taxes to fund
needed services. But more than a dozen states, seeking a fairer
and more diversified revenue structure, now allow local-option
income taxes. States allowing these taxes usually do it in one
of two ways: by granting authority to every taxing district of
a particular kind in a state, or by granting authority to specific
metropolitan areas. One example of the broader approach is
Maryland, where each county government levies a “piggyback”
tax that applies to the same tax base as the state income tax.
In states that already levy state income taxes, these
local taxes can be administered and collected by state tax
administrators on state tax forms, requiring no new paperwork.
revenue and stabilityAdvocates for a “flat tax” sometimes make the case that
progressive personal income taxes are excessively volatile,
growing too rapidly during good times and collapsing during
economic downturns in a way that makes budgeting more
difficult for state policymakers. It’s certainly true that progressive
income taxes are much more responsive to economic growth
than the other taxes levied by state and local governments, as
California found out during the last economic boom years in the
Golden State (see text box on this page).
Academic economists have shown that while income
taxes are sometimes more volatile over the short run than sales
taxes, that’s not always the case. And in the long run, virtually
any income tax, whether flat or graduated, will outperform
sales taxes in keeping pace with the cost of funding public
investments. In fact, the more progressive the income tax, the
more it grows. Why? Because virtually all income growth over
the past decade has been concentrated in the top of the income
scale. Thus, a state that has high rates on the wealthy captures
this growth better than a state with low rates on the well-to-
do. Progressive income taxes will usually grow faster than
personal income over time. This is important because the cost of
providing public services often grows faster than income as well.
Of course, in a severe recession, personal income tax
collections will decline as taxpayers’ income declines. But in the
long run, the personal income tax is the most reliable source of
revenue to fund public services.
Federal deductibilityA final step in the calculation of state income taxes doesn’t even
appear on your state tax form: part of what people pay in state
and local income taxes is offset by the deduction itemizers get
in computing their federal taxable income. On average, every
dollar that a state collects in income tax ends up costing its
residents only about 80 cents, because about 20 percent of the
cost of these state taxes is offset by federal tax cuts for itemizers.
And, from the point of view of many high-income taxpayers,
every dollar paid in state income tax costs only 65 cents. For a
more detailed discussion of this “federal offset” effect, see page 9.
The Best of Times...In early 2006, California newspaper headlines trumpeted “Google’s April surprise,” referring to the fact that the state’s income tax revenue had grown from $7 billion to $11.3 billion in just one year, in part due to Google millionaires cashing in their stock options.
The flip side of this explosive growth is that it can’t happen all the time. When investors hit hard times and choose not to cash in capital gains income, progressive income tax collections will decline. But over the business cycle, progressive income taxes simply do a better job of keeping pace with overall income growth than any other major tax levied by state governments.
41Five: Personal Income Taxes
simplicity and the Personal Income TaxEvery special state tax break has to be subtracted from
income—which means it takes at least one line on your state’s
tax form. The main reason why state income tax forms—and
instructions—are so complicated is because taxpayers must
wade through these special tax breaks.
When these tax breaks discriminate between taxpayers
who have a similar ability to pay, such unfair distinctions can
make the tax system seem more arbitrary—and can undermine
public confidence in the system. These tax breaks also make
it harder to understand the overall effect of a tax system on
people at different income levels.
Personal Income Tax reform: Issues and optionsA personal income tax can be designed to be as fair as
lawmakers want it to be. Almost every income tax is at least
slightly progressive. A progressive personal income tax is
the key to a fair overall tax system: without it, a tax system
is doomed to being highly regressive. With a sufficiently
progressive personal income tax, the whole tax system can
be made to be at least slightly progressive even if the system
includes regressive sales, excise and property taxes.
But in practice, virtually no states have achieved this. Only
a handful of states require their wealthiest taxpayers to pay
as much of their income in overall state and local taxes as the
poorest state residents. By this measure, very few tax systems
can even be described as “flat.” This section looks at the policy
choices that can either enhance or limit income tax fairness.
Graduated Rate StructuresThe easiest way to make an income tax adequately progressive
is through graduated rates. The higher the rates are on
wealthier taxpayers, the lower the rates can be on everyone else
to raise the same amount of revenue. But many states fall short
of this goal, for a variety of reasons:
■ Seven states don’t apply graduated rate structures at all,
but use a flat tax rate that applies to all taxable income.
These states are Colorado, Illinois, Indiana, Massachusetts,
Michigan, Pennsylvania and Utah.
■ Some states use nominally graduated rate structures that
don’t mean much in practice. For example, Alabama’s top
income tax rate begins at just $6,000 of taxable income. As
a result, about 75 percent of Alabama families pay at the
top rate. In states (like Alabama) that do not index their
income tax brackets for inflation, this problem grows worse
every year.
■ Other states use much wider income brackets, but apply
relatively low rates. For example, Arizona’s top tax rate takes
effect for married couples earning over $300,000—but
these taxpayers pay a marginal rate of just 4.54 percent.
The relatively small difference between the bottom tax
rate and the top tax rate makes the Arizona income tax less
progressive.
Tax Breaks for Middle- and Low-Income Families
Policymakers can also make income taxes fairer without
adjusting the tax rates. Large standard deductions and
exemptions provide relief to all income groups, but are more
significant to middle- and low-income families than to the well
off. For instance, $10,000 worth of exemptions amounts to 25
percent of income for a family earning $40,000. But the same
exemption offsets only 2 percent of income for a family making
$500,000. For this reason, providing a generous no-tax floor will
generally be a more progressive move than simply reducing
income tax rates “across the board.”
Targeted tax credits like the Earned Income Tax Credit are
an even more effective (and less costly) way of making income
taxes progressive. Because the benefits of these credits can
be designed to phase out above a specified income level,
these credits can be targeted to the low-income families who
need them most, and the cost of the credit can be kept to a
minimum. As previously noted, making these credits refundable
is probably the single most effective step policymakers can take
towards achieving a fairer tax system.
Capital Gains Tax BreaksThe progressive reforms outlined above can be undermined
when a state allows major tax shelters for a state’s wealthiest
residents. The federal income tax provides a special tax break
from dividends and capital gains income, and a number of
states have followed in this misguided path. Since most
dividend and capital gains income goes to a small group of
the very wealthiest Americans, these tax breaks mainly benefit
the wealthy while offering only a pittance to middle- and low-
income families.
Capital gains tax breaks have not been shown to
encourage additional investment on the federal level—and
this linkage is even more tenuous at the state level.5 A general
state capital gains tax break is highly unlikely to benefit a state’s
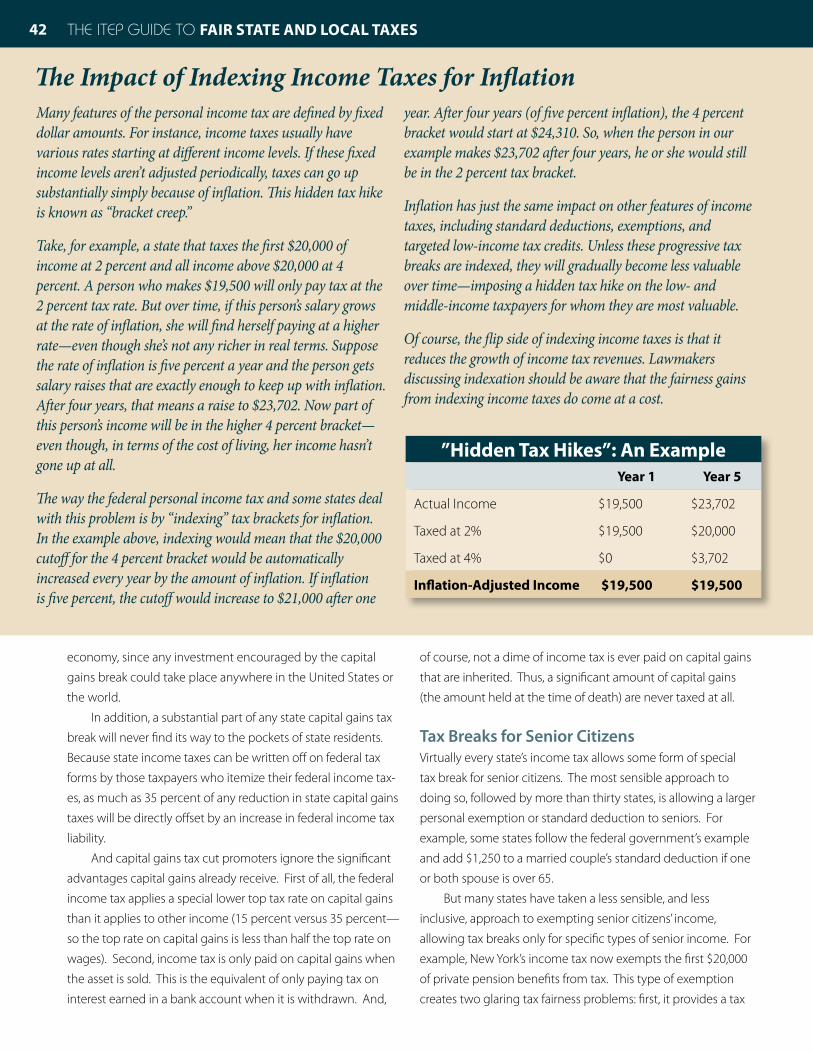
economy, since any investment encouraged by the capital
gains break could take place anywhere in the United States or
the world.
In addition, a substantial part of any state capital gains tax
break will never find its way to the pockets of state residents.
Because state income taxes can be written off on federal tax
forms by those taxpayers who itemize their federal income tax-
es, as much as 35 percent of any reduction in state capital gains
taxes will be directly offset by an increase in federal income tax
liability.
And capital gains tax cut promoters ignore the significant
advantages capital gains already receive. First of all, the federal
income tax applies a special lower top tax rate on capital gains
than it applies to other income (15 percent versus 35 percent—
so the top rate on capital gains is less than half the top rate on
wages). Second, income tax is only paid on capital gains when
the asset is sold. This is the equivalent of only paying tax on
interest earned in a bank account when it is withdrawn. And,
of course, not a dime of income tax is ever paid on capital gains
that are inherited. Thus, a significant amount of capital gains
(the amount held at the time of death) are never taxed at all.
Tax Breaks for Senior CitizensVirtually every state’s income tax allows some form of special
tax break for senior citizens. The most sensible approach to
doing so, followed by more than thirty states, is allowing a larger
personal exemption or standard deduction to seniors. For
example, some states follow the federal government’s example
and add $1,250 to a married couple’s standard deduction if one
or both spouse is over 65.
But many states have taken a less sensible, and less
inclusive, approach to exempting senior citizens’ income,
allowing tax breaks only for specific types of senior income. For
example, New York’s income tax now exempts the first $20,000
of private pension benefits from tax. This type of exemption
creates two glaring tax fairness problems: first, it provides a tax
THe iTeP Guide To FaIr sTaTe and local Taxes42
Many features of the personal income tax are defined by fixed dollar amounts. For instance, income taxes usually have various rates starting at different income levels. If these fixed income levels aren’t adjusted periodically, taxes can go up substantially simply because of inflation. This hidden tax hike is known as “bracket creep.”
Take, for example, a state that taxes the first $20,000 of income at 2 percent and all income above $20,000 at 4 percent. A person who makes $19,500 will only pay tax at the 2 percent tax rate. But over time, if this person’s salary grows at the rate of inflation, she will find herself paying at a higher rate—even though she’s not any richer in real terms. Suppose the rate of inflation is five percent a year and the person gets salary raises that are exactly enough to keep up with inflation. After four years, that means a raise to $23,702. Now part of this person’s income will be in the higher 4 percent bracket—even though, in terms of the cost of living, her income hasn’t gone up at all.
The way the federal personal income tax and some states deal with this problem is by “indexing” tax brackets for inflation. In the example above, indexing would mean that the $20,000 cutoff for the 4 percent bracket would be automatically increased every year by the amount of inflation. If inflation is five percent, the cutoff would increase to $21,000 after one
year. After four years (of five percent inflation), the 4 percent bracket would start at $24,310. So, when the person in our example makes $23,702 after four years, he or she would still be in the 2 percent tax bracket.
Inflation has just the same impact on other features of income taxes, including standard deductions, exemptions, and targeted low-income tax credits. Unless these progressive tax breaks are indexed, they will gradually become less valuable over time—imposing a hidden tax hike on the low- and middle-income taxpayers for whom they are most valuable.
Of course, the flip side of indexing income taxes is that it reduces the growth of income tax revenues. Lawmakers discussing indexation should be aware that the fairness gains from indexing income taxes do come at a cost.
”Hidden Tax Hikes”: an exampleYear 1 Year 5
Actual Income $19,500 $23,702
Taxed at 2% $19,500 $20,000
Taxed at 4% $0 $3,702
Inflation-adjusted Income $19,500 $19,500
The Impact of Indexing Income Taxes for Inflation
43Five: Personal Income Taxes
of the wealthiest executive receive the same treatment as the
benefits of the lowest-paid worker. Second, it provides special
treatment for non-working taxpayers, with no comparable
break for the earned income of otherwise identical seniors.
Over-65 workers whose earnings are based on salaries rather
than pensions are completely excluded from this generous tax
break. Since elderly taxpayers who work tend to be poor, this tax
preference for non-wage income is hard to justify.
Limiting senior tax breaks to low- and middle-income
retirees—or replacing the pension tax break with a more
general elderly exemption that applies to both earned income
and unearned income—are two approaches to tax reform that
would improve the perceived fairness of state income taxes.
Itemized DeductionsThirty one states and the District of Columbia allow itemized
deductions patterned after federal rules which are costly,
“upside-down” subsidies for the best-off taxpayers, offering
little or no benefit for many low- and middle-income families.
Most states have taken steps to make their itemized deductions
somewhat less unfair by limiting the ability of upper-income
taxpayers to claim them. This has typically been done by
piggybacking on a federal law that phased out up to 80 percent
of the benefit of certain itemized deductions for individuals with
incomes above $166,000 (in 2009). But as of 2010, the Bush tax
cuts repealed this phaseout—so itemized deductions are now
more of an “upside-down” tax subsidy that at any time in the
past decade. Unless this federal law is reintroduced for 2011,
most states’ laws will have no mechanism for making itemized
deductions less unfair.
A few states have reduced the unfairness of itemized
deductions in their own ways, either by capping the allowable
deduction, phasing out deductions for the best-off taxpayers
or by changing them to a tax credit. For example, Vermont
caps the itemized deduction for real property taxes at $10,000
and New York has an additional phaseout above and beyond
the federal rules which begins for taxpayers with AGI greater
than $475,000. Wisconsin allows taxpayers to claim a credit
for 5 percent of their federal itemized deductions. This is a
straightforward way of ensuring that the value of the credit
is the same for middle-income families as for upper-income
taxpayers—and can go a long way towards reducing the cost of
these tax breaks.
The most comprehensive reform approach available to
states is simply to repeal all itemized deductions and ensure
that most middle- and low-income families are held harmless
by simultaneously increasing the basic standard deduction
available to all families, a step taken by Rhode Island in 2010.6
Deduction of Federal Income Taxes from State Taxable IncomeAnother pitfall for state income taxes is the deduction for federal
income taxes paid.7 Since the federal personal income tax is pro-
gressive, this deduction significantly reduces the state income
taxes paid by the wealthy in the seven states that allow it. In fact,
for people in the top federal bracket, the state deduction for fed-
eral income taxes effectively lowers a state’s top marginal tax rate
by about a third. For low- and middle-income taxpayers, on the
other hand, this tax break offers little or no relief.
conclusionState governments rely on three main sources of revenue—
income, sales and property taxes. Of these, only the income
tax is progressive. For this reason, an effective income tax, with
graduated rates and a minimum of regressive tax loopholes, is
the cornerstone of any fair state tax system. But many states
have undermined the effectiveness of their income taxes in a
variety of ways described in this chapter. The result, as noted in
Chapter One, is that even the most progressive income taxes are
usually insufficient to offset the unfairness of sales and property
taxes. But a progressive income tax makes the difference
between extreme and mild tax unfairness at the state level.
1 New Hampshire and Tennessee tax only interest and dividend income, and local governments in half a dozen states have income taxes that apply only to wages.2 Here’s how it works: if Sally Jones buys stock in 2000 worth $1,000, then dies in 2011 with it having a value of $10,000, no income tax is ever paid on the $9,000 of gain from 2000 to 2010. If her heirs sell the stock in 2014 for $12,000, the heirs pay tax on only the $2,000 gain from 2011 (the date of inheritance) to 2014.3 Federal legislation enacted in 2004 allows an optional, temporary deduction for sales taxes paid, but taxpayers claiming the deduction cannot write off their state and local income taxes—which means that this temporary deduction will generally only be useful—very modestly—for residents of non-income tax states.4 Even when taxable income is exactly $25,000, however, the effective tax rate remains less than 2 percent in this example. This is because the $2,000-per-person exemption means that this family’s total income is $29,000, not $25,000. Not all of the family’s income is subject to the 2 percent tax.5 For more information see “A Capital Idea.” Institute on Taxation and Economic Policy, August 2010. http://www.itepnet.org/pdf/capitalidea0111.pdf6 To find out more about options for making state itemized deductions less unfair, see “Writing Off Tax Giveaways: How States Can Help Balance Their Budgets by Reforming or Repealing Itemized Deductions.” Institute on Taxation and Economic Policy, August 2010. http://www.itepnet.org/pdf/itemize0810.pdf 7 For more information see “Topsy-Turvy: State Income Tax Deductions for Federal Income Taxes Turn Tax Fairness on its Head.” Institute on Taxation and Economic Policy, March 2011. http://www.itepnet.org/pdf/topsyturvy_0311.pdf
A robust corporate income tax is an important tax fairness tool. It ensures that the large and profitable corporations that benefit from public services pay their fair share towards the maintenance of those services, just as working people do. The corporate tax is also one of the few progressive taxes available to state policymakers.
CHAPTER SIXCorporate INCoMe taXeS
More than forty states currently levy a corporate income tax,
but a variety of forces have combined to weaken the tax over
the past quarter century. This decline is troubling for at least
two reasons. First, rather than arising solely from the conscious
design of elected officials, it appears to be at least partially the
result of tax avoidance strategies by multi-state corporations.
Second, the less that profitable corporations pay in taxes, the
more working people must pay to shore up their states’ tax
systems.
This chapter discusses the rationale for taxing
corporations; explains the basic workings of the corporate tax;
details the downward trend in the tax over the last thirty years;
explores some of the factors that have contributed to that
decline; and reviews some of the reforms—at both the federal
and the state level—necessary for revitalizing this important
revenue source.
Why tax Corporations?Corporations are legally considered “persons,” eligible
for many of the same rights and protections as ordinary
men and women. Corporations are also granted certain
privileges—such as limited liability and perpetual life—that
everyday people do not enjoy. And just as working families
and individuals benefit from the services that state and local
governments provide, so too do corporations. Corporations
rely on a state’s education system to provide a trained
workforce, use a state’s transportation system to move their
products from one place to another, and depend on the
state’s court system and police to protect their property and
business transactions. Consequently, corporations should
contribute to funding these services just as working people
do. While corporations—like individuals—may pay taxes on
the purchases they make or on the property they own, they
should also pay taxes on the profits they realize, much in the
way that people earning a living in the state pay taxes on their
income.
Of course, while a corporation may be treated as a single
legal person, it exists in reality as a collection of individuals—
the shareholders that own it; the executives and staff that work
for it; and the consumers that buy its products. As a result,
any tax levied on a corporation ultimately falls on one of these
groups. Economic research generally indicates that for the
most part, it tends to be borne by corporate shareholders.
From a fairness perspective, the corporate tax has three
important attributes:
Just as working families and individuals benefit from the services that state and local governments provide, so too do corporations.
44 THE ITEP GuIdE To FaIr State aNd LoCaL taXeS
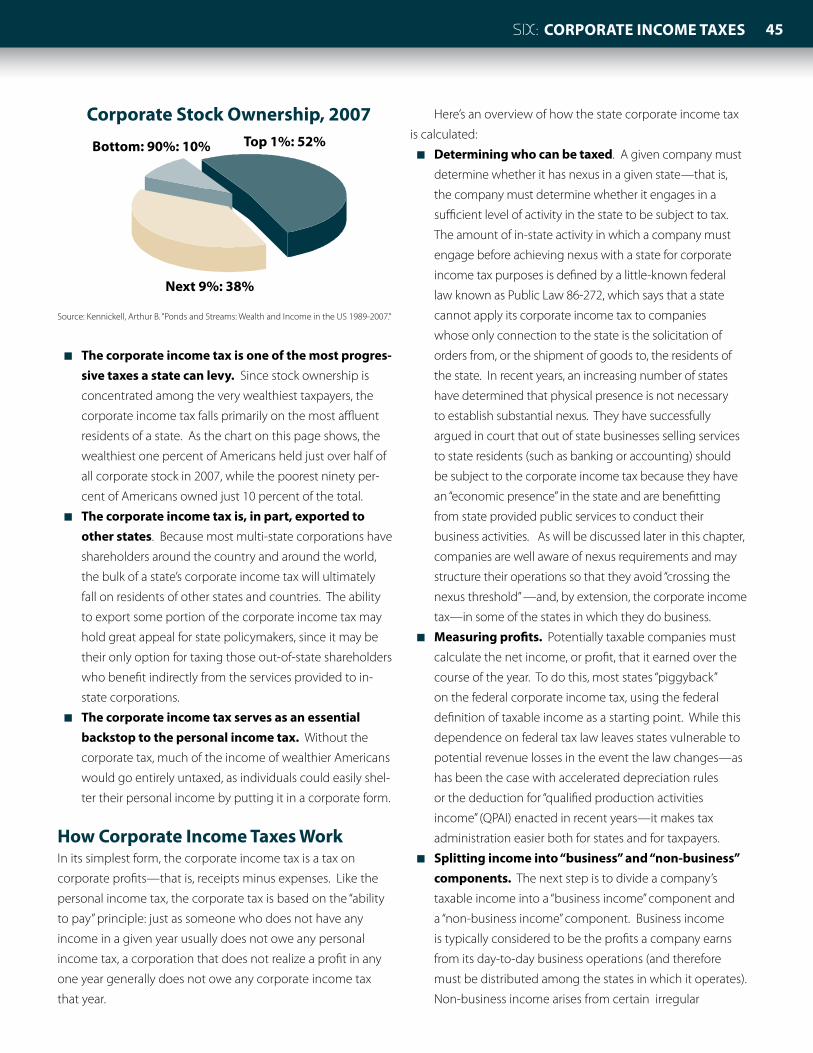
45SIX: Corporate INCoMe taXeS
■ the corporate income tax is one of the most progres-sive taxes a state can levy. Since stock ownership is
concentrated among the very wealthiest taxpayers, the
corporate income tax falls primarily on the most affluent
residents of a state. As the chart on this page shows, the
wealthiest one percent of Americans held just over half of
all corporate stock in 2007, while the poorest ninety per-
cent of Americans owned just 10 percent of the total.
■ the corporate income tax is, in part, exported to other states. Because most multi-state corporations have
shareholders around the country and around the world,
the bulk of a state’s corporate income tax will ultimately
fall on residents of other states and countries. The ability
to export some portion of the corporate income tax may
hold great appeal for state policymakers, since it may be
their only option for taxing those out-of-state shareholders
who benefit indirectly from the services provided to in-
state corporations.
■ the corporate income tax serves as an essential backstop to the personal income tax. Without the
corporate tax, much of the income of wealthier Americans
would go entirely untaxed, as individuals could easily shel-
ter their personal income by putting it in a corporate form.
How Corporate Income taxes WorkIn its simplest form, the corporate income tax is a tax on
corporate profits—that is, receipts minus expenses. Like the
personal income tax, the corporate tax is based on the “ability
to pay” principle: just as someone who does not have any
income in a given year usually does not owe any personal
income tax, a corporation that does not realize a profit in any
one year generally does not owe any corporate income tax
that year.
Here’s an overview of how the state corporate income tax
is calculated:
■ determining who can be taxed. A given company must
determine whether it has nexus in a given state—that is,
the company must determine whether it engages in a
sufficient level of activity in the state to be subject to tax.
The amount of in-state activity in which a company must
engage before achieving nexus with a state for corporate
income tax purposes is defined by a little-known federal
law known as Public Law 86-272, which says that a state
cannot apply its corporate income tax to companies
whose only connection to the state is the solicitation of
orders from, or the shipment of goods to, the residents of
the state. In recent years, an increasing number of states
have determined that physical presence is not necessary
to establish substantial nexus. They have successfully
argued in court that out of state businesses selling services
to state residents (such as banking or accounting) should
be subject to the corporate income tax because they have
an “economic presence” in the state and are benefitting
from state provided public services to conduct their
business activities. As will be discussed later in this chapter,
companies are well aware of nexus requirements and may
structure their operations so that they avoid “crossing the
nexus threshold” —and, by extension, the corporate income
tax—in some of the states in which they do business.
■ Measuring profits. Potentially taxable companies must
calculate the net income, or profit, that it earned over the
course of the year. To do this, most states “piggyback”
on the federal corporate income tax, using the federal
definition of taxable income as a starting point. While this
dependence on federal tax law leaves states vulnerable to
potential revenue losses in the event the law changes—as
has been the case with accelerated depreciation rules
or the deduction for “qualified production activities
income” (QPAI) enacted in recent years—it makes tax
administration easier both for states and for taxpayers.
■ Splitting income into “business” and “non-business” components. The next step is to divide a company’s
taxable income into a “business income” component and
a “non-business income” component. Business income
is typically considered to be the profits a company earns
from its day-to-day business operations (and therefore
must be distributed among the states in which it operates).
Non-business income arises from certain irregular
Corporate Stock Ownership, 2007 Top 1%: 52%
Next 9%: 38%
Bottom: 90%: 10%
Source: Kennickell, Arthur B. “Ponds and Streams: Wealth and Income in the US 1989-2007.”
THE ITEP GuIdE To FaIr State aNd LoCaL taXeS4646
transactions such as the sale of an asset no longer used in
day to day operations and is allocated in full to the state
in which such a sale occurs or to the state in which the
part of the company generating such income is situated
(usually the state in which a company is headquartered).
■ apportionment, or determining each state’s share of corporate “business” income. For obvious reasons,
a given state is not allowed to simply tax all of the profits
of any company that has nexus in the state. If states could
do this, the profits of companies that operate in multiple
states might be taxed many times over.
Instead, states are required to levy their corporate
income taxes in such a way that the whole of a company’s
profits are subject to tax just once.1
States conform with this requirement by dividing their
business income into an “in-state” portion (which is taxable in
a given state) and an “out-of-state” portion (which is not). Each
state uses what is known as an apportionment formula to
accomplish this step.
In the 1950s, legal reformers worked to set up a fair, uniform
way of distributing profits among states, so that the profits
of companies operating in multiple states were taxed exactly
once. The result was a model piece of legislation—the Uniform
Division of Income for Tax Purposes Act or UDITPA—that is today
part of about twenty states’ tax codes. UDITPA recommends
relying on three factors to determine the share of a company’s
profits that can be taxed by a state. These factors are:
■ The percentage of a corporation’s nationwide property
that is located in a state.
■ The percentage of a corporation’s nationwide sales made
to residents of a state.
■ The percentage of a corporation’s nationwide payroll paid
to residents of a state.
The main rationale for using these three factors is that
it is impossible to determine with any accuracy the specific
parts of a company that generate a given dollar of profit, let
alone the states in which those parts may be located. These
three factors are viewed as reasonable approximations of the
share of a company’s profit that arises from doing business in
a state, based on both the demand for company output in the
state (the sales factor) and the production activity in which it
engages in that state (the property and payroll factors), since
profits are a function of both demand and supply.
UDITPA’s recommendation was to assign each of these
three factors an equal weight in distributing a company’s
business income among the states in which it operates. In
other words, the percentage of a company’s business income
that can be considered “in-state” is the average of these three
percentages. If one supposes that the Acme Corporation
operates in three states—each of which uses an equally-
weighted three factor apportionment formula, as UDITPA
recommends—40 percent of its business income will be
apportioned to State A, 25 percent to State B, and 35 percent
to State C. In each case, these percentages are the averages
of Acme’s sales, property, and payroll factors in each state. For
instance, Acme has 50 percent of its total sales, 20 percent of its
property, and 50 percent of its payroll in State A. The average
of these factors is 40 percent; accordingly, 40 percent of Acme’s
business income will be apportioned to State A.
■ Calculating tax: Having determined the share of its
total taxable income that is attributable to a given state
(including the amount of business income that can be
apportioned to the state and the amount of non-business
income that is allocated to the state), the resulting sum is
multiplied by the state’s corporate tax rates to yield a tax
amount.
■ Subtracting credits. Many states now allow targeted
tax credits (for example, credits for research or investment
activities) that companies can subtract directly from their
pre-credit liability.
■ pay the Minimum. Most states now require that even
technically unprofitable corporations must pay some
minimal amount of income tax. As is discussed at greater
length later in this chapter, states’ minimum taxes vary
from very modest flat dollar amounts to more substantial
sums based on a company’s net worth.
Federal deductibilityIn considering how corporate income taxes are determined,
it is worth noting one final similarity between personal
and corporate state income taxes – both are deductible in
determining federal income tax liability. Thus, since the federal
corporate income tax rate is 35 percent, as much as 35 percent
of a state’s corporate income tax ultimately will be paid, not
by the businesses operating in that state, but by the federal
government in the form of reduced federal corporate income
tax collections. This interaction also means that any state
corporate income tax increase is subsidized by the federal

47SIX: Corporate INCoMe taXeS
government—and that part of any state corporate income tax
cut will never be received by in-state businesses, but will flow
instead into the federal treasury. For a more detailed discussion
of this “federal offset” effect, see page 9.
revenue and StabilityFew state tax trends are as striking as the rapid decline of
state corporate income tax revenues. As recently as 1986,
state corporate income taxes equaled almost 9 percent of
nationwide corporate profits, and 0.5 percent of nationwide
Gross State Product (a measure of nationwide economic
activity). But by each of these measures, the state corporate tax
has declined noticeably in the past two decades.
■ As a share of nationwide GSP, state corporate taxes reached
a low of 0.25 percent of GSP in 2002 before rebounding in
the past several years.
■ The post-2002 rebound in taxes as a share of the economy
conceals a more worrisome trend: nationwide taxes as a
share of corporate profits have remained at historical low
levels since 2002. Measured this way, state corporate taxes
were just over a third of their 1986 level in fiscal year 2008.
Some of the fluctuation in the corporate tax is due
to legitimate year-to-year fluctuations in the tax base: the
corporate income tax is affected by the state of the economy
because the tax is based on corporate profits, which usually
fall significantly during economic downturns. State corporate
income taxes are also facing downward pressure because
they are linked to the federal tax code: the proliferation of tax
loopholes at the federal level is being passed through, in many
cases, to state governments. Another reason for declining
corporate income tax revenues is that many companies have
become better at taking advantage of loopholes that Congress
(and state legislatures) never intended to create.
Corporate Income tax reform: Issues and optionsThe decline of the state corporate income tax has been so
dramatic in recent years that a few anti-tax advocates have
suggested repealing the tax entirely, arguing that the limited
yield of the corporate tax makes it not worth the trouble
of collecting. A robust corporate income tax can—and
should—be part of each state’s tax system. State policymakers
only need understand the sources of this problem and the
solutions that are available to them. Indeed, a number of
easily administrable, economically sound reforms could help to
revitalize this important revenue source.
An Eroding Federal Tax Base One of the factors that has contributed to the decline of
state corporate income taxes is the erosion of the federal
corporate income tax. As noted earlier in this chapter, for
many companies, the starting point in determining their state
corporate income tax liabilities is the income they report for
federal tax purposes. Consequently, changes in law that shrink
the size of the federal corporate income tax base, in many
instances, result in smaller state bases as well. Similarly, both
federal corporate income taxes, relative to gross domestic
product, and state corporate income taxes, relative to gross
state product, have both grown over the last several years,
principally because corporate profits have come to comprise
a larger share of the economy. Again, whatever affects the
federal base—whether due to policy or from fundamental
changes in the economy—affects the state base as well.
Two changes in federal tax law are illustrative. In 2002,
Congress and the Bush Administration enacted a federal
corporate tax break known as “bonus depreciation” that
enabled companies to write off capital investments much
more rapidly than they had been able to do previously. At
the time the change was made, it was expected to lead to a
federal revenue loss of $97 billion; since that break affected
federal taxable income, it was also expected to suppress state
corporate income tax revenue by as much as $14 billion2.
In 2004, Congress and the President extended another
giveaway to profitable multinational corporations. Known
as the “qualified production activities income” (QPAI)
deduction, this tax cut was originally envisioned as a means to
Recovery or Relapse? State Corporate Income Taxes, 1978-2008
0.1%
0%
0.2%
0.3%
0.4%
0.5%
0.6%
1%0%
2%
3%
4%
5%
6%
7%
8%
9%
10%
As % of GSP
As % of Pro�ts
1979
1981
1983
1985
1987
1989
1991
1993
1995
1997
1999
2001
2003
2005
2007
Source: US Census Bureau, Bureau of Economic Analysis
48 THE ITEP GuIdE To FaIr State aNd LoCaL taXeS48
compensate manufacturers for the loss of an export subsidy
that violated World Trade Organization rules, but grew well
beyond that purpose on its way to enactment. At the time that
it became law, this new deduction was projected to reduce
federal tax revenue by $77 billion over 10 years. States were
also expected to sustain significant revenue losses from the
change.
States are not powerless in the face of such changes,
however. They do not have to stand idly by and accept
such unwelcome inheritances from the federal government.
They can—and have—selectively severed the connections
between the federal tax code and their own tax laws that
convey such tax cuts from one level of government. This
process, known as “decoupling,” allows states to preserve most
of the administrative ease of linking to federal rules while
also preserving their revenue stream. Indeed, at least twenty
states have decoupled from the “bonus depreciation” tax break,
while just under half have chosen to decouple from the QPAI
deduction.
Manipulating Apportionment Rules in the Name of Economic Development?In determining what portion of a multistate company’s profit
is taxable in a given state, most states use the three-factor,
payroll-property-sales apportionment formula method
described on page 46. In recent years, however, many states
have deviated from this basic three-factor approach by
increasing the importance of the “sales factor.” For example,
Florida allows companies to count the sales factor twice. (In
the example on page 46, this means that instead of taxing
70 percent of a company’s business income (the average of
90, 30 and 90), Florida can only tax 60 percent of that income
(the average of 90, 30, 30 and 90). This “double weighting”
approach reduces the tax paid by corporations that sell most
of their products in other states—for example, manufacturing
corporations. Nine states still use the unweighted UDITPA
formula.
Many states have gone even further, increasing the weight
of the sales factor to one hundred percent—eliminating the
payroll and property factors entirely. This is known as the
“single sales factor,” or SSF. Under SSF, the sole determinant of
a corporation’s state tax is how much of its sales are made to
in-state customers. Advocates of increasing the sales factor
claim that it encourages exporting businesses to locate in a
state, since it favors companies with greater payroll and assets
in a state than sales. But claims that an increased sales factor
attracts corporate investment are dubious. Indeed, in some
cases, it might actually discourage investment in a state.
If a company, for instance, only ships products into a
state, it may not have nexus with the state. But in a state with
an increased sales factor, if such a company makes even a
small investment in a state, it will immediately have much of
its income apportioned to the state because the sales factor
counts so heavily. And a company with only a small amount of
property or payroll in a sales factor state can reduce its in-state
corporate taxes to zero by moving this property and payroll
out of the state. Thus, increasing the sales factor can actually
have exactly the opposite effect of what its proponents intend:
discouraging in-state investment.
In addition, increasing the sales factor discriminates
between companies in a way that is hard to defend. Increasing
the sales factor will reduce taxes for some companies, but will
increase taxes for others. For each corporation that benefits
from SSF because most of its sales take place in other states,
there are also corporations that will be punished by SSF rules
because their sales are mostly in-state. Smaller corporations
that tend to make most or all of their sales within the state in
which they are located generally get little if any tax savings
Tax Credits and the Incentive IllusionMany states give businesses numerous tax credits that significantly reduce (or even eliminate) their tax liability. These include credits supposedly intended to create jobs or encourage investment. Unfortunately, these credits usually just reward businesses for doing things they would have done anyway—or, even worse, make a state’s economy more inefficient by shifting investment into areas that do not make the most economic sense.
Claims that the single sales factor attracts corporate investment are dubious. Indeed, in some cases, this tax break can actually discourage investment in a state.
49SIX: Corporate INCoMe taXeS
under the SSF approach. In short, adoption of the single sales
factor ultimately benefits some corporations while punishing
others in an arbitrary way.
These arbitrary distinctions reduce the confidence of
the public—and of corporations—in the fairness of state tax
administration. When profitable companies benefit from a
state’s services—as the manufacturing companies that typically
benefit from the single sales factor clearly do—they should pay
their fair share of the corporate tax. When these corporations
are allowed to reduce or eliminate their tax liability, that lost
revenue must be made up by other competing companies—
and by individual taxpayers.
Separate accounting & transfer pricingA further inconsistency in state corporate taxes stems from
the fact that some states permit companies to determine
their in-state taxable income using separate accounting for
each of their related subsidiaries. Separate accounting is a
bookkeeping procedure that determines each company’s
taxable income by having companies keep separate accounts
for their in-state and out-of-state business segments. Every
transaction between the legally distinct subsidiaries of a
company is supposed to have a transfer price (that is, the
“sales price” at which these companies are essentially selling
products to themselves) attached to it, which is supposed to
be carefully scrutinized by auditors.
Not surprisingly, separate accounting is subject to abuse
by large, multistate companies. In fact, it’s an open highway
for corporate tax avoidance. A large multistate company can
use separate accounting to shift taxable profits to low-tax
jurisdictions. Here’s how it works:
Consider a multistate company that has two subsidiaries,
one in State A that permits separate accounting and one in
State B, which has no corporate income tax. To reduce its
taxable profits, the subsidiary in State A might say that it “pays”
high transfer prices for the items it “buys” from the State B
subsidiary. This shifts income out of State A (where it would be
taxed) and into State B (where it’s not).
For example, a furniture company might machine the
metal parts for its furniture (handles, knobs, etc.) in State B, but
assemble the furniture in State A. The company will, on paper,
charge very high prices to its State A subsidiary for the metal
parts. This makes the State B subsidiary look like it has very
high profits (which are not taxed) and the State A subsidiary
look like it has very low (taxable) profits.
Of course, except for tax considerations it doesn’t matter to
the parent company if its State B subsidiary has 80 percent of
the total profits and its State A subsidiary has only 20 percent.
Either way, the parent company gets 100 percent of the profits.
Another example of transfer pricing that has gotten more
attention in recent years is the passive investment company
(PIC) approach. In this variation on the transfer pricing scheme,
a multi-state company will set up a subsidiary in a state that
does not tax certain types of intangible income like royalties
and interest—and make sure that this subsidiary receives all of
the company’s royalty income. The most infamous example
of this practice is the Toys R Us corporation, which created a
subsidiary in Delaware called Geoffrey, Inc. The subsidiary owns
the Toys R Us trademark, and Toys R Us stores around the nation
pay royalty fees to the Delaware subsidiary for their use of the
trademark. This reduces the taxable profit of Toys R Us in two
ways: stores based in other states get to deduct their royalty
payments as a cost of doing business, which reduces their
taxable profit, and the Delaware subsidiary pays no tax on their
royalty income because Delaware does not tax such income.
Trying to assure accurate transfer pricing under separate
accounting creates huge enforcement problems. It is a time-
consuming, complicated and often impossible job for state
auditors to determine whether separate accounting methods
accurately reflect a company’s net business income in the
state. The federal government, which tries to apply the same
approach to multinational corporations, has had the same
kinds of difficulties.
States seeking to prevent these income-shifting strategies
have two options. They can close down these loopholes
one at a time—as some states have done in response to the
PIC problem by enacting legislation that prevents the use of
PICs—or they can adopt a comprehensive solution known as
combined reporting. Combined reporting requires a multi-
ExxonMobil to Maine: SayonaraMaine is among the states that have recently enacted a “single sales factor” with the hope of improving the state’s business climate. But the hit-or-miss nature of SSF became immediately apparent when ExxonMobil announced in July of 20083 that they planned to stop doing business with Maine airports—and cited likely tax hikes from the new single sales factor as one reason for their decision.
50 THE ITEP GuIdE To FaIr State aNd LoCaL taXeS50
state corporation to determine its apportionable income
by adding together the profits of all its subsidiaries into one
total. Since the income of subsidiaries in the various states
is added together in one sum, there is no tax advantage to
income shifting between these subsidiaries under a combined
reporting regime. While anti-PIC legislation can close down
one particular path to tax avoidance, combined reporting is
a better, more comprehensive approach to loophole-closing
because it simply removes the incentive to shift income from
high-tax to low-tax jurisdictions.
Combined reporting is intuitively more fair than separate
accounting because it ensures that a company’s tax should
not change just because its organizational structure changes.
It also creates a level playing field between smaller and larger
companies: small companies doing business in only one state
can’t use separate accounting to reduce their tax because they
have no business units in other states to shift their income
to. Large, multi-state corporations will find it easier to avoid
paying taxes using separate accounting because they have
business units in multiple states. The fact that small businesses
can benefit from combined reporting may help explain the
growing popularity of this needed reform: seven states and DC
have enacted combined reporting since 2004.
“Nowhere Income” and the Throwback RuleEvery state with a corporate income tax uses the location of the
corporation’s sales as a factor in apportioning business income
between states. The “sales factor” for a given corporation in
a given state is calculated by assigning each individual sale a
company makes to exactly one state, and then calculating what
percentage of total nationwide sales are in each state. In general,
the rule states use to decide which states a given sale should be
assigned to is the “destination rule,” which says that a sale should
be assigned to the state to which the product sold is being sent.
Sometimes, however, sales allocated to other states using
the destination rule end up not being taxed at all because the
destination state lacks the authority to tax the seller. When
this happens, it’s because the seller doesn’t have nexus in the
destination state.
Unless states take action, this “nowhere income” will not
be taxed anywhere at the state level. The best remedy for the
problem of nowhere income is enacting a throwback rule,
which simply says that any sales to other states that are not
taxable will be thrown back into the state in which the sale
originated for tax purposes. The throwback rule was among
the tax rules adopted by the UDITPA in the 1950s, but many
states still have not enacted it. The lack of throwback rules
poses a major threat to state corporate income tax revenues in
almost twenty states.
Splitting Hairs? Exploiting the Business/Nonbusiness Income DistinctionAs previously noted, every company must divide its potentially
taxable income into two categories: a “business income”
component and a “nonbusiness income” component. Business
income is apportioned (divided) between the states in which a
company does business, while non-business income generally
is taxed entirely by the one state in which the asset generating
that income is managed. But each state must set its own legal
dividing line between business- and non-business income—
and the way in which states do this has important implications
for corporate tax fairness.
The appropriate dividing line between these two types of
income has been the topic of frequent litigation in the states.
In many states, business income is defined as any income that
arises from the regular transactions that a company typically
engages in—which means that any income that can be
characterized as “irregular” may be considered non-business (and
therefore non-apportionable) income. Businesses sometimes
try to take advantage of this poorly defined distinction between
business and non-business income by misleadingly classifying
some business income as irregular non-business income, then
allocating this non-business income entirely to a low-tax state in
which they are nominally headquartered. A 1992 U.S. Supreme
Court case, Allied-Signal v. Director, Division of Taxation, New
Jersey 4, made it clear that many states currently falling prey to
these tax-minimization strategies are not taxing all the corporate
income they could legally tax.
States with corporate income taxes have responded to
these corporate tax-minimization efforts using two strategies:
■ Seven states define business income as everything they
can legally apportion under the U.S. Constitution—which
Separate accounting is an open highway for corporate tax avoidance by big multi-state companies—but “combined reporting” can help clamp down on tax-avoidance schemes.
51SIX: Corporate INCoMe taXeS
means that non-business income is whatever is left over.
This approach is recommended by corporate tax experts
as the best way of fairly taxing multi-state corporations’
income.5
■ Eleven states define all income as business income. This
approach allows states to tax some of the “irregular”
income that companies seek to classify as non-business
income, but prevents states from taxing some non-
business income that they are entitled to tax. For example,
if a company is based in state A, and generates $100
million of non-business income in state A, the state should
be entitled to tax the entire amount as non-business
income (since non-business income is not apportioned
between states). But when states make no distinction
between business and non-business income, all of a
company’s income is apportioned—which means that
state A can only tax a percentage of this income.
Every state with a corporate income tax (except for the six
states that currently define business income in accordance with
the U.S. Constitution’s limits), could enact statutory changes
that would allow them to prevent the nonbusiness income
loophole from eroding their tax base.
Corporate Minimum taxesAll states with corporate income taxes use corporate profits to
define the tax base. This ensures that the corporate tax reflects
a business’ ability to pay the tax: if a corporation loses money
in any year, they don’t pay the tax. But the growing use of tax
avoidance strategies means that many profitable corporations
are now able to report artificially low (or negative) profits for tax
purposes even when they’ve done quite well financially. These
tax avoidance strategies have created the specter of profitable
“zero-tax corporations.” Federal tax reform legislation in 1986
created an “alternative minimum tax” (AMT) to ensure that all
profitable corporations would pay some tax no matter how
many tax breaks they might otherwise claim.
States seeking to follow the federal government’s lead
have taken one of three strategies: imposing an AMT based on
the federal tax, imposing a flat-dollar minimum tax, or using a
non-profit-based measure of business activity as a backstop to
the corporate profits tax.
A few states use an AMT based on the federal tax. Like the
regular corporate income tax, the AMT usually is defined as a
percentage of corporate profits—but the AMT typically applies
a lower tax rate to a much broader definition of corporate
taxable income. This approach has become much less useful
because the federal AMT has been seriously watered-down
over time by Congress—but a state AMT based on the older
federal AMT rules could still help prevent the excessive use of
tax loopholes.
A growing number of states rely on a simpler, lower form
of minimum tax: a flat-dollar amount that all corporations
must pay. This amount ranges widely, from $50 in Ohio
to a maximum of $1,500 in New York. As more and more
corporations rely on tax avoidance strategies, the fixed-
dollar minimum tax has become more important in these
states: in New York, for example, more than sixty percent of
all C-corporations paid only the fixed-dollar minimum tax in
tax year 2006.6 More than 70 percent of Utah C-corporations
paid only the minimum in tax 2008 including 27 percent of
profitable corporations.7
About half of the states now levy a “corporate franchise tax”
in addition to a corporate income tax. In general, these taxes
are based on a company’s net worth. Some states also use
a tax on gross receipts. Gross receipts taxes are described in
Chapter Three.
There is a growing consensus among many tax experts that state and local tax breaks for business are being used in a way that is actually unconstitutional, by subverting the regular flow of interstate commerce. Congress can take steps to stop the bleeding.
Should States Repeal Their Corporate Taxes?A few states, including Ohio and Texas, have recently enacted alternative businesses taxes that are designed not as a backstop to the profits tax, but as a replacement. Learn more about the shortcomings of this approach to “tax reform” in Chapter Three.
52 THE ITEP GuIdE To FaIr State aNd LoCaL taXeS52
Each of these options can help eliminate the “zero-tax
corporation” problem—and (in some cases) can also help
states to get around the problem of corporate nexus described
above. Some nexus rules only apply to taxes that are based on
profit. So a company that does business in a state, but doesn’t
have enough physical presence in the state to satisfy the nexus
rule, cannot be reached by a profits-based taxed, but can be
reached by a fixed-dollar minimum tax.
Corporate disclosure: an Important tool for tax FairnessTax fairness is important. The perception that state and
local taxes treat individuals and corporations fairly is a
cornerstone of public support for the tax system. The fairness
of corporate taxes at the federal level can be evaluated on a
company-by-company basis, with some difficulty: publicly
available Securities and Exchange Commission (SEC) filings
allow analysts to determine how much the nation’s largest
corporations have paid in federal taxes and compare this
to their profits. In a series of reports, ITEP has shown that
many profitable corporations pay little or no federal income
tax. A September 2004 ITEP report surveyed 275 of the most
profitable corporations, and found that almost a third of these
companies paid zero (or less) in federal taxes in at least one
year between 2001 and 2003.8
Unfortunately, the fairness of each state’s corporate tax
cannot be evaluated in the same way, because neither the SEC
nor most state governments require corporations to release
detailed information on their state corporate tax payments. A
few states have now implemented some form of corporate
tax disclosure. For example, Massachusetts now requires very
limited anonymous disclosure of basic information about
profits, taxes paid and tax credits received. But nearly all states
still have no such requirements. Greater state corporate tax
disclosure is the best means available to ensure that each
corporation is treated fairly—and that corporations as a group
pay their fair share of taxes.
Corporate disclosure can also help states to prevent
the accounting hijinks described above. For example, some
companies will report certain income as “non-business income”
in one state and “business income” in another to minimize their
tax liability. More open reporting of this information could
allow states to check for consistency in income reporting
between states.
ConclusionState corporate profits taxes have been a mainstay of state
tax systems for almost a century. And despite the worrisome
recent drop in the yield of these taxes, virtually every state now
has available a straightforward set of tax reform policies that
could not only end the erosion of their corporate tax base, but
could help these taxes regain their former health.
1 This is required by a patchwork of federal case law – most notably, the Supreme Court’s decision in Container Corporation of America v. California Franchise Tax Board.2 Johnson, Nicholas, “States Can Avoid Substantial Revenue Loss by Decoupling from New Federal Tax Provision.” Center on Budget and Policy Priorities, April 20, 2002. http://www.cbpp.org/archiveSite/3-20-02sfp.pdf. The change was retroactive to September 2001 and was set to expire in September 2004, but has been extended several times, most recently as part of the 2009 American Recovery and Reinvestment Act.3 Robbins, Toni-Lynn, “Jet fuel supplier cites state taxes for decision to pull out of BIA.” All Business. July 3, 2008. http://www.allbusiness.com/government/government-bodies-offices-regional-local/14685900-1.html4 Allied-Signal, Inc. v. Director, Division of Taxation (91-615), 504 U.S. 768 (1992). http://www.law.cornell.edu/supct/html/91-615.ZS.html5 Mazerov, Michael, “Closing Three Common Corporate Tax Loopholes Could Raise Additional Revenue for Many States.” Center on Budget and Policy Priorities, May 23, 2003. http://www.cbpp.org/cms/index.cfm?fa=view&id=18686 New York State Department of Taxation and Finance, “2006 New York State Corporate Tax Statistical Report.” April, 2010. http://www.tax.state.ny.us/pdf/stats/stat_corp/corp_stat/2006_new_york_state_corporate_tax_statistical_report.pdf7 Lund, Matthew, “Utah State Tax Commission Corporate Statistics: Tax Year 2008.” Utah State Tax Commission, 2010. http://www.tax.utah.gov/esu/income/corp08/corp2008.pdf8 McIntyre, Robert and T.D. Coo Nguyen, “Corporate Income Taxes in the Bush Years.” Citizens for Tax Justice and Institute on Taxation and Economic Policy, September 2004. http://www.ctj.org/corpfed04an.pdf
53Seven: Other revenue SOurceS
CHAPTeR SevenOther revenue
SOurceS
“user Fees”: What’s In a name?The most literal policy response to perceived anti-tax sentiment is
to simply replace taxes with revenue sources that can’t be called a
tax. Since California’s Proposition 13 tax caps gave this approach
widespread notoriety, virtually every state has increased its use of
a category of non-tax revenues called “user fees” as an alternative
to hiking taxes. What makes user fees different from conventional
taxes is that they take the form of a direct payment to govern-
ment for a specific service rendered to a specific taxpayer by the
state—and the payment is usually made at the same time that
the service is rendered. Common examples of user fees include:
■ Highway tolls (you pay each time you use a section of tolled
highway);
■ Car registration and driver’s license fees (you pay each time
you register your car);
■ Tuition at public universities (you pay when you enroll at a
public university).
In each case, no one has to pay the fee unless they actually
use the service. If you don’t drive a car or go to school, you don’t
pay a dime in the user fees mentioned above.
By contrast, conventional taxes are collected in a way that is
almost never linked to a specific personal service taxpayers get
in return. For example, personal income taxes usually go into a
state’s general fund to pay for a wide variety of public services;
it’s impossible to draw a direct connection between the tax you
pay in and a specific service you get in return. And while gasoline
taxes may seem like user fees, they’re not: even when gas taxes
are earmarked for transportation funding, the $5 in gas taxes you
paid at the pump on Monday won’t give you a tangible benefit
that day, that week or even that year—you’re simply helping to
fund transportation in general.
In 1962, user fees were just over 15 percent of local govern-
ments’ own-source revenue; in fiscal year 2008, that number had
risen to more than a quarter of the local government revenue
pie1. State governments have also increased their reliance on user
fees somewhat, but the user fee remains primarily a local govern-
ment tool.
Fairness and User Fees: Two ViewsAre user fees fair? There are two competing views of fiscal fairness
that tell very different stories about the underlying fairness of user
fees. Most Americans subscribe to the “ability to pay” school of tax
fairness; by this view, user fees almost always fail the fairness test.
A $20 fee to use a state campground, or a $50 fee for registering
a car, hits low-income families much more heavily than upper-
income families, simply because $20 is a much larger share of
their annual income.
But there is a second, competing view of fiscal fairness, called
the “benefits principle,” which says that what taxpayers put into
the public coffers should depend directly on what they get in
return from the state. According to this view, user fees are unam-
biguously the fairest way of raising revenue.
These two views of fairness are obviously at loggerheads. Re-
lying more heavily on user fees creates a more direct connection
The vast majority of state and local own-source revenue comes from the “big three” types of taxes (personal income, consumption, and property taxes). But smaller taxes, and non-tax revenue such as user fees, are an important part of the picture in many states. This chapter takes a closer look at some minor revenue sources that have traditionally formed a small part of the state tax pie: user fees, the estate tax, gambling revenues and borrowing, and discusses the appropriate uses of each.

54 THe ITeP GuIde To FaIr State and LOcaL taxeS54
between the taxpayer and the benefits she receives, but almost
certainly will make state revenue systems more regressive—an
important concern because almost every state’s tax system is
quite unfair to begin with.2
When Should Governments Rely on User Fees?Too often, state and local governments have taken to enacting
user fees simply because they fear the political repercussions from
enacting higher-visibility tax increases. But a case can be made
that under certain circumstances, user fees are the right thing to
do, not just the politically expedient thing to do.
In particular, when state or local governments provide a type
of service that clearly benefits one taxpayer and has no direct bene-
fit for anyone else, it can be argued that the beneficiary should pay
for that service. Parking your car at a downtown parking meter pro-
vides a narrowly targeted service to you as a car owner—therefore,
your use of the parking space should be paid for by you personally
as a driver rather than the entire population of a city or state.
But many of the most important services provided by state
and local governments provide both personal and social benefits.
A quality high-school education certainly confers benefits on
the student receiving it, but also helps to build a state’s supply of
human capital by creating a better educated work force. For this
reason, a strong argument can be made that public education
should be funded primarily through general taxes, not user fees.
There is, of course, an even more fundamental objection to
relying on user fees to fund important public services. There is
broad agreement that government should ensure basic human
rights to even the poorest families and children—even those who
lack the resources to fully pay for these rights. For this reason,
almost every state has enshrined in its constitution the right to an
adequate public education—and these constitutional protections
are generally understood to mean that the quality of a child’s edu-
cation shouldn’t depend on whether their parents can afford to
pay for it. Relying on user fees to pay for education or other vital
services such as health care and public safety directly violate the
notion that states should guarantee basic human rights.
estate and Inheritance taxesUntil 2001, levying a tax on the transfer of wealth from one
generation to the next was one of the few things all fifty states
could agree on. After the federal government enacted an estate
tax in 1916 to “break up the swollen fortunes of the rich,” every
state enacted a similar tax of its own. While these taxes typically
represent only a small part of overall state tax collections, estate
taxes (which are paid by taxable estates upon death) and inheri-
tance taxes (which are paid by those individuals who receive gifts
from estates) play an important role in reducing the transmission
of concentrated wealth from one generation to the next. This
function is now more important than ever: in 2007, the wealthi-
est 1 percent of Americans owned 33.8 percent of the wealth
nationwide—more than the poorest 90 percent put together.3
The estate tax was designed to apply only to the very wealthiest
Americans—and that’s exactly what it does. Nationwide, less
than one percent of decedents owed federal estate tax in 2008.4
This is primarily because the federal tax exempted the first $3.5
million of an estate’s value from tax in 2009. (Of course, due to
temporary tax changes enacted by the Bush administration, the
federal tax disappeared entirely, for a single year, in 2010.)
Recent federal tax changes, however, threaten the future
of the estate tax at the state level. Since 1926, the federal estate
tax allowed a dollar-for-dollar tax credit against the estate taxes
levied by states, up to a certain maximum amount. The credit
gave states an incentive to levy an estate tax at least as large
as this credit: in the states levying a “pickup tax”—that is, a tax
calculated to be exactly equal to the maximum federal tax
credit—the state’s estate tax amounted only to a transfer of
estate tax revenues from the federal government to the states. In
other words, the pickup tax did not change the amount of estate
tax paid—it just meant that part of the federal estate tax liability
was being shared with, or “picked up” by, state governments.
Every state took advantage of this incentive to enact an estate
tax at least as big as the pickup tax.
Federal tax cuts enacted in 2001 gradually repealed the
federal estate tax over ten years—and, more importantly for the
states, phased out the federal credit allowed for state estate taxes
between 2002 and 2005. In many of the states that base their
tax on the federal credit, this meant that the state’s estate tax also
ceased to exist in 2005, although a number of states took steps to
prevent this accidental tax repeal.
The “pickup tax” credit was scheduled to come back to life
along with the federal estate tax in 2011, but Congress acted to
permanently replace the credit with a deduction. States seeking
to preserve this important progressive revenue source have an
Many of the most vital services provided by state and local governments provide benefits not just to isolated individuals, but to society—and should be paid for with taxes, not user fees.
55Seven: Other revenue SOurceS
easy way of doing so: “decoupling” from the federal tax repeal.
The easiest way to achieve this is by defining the state estate tax
to equal the federal credit as it existed in 2001—before the pas-
sage of the Bush administration’s estate tax cuts. States taking this
step will effectively have a tax with a rate of 16 percent on estate
value in excess of $1 million. Importantly, states taking this step
can “piggyback” on special federal provisions that help to ensure
that small businesses and family farms won’t be hit by the estate
tax, including a provision that assessing farmland according to its
agricultural value, not its market value, an extra exemption above
the basic amount, and a 14-year grace period to pay any estate
taxes owed.4
A number of states have made this simple administrative
change already. Half a dozen other states are at least partially un-
affected by the federal estate tax repeal because they levy sepa-
rate inheritance taxes, which are paid individually by those receiv-
ing transfers from an estate (by contrast, the estate tax is levied on
the value of an entire estate, generally without regard to the way
taxable estate value is split up between beneficiaries). Each of
these options could be enacted by close to half of the states as a
means of shoring up state revenues and restoring tax fairness.5
Gambling revenuesLike tax policy, gambling policy is made in a decentralized
way: each state’s lawmakers can choose which (if any) forms of
legalized gambling to allow. As a result, the states now have very
different approaches to allowing gambling activities. Some form
of government-sanctioned gambling is now allowed in all but
two states (Utah and Hawaii). By far the most popular forms of
legalized gambling are lotteries and casinos: 37 states and the
District of Columbia have state lotteries, and more than half of
the states have some form of casino gambling. Many states also
allow “pari-mutuel” gaming, wagering on live events such as horse
and greyhound racing.
Advocates of state-sponsored gambling typically see it as a
painless, voluntary tax—and one that is at least partially paid by
residents of other states. At a time when lawmakers’ willingness
to increase politically unpopular taxes is especially low, a tax paid
by non-residents may seem especially palatable. It is also argued
that in the absence of legal gambling, many state residents
will either gamble illegally or travel to other gambling-friendly
states—with no benefit to the state. But opponents raise a host
of troubling objections to states’ use of legalized gambling.
■ Even if gambling boosts state revenues in the short run,
competition from other states means that the yield of the
tax will likely decline over time—and will ultimately shift
the cost of this tax primarily to state residents rather than
tourists from other states.
■ Instead of increasing the total amount of revenue available to
fund public services, gambling may simply shift money from one tax to another with no net gain to the state.
When consumers spend more money on gambling, they will
spend less money on other items. Since these other types of
purchases are usually subject to state sales taxes, any increase
in state gambling revenue usually means a decrease in state
sales tax revenue.
■ Rather than simply capitalizing on existing illegal gambling
activities, legalized gambling may encourage consumers to gamble more than they otherwise would. When states
use gambling as a revenue source, they depend on the
continued flow of this revenue to fund services. This often
leads to state-sponsored advertising that actively encourages
citizens to gamble more. In this respect, gambling is very
different from “sin taxes” on alcohol and cigarettes, which are
often enacted not to raise money but to discourage behavior
that is deemed socially harmful.
■ Gambling may introduce a variety of social costs, including
increased crime rates, decreased private savings, increased
debt, and job losses. These social costs can result in increased
social welfare spending by state governments in the long run.
■ Low-income and poorly-educated taxpayers are far more
likely to participate in lotteries and other forms of gambling
than are wealthier, better-educated taxpayers. As a result,
state-sponsored gambling can be considered a regressive tax.
■ Like other “sin taxes,” gambling is not always a truly voluntary tax. Compulsive gambling has been recognized
as an addictive disease. Relying on compulsive gamblers
to fund public services amounts to taking advantage of
these gamblers’ addictions. And because state gambling
administrators tend to downplay the poor odds of winning,
gamblers are usually given incomplete information about
these odds—which means, in a sense, that gamblers are
being tricked into these “voluntary” spending decisions.
■ Promises of additional spending for specific public services may be illusory. Advocates of state-sponsored
gambling often seek to earmark gambling revenues for
specific purposes, usually to help fund education. These
advocates often promise that state spending on education
will increase as a result of the new gambling revenues. But
it is just as likely that lawmakers will use gambling revenues
56 THe ITeP GuIde To FaIr State and LOcaL taxeS56
to replace other revenues that have been shifted from
education to other areas—leaving the total amount of
spending on education unchanged.
Borrowing From the Future: debt and Other StrategiesThe imbalance between federal spending and federal revenues
that resulted from huge federal tax cuts enacted in the past
decade has prompted growing concern over our national
debt. Yet state and local policymakers continue to blithely pass
on the cost of funding current services to future generations,
using borrowing as a substitute for tax reform. When is this
practice appropriate—and when is it simply stealing from our
grandchildren?
Borrowing is an important—and, at times, entirely
appropriate—strategy for funding public investments in every
state. When state or local policymakers choose to invest in
infrastructure spending that will benefit not just current taxpayers
but future generations, such as roads, bridges and hospitals, it
makes sense to spread the cost of paying for these investments
across the years of their use. This is done by issuing bonds,
which are purchased by individual and business investors. In
the short run, investors’ bond purchases pay for needed public
investments, and the investors are repaid, with interest, over time.
The government pays investors back with revenues from taxes
collected each year, effectively spreading the cost of funding
these infrastructure investments over the life of the bonds, and
ensuring that tomorrow’s taxpayers will pay some of the costs of
the long-term infrastructure improvements they enjoy.
In part because federal lawmakers recognized the
importance of bonding as a state and local tool for funding
capital improvements, income from state and local bond issues is
generally exempt from federal income tax. This is meant to make
it easier for state and local governments to attract investors in
their infrastructure projects.
Borrowing becomes problematic, however, when
governments use it to balance their current budgets. For
example, Arizona’s legislature recently sold a variety of state-
owned buildings to private investors—and then promptly leased
many of the same properties back from their new owners for a
long period. The result—a short-term infusion of funds followed
by a much larger long-term stream of state spending—was
proudly described by one of its legislative advocates as the
equivalent of “taking out a mortgage.” 7 In the very short run,
lawmakers are able to balance their budget—but even a year
later, this “solution” ends up making budget deficits even worse.
A variant on the same approach is leasing out state
infrastructure in a way that is designed to outsource the provision
of the infrastructure to private companies. The most notorious
example of this strategy is in Indiana, where the state government
recently leased a highway to a private consortium. In exchange
for a short-term infusion of cash valued at nearly $4 billion, the
consortium is allowed to maintain (and charge drivers for use
of ) the highway for the next 75 years. While this approach is
more ideologically motivated than conventional bonding (since
it places state resources in the hands of private entities), its
impact on state finances can be broadly similar, and it is, after all,
designed to pay for capital improvements that will benefit future
generations. The main concern with this approach is that it can
be difficult to ensure that state and local governments get a good
deal out of these exchanges. The consortium running Indiana’s
toll road may realize long-term profits far exceeding the short-
term benefit to Indiana government.
conclusionWhen policymakers perceive (correctly or otherwise) that their
constituents have anti-tax views, they often reach for revenue-
raising strategies that help balance budgets in the short run but
do long-term harm. Inappropriate bonding practices amount to
an indirect tax increase on future generations, while gambling
revenues and user fees too often shift the cost of funding public
investments onto the backs of the low-income families who are
already hit hardest by regressive state and local taxes. By contrast,
minor revenue sources such as estate and inheritance taxes can
be a vital backstop to the main taxes levied by states, and should
be preserved.
1 State and Local Government Finance Data.” U.S. Census Bureau. http://www.census.gov/govs/www/financegen.html 2 Who Pays? A Distributional Analysis of the Tax Systems in All 50 States.” Institute on Taxation and Economic Policy, November 2009. http://www.itepnet.org/whopays3.pdf3 Kennickell, Arthur B. “Ponds and Streams: Wealth and Income in the US 1989-2007.” Finance and Economics Discussion Series 2009-13, Washington DC: Board of Governors of the Federal Reserve System, January 7, 2009. http://www.federalreserve.gov/pubs/feds/2009/200913/200913pap.pdf4 “Congress About to Give Away the Farm: Even Worries about the Deficit Don’t Stop Lawmakers from Helping the Uber-Rich.” Citizens for Tax Justice, September 2010. http://ctj.org/pdf/etfarms2010.pdf5 For more information see: McNichol, Elizabeth, “State Taxes On Inherited Wealth Remain Common : 21 States Levy An Estate or Inheritance Tax.” Center on Budget and Policy Priorities, May 20, 2010. http://www.cbpp.org/cms/index.cfm?fa=view&id=3376 “State-by-State Estate Tax Figures: Number of Deaths Resulting in Estate Tax Liability Continues to Drop.” Citizens for Tax Justice, October 2010. http://www.ctj.org/pdf/estatetax2010.pdf7 Eaton, Leslie, “Pinched States Wrestle With More Cuts.” The Wall Street Journal, July 30, 2009. http://online.wsj.com/article/SB124891089628491887.html
57Eight: Taxes and economic developmenT
ChAPtER EightTaxes and economic
developmenT
assessing claims that Taxes affect state economiesWhen state policymakers discuss proposed tax increases, the
debate inevitably turns to the impact of these proposals on the
state’s business climate. Business lobbyists usually argue that
tax increases will hurt a state’s business climate and drive away
industries and jobs. And if tax increases aren’t on a state’s agenda,
the same lobbyists will push for special tax breaks to encourage
new business investment—or to prevent a company from
leaving the state—and will tell apocalyptic tales about what will
happen if these business demands are not met.
But there is little hard evidence to support the assertions
of those who see tax cuts as a panacea for a state’s economy.
A comprehensive survey of the literature on the relationship
between taxes and economic development by economist
Robert Lynch found little evidence that state and local taxes are
important factors in determining business location decisions or in
affecting state economic growth.1
Lynch’s survey suggests that there is a wide variation in the
quality of the “research” used to support these anti-tax arguments,
and suggests that the studies that do claim a strong relationship
between tax levels and economic growth usually have design
flaws that invalidate their conclusions. Here’s a quick review of
some important questions to ask in evaluating these studies:
n does the study assume that tax changes have no effect on public spending? One of the most frequent
errors made by these studies is to simply ignore the linkage
between taxes and public spending. This is equivalent to
saying that when taxes are hiked, the resulting revenues
will simply be thrown away rather than being used to fund
education and other public services—and that when taxes
are cut, there will be no reduction in the state’s ability to
fund these services. In the real world, of course, tax cuts
must be paid for—and that usually means spending cuts.
In contrast, when taxes are increased, the new revenue
is used to preserve state services that are important to
residents, as well as businesses and the economy.
Studies that ignore this basic linkage and look only at
the impact of tax cuts are merely stating the obvious: state
economies would be stronger if they could maintain the
current package of public services while paying less for them.
In the best of all possible worlds, state and local governments
would provide all of our public services for free. Of course,
that’s unrealistic—but that’s the implication of studies that
don’t factor in the impact of tax cuts on public services.
n does the study measure the impact of any other possible explanations for economic growth? There are
many plausible explanations for the difference between
One of the main concerns of state policymakers is how to lure jobs to their state—and too often, policymakers assume that tax cuts make the best bait. It’s not hard to understand why they might believe this: tax-cut advocates frequently assert that cutting tax rates will spur economic growth by attracting more jobs and employers to the state, and businesses are constantly threatening to relocate to
other jurisdictions if state governments won’t pony up lavish tax breaks. But there is growing evidence that tax cuts and incentives are not an effective growth strategy for states—and that investing in public infrastructure such as schools, roads and hospitals can be a better approach to encouraging economic development. This chapter discusses the relationship between state fiscal policies and a state’s economic climate.
58 thE itEP guidE to Fair sTaTe and local Taxes58
fast-growing and slow-growing state economies. These
differences could result from tax law changes, government
spending behavior, regional and national economic changes,
demographic changes, or even the weather. The simplest
“studies” often measure the linkage between only one
explanation—tax levels—and an economic outcome. But if
the study doesn’t at least try to test for the impact of these
other factors, its findings shouldn’t be taken seriously.
n does the study measure tax levels correctly? Anti-tax
advocates frequently resort to manipulating data in arcane
ways to back up their assertions. For example, some studies
use the “per capita” measure of tax levels—that is, the total
amount of taxes collected in a state divided by the state’s
population—to identify high-tax states. The problem with
this is that “per capita” tax measures tell us more about how
rich a state is than how high its taxes are.
For example, in 2007 Virginia collected $1,330 per capita
in personal income tax, while Wisconsin collected $1,131. Yet
the Virginia income tax has lower tax rates than Wisconsin’s
income tax. Virtually anyone moving from Wisconsin to
Virginia (and keeping the same salary) would, in fact, see their
income taxes go down. Simply put, tax collections are higher
overall because Virginia has more wealthy taxpayers, not
higher taxes. This approach to measuring tax levels is simply
misleading—but anti-tax advocates rely on it simply because
the average taxpayer won’t know the inherent flaws in per
capita measures.
Other data manipulation tricks to watch for include:
n Making assertions about how total taxes affect growth—but
backing these assertions up using only state tax data.
State tax hikes are often enacted to reduce local taxes, so
it is important to use combined state and local tax data in
evaluating these assertions.
n Using legal or nominal tax rates as a measure of true tax
levels. This trick is frequently used in states that combine high
income tax rates with generous deductions, exemptions and
other tax breaks. Effective tax rates—that is, taxes as a share
of income— are a far more accurate approach to measuring
tax levels.
n Using aggregate tax collection data to measure state tax
levels instead of measuring the incidence of these taxes
on state residents. Aggregate measures based on total tax
collections tell us little about whether specific groups of
taxpayers experience the state as a high-tax or low-tax place
to live. Some nominally “high-tax” states rely heavily on taxes
paid by large multi-state businesses or non-residents, which
may not apply to state residents.
n Not factoring in the deductibility of state and local income
and property taxes when comparing tax levels across states.
The ability to write off these taxes means that the difference
in tax levels between “high tax” and “low tax” states is never
as large as it may seem. For the wealthiest taxpayers (and for
profitable corporations), up to 35 percent of the difference
between any two states’ tax levels will disappear once federal
deductibility is taken into account.
Much of the research that is commonly cited by anti-tax
advocates is based on research methods that are dubious at
best—and the tricks outlined above tend to get recycled in
different states by anti-tax lobbyists and researchers. So whenever
lawmakers or the media are presented with a study purporting to
show that high taxes hurt economic development, it’s a good idea
to ask these basic questions about the design of the studies.
low-Tax strategies aren’t effectiveSo why is it that there’s no observable relationship between
tax levels and economic growth? One sensible reason is that
taxes are levied for a very important purpose: to help fund the
public services that make a state more attractive to businesses.
Good roads and bridges, a well-educated workforce and other
government services are essential to business productivity and
profitability. And on the other side of the coin, low taxes generally
lead to low-quality public services. Moreover, compared to
other costs of doing business, state and local taxes are rather
insignificant: Lynch’s 2004 survey estimated that the state and
local taxes paid by businesses represented just 0.8 percent of
the costs they face. Usually the decision on where to locate is
based on more important economic factors than taxes, such as
proximity to suppliers and markets, and the availability of skilled
workers. That’s why heads of major corporations will candidly
admit that taxes are not very important in their location decisions.
As Paul O’Neill, a former executive at Alcoa and President
George W. Bush’s Treasury Secretary put it: “I never made an
investment decision based on the tax code...If you are giving
money away I will take it. If you want to give me inducements
for something I am going to do anyway, I will take it. But good
business people do not do things because of inducements. ”2
Other corporate leaders have echoed these thoughts.
Oklahoma billionaire George Kaiser recently testified to the ineffec-
tiveness of tax incentives in that state by noting that “the tax rebates
59Eight: Taxes and economic developmenT
we are considering cause almost no wells to be drilled in Oklahoma
that would not otherwise be drilled. As an oil and gas producer my-
self... I can say unequivocally that the rebates in this legislation have
never influenced our decision to drill or rework or restore any well
in this state or the many other states in which we operate. And the
reason isn’t that we do not understand the benefit from the rebate;
we are happy to file for and receive the gift, and we do.”3
Similarly, long-time business leader Michael Bloomberg has
bluntly said that “any company that makes a decision as to where
they are going to be based on the tax rate is a company that won’t
be around very long. If you’re down to that incremental margin
you don’t have a business.” 4
The Corporation for Enterprise Development (CFED) has
issued a series of reports grading states on the characteristics that
are likely to attract high-wage, high-value-added industry—and
these reports’ findings echo the explanations of these corporate
leaders. Level of taxation has consistently been found to be of
little significance. The factors that businesses look for include the
quality of life in the community, a good supply of highly skilled
and educated men and women to fill demanding technical and
management positions, good roads and adequate transportation,
public safety, and the quality of health care.
When corporations raise the “business climate” issue, it’s
often just a ruse to try to keep their taxes low. For example,
research from New Jersey Policy Perspective and Good Jobs New
York found that Citigroup regularly plays New York, New Jersey,
Kentucky and Texas against each other by threatening to move
their operations from one state to another.5 The study found that
“Citigroup appears to have taken advantage of rivalry among
states, exploiting the ‘prisoners’ dilemma’ dynamic to mislead
one government that it is competing against another, when no
rival offers actually have been made.” Between 1989 and 2007,
Citigroup received nearly $286 million in state and local economic
development subsidies.
It’s also worth noting that the few businesses that might actually
be attracted by low taxes are likely to be low-paying industries with
little loyalty to the community and its long-term well-being.
Finally, it’s important to remember that tax breaks don’t buy
loyalty from companies. Many states and communities have
given huge tax breaks to large companies for years, only to have
the company shut down the local plant for reasons unrelated
to taxes. Massachusetts lawmakers enacted a special corporate
income tax break largely in response to threats from the Raytheon
Corporation that it would reduce its employment in the state
unless this break was enacted—and after they got their way, the
company cut thousands of Massachusetts jobs.
Types of Tax Breaks offeredThe types of tax breaks offered to companies under the guise of
economic development vary widely, but they can be categorized
into three groups:
n Broad changes in tax rates or apportionment rules. Some states choose to pursue general reductions in
corporate taxes, either by cutting the legal tax rate on all
The Millionaire Migration MythSome anti-tax advocates and lawmakers have recently
generated a lot of publicity by attacking state income tax increases targeted at high-income earners—so-called “millionaires’ taxes.” One of the most obviously false claims made about these types of tax increases is that they inevitably lead to a mass exodus of high-income earners from the states that enact them.
Claims of this sort overlook the fact that high-income earners, like all Americans, care about a lot more than their tax bill when deciding where to put down their roots, and whether or not to move. These claims also often overlook—or even distort— available empirical evidence.
In 2009 and 2010, for example, anti-tax groups in Maryland repeatedly referenced data from the Maryland Comptroller’s office indicating that the number of individuals with over a million dollars in income had recently declined. These groups enthusiastically cited this finding as evidence of a “millionaire migration.” A more careful analysis of the data by ITEP, however, showed that the decline was in fact a result of wealthy Marylanders seeing their incomes decline in the wake of the 2008-2010 recession.a
These same groups also pointed toward New Jersey as an example of a state where an income tax increase caused high-income individuals to flee the state. In order to make this claim, anti-tax groups were forced to ignore a contrary study from Princeton University, and to instead distort the findings of a study out of Boston College with no real relevance to Maryland’s situation.b
Ultimately, the erroneous claims by anti-taxers in Maryland played a key role in the state’s decision not to extend the temporary income tax increase on Maryland’s millionaires. Other states debating the creation or continuation of a “millionaires’ tax” should expect to confront similar, misleading arguments.
[a]“Where Have All of Maryland’s Millionaires Gone?” Institute on Taxation and Economic Policy, May 2009. http://www.itepnet.org/pdf/MD_Millionaires.pdf
[b] “Maryland’s Millionaire Migration Debate: Understanding the Relevance of the New Jersey Migration Studies.” Institute on Taxation and Economic Policy, March 2010. http://www.itepnet.org/pdf/md_migrationstudies_0310.pdf
60 thE itEP guidE to Fair sTaTe and local Taxes60
corporations or by providing special apportionment rules,
such as the “single sales factor,” that will provide benefits to
large groups of companies (although, as noted in Chapter Six,
such rules may create as many losers as they create winners).
n abatements, credits, exemptions, and TiFs. States
also offer tax breaks that apply to specific companies, or
companies doing business in a specific area. One example
of this approach is tax increment financing or TIF.6 TIF
districts are usually established in areas that are considered
to be blighted. When property values rise because of
development in a TIF district, a portion of the property
taxes generated are set aside from their normal use
(usually funding schools) and instead are used to improve
infrastructure used by businesses in the district. TIFs deserve
greater scrutiny because many of the areas designated as TIF
districts aren’t actually blighted, and because studies have
shown that development in many of these areas would
likely have happened even without the use of TIF’s.7
n Tax packages offered by states to lure investment. States and local governments often put together entire
packages of tax subsidies including a mix of exemptions
and credits designed to reduced taxes. For example, North
Carolina gave away almost $300 million in tax incentives
to Dell in 2004 to lure it to build a manufacturing plant in
the state while the closest competitor state offered only
$30 million. The company promised to invest at least
$100 million in the plant and create at least 1,500 jobs by
2010. But instead, after only four years in operation, Dell
announced plans to shut its North Carolina plant in 2010.
While most of the incentives were never paid out to Dell,
the company left more than 900 people in an economically
distressed area without work and its actions raise doubts
about the role of tax incentives to spur economic
development. Incentive packages of this kind too often
result in bidding wars between the states— and these
costly and ambitious tax breaks bring no guarantees that a
company will remain in the state over the long term.
ensuring accountability in economic development Even if there is little evidence that tax policy affects economic
growth, state lawmakers continue to pursue potentially
damaging tax breaks in an effort to spur economic growth
in their state. How can lawmakers limit the damage of these
tax breaks and ensure that companies receiving these breaks
won’t take them to the cleaners? The Washington-based
nonprofit watchdog group Good Jobs First focuses on issues
of economic development accountability, and has
recommended a variety of best practices for lawmakers
enacting tax breaks, including:
n disclosure of how much tax breaks cost state and local
governments and what public benefits resulted from the tax
breaks. For example, lawmakers and the public should be
able to determine how many jobs were created as a result
of the tax breaks and whether the jobs created are “good
jobs” in terms of the wages and benefits provided. This
information should be made publicly available online and
frequently updated. For example, according to Good Job
First’s The State of State Disclosure report, Iowa’s Department
of Economic Development releases annual disclosure reports
on a variety of state business development programs that
detail the number of jobs produced and the wages paid. The
reports are searchable and available online. 8
n strict job quality standards should be applied to any tax
break designed to increase in-state employment. Requiring
these new jobs to provide a basic “living wage” along with
health care benefits helps to avoid imposing hidden taxpayer
costs on state government. If a tax break results in a company
hiring employees who are paid so little that they qualify for
food stamps, Medicaid, or other taxpayer-funded safety nets,
the cost of the tax break may exceed its benefits to the state.
For example, in Montana companies receiving federal Work-
force Investment Act training monies must pay wages and
benefits of at least 110 percent of the state’s median wage.
n money-back guarantees that companies receiving tax
breaks to create new jobs will actually create these jobs—
and that the jobs will remain in the state for some specified
period of time. These guarantees, known as “clawbacks,” are
now used in at least twenty states to ensure that lawmakers
get enough “bang for the buck” for the tax breaks they
offer. For example, Minnesota’s clawback statute states that
if a company receiving benefits doesn’t fulfill the subsidy’s
requirements, the company is banned from getting more aid
for five years or until they have repaid the subsidy amount.
n location-efficient incentives should encourage
economic development in areas that are accessible to
public transportation. This creates more opportunity for
low-income families who cannot afford cars, and reduces
traffic congestion.
n automatic review of giveaways should be mandatory.
Corporate tax breaks are often given without regard for
61Eight: Taxes and economic developmenT
how long the tax break will remain on the books. Regularly
reviewing tax breaks is essential to ensuring that subsidies
that aren’t working are removed from state law. For
example, a 2006 Washington State law requires regular
review of tax preferences with the goal of evaluating their
effectiveness and making reform recommendations to the
state legislature. 9
n establishing an economic development policy that
outlines goals, objectives, and strategies for state economic
development is one way to ensure that reasonable and re-
sponsible questions about tax incentive packages are asked.
A coherent policy can ensure that each decision on tax in-
centives will be analyzed in terms of how the incentive pack-
age helps to achieve larger economic development goals.
Businesses are a vital partner in Tax Fairness efforts Business owners and fair tax advocates fully understand the
importance of a healthy economic climate for jobs and incomes.
Good roads and bridges, a well-educated workforce and other
government services are essential to both business productivity
and community prosperity. There is a clear linkage between
taxes and a state’s ability to provide important public services.
Governments must have the resources to provide the education,
the roads, the sewer systems and other services that allow
businesses to prosper.
Unless those with the most ability to pay contribute their
fair share, it will be virtually impossible for governments to
provide essential programs. Precisely for this reason, not all
corporations fight against progressive tax changes. Especially
in states with low taxes, businesses may support progressive tax
increases in order to improve the quality of government services.
When Virginia lawmakers passed a billion-dollar tax hike in 2004,
for example, it was with the blessing of the state Chamber of
Commerce. In 2005 many Colorado business owners came out
in favor of a five year time-out from a restrictive spending cap
called TABOR (the Taxpayers Bill of Rights) because of the horrific
impact that state spending caps had on the state’s schools,
infrastructure, and even businesses’ own ability to function.
There are some sectors of the business community that
favor progressive tax reform. Often the organized business
lobby is dominated by a few large corporations that may
have very different interests than do small- and medium-sized
businesses. Small businesses typically are left holding the bag
when larger multi-state corporations carve out special tax breaks
for themselves, and for this reason small businesses can be an
essential partner to progressive coalitions seeking to achieve tax
reform. The importance of working in coalition with businesses
is discussed more in Chapter Ten.
conclusionImproving living and working conditions for residents
and businesses is among the most basic tasks facing state
policymakers. But all too often, the simple economic
development recommendations made by anti-tax advocates
can actively work against these goals by starving the ability of
state governments to adequately fund needed infrastructure,
and when these advocates present “research” purporting
to prove that low taxes encourage economic growth, it’s
important to ask the basic research design questions outlined
in this chapter. When policymakers do decide to provide
targeted tax incentives to businesses, it’s imperative that the
breaks come with sufficient strings to rein in companies who
aren’t hiring well-paid workers or fulfilling the requirements
for receiving special treatment. After all, business owners and
nonbusiness owners alike thrive when communities prosper
and government is able to provide adequate infrastructure and
a healthy, educated workforce.
1 Lynch, Robert G., Rethinking Growth Strategies: How State and Local Taxes Affect Economic Development. Washington, DC: Economic Policy Institute, March 2004.2 O’Neill, Paul. Statement to the U.S. Senate Finance Committee. Confirmation of the US Treasury Secretary, Hearing, January 17, 2001. 3 Kaiser, George. Statement to Oklahoma’s House Appropriations and Budget Committee. Oil and Gas Tax Rebates, Hearing, January 22, 2009. http://www.gkff.org/userfiles/file/1_22_09%20Oklahoma%20oil%20and%20gas%20rebate%20hearing.pdf4 Tierney, John, “The Big City; An Outsider Comes Inside to Run Things.” The New York Times, November 8, 2001. http://www.nytimes.com/2001/11/08/nyregion/the-big-city-an-outsider-comes-inside-to-run-things.html?ref=michael_r_bloomberg5 Stecker, Sarah and Dan Steinman, “Pay or We (Might) Go: How Citigroup Games the State and Cities.” New Jersey Policy Perspective and Good Jobs New York, June 2007. http://www.njpp.org/rpt_games.html6 For more on tax increment financing, visit Good Jobs First at www.goodjobsfirst.org7 Dye, Richard and David Merriman, “Tax Increment Financing: A Tool for Local Economic Development.” Land Lines: Vol. 18, Number 1. The Lincoln Land Institute, January 2006.8 See Mattera, Phillip, Karla Walter, Julie Farb Bain and Michelle Lee, “The State of State Disclosure: An Evaluation of Online Public Information About Economic Development Subsidies, Procurement Contracts and Lobbying Activities.” Good Jobs First, November 2007. http://www.goodjobsfirst.org/news/article.cfm?id=375 and The Iowa Department of Economic Development’s Legal and Compliance Project Portfolio- Searchable database: http://www.iowalifechanging.com/AnnualReport/2009/asp/search.aspx 9 Washington State House of Representatives, Final Bill Report EHB 1069, http://www.leg.wa.gov/pub/billinfo/2005-06/Pdf/Bill%20Reports/House%20Final/1069.FBR.pdf
62 The ITeP GuIde To Fair State and LocaL taxeS62
tax expenditure reportsLawmakers often provide targeted tax cuts to particular groups
of individuals or businesses. These special tax breaks are called
“tax expenditures” because they are essentially government
spending programs that happen to be administered through
the tax code. However, tax expenditures are usually less visible
than other types of public spending—which makes it harder
for policymakers and the public to evaluate these hidden tax
breaks.
The main difference between tax expenditures and regular
government spending is that under the tax expenditure
approach, instead of the government sending out a check
to the recipient, the recipient pays less in tax. For example,
a government could create a direct spending program to
subsidize windmill construction. Or, instead, it could offer
a tax expenditure that lets companies building windmills
reduce their taxes by exactly the same amount. In theory, it
doesn’t matter whether a government uses direct spending or
a tax expenditure to achieve a policy goal. In either case, the
windmill subsidy program will (in theory) have to compete with
other government spending priorities when the government
makes its budget decision.
In practice, however, tax expenditures differ from direct
spending in several important ways:
■ Unlike most spending programs, tax expenditures
are usually open-ended; they have no built-in budget
limits, and generally there is no annual appropriations
or oversight process. Anyone who meets the statutory
criteria for eligibility can get the subsidy.
■ Direct spending usually requires a government agency to
weigh the worthiness of an application from any potential
beneficiary. In contrast, most tax expenditures require no
action other than the filing of a tax return—which means
that the benefits of these tax breaks may inadvertently
be extended to beneficiaries who might otherwise be
deemed unworthy or ineligible.
■ Tax agencies typically have little incentive to ensure that
tax-expenditure programs are working as they were hoped
to. By contrast, government agencies tend to look closely
at the effectiveness of their direct spending initiatives.
■ Basic facts about who benefits from tax expenditures are
often hidden behind the cloak of tax return secrecy, unlike
the beneficiaries of conventional spending programs who
are usually easy to identify.
As a result of these flaws, tax expenditures often turn out
to be very expensive programs for which there is little oversight
and review. Once a tax expenditure is put into the law, it usually
stays there indefinitely. And typically little is known about what
the government is getting—if anything—for its money.
In most states, lawmakers don’t know how much is being
spent on tax expenditures. Of course, tax collections are lower
than they otherwise would be. But how much lower is a mystery.
Tax reform is not just about making taxes fairer and more sustainable. It’s also about making procedural improvements in the way policymakers evaluate their tax system. Lawmakers around the nation have enacted procedural changes in the way tax breaks and proposed tax changes are reported and evaluated, as well as rules governing the way taxes are
collected and rebated. This chapter looks at several such efforts and discusses their impact on the quality of state and local tax systems.
ChAPTeR NINeother StepS toward (or away From) Fair taxeS
63NINe: other StepS toward (or away From) Fair taxeS
In recognition of this problem, many states (and the
federal government) now publish tax expenditure reports.
These are simply a listing of tax breaks and how much they
cost. In recent years a growing number of state governments
have followed the federal government’s lead by publishing
tax expenditure reports of variable quality. The best reports
include the following:
■ A complete list of all exemptions from taxes (and tax
credits) levied by a state. This means looking not just at
the income and sales tax base but at smaller taxes as well.
It also means identifying exemptions that are not explicitly
written into the tax code. For example, most states
exempt personal services (such as haircuts and car repairs)
from their sales tax unless they are specifically taxed. These
implicit exemptions cost states hundreds of millions of
dollars annually— but are usually not visible in the tax
code. A good tax expenditure report will identify all such
implicit exemptions.
■ estimates of the annual state and local revenue loss
from each tax expenditure, including estimates of how
much the tax break has cost in recent years and how much
it is projected to cost in the future. The impact (if any) on
local tax revenues should be estimated as well.
■ Many state tax expenditures are inherited indirectly by
state linkage to federal tax codes. Separately itemizing these indirect federal tax breaks will give policymakers
a clearer understanding of the extent to which the federal
linkage reduces state revenues.
■ A written evaluation of the effectiveness of each tax expenditure will help policymakers to understand why
each tax break was enacted—and how well it achieves its
stated goals.
■ A regular publishing schedule that coincides with
the state budgeting process. State policymakers should
be able to evaluate tax expenditures side-by-side with
conventional spending— and this requires, good, current
estimates of how much each tax break costs. For example,
tax expenditure reports that are published every five or ten
years are likely to be insufficient as a source for updated
cost estimates.
The important insight provided by the tax expenditure
concept is that a law that lowers a citizen’s tax liability has no
different effect than a law that requires a direct payment to the
citizen. And if a tax break is designed to accomplish a public
policy goal other than the equitable collection of tax revenues,
then it should be evaluated according to the standards by
which we evaluate spending laws, not the standards by which
we evaluate tax laws.
tax incidence analysisTax fairness is an important policy goal—and lawmakers
frequently make bold claims about the impact of tax reform
proposals on tax fairness. However, most states do not
currently have the analytical capability to evaluate these
claims—so the media, the public and even lawmakers are
often left in the dark about the true impact of tax reform
proposals. The best tool for evaluating the fairness of state
taxes is tax incidence analysis, which measures the impact of
various taxes on residents at different income levels. Only three
states—Maine, Minnesota, and Texas—have legal requirements
mandating the regular use of tax incidence analyses, although
other states are currently developing a limited tax incidence
analyses capability.
By developing a regularly-used tax incidence model
capable of evaluating all of the major taxes levied at the state
and local level, state lawmakers can increase the public’s
understanding of tax policy issues—and can help build public
trust in elected officials. But until a regular tax incidence
analysis capability is introduced, policymakers and the public
will have no easily available basis for evaluating the fairness of
important tax policy decisions. This increases the likelihood
that lawmakers will be persuaded by false claims about the
fairness of various proposals—and also makes it less likely that
tax fairness will be a factor in tax policy decisions.
The Institute on Taxation and Economic Policy (ITEP)
maintains a sophisticated microsimulation tax model that
provides policymakers and advocates with incidence analysis.
ITEP’s analyses usually divide the population into five groups
based on income—ranging from the poorest 20 percent to the
richest 20 percent. Each of these groups is called an “income
quintile.” (“Quintile” simply means one fifth, or 20 percent, of the
population.)
The ITEP Model is capable of estimating the impact,
both on tax fairness and on overall tax revenues, of virtually
any change to the major taxes relied upon by state and local
governments. ITEP maintains an up-to-date database of all
state and local tax laws. Each year ITEP works with lawmakers
and nonprofit groups in over 40 states to help them evaluate
the impact of regressive tax plans—and to help them develop
their own progressive tax reform plans.
63
The ITeP GuIde To Fair State and LocaL taxeS64
ITEP’s analyses also split the very richest 20 percent into
three subgroups: the lowest-income 15 percent of the quintile,
the next 4 percent and the richest one percent. This is done
because families in the top 20 percent have more than half of
all personal income in most states. Within this quintile, there
are substantial differences in income levels and tax levels
between the “poorest” members and the richest members.
Incomes in this group range from what might be called upper-
middle class, to the richest families in the country.
These analyses have been instrumental in recent state tax
policy debates. For example, when residents of Washington
State recently evaluated a ballot measure that would have
enacted a limited personal income tax, applicable only to
upper-income families, ITEP’s analysis of the plan’s fairness and
revenue yield was the most widely cited analysis of the plan’s
effects, and helped to galvanize progressive support for the
plan. And in Missouri, state lawmakers came perilously close
to enacting a so-called “Fair Tax” in 2010—a tax plan that would
replace the state’s income and corporate taxes with a sales
tax on virtually everything consumers buy—despite having
little concrete information about how the plan would affect
tax fairness or even what the required “Fair Tax” rate would be.
ITEP’s analysis of these questions clarified the public debate
over the plan, and helped to ensure that lawmakers had
accurate information on the plan’s impact at their fingertips
when they voted on this issue. Astonishingly, in each of these
cases, if ITEP had not conducted these pro bono analyses, there
simply would not have been any such information available to
policymakers and the public to help them evaluate these plans.
rainy day FundsIn the long run, states with progressive personal income
taxes will enjoy the most reliable growth in tax revenues.
But the recent decline of income taxes in many states has
left policymakers jittery about the role of the tax in funding
services. Some lawmakers have advocated making allegedly
volatile income taxes less progressive to help ensure the long-
term adequacy of state
revenues. But this is
misguided policy.
The real culprit in
states suffering from
income-tax shortfalls
in recent years is the
unwillingness of states
to save sufficient
revenue in good years in order to shore up revenues in lean
years. Almost all states now have some form of “rainy day Fund” designed to achieve this—but the recent economic
slowdown has exposed the design flaws of many states’ funds.
The box on this page shows some of the most important
factors differentiating effective and ineffective rainy day funds.
Important questions to ask about your state’s rainy fund
include:
■ Under what circumstances must lawmakers deposit
revenues into the fund? Requiring annual deposits when
revenue growth exceeds a certain threshold is a good
approach.
■ Is there a limit on the size of the fund? Many states limit
their rainy day fund to five percent of annual expenditures
or less—a figure that most now agree is too low.
■ How hard is it to withdraw funds? Excessive constraints on
withdrawals make the rainy day fund less flexible as a fiscal
policy tool.
■ How quickly must the fund be replenished after a
withdrawal? The faster the replenishment rule, the less
flexible rainy day funds are in dealing with fiscal shortfalls.
Rainy day funds are a necessary component of a
responsible state budget for a simple reason: taxes and public
spending operate on different cycles. When the economy
slows down, tax revenues slow down too. Declining income
means declining income taxes and declining sales taxes as
families make fewer purchases. But the need for important
public services such as education and transportation does
not diminish when the economy declines: declining income
actually increases the need for many areas of public spending,
such as health care, education, and disability services. Rainy
day funds are an important way of allowing states to match
up taxes and spending needs over the business cycle. Almost
every state has recognized this reality by enacting a rainy day
fund—but few states have created a fund that is truly adequate
to bridge fiscal shortfalls.
tax and expenditure Limits (teLs)A growing number of states are considering proposals to limit
revenue growth by placing strict limits on the annual growth
of state or local tax revenues or spending. These limits are
collectively known as tax and expenditure limits, or teLs.
TELs take many forms and no two are entirely alike. They
include limits on revenue or spending increases tied to some
important Features of rainy day Funds
ü Rules for deposit
ü Size limits
ü Rules for withdrawals
ü Rules for replenishing funds
65NINe: other StepS toward (or away From) Fair taxeS
type of index such as population, inflation, or personal income.
A few states tie their appropriations to their revenue forecast.
More than half the states have some type of TEL in place.1 In the
majority of states that have TELs the spending or revenue limit
is embedded in the state’s constitution, which makes it difficult
to lift these restrictive limits. TELs remove decision-making
authority from elected officials, frequently forcing damaging
automatic cuts in tax revenue and public infrastructure when
both are vitally needed.
One of the most controversial TELs is Colorado’s Taxpayer
Bill of Rights (TABOR). Colorado’s TABOR limits the annual
growth in state revenues to the sum of inflation and population
growth. So if Colorado’s population grows by 1 percent
and inflation grows by 2 percent in a given year, Colorado
government revenues are allowed to grow by no more than
3 percent in that year. “Surplus” revenues over that limit are
rebated directly to taxpayers.
So what’s wrong with a TABOR-style limit on state revenues
and spending?
■ When states collect revenue above the limit, this so-called
“surplus” must be rebated to taxpayers. This makes it
harder to replenish rainy day funds—which means that
when the economy tanks, these states have to enact
painful spending cuts to make ends meet.
■ Imposing a spending limit assumes that states are already
adequately funding public services. Few state lawmakers
would assert with a straight face that their public service
needs have all been met—but that’s one implication of
strictly capping the growth rate of a state’s spending.
■ Spending limits assume that the cost of providing existing
services will grow no faster than the limits allow. But many
state spending needs grow faster than population and
inflation, as any state lawmaker confronting skyrocketing
Medicaid enrollment and education expenses can
attest. And some public sector spending—spending on
corrections facilities, for instance—can grow faster than
spending limits for reasons that are beyond the control of
lawmakers.
■ Spending limits also assume that no new and
unanticipated spending needs will emerge. The
upcoming expansion of Medicaid, funded in part by
states, attests to the constantly changing mix of spending
priorities at the state level.
TABOR limits are often described by their proponents
as a good-government tool. But state bond rating agencies,
arguably the best arbiter of state fiscal health, reject this
argument. In 2002, Standard and Poor’s downgraded
Colorado’s bond rating, citing the TABOR spending limits as a
reason for this punishment. Moreover, there is evidence that
the TABOR limits had unintended consequences far beyond the
intentions of its supporters. The Bell Policy Center has shown
that under TABOR, health care fees increased, state investment
in higher education fell dramatically, and tuition for higher
education increased.2 In a victory for tax justice advocates, in
2005 Colorado voters approved a referendum designed to
temporarily suspend the TABOR revenue limit for five years.
Coloradans continue to debate whether TABOR should be
allowed to expire permanently.
Across the nation, state lawmakers are facing painful
choices between further spending cuts and unpopular tax
increases. TABOR-style spending caps restrict the ability of
lawmakers to make the bread-and-butter decisions about
government activities that should be their primary function,
forcing the elimination of needed public services at the very
time when they are most needed.
conclusionSome of the structural reforms outlined in this chapter can
have a positive impact on the ability of lawmakers to make
reasoned, fully informed decisions about tax fairness and
adequacy. Tax expenditure reports are an important tool to
help citizens evaluate targeted tax breaks that would otherwise
be hidden from public view. Tax incidence analysis makes
it possible to accurately judge the fairness of tax reform
proposals. And an adequate rainy day fund can allow states
to weather the storm of economic recessions without cutting
public services to the bone. But the arbitrary tax and spending
limits collectively known as TELs actually add a new layer of
complexity to the already difficult decision-making process
facing legislators, making it much harder for policy makers to
provide the services demanded by their constituents.
1 Waisanen, Bert, “Tax and Expenditure Limits 2008.” National Conference of State Legislatures. http://www.ncsl.org/Default.aspx?TabId=12633#typesoflimts
2 “Ten Years of TABOR.” The Bell Policy Center, 2003. http://bellpolicy.org/node/3440
66 The ITeP GuIde To Fair State and LocaL taxeS66
ChAPTeR Tenachieving tax reForm:
next StepS
Why tax reform is necessaryThe need for tax reform is now greater than ever. State and
local taxes in almost every state are regressive. And many of
the states that have managed to push through revenue-raising
measures to respond to recent budget deficits have done so
in a way that makes their tax systems even less fair—hiking
regressive sales and excise taxes much more frequently than
progressive income taxes. Meanwhile, as this report has
documented, the structural flaws that have reduced the yield
of these taxes remain unresolved:
■ State and local sales tax bases are too narrow: few states
have expanded their tax base to include services, the
fastest-growing area of consumption. And many states
have a host of poorly-targeted exemptions for the sales
of various goods that reduce the yield of each penny of
tax. Collectively, these tax breaks put added pressure on
lawmakers to increase the sales tax rate on the remaining
items of consumer spending.
■ Personal income taxes, ostensibly the most progressive
tax levied by states, are being eroded away—and made
less progressive—by a proliferation of poorly targeted
tax breaks for capital gains, retirement income and other
income sources. And many states use income tax brackets
that require a large percentage of taxpayers to pay at
the top rate, rather than subjecting only the wealthiest
taxpayers to the highest rates. These structural flaws mean
that most state income taxes are not living up to their
potential as a progressive offset for the regressive sales and
property taxes that states rely on most.
■ Corporate income taxes continue to decline, as federal
and state tax breaks and clever accounting tricks by the
corporations themselves make the tax base ever narrower.
■ Property taxes remain an important, but unfair revenue
source for state and local governments. Many states have
enacted overly restrictive tax limits designed to reduce the
use of these taxes, but relatively few have enacted well-
targeted exemptions or credits designed to reduce the
property tax on the low-income taxpayers for whom these
taxes are most burdensome. And many states have not yet
dealt with the inequities between low-wealth and higher-
wealth taxing districts that the local property tax usually
creates.
Events at the federal level have compounded these
inequities. With the political paralysis and the knee-jerk fear of
taxes so often found in Congress and state houses throughout
the country, the task of igniting tax reform falls on tax activists.
The key is showing the public, elected officials and the media
what fair tax policy is and how it can benefit people. We hope
this primer provides you with enough tax policy knowledge to
start that process.
Tax reform may seem like a daunting task. After all, successful tax reform can take years—and tax justice advocates often are too busy fending off the unfair “tax deform” strategies of anti-tax organizations and lawmakers to embark on their own constructive agendas. But the good news is that the road to a fairer tax system is clearly marked. This chapter looks at important strategies and information sources for progressive tax advocates seeking to follow this road.
67Ten: achieving tax reForm: next StepS
Strategies for tax reformThe first step in achieving tax reform is to understand what’s wrong with your state’s tax system. This report has
described in general language the structural flaws that plague
almost all states’ taxes—such as narrow sales tax bases and
corporate tax loopholes. But there is no substitute for a good
understanding of exactly which provisions of your state’s tax
laws prevent the state from achieving a fair and adequate tax
system. If your state doesn’t have a tax expenditure report (see
p. 62), a rainy day fund (see p. 64), or accountable economic
development strategies in place, these are good first goals to
put on a tax reform agenda because these tools will make the
shortcomings of your tax system more obvious.
Successful tax reform campaigns usually include organizations from many sectors of the community. Unions, religious groups, public interest organizations,
business groups and others should all be part of the campaign.
Certainly, with more groups, there will be more conflict
over the campaign’s goals and tactics. But without broad
participation, it is very difficult to overcome the power of
those who oppose reform. Depending on the coalition’s goals,
economic climate and political realities it may be important
for the coalition to come together and support one specific
tax reform plan. On the other hand, simply agreeing that new
revenues are necessary may be the best strategy.
If advocates decide to support a specific plan, they should
be specific about what their plan does and how it affects people. If the plan includes a vaguely stated proposal to raise
income taxes on the rich, tax reform opponents will claim that
by “rich” you mean anyone with a job. But if you make it clear
that (for example) your plan would raise the tax rate on those
with incomes over $200,000 by 1 percent in order to pay for a
tax cut for those earning under $50,000, and would result in a
tax cut for 60 percent of your state’s residents, you’ll have the
kind of clearly stated proposal that will be more difficult for the
other side to distort.
Coalition strategies and tactics will vary depending on
the politics in the states, but it is important to remember the vital role the media can play. Coalition members can
work with the media in a variety of ways including: writing op-
eds, encouraging letters to the editor, issuing press releases,
holding press conferences, and participating in editorial board
meetings. Coalition members may find it valuable to purchase
space in newspapers or websites and potentially produce
television or radio commercials. There is also value in utilizing
the Internet and building a website that utilizes social media
like Facebook and Twitter.
Political strategies for advocates should look for opportunities to engage policymakers and the general public. If a Tax Commission is meeting or a relevant legislative
hearing is taking place, coalition members may want to
testify at these events. Coalition members will likely want to
participate in individual meetings with legislators or key staff to
understand their views on tax reform.
In order to engage the general public, most coalitions
have an educational component too. Educational materials
should be presented in a simple and straightforward way.
Public workshops on tax reform can be a critical component in
building public awareness of—and support for—tax reform.
Unfortunately, tax reform plans can be smeared by scare
tactics. So it’s important to be prepared to respond to misleading arguments against your plan. For example,
opponents of tax reform frequently claim that raising taxes
on the wealthy or corporations will drive businesses away
from a state and cost jobs. Or they will falsely claim that tax
reform would increase taxes on middle-income families.
These arguments are usually based on conjecture rather than
research, and when there is “research” to back these claims
up, it is often poorly designed. (See Chapter Eight for more
on how to evaluate these anti-tax claims.) The goal of these
scare tactics is not to inform voters—it’s to make tax issues
seem harder to understand than they really are, and to create
confusion about what a reform proposal really does. So it’s
important to recognize and debunk specious arguments
against progressive tax reform.
For example, it’s important to remember that tax fairness
means asking people to pay according to their ability and that
incidence tables are the best measure of what is fair. Of course,
your opponents will try to undermine incidence analyses. They
might claim, for instance, that the top fifth of the population
pays some high percentage of the total taxes and that it
wouldn’t be “fair” to make them pay more. But this argument
is nothing but a smoke screen. What really matters is the share
of income paid in tax by taxpayers at different income levels—
and by this basic measure of fairness, the wealthiest residents
in most states pay substantially less than lower- and middle-
income taxpayers.
It may also be important to highlight the linkage between the taxes you want to reform and the public services that are provided by these taxes. If you ask most
68 The ITeP GuIde To Fair State and LocaL taxeS68
people whether they favor raising the state income tax, they’ll
probably say no. But if you ask people whether they favor
raising the income tax to help fund education or health care,
they will be much more supportive. Most people understand
intuitively that the public services they value can only be
provided if the tax system raises adequate revenues to pay for
them—so it’s important to remind people that the ultimate
purpose of tax reform is to ensure the continued provision of
these services.
When people work together, successful tax reform efforts
can be the result. For example, in recent years Oregon Center
for Public Policy and Kentuckians for the Commonwealth
each helped to build broad-based coalitions in their states.
These groups developed plans for tax reform, publicized
which income groups would see increases or cuts in taxes as
a result of their proposals, and worked with legislators and
the media to help the general public understand the basic
tax policy principles underlying their proposals. This ongoing
work helped to establish these groups as a credible source of
accurate information and made these coalitions a respected
voice in state tax policy debates. The work of these coalitions
also helped to increase the visibility of tax fairness issues in
both states.
resources for Further investigationThere are many sources of information on state taxes. A good
place to start is with the reports issued by itep and citizens for tax Justice (CTJ). ITEP analyzes the fairness of state and
local taxes in dozens of states annually. ITEP’s Who Pays?
report (2009) provides a baseline for measuring the fairness of
taxes in all fifty states. CTJ monitors the fairness of federal tax
reform proposals; CTJ’s analyses of the Bush tax cuts were the
most widely cited measuring stick for evaluating the unfairness
of these cuts. Just Taxes, our quarterly newsletter, and our
weekly Tax Justice Digest keeps readers informed on the
latest developments in tax policy and advocacy, and lists new
publications of note by CTJ, ITEP and other organizations (you
can sign up for the Tax Justice Digest at http://www.ctj.org/
digest_signup.php).
Taxing ServicesDespite near-universal agreement among economists on the wisdom of taxing personal services, multiple states have recently lost hard-fought battles to expand their sales tax bases in this manner. These failures raise some obvious questions about the politics involved in bringing this huge share of the economy within the reach of the sales tax.
In Maryland, an effort to tax about half-a-dozen personal services was gradually whittled down to include only one (computer services) as a result of intense efforts by business industry lobbyists. By focusing on such a small group of services, Maryland left itself vulnerable to charges that it was unfairly singling out specific businesses for new taxes (despite the fact that the consumers, not businesses, would be paying the taxes), and that dozens of other services not being considered were equally worthy of being taxed. Simply put, Maryland’s piecemeal approach to taxing services missed an opportunity to focus the debate on the principle of taxing all consumption equally. In doing so, this left the door open for the business lobby to claim (with no apparent sense of irony) that marginal improvements to Maryland’s already discriminatory sales tax would somehow worsen its unfairness. Ultimately, these flaws with Maryland’s approach proved to be fatal to the cause of services taxation, and even the tax on computer services was eventually repealed.
It appears that Maryland’s “baby steps” approach to modernizing its sales tax base was too incremental, and too vulnerable to the efforts of well-organized business lobbies. The taxation of personal services is an issue that must be addressed comprehensively, so that meaningful, principled support can be rallied to the cause. Of course, this approach does not guarantee success, but by addressing the issue more broadly, it has the potential to draw in enough stakeholders that the ability of narrow business interests to monopolize the debate can be curtailed.

69Ten: achieving tax reForm: next StepS
Other good sources for information on state taxes include:
■ State revenue and tax departments. Many states
publish reports that provide valuable information about
the state’s tax structure. Usually, the best place to start is
with your state tax agency’s annual report—but be sure
to check out a complete list of available publications. Tax
departments also often have a great deal of unpublished
information. If there’s something you need but can’t find
in an agency’s publications, give the agency a call and ask
for it. ITEP’s website features a state-by-state tax policy
hub which includes links to resources published by state
revenue and tax departments. Visit www.itepnet.org and
click on a state to access the policy hubs.
■ The U.S. census Bureau (www.census.gov/govs/)
publishes Government Finances, a helpful source of data
for comparing your state’s tax system to other states.
■ The center on Budget and policy priorities (www.
cbpp.org) publishes a wealth of information on tax and
spending programs as they affect low-income taxpayers.
■ The demos center for the public Sector (www.demos.
org) is an organization dedicated to helping people
understand the important role that government structures
play.
■ economic policy institute (www.epi.org) publishes
helpful reports that offer information on the relationship
between economic policy and working families.
■ good Jobs First (www.goodjobsfirst.org) is an excellent
resource for advocates interested in learning about
accountable development in their state.
■ The Lincoln institute of Land policy (www.lincolninst.
edu) maintains a comprehensive online database of
property tax features in all 50 states plus the District of
Columbia.
■ the national conference of State Legislatures (www.
ncsl.org) has a number of publications evaluating state
taxes, including their annual report State Budget and Tax
Actions.
■ The rockefeller institute (www.rockinst.org) regularly
analyzes trends in the health of state tax systems, and
follows trends in state spending as well.
■ State advocacy and research groups are an essential
component to any successful movement for tax fairness.
These groups can be found in most states. ITEP maintains
a list of these groups, organized by state, on our website.
■ networks of state groups. Many state groups stay
connected and function as part of a larger series of
networks. These networks include: the economic analysis and research network (www.earncentral.org),
the State Fiscal analysis initiative (www.statefiscal.org),
progressive States network (www.progressivestates.
org), and the tax Fairness organizing collaborative (www.faireconomy.org/tfoc). These networks partner with
state and local advocates and policymakers across the
country as well as national groups.


71Appendix i: Glossary
adjusted gross income (aGI). On a personal income
tax form, the amount of income that is subject to tax after
all adjustments have been taken, but before subtracting
deductions or exemptions. (Chapter 5)
adjustments. Income tax breaks that reduce the amount
of taxable income. For example, on federal income tax forms
moving expenses, some teaching supplies, and contributions
made to certain retirement plans are subtracted from income.
Most states allow the same adjustments that are allowed on
federal forms, and many allow their own unique adjustments.
These adjustments are often enacted with good intentions, but
tend to make the income tax more complicated than it needs
to be. (Chapter 5)
ad valorem tax. A tax based on the value of the thing being
taxed. Sales taxes are based on the sales price of items taxed, so
they are ad valorem taxes. Cigarette taxes are not ad valorem
taxes, because they are levied on a per-pack basis, so tax
collections do not vary with the price of a pack of cigarettes.
(Chapter 3)
apportionment formula. The formula states use to divide up
the profit of a multi-state corporation into an “in-state” portion
and an “out-of-state” portion. In theory, apportionment rules
should divide a corporation’s income between the states in
which it earns profits in such a way that all of its profit is taxed
exactly once, but special apportionment rules mean that some
profits are never taxed at all. (Chapter 6)
assessed Value. The official value of a property for tax
purposes, as determined by property tax officials. A property’s
assessed value can be equal to its market value, or less than
market value, depending on the legal assessment ratio used by
the state and the quality of assessments. (Chapter 4)
Benefits Principle. A principle of taxation in which taxes are
based on the benefits received from the public services funded
by the tax. (Chapter 2)
Bracket Creep. When income tax brackets are not adjusted
frequently to account for the impact of inflation, taxpayers
can see income tax hikes over time even if their real income
doesn’t grow. These inflationary tax hikes can affect any income
tax variable that is defined as a fixed dollar amount, including
exemptions and credits, and can also reduce the value of
property tax breaks. (Chapter 5)
Business Input sales. The sale of items purchased by
businesses to create their products. For example, a baker
purchases flour to make bread. The baker’s purchase of flour
is a business input sale. Retail sales taxes should not apply to
such sales—but most state sales taxes do so to some extent.
(Chapter 3)
Circuit Breakers. A targeted property tax credit. Typically,
states give homeowners a credit equal to the amount by which
their property tax exceeds a certain percentage of their income.
Most states target their circuit breakers to elderly homeowners,
but an increasing number of states use them to deliver tax
relief to non-elderly homeowners and renters. (Chapter 4)
Consumption Tax. A tax that applies to purchases of goods
and/or services by individuals and businesses. These taxes
include general sales taxes, which apply to retail sales, and
special excise taxes on alcohol, cigarettes, and gasoline.
(Chapter 3)
Credit. A dollar amount subtracted from tax liability. (By
contrast, deductions and exemptions are subtracted from
taxable income.) Tax credits are used primarily to reduce
income and property tax liability, but are occasionally used
to partially offset the regressivity of sales taxes. In general,
credits are a more progressive approach to tax relief than are
exemptions. (Chapters 3, 4, 5)
Deferral Program. A special rule that allows some
homeowners, usually the elderly, to delay paying their property
taxes for some period of time. Interest is often owed on the
deferred taxes, and the final payment is usually due when
either the homeowner dies or the property is sold. (Chapter 4)
Effective Tax rate. The tax paid as a share of the potentially
taxable base. For example, the effective income tax rate is the
income tax paid expressed as a share of total personal income.
(Chapter 2)
Appendix i: Glossary
72 The iTep Guide To FaIr sTaTE anD loCal TaxEs72
Elasticity. A measure of tax adequacy that describes whether
or a tax produces revenue growth faster or slower than the
economy. (Chapter 2)
Excise Tax. Sales taxes that apply to particular products. For
example, many states levy excise taxes on alcohol, cigarettes
and gasoline. Excise taxes are especially regressive because the
tax is levied on a per-unit basis (so the tax on a bottle of cheap
wine is the same as the tax on an expensive wine). (Chapter 3)
Exemptions. A special rule that provides a tax shelter for
some economic activity. Exemptions reduce the amount of
taxes owed. Income taxes usually allow exemptions for each
taxpayer, and property taxes often allow part of a home’s value
to be exempted from tax. Sales taxes frequently exempt all
sales of certain items such as food, utilities and rent. (Chapters
3, 4, 5)
Exported Tax. The amount of a tax paid by out-of-state
residents. Some part of almost every state tax is paid by
residents of other states. This helps ensure that non-resident
individuals and businesses that use a state’s services pay their
fair share of the cost of providing these services. (Chapter 2)
Federal offset. The ability to deduct certain state taxes on
federal income tax forms. For taxpayers this can result in state
taxes being offset by lower federal income taxes. (Chapter 2)
Graduated Tax. A graduated tax applies higher tax rates to
higher income levels. Most income taxes use graduated rate
structures. By contrast, a flat-rate tax applies the same rate to all
incomes. (Chapters 1, 5)
Gross receipts Tax (GrT). A tax on the total gross revenues
of a company, regardless of their source. A gross receipts tax
is similar to a sales tax, but it is levied on the seller of goods
or services rather than the consumer. Applies to the sales
made by companies at every stage of the production process,
including manufacturing companies, wholesalers, and retailers.
(Chapter 3)
Homestead Exemption. A tax break enjoyed by owner-
occupied homes in many states that shelters a portion of the
home’s value from tax. (Chapter 4)
Horizontal Equity. The measure of tax fairness that describes
how a tax system treats taxpayers in similar circumstances.
(Chapter 2).
Incidence analysis. A tool for measuring the fairness of state
and local taxes and tax changes. (Chapter 2)
Intangible Property. Property that has no physical substance,
but may have financial value. Examples of intangible property
include stocks, bonds, and retirement plans. (Chapter 4)
Marginal rate. Income tax rates that apply only to the taxable
income over the amount where the tax bracket starts. (Chapter
5)
Microsimulation Tax Model. A tool for calculating revenue
yield and incidence (current and proposed), by income group,
of federal, state and local taxes. The model starts with a sample
of income tax returns representative of the tax-filing population
of interest rather than aggregate data. (Chapter 9)
nexus. The minimum level of contact that a business must
have with a state in order for its activities to be taxable in that
state. (Chapter 6)
nominal tax rate. The legal rate that is multiplied by the tax
base to yield the amount of tax liability. (Chapter 2)
Progressive. A progressive tax is one in which upper-income
families pay more of their income in tax than do those with
lower incomes. (Chapter 1)
Proportional. A proportional tax is one in which all taxpayers
pay the same share of their income in tax. (Chapter 1)
Public law 86-272. A federal law restricting the ability of
states to tax the income of multi-state businesses under their
corporate income tax. PL 86-272 holds that states cannot tax
the income of businesses whose only connection to the state is
shipping products into it. (Chapter 6)
Pyramiding. Pyramiding occurs when an input is subject to
sales tax when purchased by a business and then, effectively,
a second time when the business passes the cost of the input
into the selling price of a good or service that is also subject to
sales tax.(Chapter 3)
73Appendix i: Glossary
rainy Day Fund. Term used to describe a reserved amount of
money to be used in times when regular income is disrupted
or decreased in order for typical operations to continue.
(Chapter 9)
regressive. A regressive tax requires low- and middle-income
families to pay more of their income in tax than wealthier
families must pay. (Chapter 1)
remote sales. Purchases of items from companies based in
other states. Every state with a sales tax also levies a use tax
designed to tax these remote sales. (Chapter 3)
retail sale. A sale made to the final consumer of a product.
When we buy a new refrigerator for personal use, that’s a
retail sale. By contrast, when a business buys lumber for use
in building a house, that’s not a retail sale but an intermediate
transaction, because the goods purchased are used in the
process of making something else. In theory, states should tax
all retail sales and exempt all intermediate transactions, but
almost all states fall short of both of these goals. (Chapter 3)
split roll. A property tax system that applies different tax
rates, or different assessment ratios, to different categories of
properties. Split roll systems often favor residential property
over commercial property. (Chapter 4)
stability. A measure of tax adequacy that describes whether
or not a tax grows at a predictable pace. (Chapter 2)
TaBor (Taxpayer Bill of rights). A constitutional
amendment that limits the annual growth in state revenues
and expenditures to the sum of the inflation rate and the
percentage change in the state’s population. (Chapter 9)
Tangible Property. Property that has physical substance and
can be touched. This includes real property such as homes and
apartments, and personal property such as cars and furniture.
(Chapter 4)
Tax Base. The amount subject to tax. If all the consumers in
a state purchase $1,000,000 in coffee each year, then the tax
base for a coffee sales tax would be $1,000,000. However, the
tax base does not have to be expressed in terms of money. If
coffee was taxed by the pound, then the tax base would be the
number of pounds of coffee sold. (Chapter 2)
Tax and Expenditure limits (TEls). Designed to curb
growth in government spending by placing constitutional or
statutory restrictions on the amount a government entity can
spend or tax its citizens. (Chapter 9)
Tax Expenditure. A special tax break targeted to particular
groups of individuals or businesses. These tax breaks have the
same impact as a direct government spending program giving
cash grants to these groups, but implementing them through
the tax system makes these grants less visible—and makes
lawmakers less accountable for explaining why these breaks are
a good idea. (Chapter 10)
Tax Incidence analysis. A measure of the impact of various
taxes on residents at different income levels. (Chapter 9)
Tax Increment Financing (TIF). A public financing
method which uses future gains in taxes to finance current
improvements. (Chapter 8)
Uniform Division of Income for Tax Purposes act (UDITPa). Model legislation adopted in the 1950s by legal
reformers seeking to achieve fairness and uniformity in state
corporate tax practices. Most states initially adopted at least
some of the UDITPA recommendations, but many have
moved away from UDITPA recommendations by changing
apportionment factors and other rules. (Chapter 6)
Use Tax. A sales tax which applies to goods that are purchased
from out-of-state retailers. (Chapter 3)
User Fee. A fee charged by government for a specific service
rendered to a specific taxpayer by the government. The
payment is usually made at the same time that the service is
rendered and the amount of the fee is usually related to the
cost of the good or service provided. (Chapter 7)
Vertical equity. The measure of tax fairness that describes
how a tax system treats people at different income levels. When
we describe a tax as regressive, proportional or progressive,
we’re making a statement about vertical equity. (Chapter 2)
Institute on Taxation and Economic Policy1616 P Street, NW, Suite 201, Washington, DC 20036 | 202-299-1066 | www.itepnet.org | [email protected]
The Guide ToFair State and Local Taxes