Embed Size (px)
Citation preview
Local Option Taxes: Promises and Limitations
Bo Zhao New England Public Policy Center Federal Reserve Bank of Boston Presented at Seminar on Critical Issues for the Fiscal Health of New England Cities and Towns April 8th, 2016
Disclaimer: The views expressed here are those of the presenter and do not necessarily represent the views of the Federal Reserve Bank of Boston or the Federal Reserve System.
Arguments for Local Option Taxes
Meet growing need for own-source revenue State aid cuts Property tax limitations
Reduce reliance on the property tax
Increase revenue diversity
Collect revenue from tourists and commuters

Fiscal Impact of Local Option Taxes
To what extent would local option taxes boost the revenue-raising capacity of municipalities?
What type of communities would benefit most from local option taxes?
Would adding local option taxes alleviate fiscal disparities across communities?
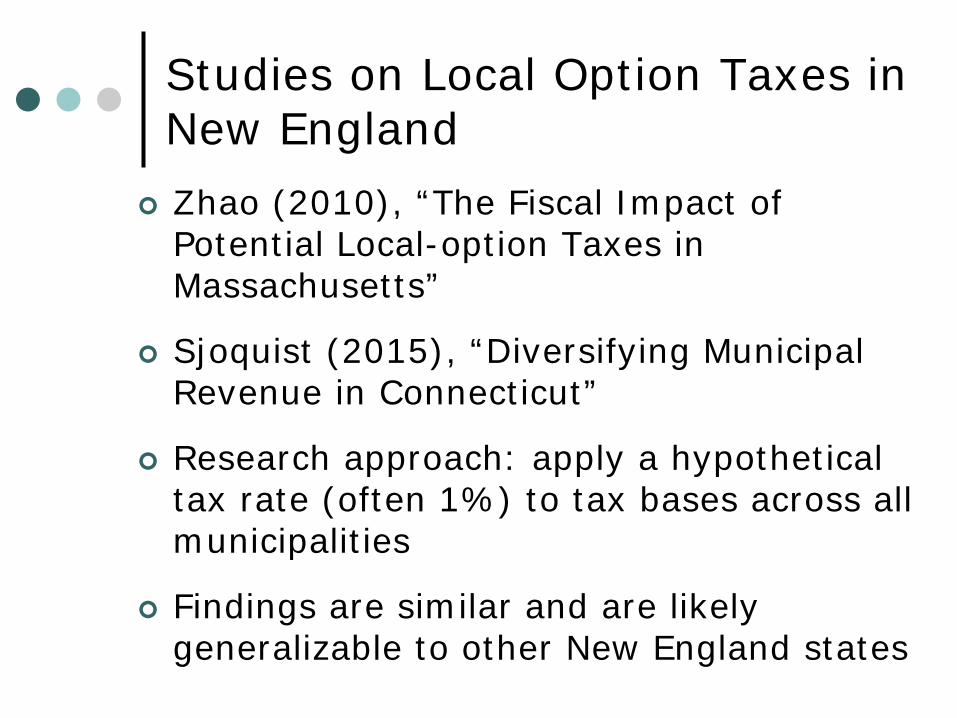
Studies on Local Option Taxes in New England
Zhao (2010), “The Fiscal Impact of Potential Local-option Taxes in Massachusetts”
Sjoquist (2015), “Diversifying Municipal Revenue in Connecticut”
Research approach: apply a hypothetical tax rate (often 1%) to tax bases across all municipalities
Findings are similar and are likely generalizable to other New England states
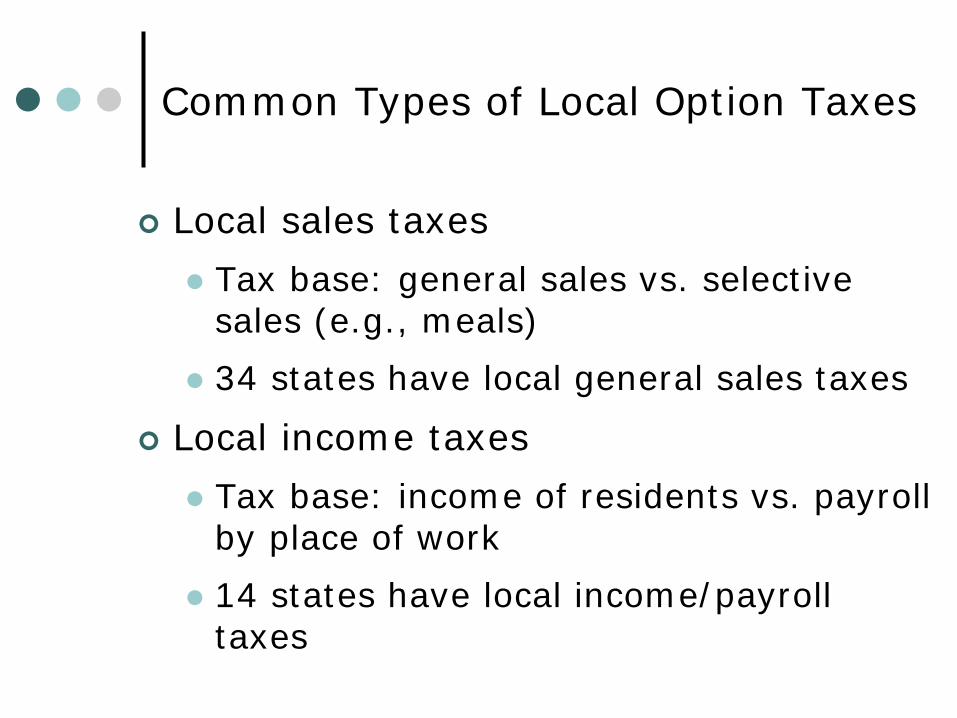
Local sales taxes Tax base: general sales vs. selective
sales (e.g., meals) 34 states have local general sales taxes
Local income taxes Tax base: income of residents vs. payroll
by place of work 14 states have local income/payroll
taxes
Common Types of Local Option Taxes
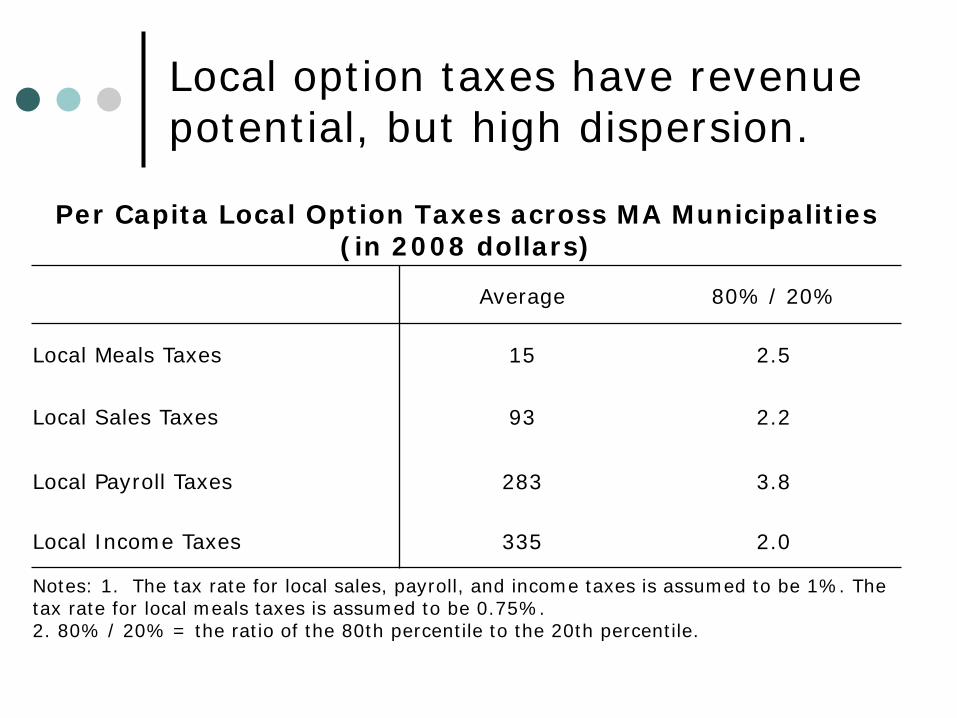
Local option taxes have revenue potential, but high dispersion.
Per Capita Local Option Taxes across MA Municipalities (in 2008 dollars)
Average 80% / 20%
Local Meals Taxes 15 2.5
Local Sales Taxes 93 2.2
Local Payroll Taxes 283 3.8
Local Income Taxes 335 2.0
Notes: 1. The tax rate for local sales, payroll, and income taxes is assumed to be 1%. The tax rate for local meals taxes is assumed to be 0.75%. 2. 80% / 20% = the ratio of the 80th percentile to the 20th percentile.
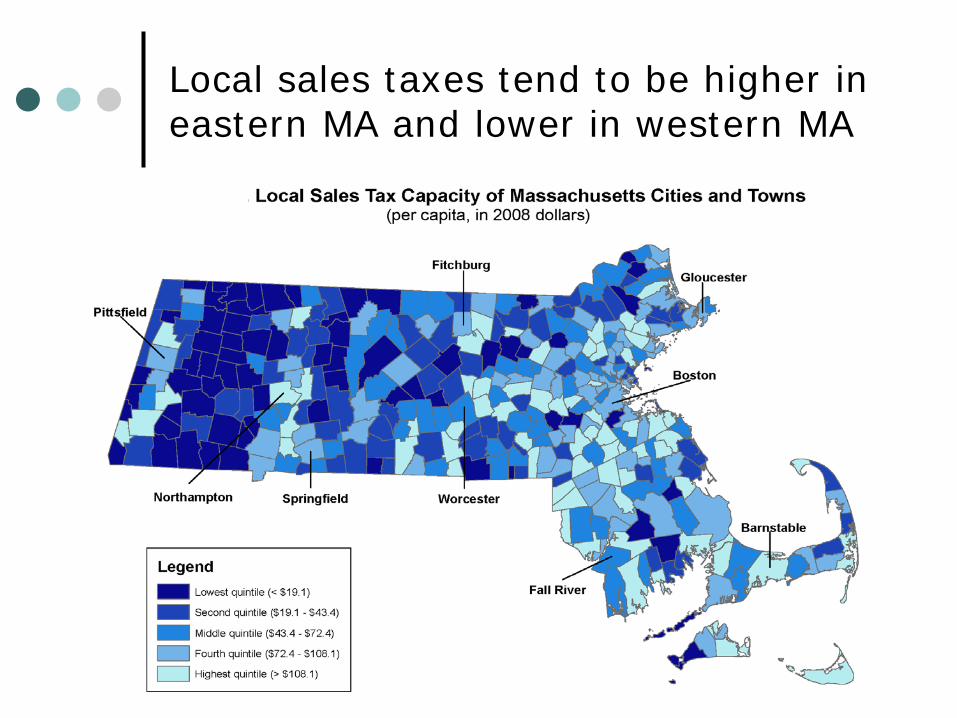
Local sales taxes tend to be higher in eastern MA and lower in western MA
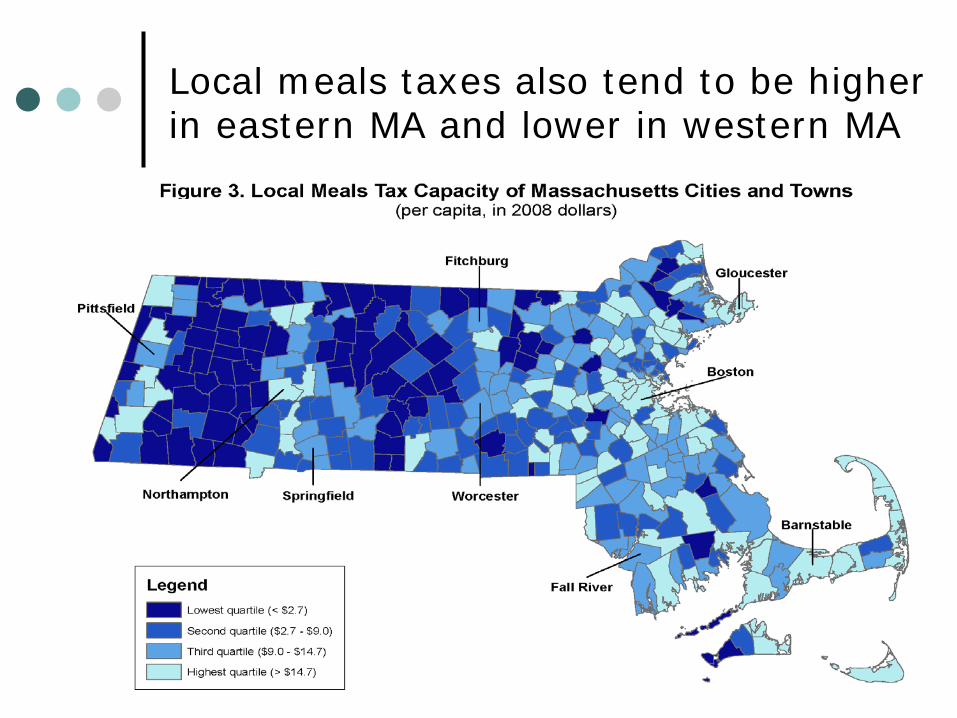
Local meals taxes also tend to be higher in eastern MA and lower in western MA

Boston suburbs tend to have the highest local income taxes
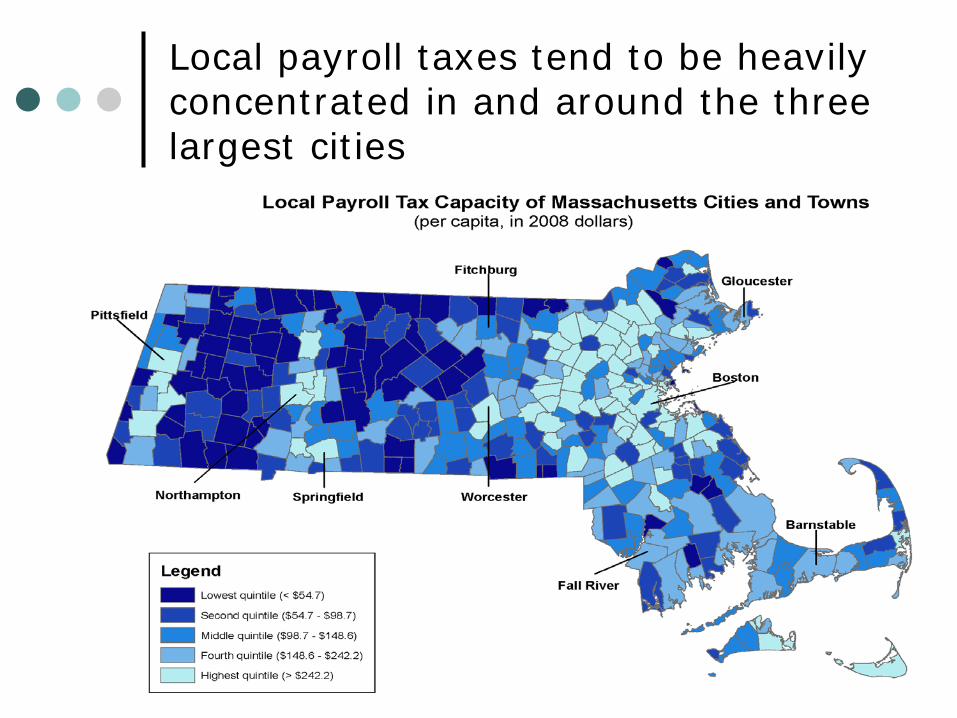
Local payroll taxes tend to be heavily concentrated in and around the three largest cities
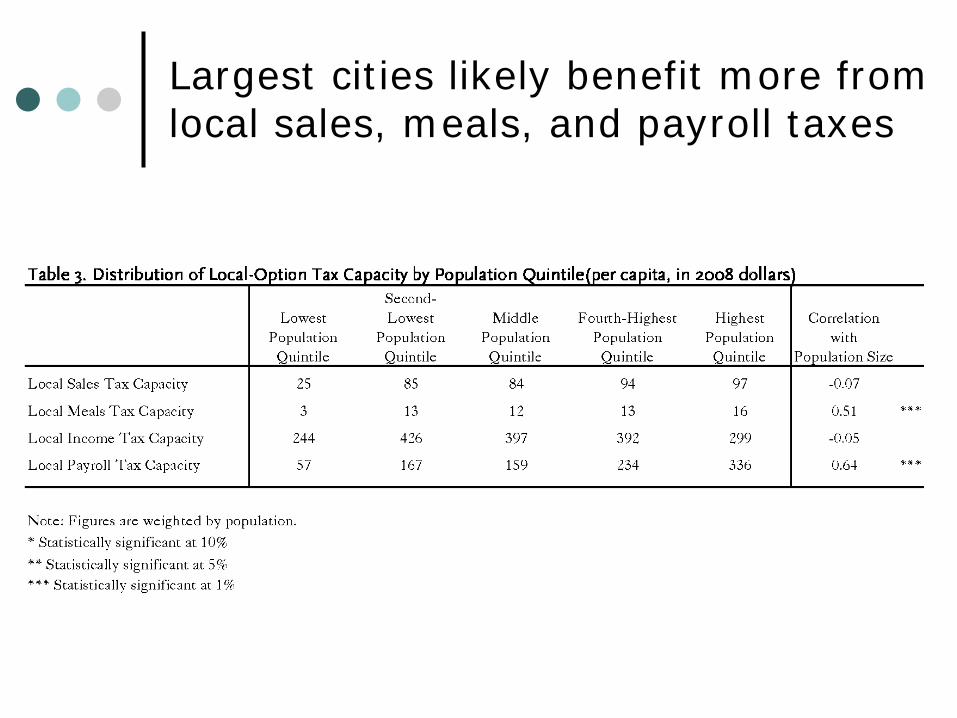
Largest cities likely benefit more from local sales, meals, and payroll taxes
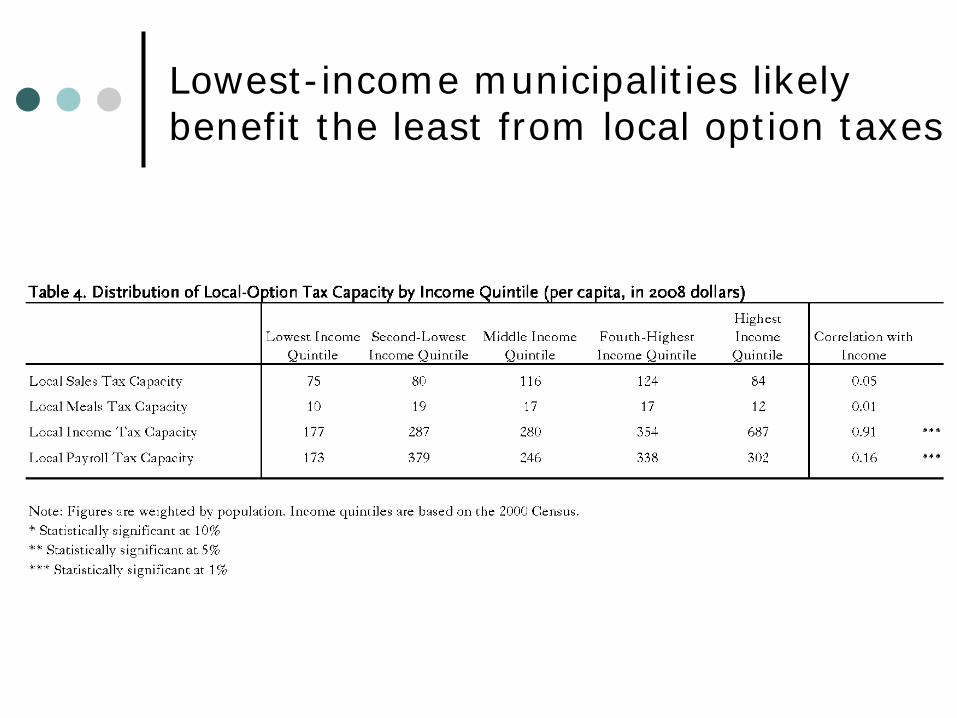
Lowest-income municipalities likely benefit the least from local option taxes
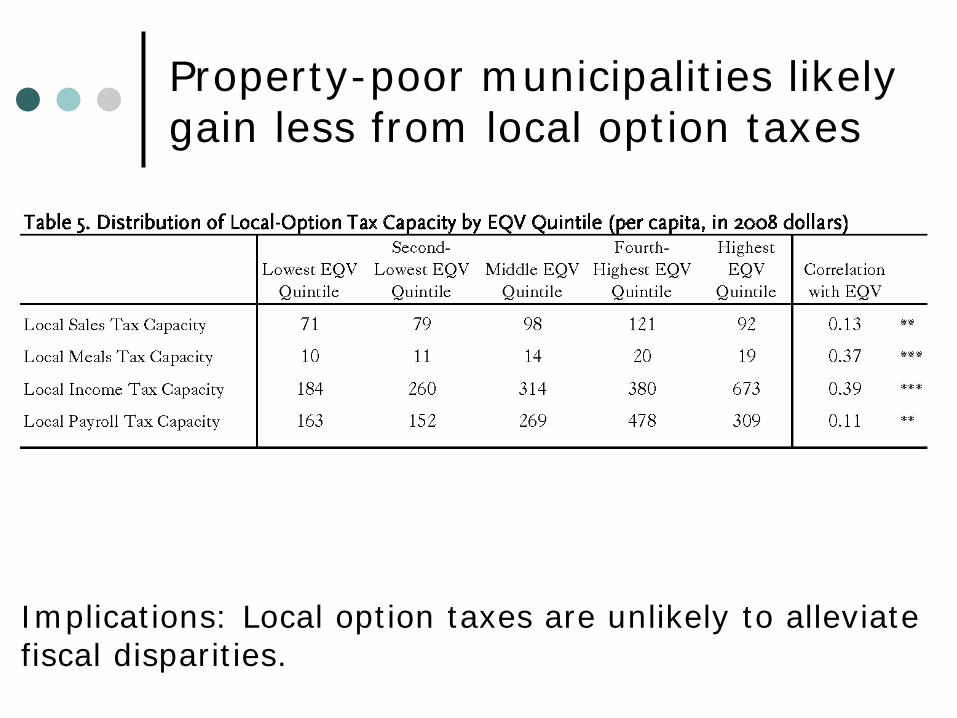
Property-poor municipalities likely gain less from local option taxes
Implications: Local option taxes are unlikely to alleviate fiscal disparities.
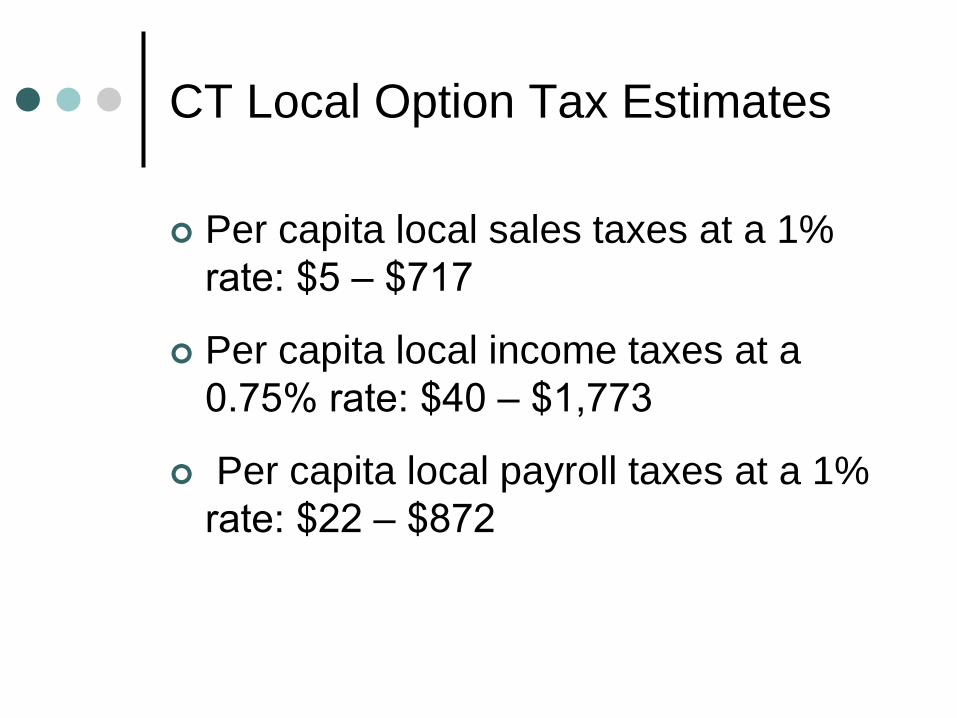
CT Local Option Tax Estimates
Per capita local sales taxes at a 1% rate: $5 ‒ $717
Per capita local income taxes at a 0.75% rate: $40 ‒ $1,773
Per capita local payroll taxes at a 1% rate: $22 ‒ $872
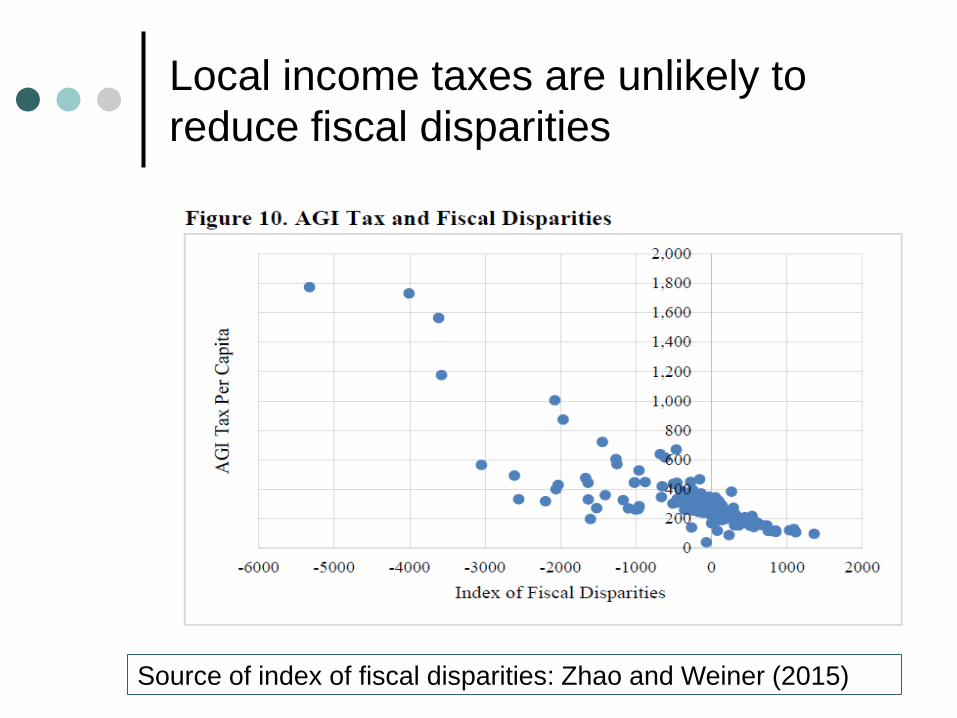
Local income taxes are unlikely to reduce fiscal disparities
Source of index of fiscal disparities: Zhao and Weiner (2015)
Other Concerns
May lead to larger expenditures beyond the citizen’s desire
Increase revenue volatility
Local tax competition
Administrative costs
Other Concerns
Cross-border shopping
Sales taxes are more regressive than property taxes
Negative effect of income tax on hours worked
Migration response to income tax
Local Option Tax Design Issues
Define the tax base
Specify the allowable tax rate
Determine whether the tax is optional or mandated
Determine whether the tax revenue is restricted for specific purposes

Local Option Tax Design Issues
Determine whether local officials or voters decide to adopt
Determine whether the state or each town administers the tax
Specify the share of the revenue collected in a town to be allocated to that town
Conclusion
Local option taxes could generate considerable additional revenues.
They are not evenly distributed across population, income, property wealth, or geographic location.
They are not likely to reduce fiscal disparities.
Policymakers may also need to consider other economic and design issues related to local option taxes.