Embed Size (px)
Citation preview

34 � Fair Chase Spring 2002 © DUPLAN WILDLIFE
Spring 2002 Fair Chase � 35
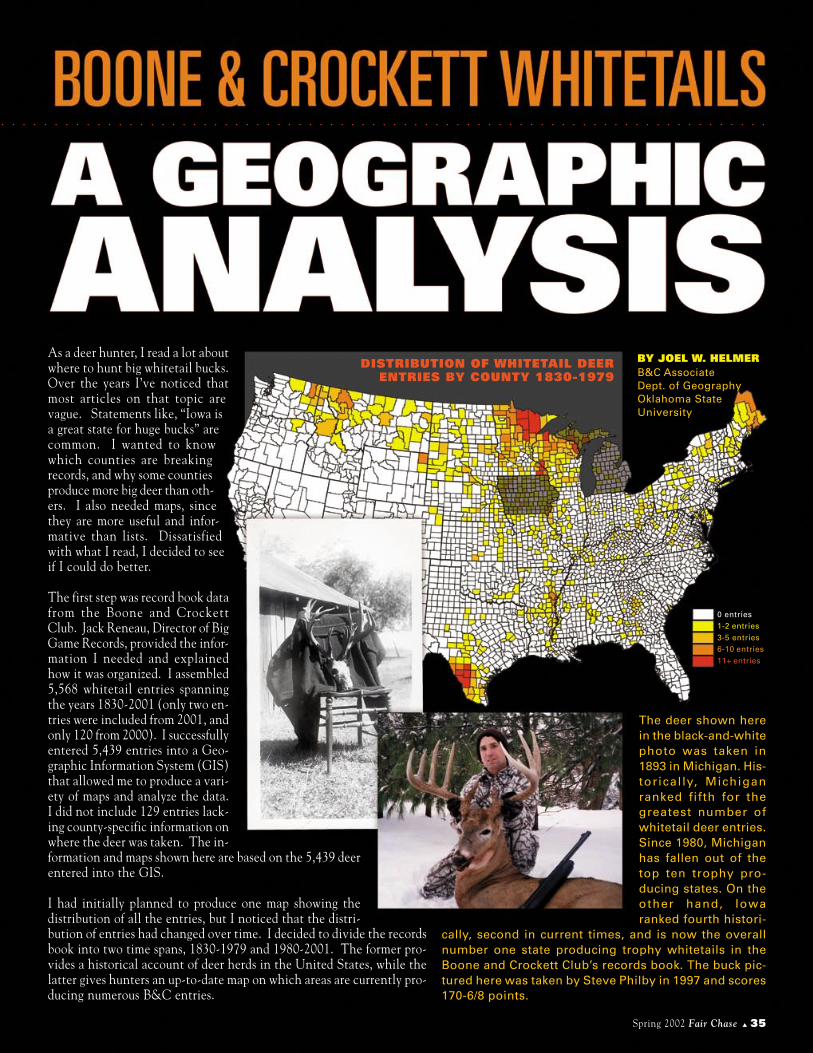
As a deer hunter, I read a lot aboutwhere to hunt big whitetail bucks.Over the years I’ve noticed thatmost articles on that topic arevague. Statements like, “Iowa isa great state for huge bucks” arecommon. I wanted to knowwhich counties are breakingrecords, and why some countiesproduce more big deer than oth-ers. I also needed maps, sincethey are more useful and infor-mative than lists. Dissatisfiedwith what I read, I decided to seeif I could do better.
The first step was record book datafrom the Boone and CrockettClub. Jack Reneau, Director of BigGame Records, provided the infor-mation I needed and explainedhow it was organized. I assembled5,568 whitetail entries spanningthe years 1830-2001 (only two en-tries were included from 2001, andonly 120 from 2000). I successfullyentered 5,439 entries into a Geo-graphic Information System (GIS)that allowed me to produce a vari-ety of maps and analyze the data.I did not include 129 entries lack-ing county-specific information onwhere the deer was taken. The in-formation and maps shown here are based on the 5,439 deerentered into the GIS.
I had initially planned to produce one map showing thedistribution of all the entries, but I noticed that the distri-bution of entries had changed over time. I decided to divide the recordsbook into two time spans, 1830-1979 and 1980-2001. The former pro-vides a historical account of deer herds in the United States, while thelatter gives hunters an up-to-date map on which areas are currently pro-ducing numerous B&C entries.
BY JOEL W. HELMERB&C Associate
Dept. of Geography
Oklahoma State
University
0 entries
1-2 entries
3-5 entries
6-10 entries
11+ entries
○ ○ ○ ○ ○ ○ ○ ○ ○ ○ ○ ○ ○ ○ ○ ○ ○ ○ ○ ○ ○ ○ ○ ○ ○ ○ ○ ○ ○ ○ ○ ○ ○ ○ ○ ○ ○ ○ ○ ○ ○ ○ ○ ○ ○ ○ ○ ○ ○ ○ ○ ○ ○ ○ ○ ○ ○ ○ ○ ○ ○ ○ ○ ○ ○ ○ ○ ○ ○ ○ ○ ○ ○
DISTRIBUTION OF WHITETAIL DEERENTRIES BY COUNTY 1830-1979
The deer shown here
in the black-and-white
photo was taken in
1893 in Michigan. His-
torically, Michigan
ranked fifth for the
greatest number of
whitetail deer entries.
Since 1980, Michigan
has fallen out of the
top ten trophy pro-
ducing states. On the
other hand, Iowa
ranked fourth histori-
cally, second in current times, and is now the overall
number one state producing trophy whitetails in the
Boone and Crockett Club’s records book. The buck pic-
tured here was taken by Steve Philby in 1997 and scores
170-6/8 points.

36 � Fair Chase Spring 2002
1830-1979The 1,489 entries mapped from thisearly period comprise 27% of 5,439total entries. Thirty-nine states and663 counties appear, the top threestates — Minnesota (315), Wiscon-sin (194), and Texas (157) — ac-counting for 45% of all entriesduring the period. Montana, Arkan-sas, and South Dakota popped up inthe top 10, while states currentlyhailed as big buck meccas, such asOhio, Illinois, and Kansas, recordedrelatively few entries.
The most productive countyduring this period was northernMinnesota’s St. Louis (39), followedby south Texas’ Webb (27), andMinnesota’s Itasca (20). The top 10counties during this period are inWisconsin, Minnesota and Texas.
The distribution of entriesfrom 1830-1979 reflects the historyof whitetail deer in the United
States. During the late 1800s andearly 1900s, whitetails were ex-tremely rare in many states and hadbecome extinct in some. Conver-sion of land for agriculture, defor-estation, and unrestricted markethunting are some of the reasons forthis decline. During this period,whitetails in agricultural states wereespecially vulnerable, as much ofthe land was cleared. Some deerherds did not return until recently.Ohio did not have a modern fire-arms season until 1943; and inIowa’s first modern deer season, in
1953, hunters took only 4,000 deer!Other states have similar histories,helping to explain the lack of en-tries during this time period. Incontrast, whitetail deer survived ingreater numbers in states with re-mote, forested areas. Minnesota,Wisconsin, and Maine are goodexamples — so too areas like southTexas, the Rocky Mountain Range,and the Mississippi Delta region.
One interesting place is theDriftless Area of west-centralWisconsin and southeasternMinnesota. This region wasnot glaciated during the lastice age. Its landscape of for-ested hills provided food andcover, where deer survivedand where they still growbig. Buffalo Wisconsinis in this region, andstands as the all-timem o s t - p r o d u c t i v ecounty with 62 en-tries.
1980-2001During the last twodecades, the rangeand total populationof the whitetail hasexpanded immensely,with managers nowworking to either stabi-lize deer populations orreduce them. With in-creasing numbers of deercame more interest in tro-phy-class deer. The 3,950 en-tries (74% of the record book total)come from 41 states and 1,254 coun-ties. Incredibly,the years 1990-2001 account for2,811 or 52% ofthe record bookentries during thisperiod.
D i s t r i b u -tion has shifted toinclude the mid-western states,where deer herdsare growing, aidedby excellent habi-tat. The top 10 states are IL (509),IA (507), WI (395), MN (293), MO(244), KY (242), KS (235), OH(199), TX (159), and IN (138). Themap shows the dominance of Mid-western states during the last 20
TOP TEN WHITETAIL STATES OF ALL-TIMESTATE 1830-2001 1830-1979 1980-20011. Iowa 615 108 507
2. Minnesota 608 315 293
3. Wisconsin 589 194 395
4. Illinois 552 43 509
5. Texas 316 157 159
6. Missouri 285 41 244
7. Kentucky 279 37 242
8. Kansas 255 20 235
9. Ohio 235 36 199
10. Michigan 155 55 100
DISTRIBUTIONOF WHITETAILDEER ENTRIES
BY COUNTY1830-2001
○ ○ ○ ○ ○ ○ ○ ○ ○ ○ ○ ○ ○ ○ ○ ○ ○ ○ ○ ○ ○ ○ ○ ○ ○ ○ ○ ○ ○ ○ ○ ○ ○ ○ ○
STATE IOWA
HUNTER Ben R. Puttmann
LOCATION Cherokee County
YEAR 1998
SCORE 170 (typical)
STATE KANSAS
HUNTER Mark B. Steffen
LOCATION Rice County
YEAR 1996
SCORE 160-2/8 (typical)

Spring 2002 Fair Chase � 37
0 entries
1-2 entries
3-5 entries
6-10 entries
11+ entries
STATE MINNESOTA
HUNTER Thomas C. Kroening
LOCATION Olmstead County
YEAR 1998
SCORE 180-4/8 (typical)
STATE WISCONSIN
HUNTER Todd W. Davis
LOCATION Shawano County
YEAR 1999
SCORE 161-6/8 (typical)
STATE OHIO
HUNTER Mickey E. Lotz
LOCATION Hamilton County
YEAR 1995
SCORE 206-7/8 (non-typical)
STATE MISSOURI
HUNTER William M. Hazer
LOCATION Washington County
YEAR 1998
SCORE 170-2/8 (typical)
STATE TEXAS
HUNTER B. Tyler Fenley
LOCATION Angelina County
YEAR 1999
SCORE 198-6/8 (non-typical)
STATE ILLINOIS
HUNTER Walter L. Baker
LOCATION Jersey County
YEAR 1998
SCORE 216-3/8 (non-typical)
38 � Fair Chase Spring 2002
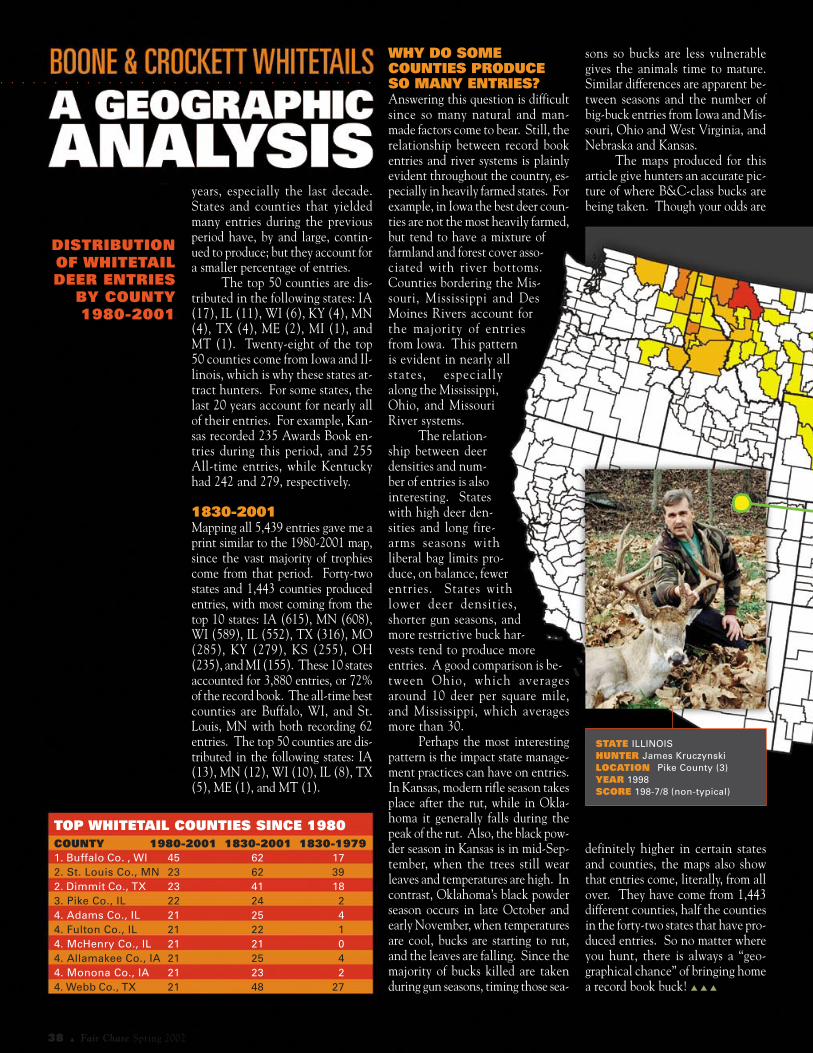
years, especially the last decade.States and counties that yieldedmany entries during the previousperiod have, by and large, contin-ued to produce; but they account fora smaller percentage of entries.
The top 50 counties are dis-tributed in the following states: IA(17), IL (11), WI (6), KY (4), MN(4), TX (4), ME (2), MI (1), andMT (1). Twenty-eight of the top50 counties come from Iowa and Il-linois, which is why these states at-tract hunters. For some states, thelast 20 years account for nearly allof their entries. For example, Kan-sas recorded 235 Awards Book en-tries during this period, and 255All-time entries, while Kentuckyhad 242 and 279, respectively.
1830-2001Mapping all 5,439 entries gave me aprint similar to the 1980-2001 map,since the vast majority of trophiescome from that period. Forty-twostates and 1,443 counties producedentries, with most coming from thetop 10 states: IA (615), MN (608),WI (589), IL (552), TX (316), MO(285), KY (279), KS (255), OH(235), and MI (155). These 10 statesaccounted for 3,880 entries, or 72%of the record book. The all-time bestcounties are Buffalo, WI, and St.Louis, MN with both recording 62entries. The top 50 counties are dis-tributed in the following states: IA(13), MN (12), WI (10), IL (8), TX(5), ME (1), and MT (1).
WHY DO SOMECOUNTIES PRODUCESO MANY ENTRIES?Answering this question is difficultsince so many natural and man-made factors come to bear. Still, therelationship between record bookentries and river systems is plainlyevident throughout the country, es-pecially in heavily farmed states. Forexample, in Iowa the best deer coun-ties are not the most heavily farmed,but tend to have a mixture offarmland and forest cover asso-ciated with river bottoms.Counties bordering the Mis-souri, Mississippi and DesMoines Rivers account forthe majority of entriesfrom Iowa. This patternis evident in nearly allstates, especiallyalong the Mississippi,Ohio, and MissouriRiver systems.
The relation-ship between deerdensities and num-ber of entries is alsointeresting. Stateswith high deer den-sities and long fire-arms seasons withliberal bag limits pro-duce, on balance, fewerentries. States withlower deer densities,shorter gun seasons, andmore restrictive buck har-vests tend to produce moreentries. A good comparison is be-tween Ohio, which averagesaround 10 deer per square mile,and Mississippi, which averagesmore than 30.
Perhaps the most interestingpattern is the impact state manage-ment practices can have on entries.In Kansas, modern rifle season takesplace after the rut, while in Okla-homa it generally falls during thepeak of the rut. Also, the black pow-der season in Kansas is in mid-Sep-tember, when the trees still wearleaves and temperatures are high. Incontrast, Oklahoma’s black powderseason occurs in late October andearly November, when temperaturesare cool, bucks are starting to rut,and the leaves are falling. Since themajority of bucks killed are takenduring gun seasons, timing those sea-
TOP WHITETAIL COUNTIES SINCE 1980COUNTY 1980-2001 1830-2001 1830-19791. Buffalo Co. , WI 45 62 17
2. St. Louis Co., MN 23 62 39
2. Dimmit Co., TX 23 41 18
3. Pike Co., IL 22 24 2
4. Adams Co., IL 21 25 4
4. Fulton Co., IL 21 22 1
4. McHenry Co., IL 21 21 0
4. Allamakee Co., IA 21 25 4
4. Monona Co., IA 21 23 2
4. Webb Co., TX 21 48 27
DISTRIBUTIONOF WHITETAILDEER ENTRIES
BY COUNTY1980-2001
sons so bucks are less vulnerablegives the animals time to mature.Similar differences are apparent be-tween seasons and the number ofbig-buck entries from Iowa and Mis-souri, Ohio and West Virginia, andNebraska and Kansas.
The maps produced for thisarticle give hunters an accurate pic-ture of where B&C-class bucks arebeing taken. Though your odds are
definitely higher in certain statesand counties, the maps also showthat entries come, literally, from allover. They have come from 1,443different counties, half the countiesin the forty-two states that have pro-duced entries. So no matter whereyou hunt, there is always a “geo-graphical chance” of bringing homea record book buck! � � �
○ ○ ○ ○ ○ ○ ○ ○ ○ ○ ○ ○ ○ ○ ○ ○ ○ ○ ○ ○ ○ ○ ○ ○ ○ ○ ○ ○ ○ ○ ○ ○ ○ ○ ○
STATE ILLINOIS
HUNTER James Kruczynski
LOCATION Pike County (3)
YEAR 1998
SCORE 198-7/8 (non-typical)

Spring 2002 Fair Chase � 39
0 entries
1-2 entries
3-5 entries
6-10 entries
11+ entries
STATE IOWA
HUNTER Craig R. Belknap
LOCATION Des Moines County (12)
YEAR 1998
SCORE 198-5/8 (non-typical)
STATE WISCONSIN
HUNTER Ronald J. Jilot
LOCATION Buffalo County (1)
YEAR 1997
SCORE 203-5/8 (non-typical)
STATE TEXAS
HUNTER Floyd Burr
LOCATION Dimmit County (2)
YEAR 1949
SCORE 166 (typical)
STATE TEXAS
HUNTER Joe E. Coleman
LOCATION Dimmit County (2)
YEAR 1998
SCORE 170-4/8 (typical)
STATE MINNESOTA
HUNTER Bruce C. Norton
LOCATION Houston County (11)
YEAR 1995
SCORE 168-3/8 (typical)
Historically Dimmitt County has been a top
producer. It currently ranks second (tie) and 3rd
overall since 1830.