Embed Size (px)
Citation preview
Failure Analysis of a Cast A380 Aluminum Alloy Casting Using a Microstructurally Based Fatigue Model
C.L. Burton, M.K. Jones, D.L. Oglesby A.L. Oppedal, M.Q. Chandler, M.F. Horstemeyer
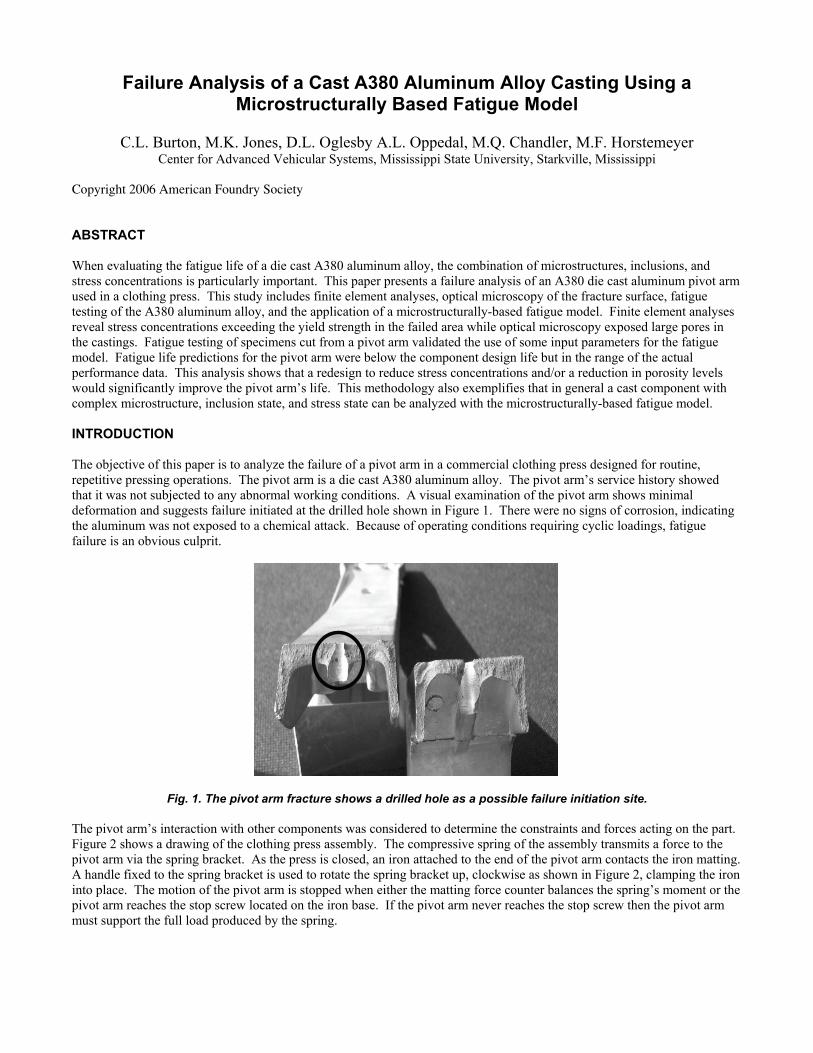
Center for Advanced Vehicular Systems, Mississippi State University, Starkville, Mississippi Copyright 2006 American Foundry Society ABSTRACT When evaluating the fatigue life of a die cast A380 aluminum alloy, the combination of microstructures, inclusions, and stress concentrations is particularly important. This paper presents a failure analysis of an A380 die cast aluminum pivot arm used in a clothing press. This study includes finite element analyses, optical microscopy of the fracture surface, fatigue testing of the A380 aluminum alloy, and the application of a microstructurally-based fatigue model. Finite element analyses reveal stress concentrations exceeding the yield strength in the failed area while optical microscopy exposed large pores in the castings. Fatigue testing of specimens cut from a pivot arm validated the use of some input parameters for the fatigue model. Fatigue life predictions for the pivot arm were below the component design life but in the range of the actual performance data. This analysis shows that a redesign to reduce stress concentrations and/or a reduction in porosity levels would significantly improve the pivot arm’s life. This methodology also exemplifies that in general a cast component with complex microstructure, inclusion state, and stress state can be analyzed with the microstructurally-based fatigue model. INTRODUCTION The objective of this paper is to analyze the failure of a pivot arm in a commercial clothing press designed for routine, repetitive pressing operations. The pivot arm is a die cast A380 aluminum alloy. The pivot arm’s service history showed that it was not subjected to any abnormal working conditions. A visual examination of the pivot arm shows minimal deformation and suggests failure initiated at the drilled hole shown in Figure 1. There were no signs of corrosion, indicating the aluminum was not exposed to a chemical attack. Because of operating conditions requiring cyclic loadings, fatigue failure is an obvious culprit.
Fig. 1. The pivot arm fracture shows a drilled hole as a possible failure initiation site. The pivot arm’s interaction with other components was considered to determine the constraints and forces acting on the part. Figure 2 shows a drawing of the clothing press assembly. The compressive spring of the assembly transmits a force to the pivot arm via the spring bracket. As the press is closed, an iron attached to the end of the pivot arm contacts the iron matting. A handle fixed to the spring bracket is used to rotate the spring bracket up, clockwise as shown in Figure 2, clamping the iron into place. The motion of the pivot arm is stopped when either the matting force counter balances the spring’s moment or the pivot arm reaches the stop screw located on the iron base. If the pivot arm never reaches the stop screw then the pivot arm must support the full load produced by the spring.
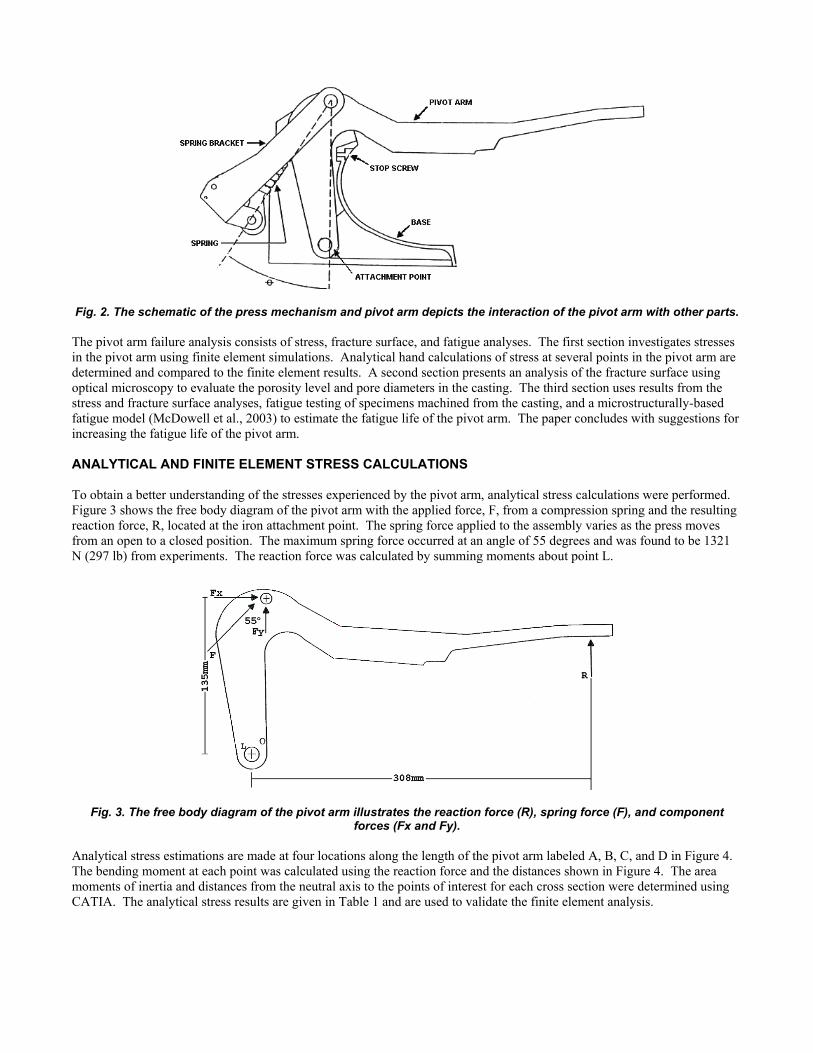
Fig. 2. The schematic of the press mechanism and pivot arm depicts the interaction of the pivot arm with other parts. The pivot arm failure analysis consists of stress, fracture surface, and fatigue analyses. The first section investigates stresses in the pivot arm using finite element simulations. Analytical hand calculations of stress at several points in the pivot arm are determined and compared to the finite element results. A second section presents an analysis of the fracture surface using optical microscopy to evaluate the porosity level and pore diameters in the casting. The third section uses results from the stress and fracture surface analyses, fatigue testing of specimens machined from the casting, and a microstructurally-based fatigue model (McDowell et al., 2003) to estimate the fatigue life of the pivot arm. The paper concludes with suggestions for increasing the fatigue life of the pivot arm. ANALYTICAL AND FINITE ELEMENT STRESS CALCULATIONS To obtain a better understanding of the stresses experienced by the pivot arm, analytical stress calculations were performed. Figure 3 shows the free body diagram of the pivot arm with the applied force, F, from a compression spring and the resulting reaction force, R, located at the iron attachment point. The spring force applied to the assembly varies as the press moves from an open to a closed position. The maximum spring force occurred at an angle of 55 degrees and was found to be 1321 N (297 lb) from experiments. The reaction force was calculated by summing moments about point L.
Fig. 3. The free body diagram of the pivot arm illustrates the reaction force (R), spring force (F), and component
forces (Fx and Fy). Analytical stress estimations are made at four locations along the length of the pivot arm labeled A, B, C, and D in Figure 4. The bending moment at each point was calculated using the reaction force and the distances shown in Figure 4. The area moments of inertia and distances from the neutral axis to the points of interest for each cross section were determined using CATIA. The analytical stress results are given in Table 1 and are used to validate the finite element analysis.
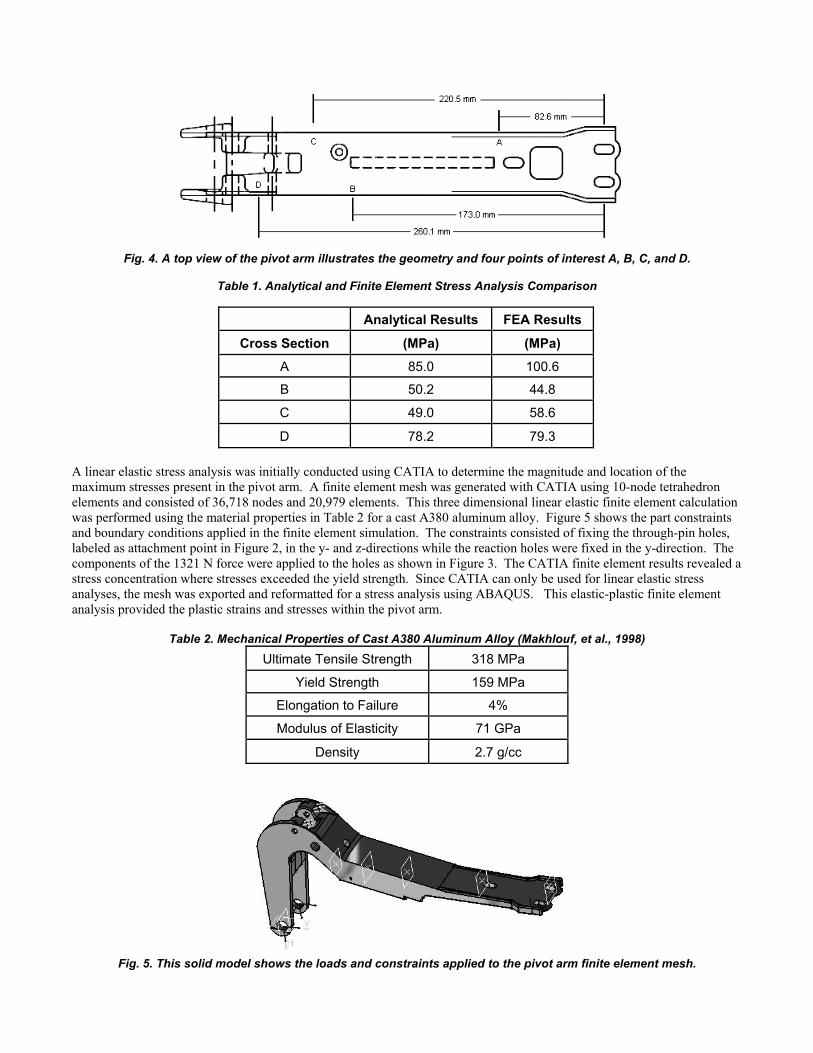
Fig. 4. A top view of the pivot arm illustrates the geometry and four points of interest A, B, C, and D.
Table 1. Analytical and Finite Element Stress Analysis Comparison
Analytical Results FEA Results
Cross Section (MPa) (MPa)
A 85.0 100.6
B 50.2 44.8
C 49.0 58.6
D 78.2 79.3 A linear elastic stress analysis was initially conducted using CATIA to determine the magnitude and location of the maximum stresses present in the pivot arm. A finite element mesh was generated with CATIA using 10-node tetrahedron elements and consisted of 36,718 nodes and 20,979 elements. This three dimensional linear elastic finite element calculation was performed using the material properties in Table 2 for a cast A380 aluminum alloy. Figure 5 shows the part constraints and boundary conditions applied in the finite element simulation. The constraints consisted of fixing the through-pin holes, labeled as attachment point in Figure 2, in the y- and z-directions while the reaction holes were fixed in the y-direction. The components of the 1321 N force were applied to the holes as shown in Figure 3. The CATIA finite element results revealed a stress concentration where stresses exceeded the yield strength. Since CATIA can only be used for linear elastic stress analyses, the mesh was exported and reformatted for a stress analysis using ABAQUS. This elastic-plastic finite element analysis provided the plastic strains and stresses within the pivot arm.
Table 2. Mechanical Properties of Cast A380 Aluminum Alloy (Makhlouf, et al., 1998)
Ultimate Tensile Strength 318 MPa
Yield Strength 159 MPa
Elongation to Failure 4%
Modulus of Elasticity 71 GPa
Density 2.7 g/cc
Fig. 5. This solid model shows the loads and constraints applied to the pivot arm finite element mesh.
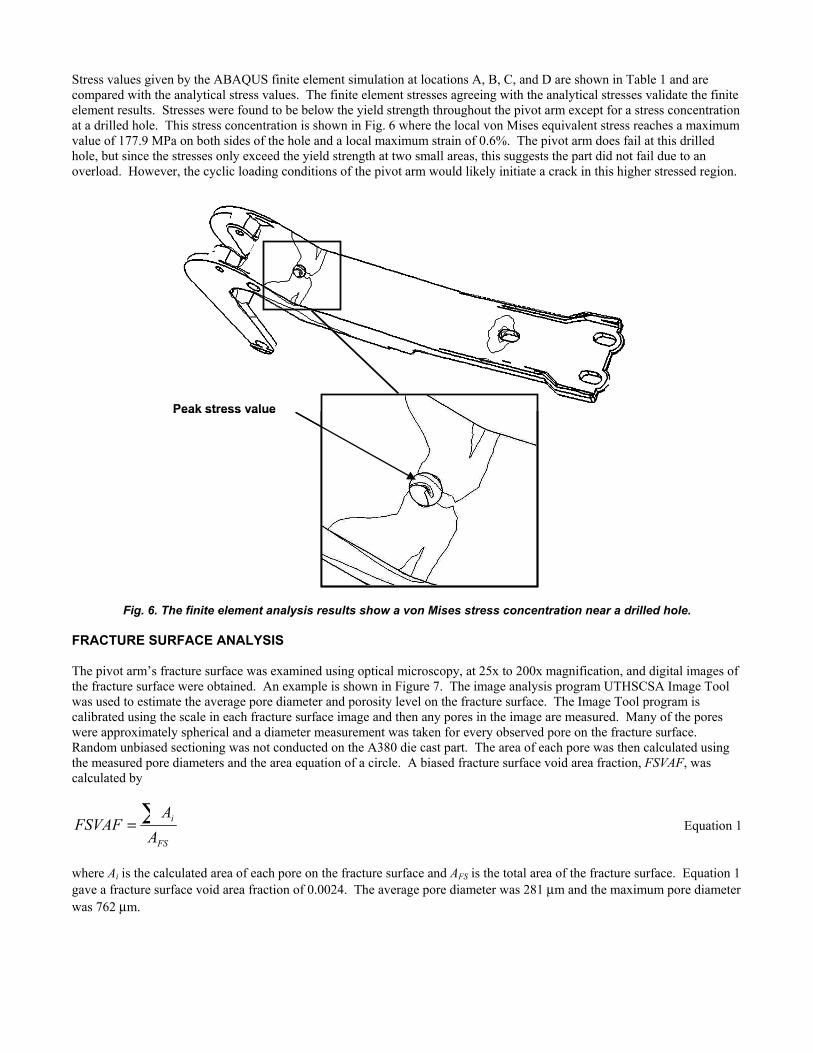
Stress values given by the ABAQUS finite element simulation at locations A, B, C, and D are shown in Table 1 and are compared with the analytical stress values. The finite element stresses agreeing with the analytical stresses validate the finite element results. Stresses were found to be below the yield strength throughout the pivot arm except for a stress concentration at a drilled hole. This stress concentration is shown in Fig. 6 where the local von Mises equivalent stress reaches a maximum value of 177.9 MPa on both sides of the hole and a local maximum strain of 0.6%. The pivot arm does fail at this drilled hole, but since the stresses only exceed the yield strength at two small areas, this suggests the part did not fail due to an overload. However, the cyclic loading conditions of the pivot arm would likely initiate a crack in this higher stressed region.
Peak stress valuePeak stress value
Fig. 6. The finite element analysis results show a von Mises stress concentration near a drilled hole. FRACTURE SURFACE ANALYSIS The pivot arm’s fracture surface was examined using optical microscopy, at 25x to 200x magnification, and digital images of the fracture surface were obtained. An example is shown in Figure 7. The image analysis program UTHSCSA Image Tool was used to estimate the average pore diameter and porosity level on the fracture surface. The Image Tool program is calibrated using the scale in each fracture surface image and then any pores in the image are measured. Many of the pores were approximately spherical and a diameter measurement was taken for every observed pore on the fracture surface. Random unbiased sectioning was not conducted on the A380 die cast part. The area of each pore was then calculated using the measured pore diameters and the area equation of a circle. A biased fracture surface void area fraction, FSVAF, was calculated by
FS
i
AA
FSVAF ∑= Equation 1
where Ai is the calculated area of each pore on the fracture surface and AFS is the total area of the fracture surface. Equation 1 gave a fracture surface void area fraction of 0.0024. The average pore diameter was 281 μm and the maximum pore diameter was 762 μm.
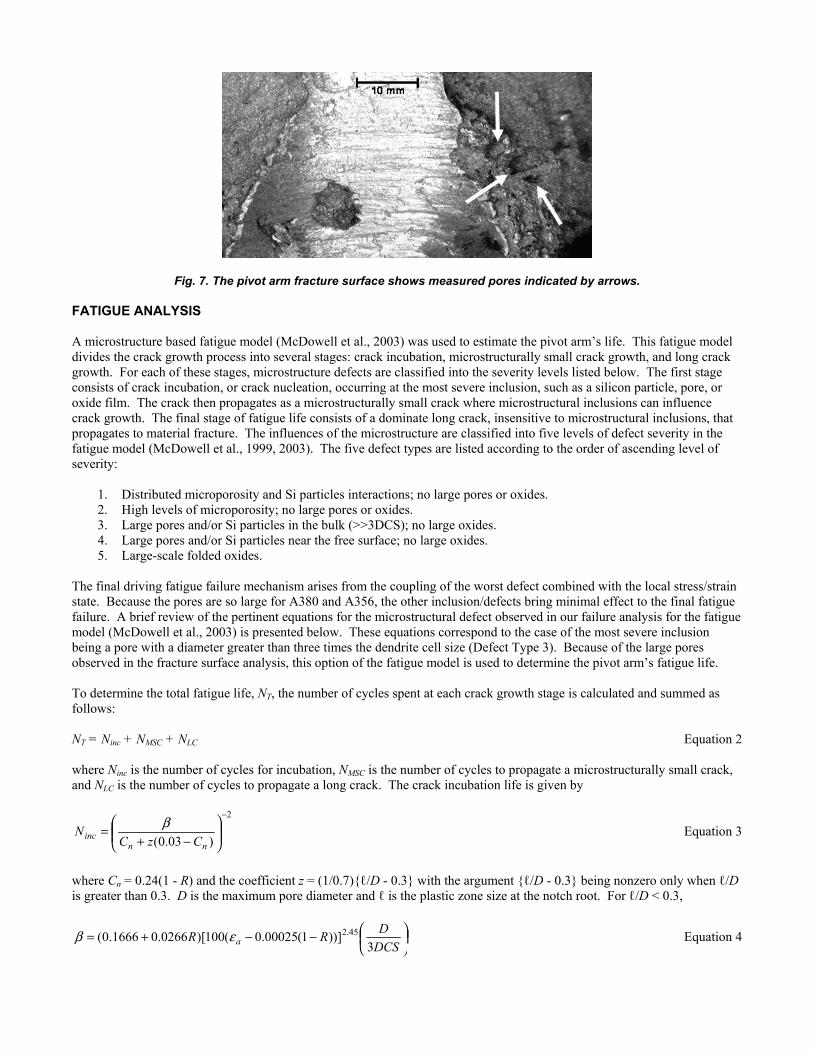
Fig. 7. The pivot arm fracture surface shows measured pores indicated by arrows. FATIGUE ANALYSIS A microstructure based fatigue model (McDowell et al., 2003) was used to estimate the pivot arm’s life. This fatigue model divides the crack growth process into several stages: crack incubation, microstructurally small crack growth, and long crack growth. For each of these stages, microstructure defects are classified into the severity levels listed below. The first stage consists of crack incubation, or crack nucleation, occurring at the most severe inclusion, such as a silicon particle, pore, or oxide film. The crack then propagates as a microstructurally small crack where microstructural inclusions can influence crack growth. The final stage of fatigue life consists of a dominate long crack, insensitive to microstructural inclusions, that propagates to material fracture. The influences of the microstructure are classified into five levels of defect severity in the fatigue model (McDowell et al., 1999, 2003). The five defect types are listed according to the order of ascending level of severity:
1. Distributed microporosity and Si particles interactions; no large pores or oxides. 2. High levels of microporosity; no large pores or oxides. 3. Large pores and/or Si particles in the bulk (>>3DCS); no large oxides. 4. Large pores and/or Si particles near the free surface; no large oxides. 5. Large-scale folded oxides.
The final driving fatigue failure mechanism arises from the coupling of the worst defect combined with the local stress/strain state. Because the pores are so large for A380 and A356, the other inclusion/defects bring minimal effect to the final fatigue failure. A brief review of the pertinent equations for the microstructural defect observed in our failure analysis for the fatigue model (McDowell et al., 2003) is presented below. These equations correspond to the case of the most severe inclusion being a pore with a diameter greater than three times the dendrite cell size (Defect Type 3). Because of the large pores observed in the fracture surface analysis, this option of the fatigue model is used to determine the pivot arm’s fatigue life. To determine the total fatigue life, NT, the number of cycles spent at each crack growth stage is calculated and summed as follows: NT = Ninc + NMSC + NLC Equation 2 where Ninc is the number of cycles for incubation, NMSC is the number of cycles to propagate a microstructurally small crack, and NLC is the number of cycles to propagate a long crack. The crack incubation life is given by
2
)03.0(
−
⎟⎟⎠
⎞⎜⎜⎝
⎛−+
=nn
inc CzCN β Equation 3
where Cn = 0.24(1 - R) and the coefficient z = (1/0.7){ℓ/D - 0.3} with the argument {ℓ/D - 0.3} being nonzero only when ℓ/D is greater than 0.3. D is the maximum pore diameter and ℓ is the plastic zone size at the notch root. For ℓ/D < 0.3,
⎟⎠⎞⎜
⎝⎛−−+=
DCSDRR a 3
))]1(00025.0(100)[0266.01666.0( 45.2εβ Equation 4
where εa is the von Mises equivalent strain amplitude and DCS is the dendrite cell size, while for ℓ/D ≥ 0.3,
)91())]1(00025.00023.0(100)[0266.01666.0( 45.2 zRR +−−+=β . Equation 5 The propagation of a microstructurally small crack is given by
)( thMSC
CTDCTDGdNda Δ−Δ=⎟
⎠⎞⎜
⎝⎛ Equation 6
where G is a microstructural constant and ΔCTDth is a threshold crack tip opening displacement taken as the Burger’s vector for pure aluminum. The crack tip opening displacement, ΔCTD, is given by
2
0
8.41
0
6.08.0()( βσσϕ ⎟⎟⎠
⎞⎜⎜⎝
⎛+⎥
⎦
⎤⎢⎣
⎡ Δ−⎟⎟⎠
⎞⎜⎜⎝
⎛=Δ
DCSDCSCa
SU
DCSDCSCfCTD I
u
aII Equation 7
where Su is the ultimate tensile strength, σa is the von Mises equivalent stress amplitude, Δσ1 is the maximum principal stress range, a is crack length, CI and CII are coefficients, and U = 1/(1 - R) for R < 0 and U = 1 for R ≥ 0. The function f(φ) reflects the influence of porosity, φ, and is given by
⎥⎦
⎤⎢⎣
⎡⎟⎠⎞
⎜⎝⎛
×−−+= −4102
exp11)( ϕωϕf Equation 8
where ω is a constant. The propagation of a long crack is given by
( )Mtheff
Meffp
LCKKA
dNda )()( ,Δ−Δ=⎟
⎠⎞⎜
⎝⎛ Equation 9
where ΔKeff is an effective stress intensity factor range and Ap and M are constants. The appropriate growth law used to calculate the crack growth rate is determined by
⎥⎦
⎤⎢⎣
⎡⎟⎠⎞⎜
⎝⎛⎟
⎠⎞⎜
⎝⎛=
LCMSC dNda
dNda
dNda ,max . Equation 10
Input parameters required for the fatigue model (McDowell et al., 2003) are obtained from the finite element analysis, fracture surface analysis, and published A380 material properties. The finite element analysis provided the stresses and strains required for the fatigue analysis. Under maximum load, the 177.9 MPa stress and 0.6% strain observed around the drilled hole and subsequent failure location are taken to be the maximum stress and strain. When the pivot arm is in the open position, stresses and strains are assumed to be zero, giving a zero minimum stress and strain, a stress amplitude of 89 MPa, a strain amplitude of 0.3%, and a stress ratio R = 0. The 0.0024 fracture surface void area fraction determined from the fracture surface analysis is used as an estimate of the porosity throughout the volume of the casting. Values for the maximum pore diameter and average pore diameter were also obtained from the fracture surface analysis. The A380 material properties, elastic modulus and ultimate tensile strength, are taken from published data (Makhlouf et al., 1998). To determine the remaining microstructural related parameters for A380 would require more extensive microscopy and correlation of the fatigue model with experiments. However, the experimentally determined constants G, ω, CI and CII, silicon particle diameters, and the dendrite cell size have been determined for cast A356-T6 (McDowell et al., 2003). While the differences in the compositions of A380 and A356, shown in Table 3, result in different microstructural characteristics, both are castable Al-Si alloys and the major defect related to final fatigue failure was pore size in both cases. Therefore, the microstructural related parameters determined for A356 may also apply to the A380 pivot arm analysis. To verify that these microstructural parameters can be used for A380, fatigue specimens were machined from a pivot arm and tested. The fatigue specimens had a dog-bone shape with a rectangular cross section and were tested using a strain controlled setup. For the fatigue tests the minimum applied strain was 10% of the maximum applied strain. Because the tests were conducted in the low cycle fatigue regime, the specimens plastically deformed resulting in some compressive stresses being applied near the minimum strain. This results in a negative stress ratio, R, for the experimental values in Figure 9. The fracture surface of each specimen was examined to determine the maximum pore diameter and estimate the final crack length just prior to
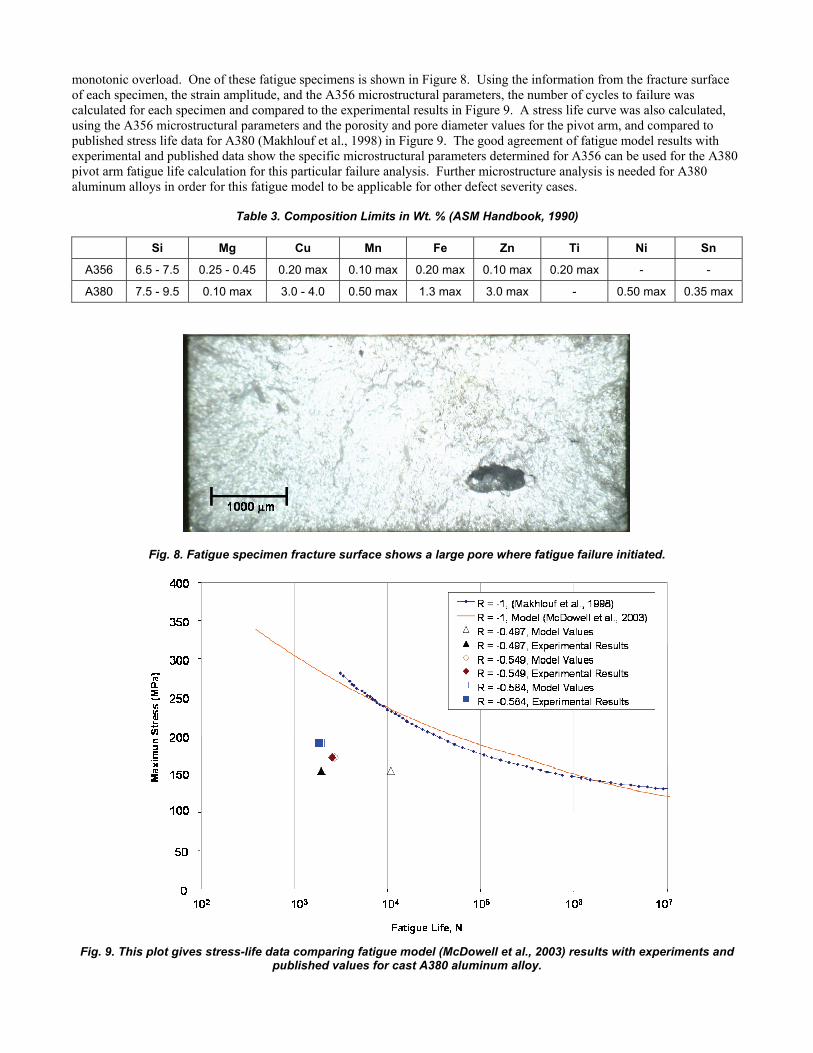
monotonic overload. One of these fatigue specimens is shown in Figure 8. Using the information from the fracture surface of each specimen, the strain amplitude, and the A356 microstructural parameters, the number of cycles to failure was calculated for each specimen and compared to the experimental results in Figure 9. A stress life curve was also calculated, using the A356 microstructural parameters and the porosity and pore diameter values for the pivot arm, and compared to published stress life data for A380 (Makhlouf et al., 1998) in Figure 9. The good agreement of fatigue model results with experimental and published data show the specific microstructural parameters determined for A356 can be used for the A380 pivot arm fatigue life calculation for this particular failure analysis. Further microstructure analysis is needed for A380 aluminum alloys in order for this fatigue model to be applicable for other defect severity cases.
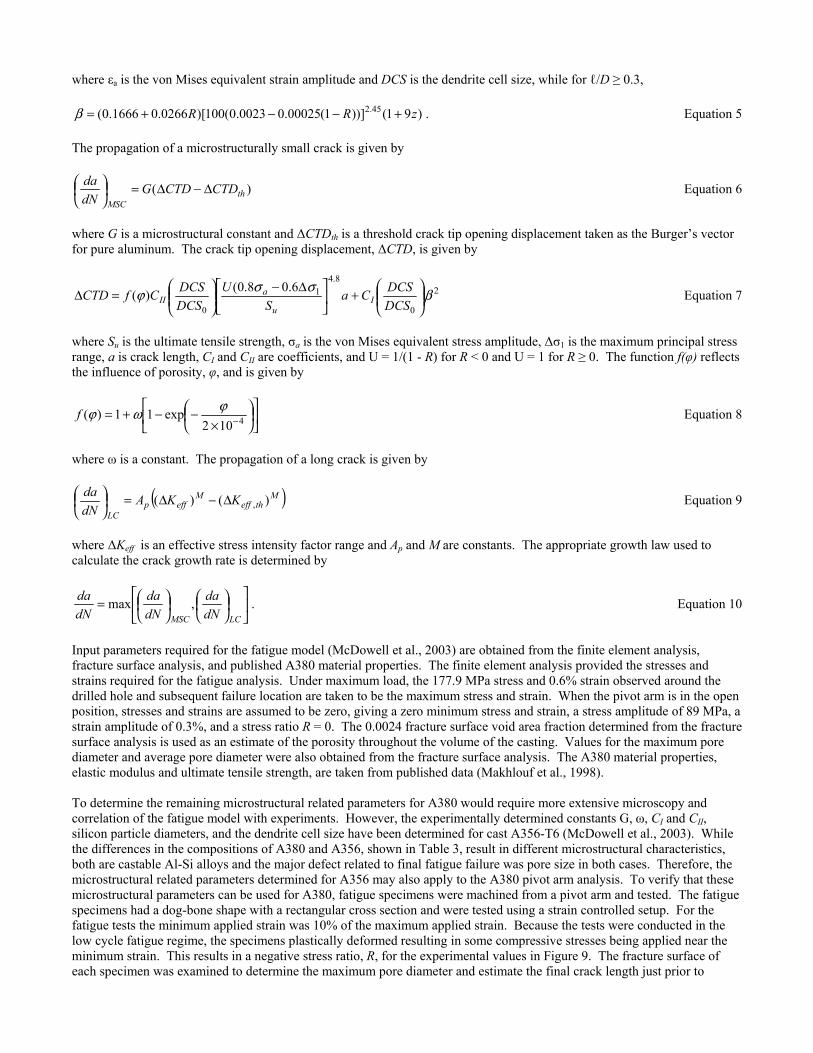
Table 3. Composition Limits in Wt. % (ASM Handbook, 1990)
Si Mg Cu Mn Fe Zn Ti Ni Sn
A356 6.5 - 7.5 0.25 - 0.45 0.20 max 0.10 max 0.20 max 0.10 max 0.20 max - -
A380 7.5 - 9.5 0.10 max 3.0 - 4.0 0.50 max 1.3 max 3.0 max - 0.50 max 0.35 max
Fig. 8. Fatigue specimen fracture surface shows a large pore where fatigue failure initiated.
Fig. 9. This plot gives stress-life data comparing fatigue model (McDowell et al., 2003) results with experiments and
published values for cast A380 aluminum alloy.
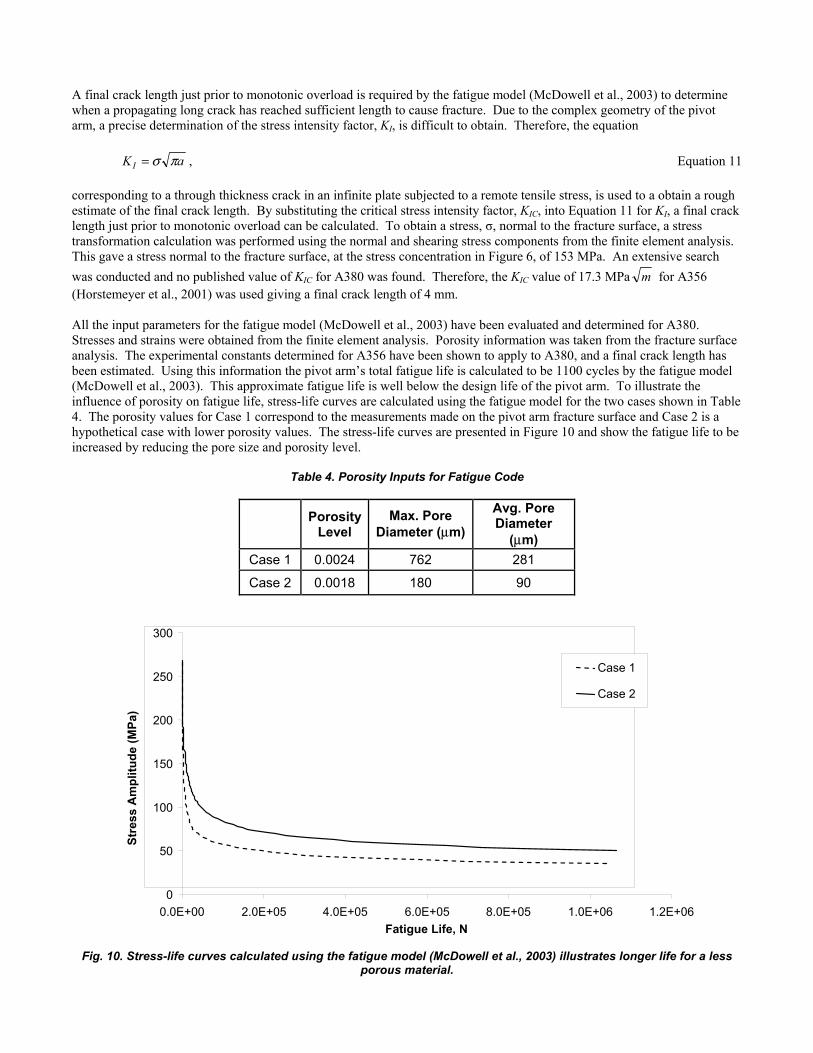
A final crack length just prior to monotonic overload is required by the fatigue model (McDowell et al., 2003) to determine when a propagating long crack has reached sufficient length to cause fracture. Due to the complex geometry of the pivot arm, a precise determination of the stress intensity factor, KI, is difficult to obtain. Therefore, the equation aKI πσ= , Equation 11 corresponding to a through thickness crack in an infinite plate subjected to a remote tensile stress, is used to a obtain a rough estimate of the final crack length. By substituting the critical stress intensity factor, KIC, into Equation 11 for KI, a final crack length just prior to monotonic overload can be calculated. To obtain a stress, σ, normal to the fracture surface, a stress transformation calculation was performed using the normal and shearing stress components from the finite element analysis. This gave a stress normal to the fracture surface, at the stress concentration in Figure 6, of 153 MPa. An extensive search was conducted and no published value of KIC for A380 was found. Therefore, the KIC value of 17.3 MPa m for A356 (Horstemeyer et al., 2001) was used giving a final crack length of 4 mm. All the input parameters for the fatigue model (McDowell et al., 2003) have been evaluated and determined for A380. Stresses and strains were obtained from the finite element analysis. Porosity information was taken from the fracture surface analysis. The experimental constants determined for A356 have been shown to apply to A380, and a final crack length has been estimated. Using this information the pivot arm’s total fatigue life is calculated to be 1100 cycles by the fatigue model (McDowell et al., 2003). This approximate fatigue life is well below the design life of the pivot arm. To illustrate the influence of porosity on fatigue life, stress-life curves are calculated using the fatigue model for the two cases shown in Table 4. The porosity values for Case 1 correspond to the measurements made on the pivot arm fracture surface and Case 2 is a hypothetical case with lower porosity values. The stress-life curves are presented in Figure 10 and show the fatigue life to be increased by reducing the pore size and porosity level.
Table 4. Porosity Inputs for Fatigue Code
Porosity Level
Max. Pore Diameter (μm)
Avg. Pore Diameter
(μm) Case 1 0.0024 762 281
Case 2 0.0018 180 90
Fig. 10. Stress-life curves calculated using the fatigue model (McDowell et al., 2003) illustrates longer life for a less
porous material.
0
50
100
150
200
250
300
0.0E+00 2.0E+05 4.0E+05 6.0E+05 8.0E+05 1.0E+06 1.2E+06Fatigue Life, N
Stre
ss A
mpl
itude
(MPa
)
Case 1 Case 2
CONCLUSIONS The A380 die cast aluminum alloy pivot arm failed due to a crack initiating in a region of high localized stress, which propagated under the cyclic loading conditions resulting in the pivot arm fracturing. As illustrated in Figure 10, the fatigue life of the pivot arm can be improved by reducing stresses in the part and/or reducing the porosity in the casting. Stresses could be reduced by redesigning the pivot arm. A redesign should focus on reducing the stress concentration around the drilled hole, since stresses elsewhere in the pivot arm were well below the yield strength. Reducing the pore size and porosity level in the casting can be accomplished through alterations in the casting process. An investigation of the casting process would be required before specific improvements could be suggested. An underlying theme in this paper is the practical application of a microstructurally-based fatigue model (McDowell et al., 2003). While the fatigue model was developed for a cast A356 aluminum alloy, it has been applied to a cast A380 aluminum alloy component to approximate the component’s fatigue life. This was accomplished through a finite element analysis to determine stresses and strains in the component and a fracture surface analysis to characterize the porosity. A380 fatigue specimens were tested to verify that certain fatigue model parameters defined for A356 could be applied to the A380 analysis. In general, the methodology used in this paper could be followed to apply the fatigue model (McDowell et al., 2003) to other cast aluminum alloy components. ACKNOWLEDGEMENTS This work was made possible by the Center for Advanced Vehicular Systems department at Mississippi State University. Several other individuals are to be recognized for their involvement in this project. The finite element mesh of the pivot arm was constructed by Neil Littell using CATIA. The fatigue testing was conducted by Brian Jordon at the Northrop-Grumman Testing Facility in New York. Dr. E. Jones is acknowledged for his support and guidance of this project. REFERENCES ABAQUS, V6.3, ABAQUS Inc., 2002. ASM Handbook, Vol. 2, Tenth Edition, ASM International, 1990, pp. 164-170. CATIA, V5 R11, Dassault Systemes, 1981. Horstemeyer, Mark F., McDowell, David L., and Fan, Jinghong, From Atoms to Autos: A New Design Paradigm Using
Microstructure-Property Modeling. Part 2: Cyclic Fatigue, SAND2000-8661, Sandia National Laboratories, Livermore, CA (2000).
Makhlouf, M., Apelian, D., and Wang, L., “Microstructures and properties of aluminum die casting alloys,” NADCA Publication, V215, pp 71-73 (1998).
McDowell, D.L., Fan, J., and Horstemeyer, M.F., “Multi-length scale and analyses of cyclically loaded A356 cast aluminum alloy,” AFS Transactions, 99-136, pp 703-712 (1999).
McDowell, D.L., Gall, K., Horstemeyer, M.F., and Fan, J., “Microstructure-based fatigue modeling of cast A356-T6 alloy,” Engineering Fracture Mechanics, V70, pp 49-80 (2003).