Embed Size (px)
Citation preview
FACULTY OF MEDICLNE AND HEALTH SCEEINCFS
UNMRSM NIALAYSiA SARAWAK
i *.
ýºýýýýý1. týý, .ý
týýt 3
WAIMOM +i 7Mý ý
nid A
týýt .ý...
.'- "',. ' -: ' .ý ,_ý...
sm
Pusat KJlidtmlt Makluinat AXademIk UMVERSTTI MALAYSIA SARAWAK
DECLARATION
We declare that this research originates from our own effort, except for certain facts and citations with
which the sources have been clearly listed in the bibliography.
Sugathathissa a/l Chandradasa (003306)
Chai Chiun Kian (003702)
Adrian Koay Choon Aun (003711)
Lee Ming Yen (003716)
Ani Darwina Abd. Halim (003947)
Jackson Wong Sonn Tag (003986)
Irene Michael Mijel (004114)
Suhaimi Selamat (004196)
Pauline ak Robert Ero (001311)
Eunice Melissa ak Joseph (002934)
Roger Isop ak Laping (002085)
1 Si August 2002
i
ACKNOWLEDGEMENT
We would like this opportunity to extend our deepest gratitude to those who were involved directly or
indirectly in the success of this research.
First of all we would like to thank God for the completion of our research. Also to Universiti
Malaysia Sarawak (UNIMAS) for giving us the privilege to conduct this research in Debak.
Our greatest appreciation goes to, Assoc. Prof. Dr. Yap Sim Bee and Dr. Kamaluddin Bakar
as the coordinators of the Community and Public Health Posting and also as the facilitators of our
group. You have provided us with a lot of materials and even more advice in guiding us towards the
success of this research.
We would like to further extend our greatest appreciation to Prof. Dr. Hashami Bohari
(Deputy Dean of Faculty of Medicine and Health Sciences, UNIMAS), Assoc. Prof. Dr. Mariah
Ahmad (Head of Core Group for Community and Public Health), Assoc. Prof. Dr. Daw Win Kyi, and
Puan Rashidah Abd. Wahab and Puan Nor Aza Bt. Ahmad for their guidance and dedication
throughout the posting.
Many thanks to Dr. Gurmit Singh (The Director of Saratok Hospital), Assoc. Prof. Dr. Henry
Rantai Gudum (Deputy Dean of Faculty of Medicine and Health Sciences, UNIMAS), Mr. Albeny,
Mr. Abang Morni and Puan Willistini Ritikos and all the staff and students of Klinik Kesihatan Debak
for their attendance during the opening ceremonies of the Intervention Programme and also their full
support.
We would also like to thank Penghulu Kadam, Tuai Rumah Albert Sengalang, Tuai Rumah
Raman Ulu Dit, and Tuai Rumah Rajau Terai and all the Intervention Committee members and their
cooperation. Also not forgetting all the residents of Rumah Sengalang, Rumah Ulu Dit and Rumah
Terai. Without their full participation, it would be impossible for us to accomplish our research.
We also include in our list of recognition Jabatan Kerja Raya Debak, Majlis Daerah Betong-
Debak and Polis DiRaja Malaysia, Debak. To Abang Kusairie, Pacik Awang and Abang Belia, thank
you for your help and patience being with us.
11

Our heartiest appreciation to an anonymous donor, who had sponsored our research project,
for his generosity and benevolence.
Last but not least, a very special thank you to all the 11 members of the group for their
commitment and support throughout this research project.
III
ABSTRACT
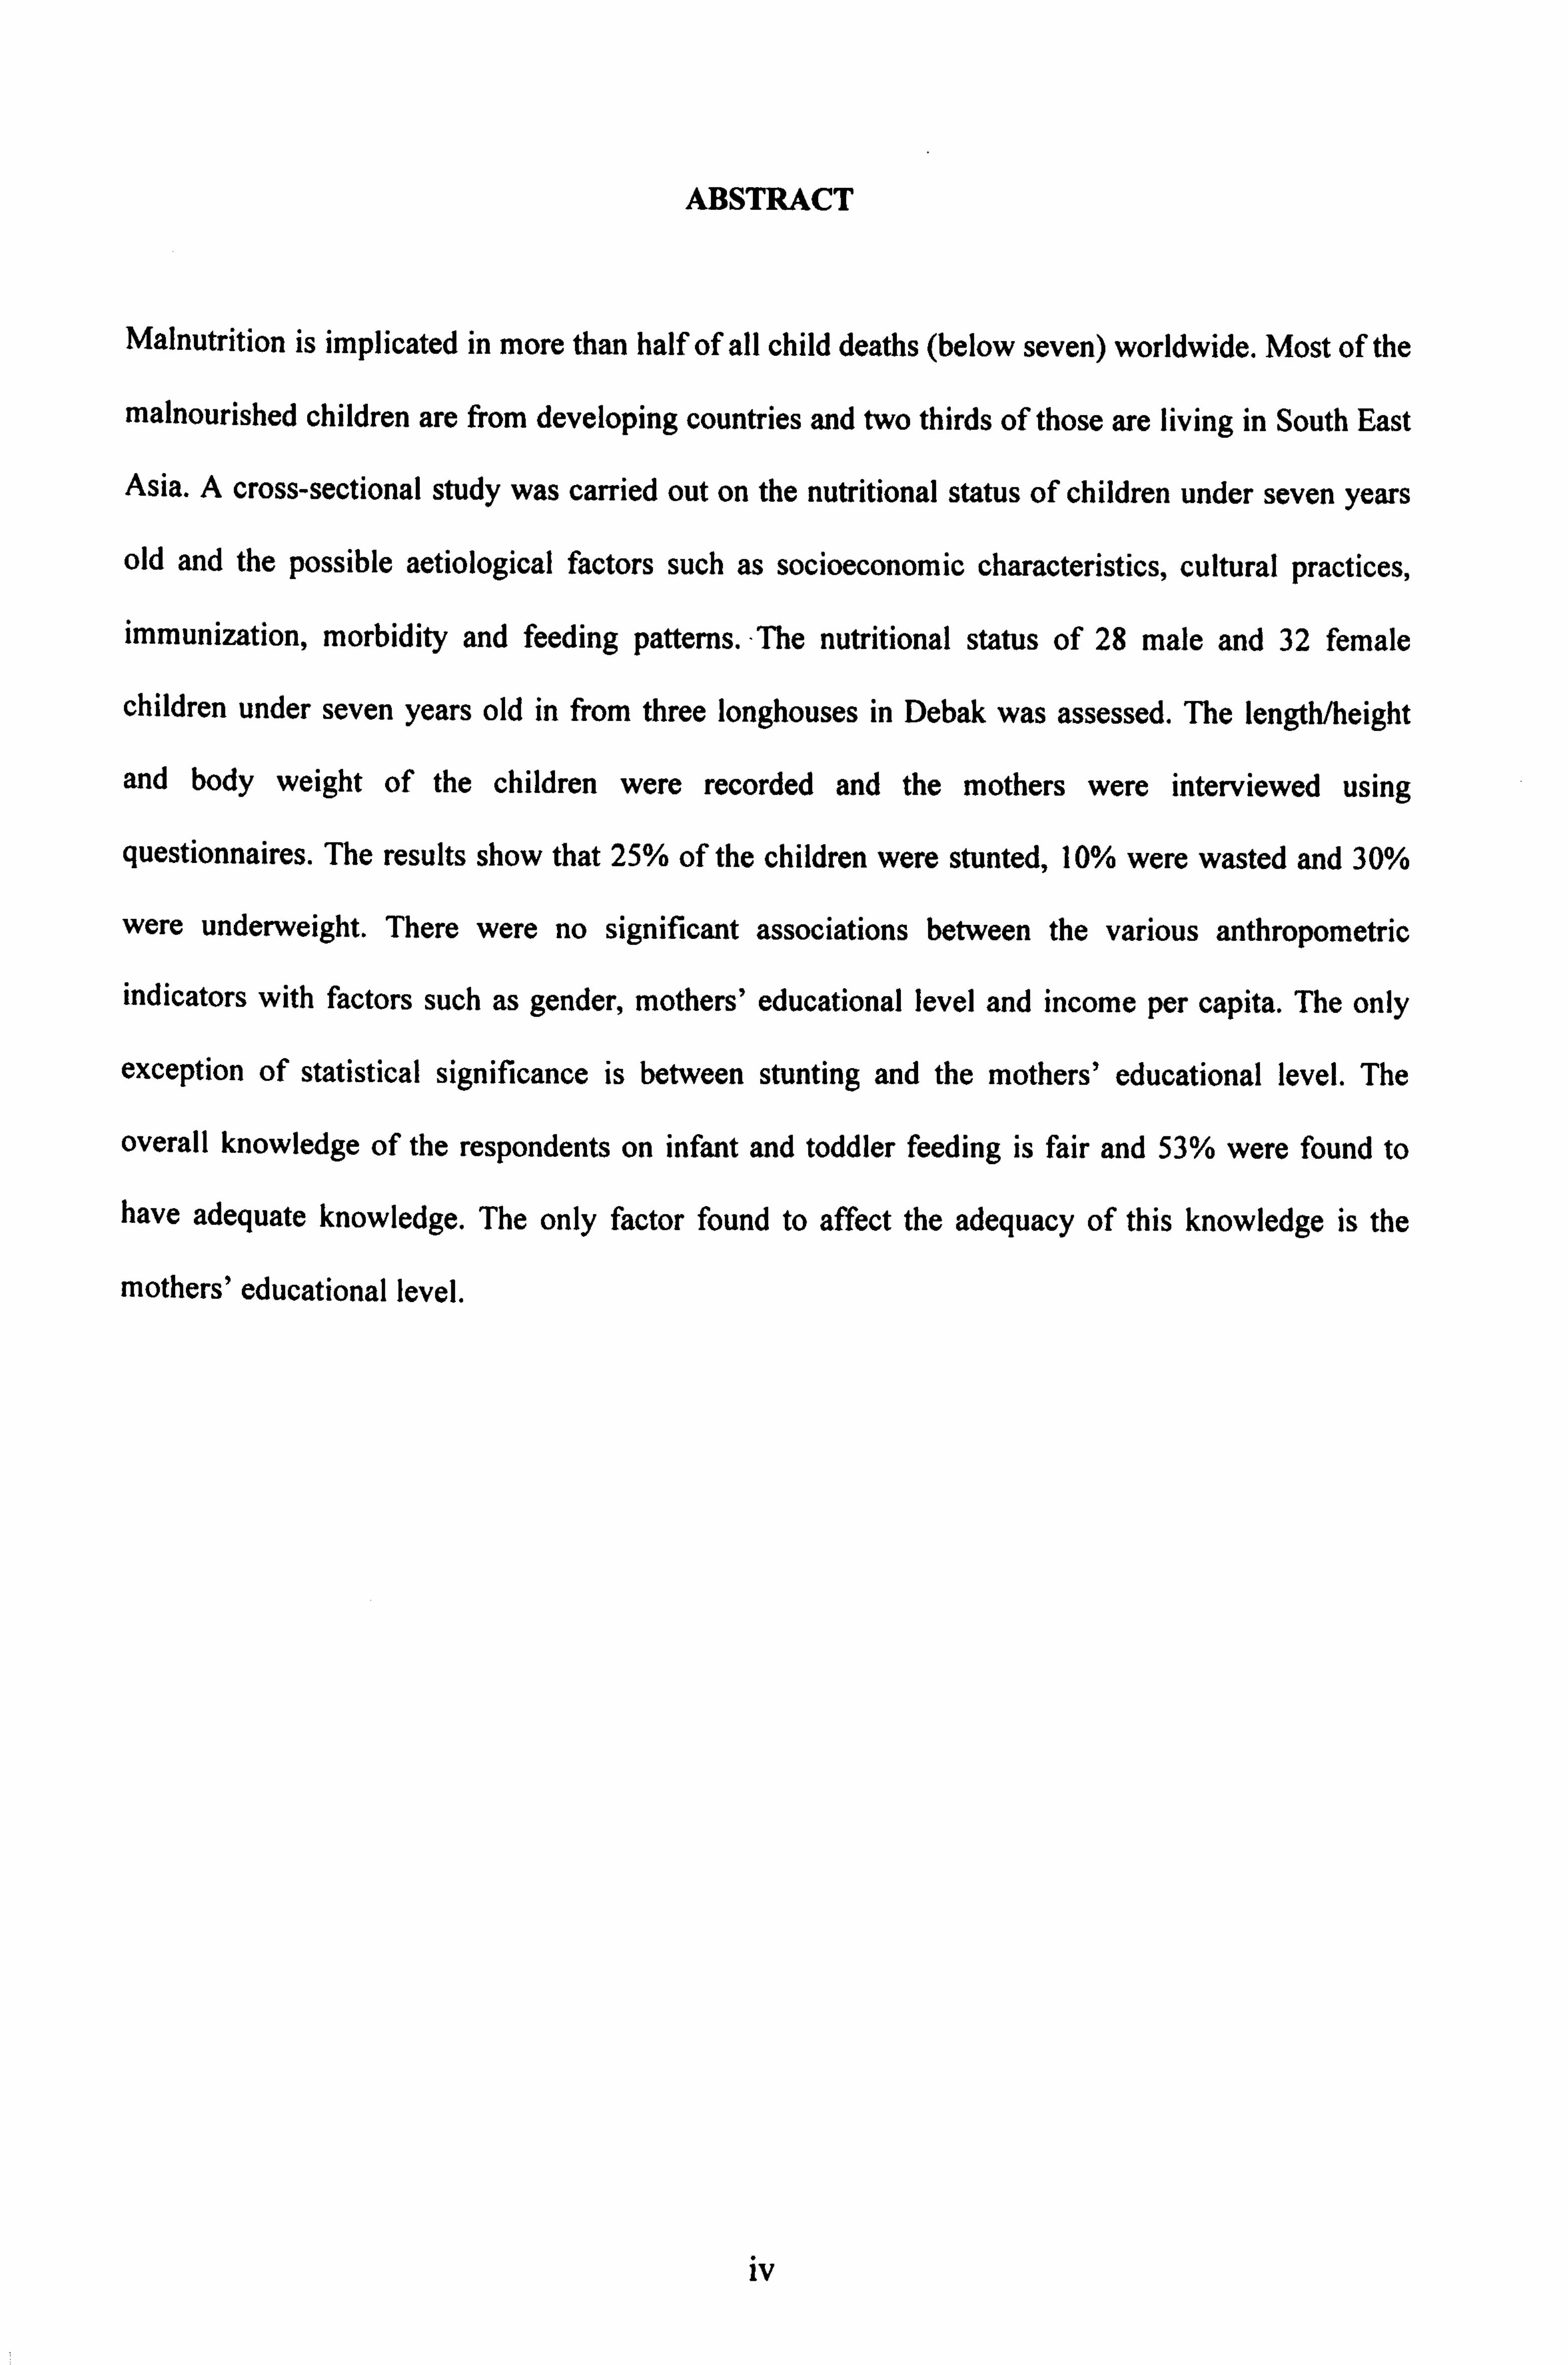
Malnutrition is implicated in more than half of all child deaths (below seven) worldwide. Most of the
malnourished children are from developing countries and two thirds of those are living in South East
Asia. A cross-sectional study was carried out on the nutritional status of children under seven years
old and the possible aetiological factors such as socioeconomic characteristics, cultural practices,
immunization, morbidity and feeding patterns. The nutritional status of 28 male and 32 female
children under seven years old in from three longhouses in Debak was assessed. The length/height
and body weight of the children were recorded and the mothers were interviewed using
questionnaires. The results show that 25% of the children were stunted, 10% were wasted and 30%
were underweight. There were no significant associations between the various anthropometric
indicators with factors such as gender, mothers' educational level and income per capita. The only
exception of statistical significance is between stunting and the mothers' educational level. The
overall knowledge of the respondents on infant and toddler feeding is fair and 53% were found to
have adequate knowledge. The only factor found to affect the adequacy of this knowledge is the
mothers' educational level.
iv
ABSTRAK
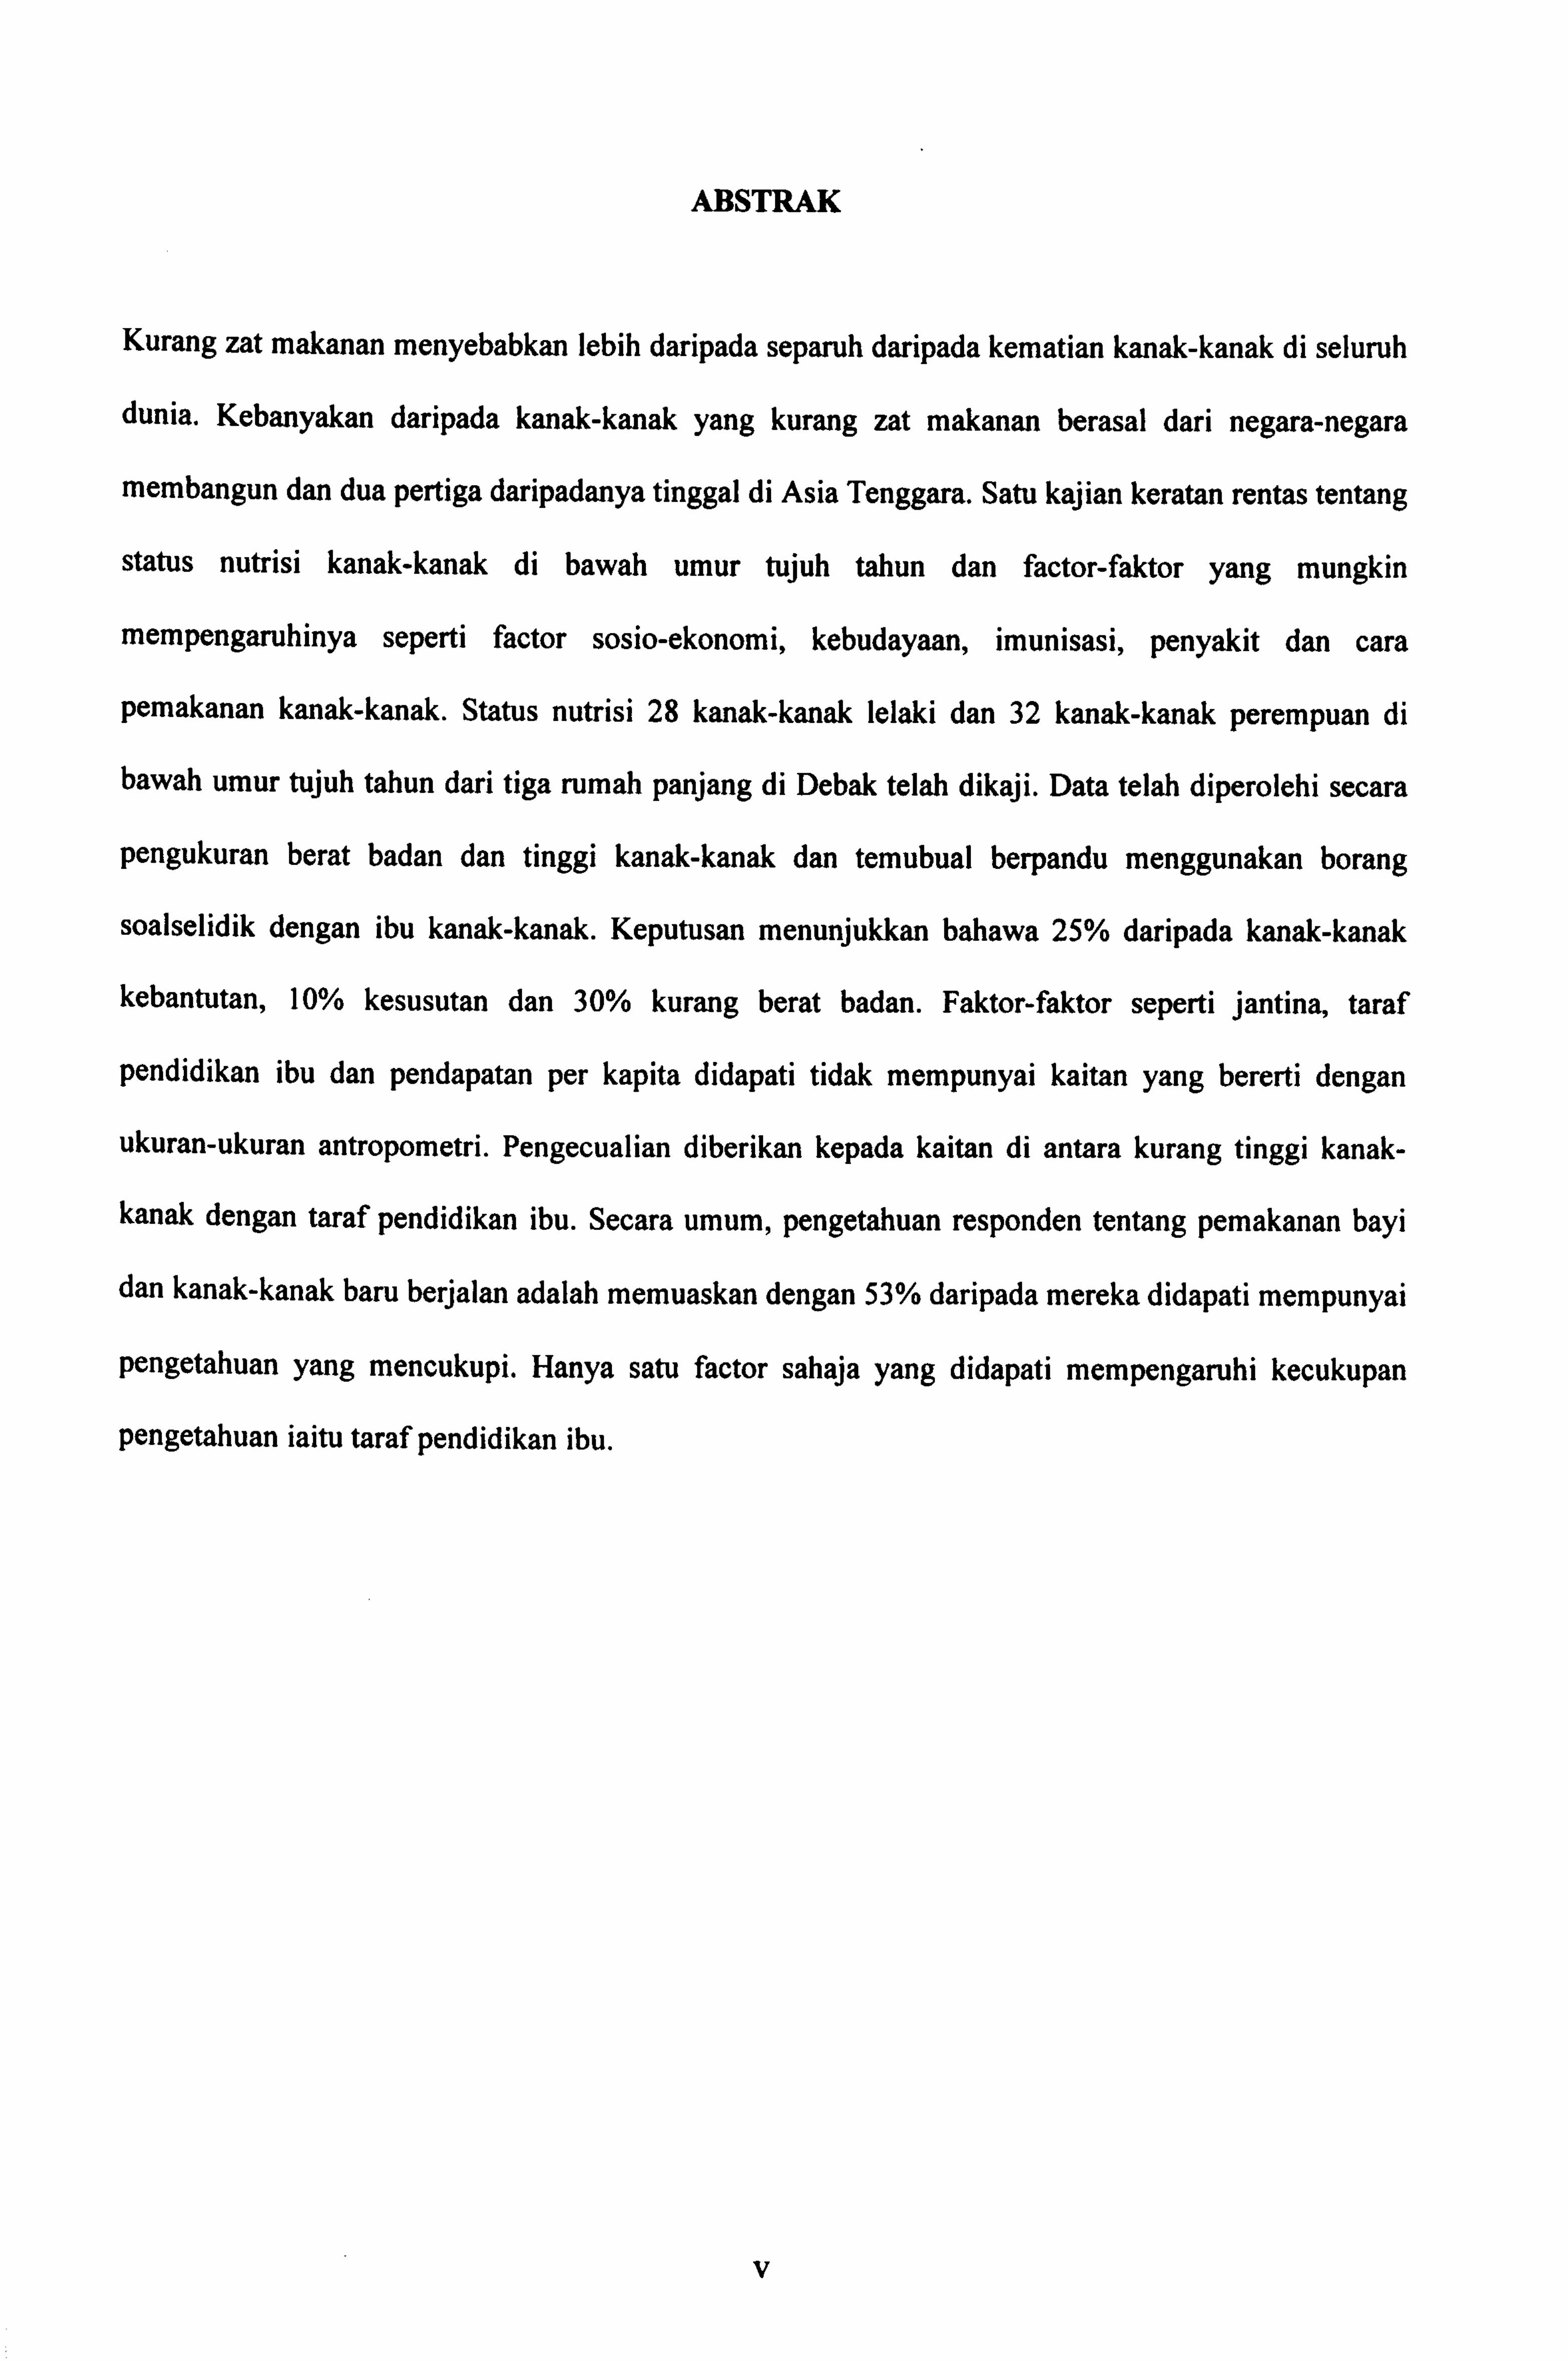
Kurang zat makanan menyebabkan lebih daripada separuh daripada kematian kanak-kanak di seluruh
dunia. Kebanyakan daripada kanak-kanak yang kurang zat makanan berasal dari negara-negara
membangun dan dua pertiga daripadanya tinggal di Asia Tenggara. Satu kajian keratan rentas tentang
status nutrisi kanak-kanak di bawah umur tujuh tahun dan factor-faktor yang mungkin
mempengaruhinya seperti factor sosio-ekonomi, kebudayaan, imunisasi, penyakit dan cara
pemakanan kanak-kanak. Status nutrisi 28 kanak-kanak lelaki dan 32 kanak-kanak perempuan di
bawah umur tujuh tahun dari tiga rumah panjang di Debak telah dikaji. Data telah diperolehi secara
pengukuran berat badan dan tinggi kanak-kanak dan temubual berpandu menggunakan borang
soalselidik dengan ibu kanak-kanak. Keputusan menunjukkan bahawa 25% daripada kanak-kanak
kebantutan, 10% kesusutan dan 30% kurang berat badan. Faktor-faktor seperti jantina, taraf
pendidikan ibu dan pendapatan per kapita didapati tidak mempunyai kaitan yang bererti dengan
ukuran-ukuran antropometri. Pengecualian diberikan kepada kaitan di antara kurang tinggi kanak-
kanak dengan taraf pendidikan ibu. Secara umum, pengetahuan responden tentang pemakanan bayi
dan kanak-kanak baru berjalan adalah memuaskan dengan 53% daripada mereka didapati mempunyai
pengetahuan yang mencukupi. Hanya satu factor sahaja yang didapati mempengaruhi kecukupan
pengetahuan iaitu taraf pendidikan ibu.
V
Pusat KLidmat Makluurat Akademik [JNiVERSrrr MALAYSIA SARAWAK
CONTENTS
Declaration
Acknowledgement
Abstract
Abstrak
Contents
List of Tables
List of Figures
Chapter I
1.1
1.2
Introduction
Study Topic
Study Area
Chapter II Problem Statement and Literature Review
2.1 Introduction
2.2 Global Malnutrition
2.3 Child Nutrition in Malaysia
2.4 Etiology of Protein-Energy Malnutrition
2.5 Our Study
Chapter III Objectives, Hypotheses and Methodology
3.1 Objectives
3.2 Hypotheses
3.3 Methodology
Page
i
11
IV
V
vi
IX
X1
I
I
3
5
5
7
9
14
17
19
19
20
20
V1
Chapter IV Findings of the Survey 26
4.1 Introduction 26
4.2 Socio-Economic Background of the General Population in the Three 27
Longhouses
4.3 The Study Sample 29
4.4 Cultural Factors Affecting Nutritional Status 32
4.5 Illness Recall For The Past Six Months 34
4.6 Immunization Status of Study Sample 35
4.7 Prevalence of Malnutrition Among Children in the Study Sample 36
4.8 Prevalence of Malnutrition According to the Longhouses 38
4.9 Association Between Illness Frequency And Duration With 41
Anthropometric Indicators
4.10 Association Between Socio-Economic Characteristics And 43
Anthropometric Indicators
4.11 Knowledge on Infant and Toddler Feeding 45
4.12 Infant and Toddler Feeding Practices 47
Chapter V Discussion
5.1 Socio-Economic Background of the General Population
5.2 Socio-Economic Background of Study Sample
5.3 Cultural Factors
5.4 Illnesses Recall
5.5 Immunization
5.6 Prevalence Of Protein-Energy Malnutrition
5.7 Knowledge on Infant and Toddler Feeding
5.8 Infant and Toddler Feeding Practices
49
49
50
50
51
51
52
54
55
vii
Chapter VI Limitations and Suggestions
6.1 Study Population
6.2 Food Availability
6.3 Language Barrier
6.4 Anthropometric Measurement
57
57
57
57
58
Chapter VII Conclusion and Recommendations 59
7.1 Conclusion 59
7.2 Recommendations 59
Bibliography 60
Appendix
I Organizational Chart of the Research Team
II Map of the Three Longhouses
III Census Form
IV Questionnaires - English and Than
V Group Activity Photos
63
64
65
66
81
viii
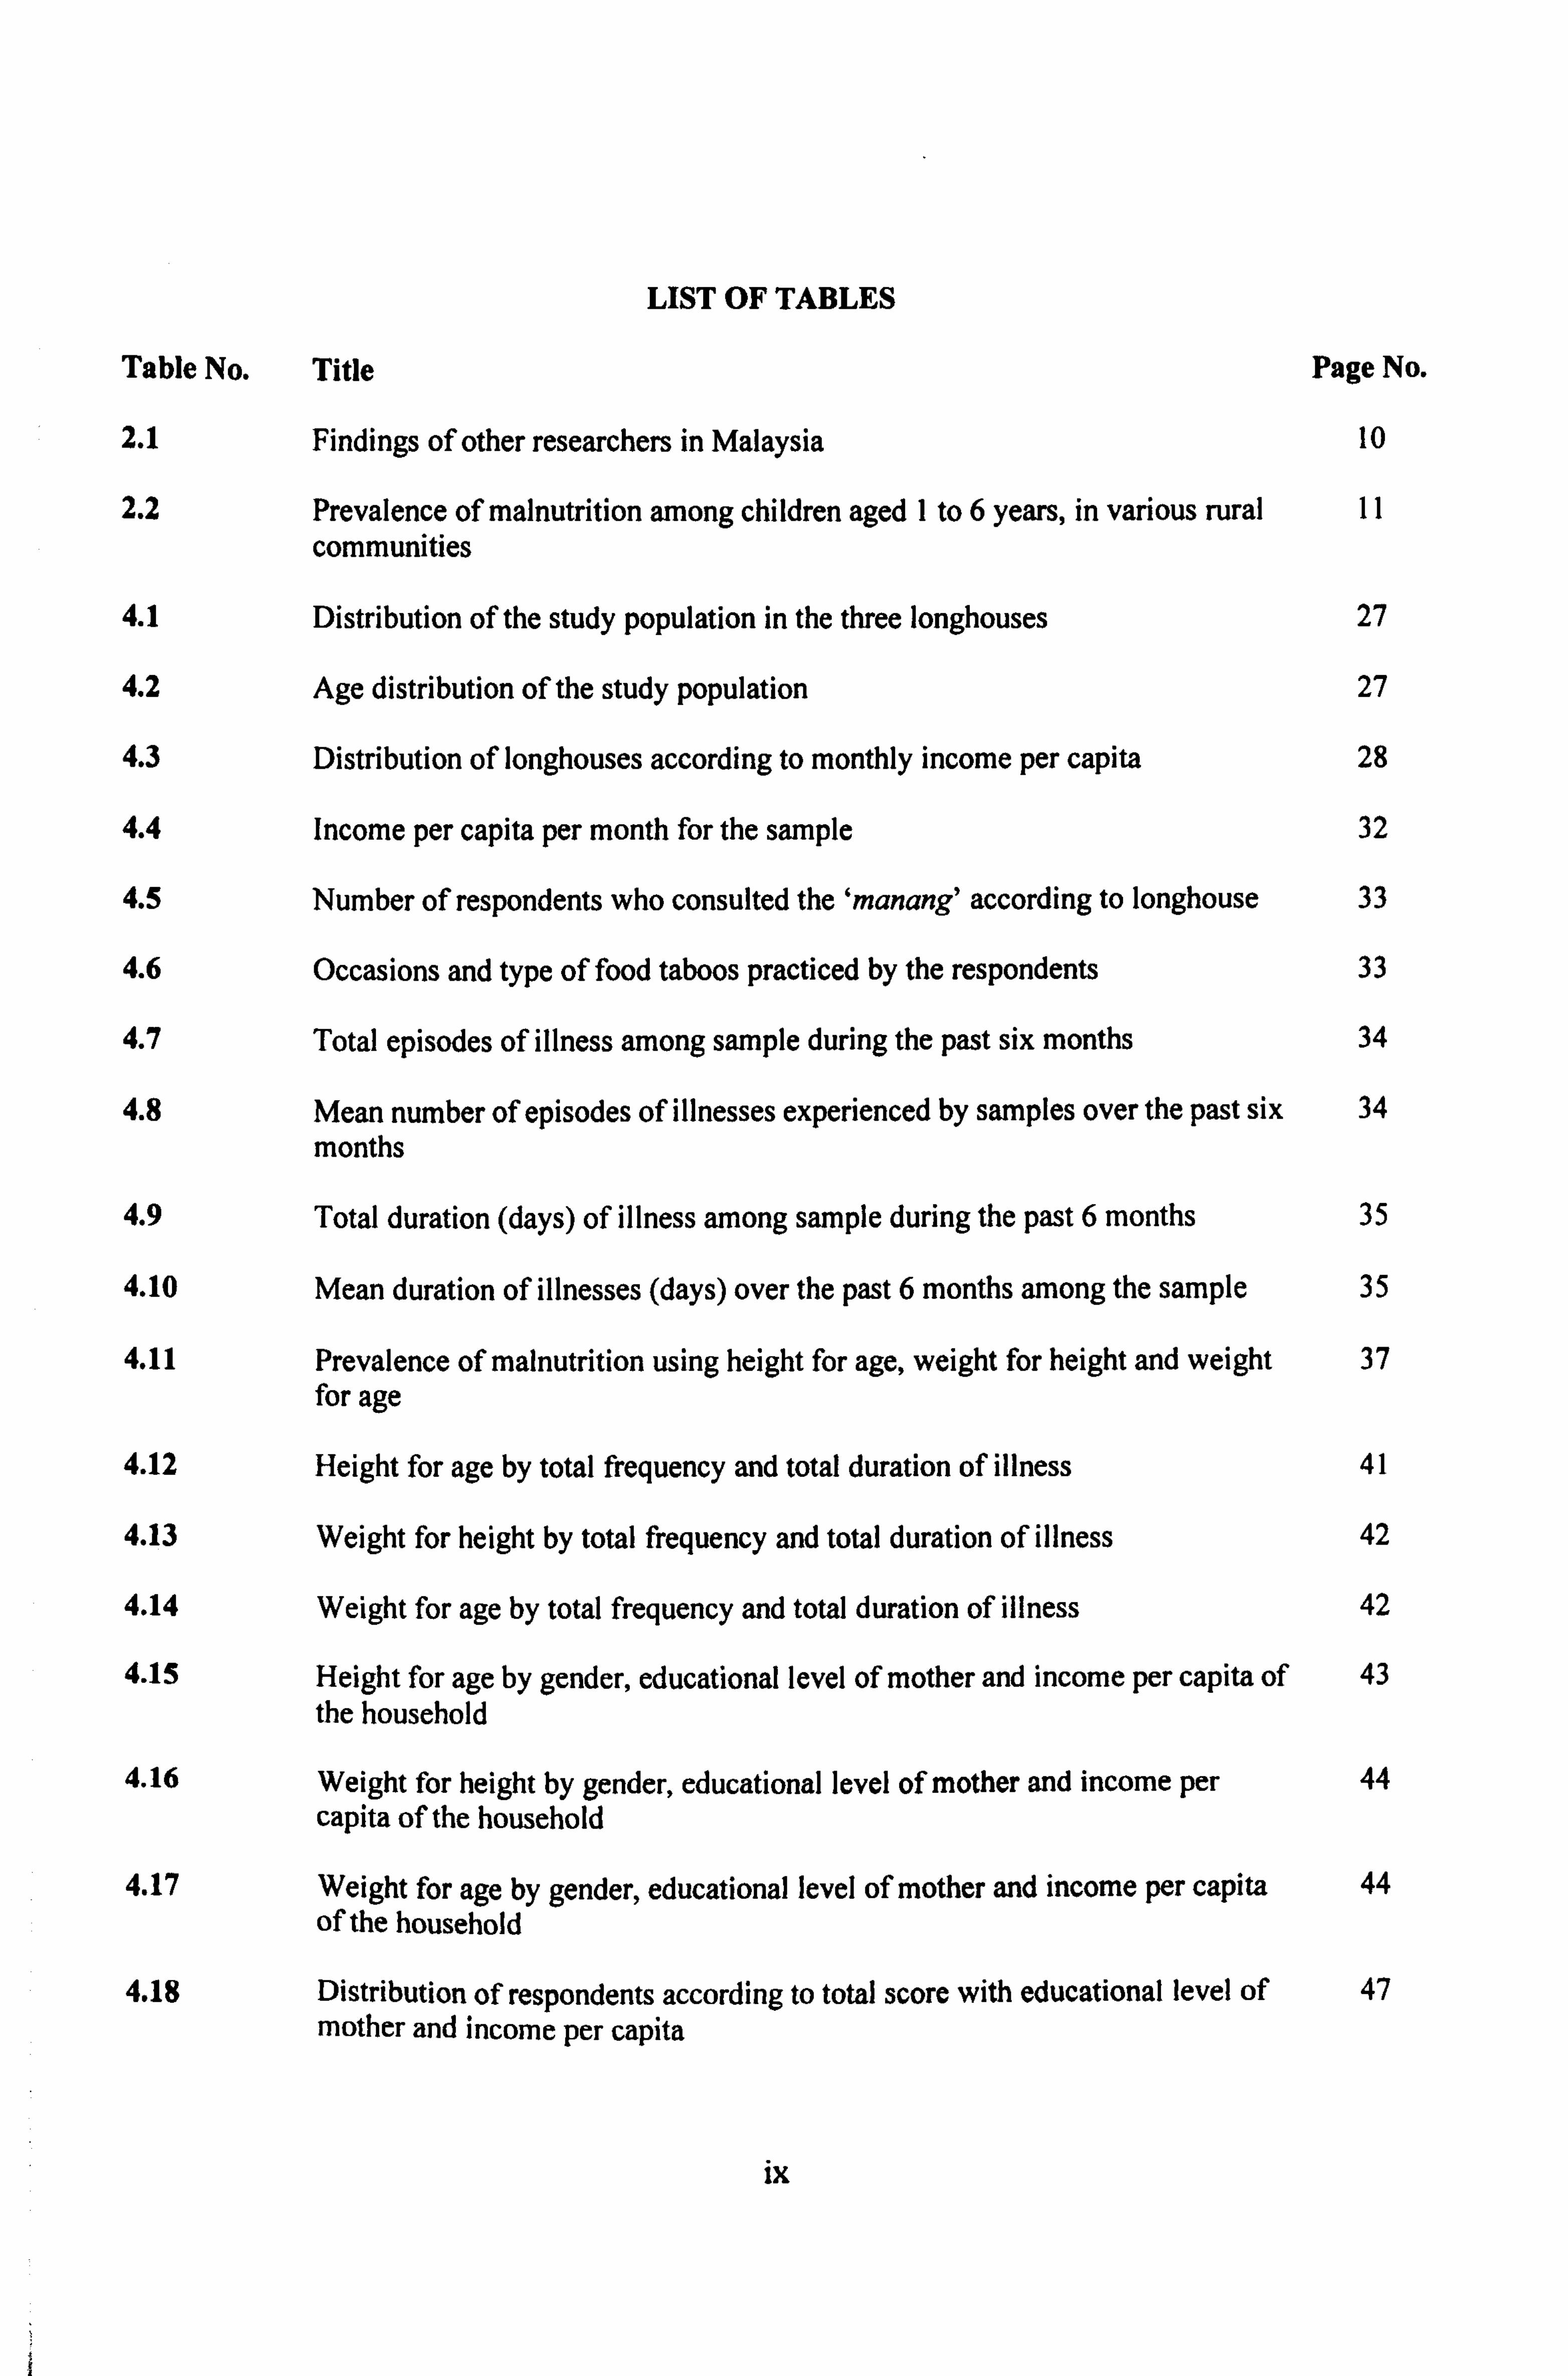
LIST OF TABLES
Table No. Title Page No.
2.1 Findings of other researchers in Malaysia 10
2.2 Prevalence of malnutrition among children aged 1 to 6 years, in various rural 11 communities
4.1 Distribution of the study population in the three longhouses 27
4.2 Age distribution of the study population 27
4.3 Distribution of longhouses according to monthly income per capita 28
4.4 Income per capita per month for the sample 32
4.5 Number of respondents who consulted the `manang' according to longhouse 33
4.6 Occasions and type of food taboos practiced by the respondents 33
4.7 Total episodes of illness among sample during the past six months 34
4.8 Mean number of episodes of illnesses experienced by samples over the past six 34 months
4.9 Total duration (days) of illness among sample during the past 6 months 35
4.10 Mean duration of illnesses (days) over the past 6 months among the sample 35
4.11 Prevalence of malnutrition using height for age, weight for height and weight 37 for age
4.12 Height for age by total frequency and total duration of illness 41
4.13 Weight for height by total frequency and total duration of illness 42
4.14 Weight for age by total frequency and total duration of illness 42
4.15 Height for age by gender, educational level of mother and income per capita of 43 the household
4.16 Weight for height by gender, educational level of mother and income per 44 capita of the household
4.17 Weight for age by gender, educational level of mother and income per capita 44 of the household
4.18 Distribution of respondents according to total score with educational level of 47 mother and income per capita
ix
4.19 Type of infant feeding according to longhouses 48
X
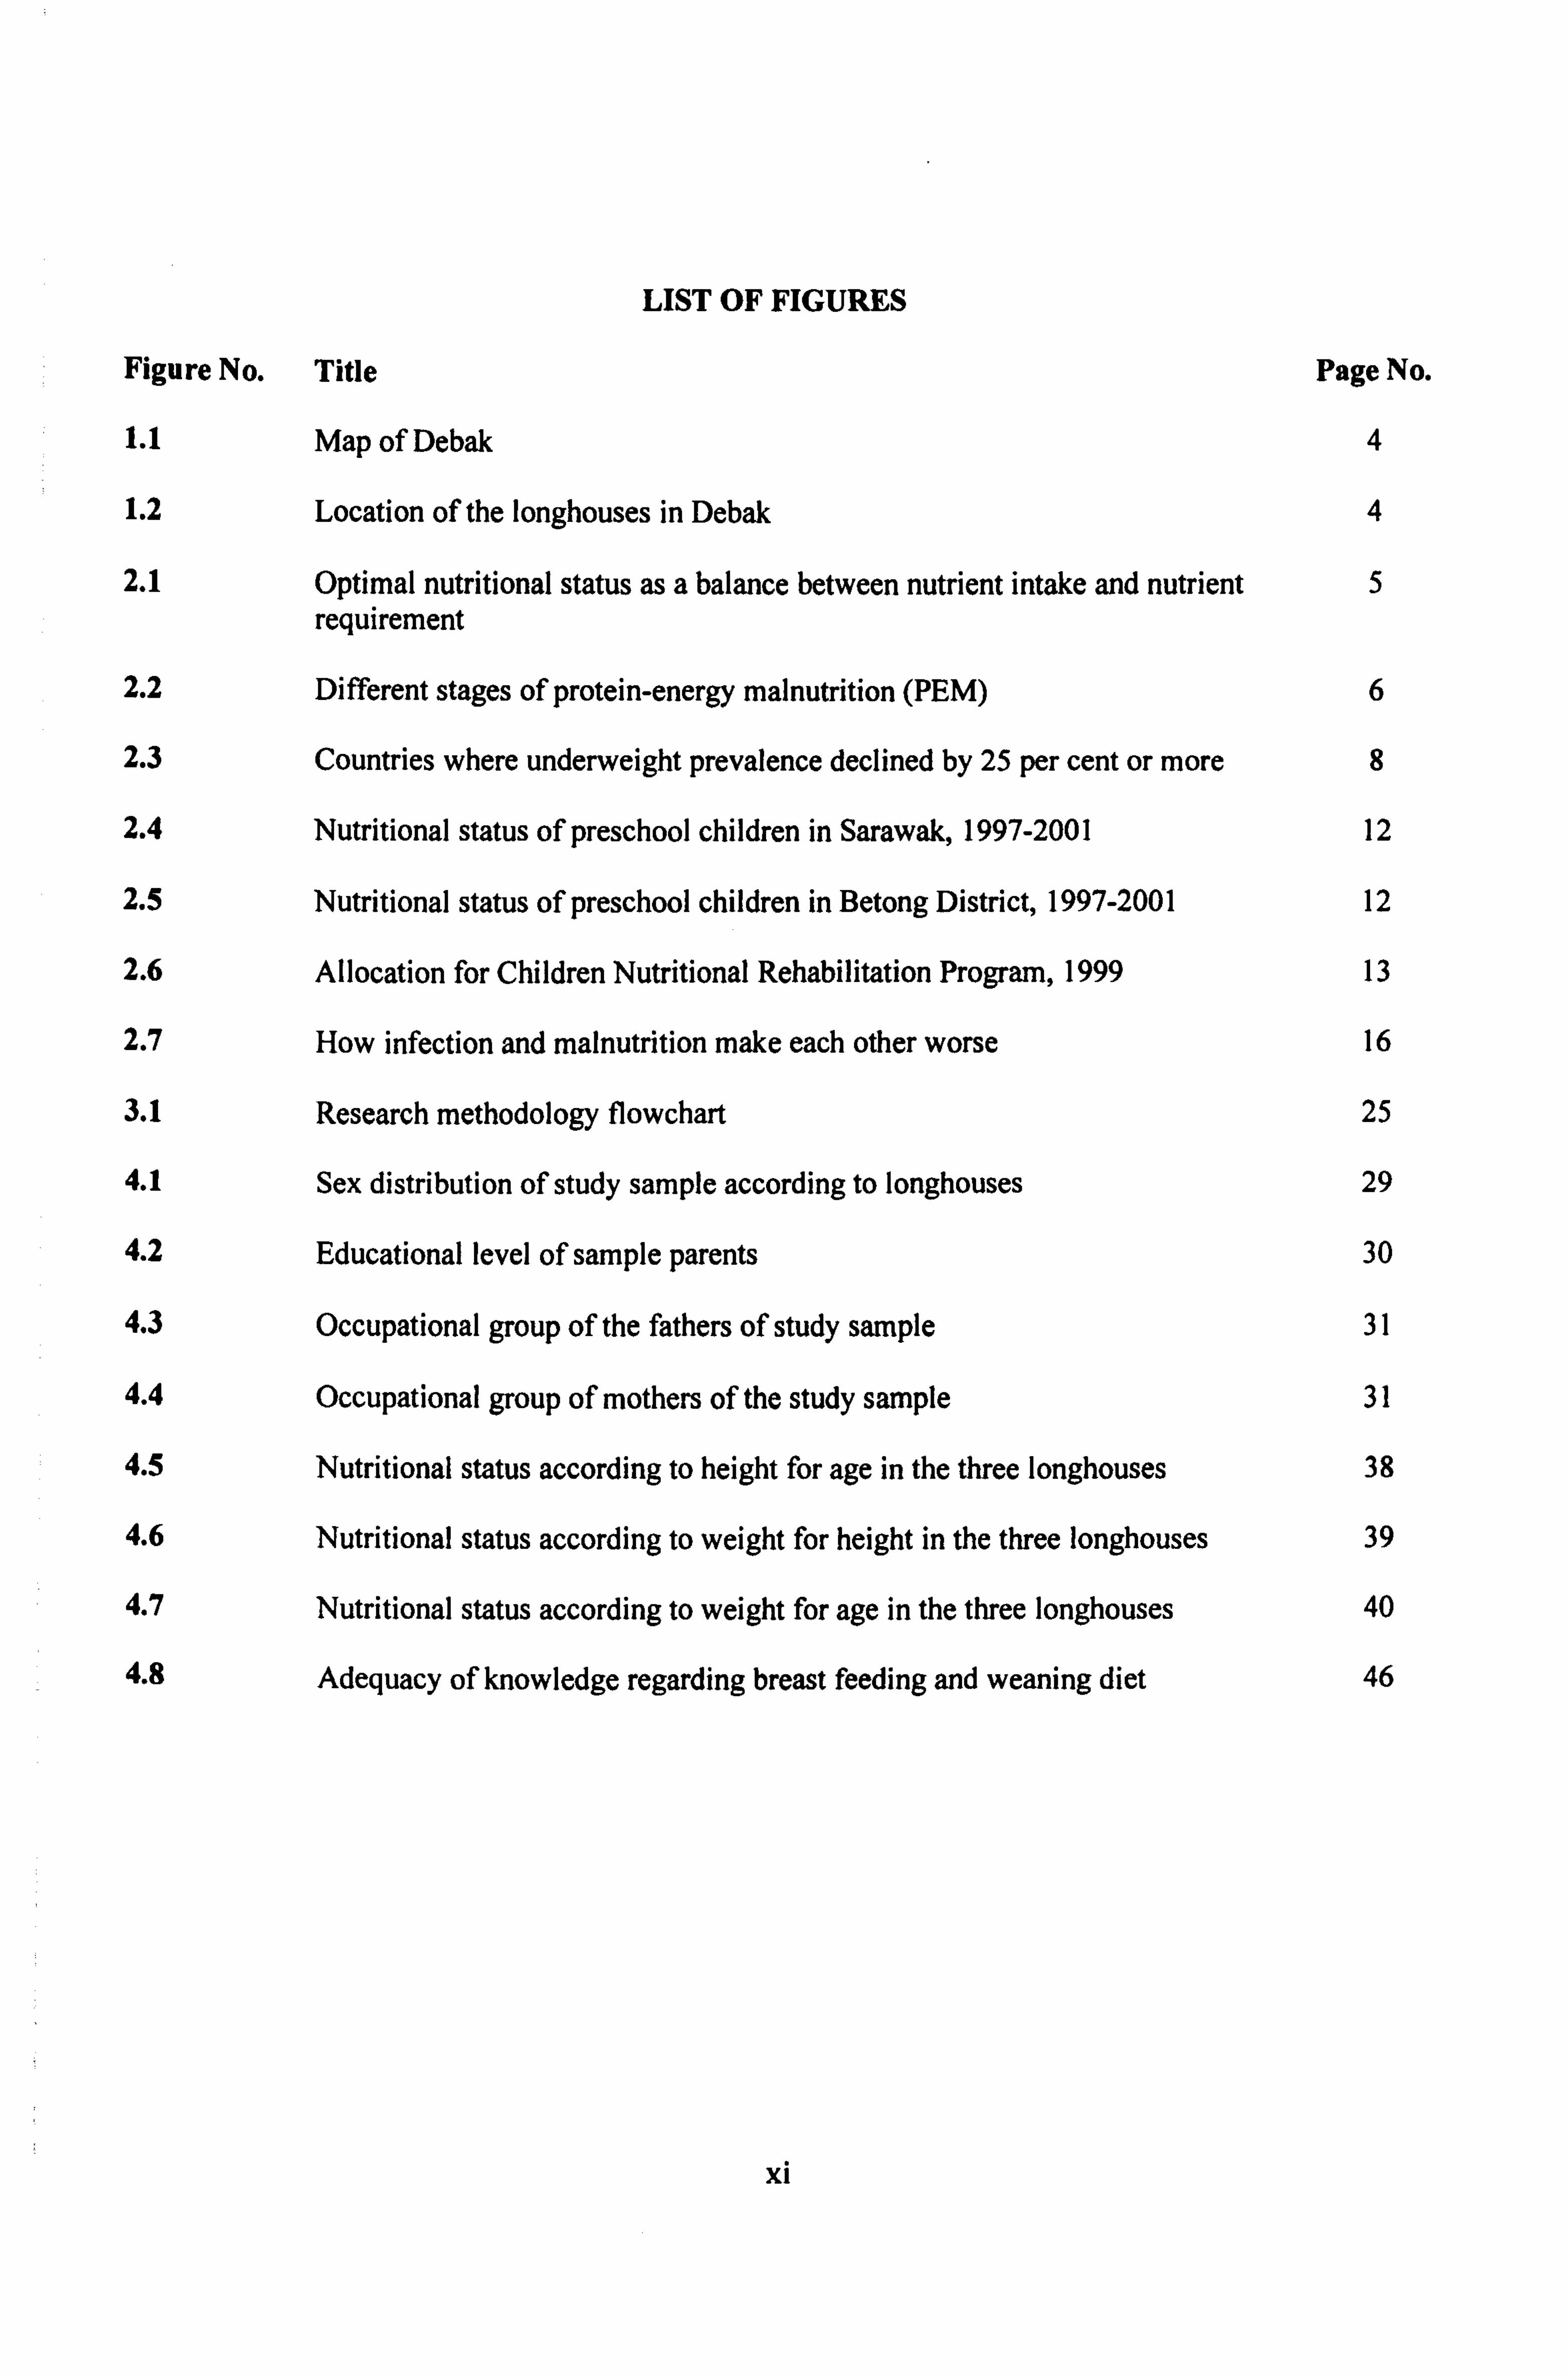
LIST OF FIGURES
Figure No. Title Page No.
1.1 Map of Debak 4
1.2 Location of the longhouses in Debak 4
2.1 Optimal nutritional status as a balance between nutrient intake and nutrient 5 requirement
2.2 Different stages of protein-energy malnutrition (PEM) 6
2.3 Countries where underweight prevalence declined by 25 per cent or more 8
2.4 Nutritional status of preschool children in Sarawak, 1997-2001 12
2.5 Nutritional status of preschool children in Betong District, 1997-2001 12
2.6 Allocation for Children Nutritional Rehabilitation Program, 1999 13
2.7 How infection and malnutrition make each other worse 16
3.1 Research methodology flowchart 25
4.1 Sex distribution of study sample according to longhouses 29
4.2 Educational level of sample parents 30
4.3 Occupational group of the fathers of study sample 31
4.4 Occupational group of mothers of the study sample 31
4.5 Nutritional status according to height for age in the three longhouses 38
4.6 Nutritional status according to weight for height in the three longhouses 39
4.7 Nutritional status according to weight for age in the three longhouses 40
4.8 Adequacy of knowledge regarding breast feeding and weaning diet 46
XI
CHAPTER I
INTRODUCTION
1.1 Study Topic
Food is among the basic necessities of human life. It is in fact the most important requirement for the
continued well-being of any life form. Food in this context does not only cover what we eat but also
encompasses whatever we drink.
Despite this knowledge, many people and even medical practitioners, seldom stop to think
how blessed they are to have food before eating. And many a times, excess food is simply thrown
away into the garbage bin without a second thought. Ironically, there are many other people in other
communities that are literally scavenging for food from garbage bins in order for them to survive.
Many at the more privileged side of the world have never encountered the problem of starvation. For
them food is always on the table whenever they want it because its price and availability are never a
problem for them. On the other hand, many more disadvantaged people from poor countries and
communities across the world have to think of how to bring back food to their tables and also for their
families everyday.
When the breadwinner of the family is unable to bring home food to his family, the problem
of starvation arises. If this problem is allowed to continue, undernutrition leading to protein-energy
malnutrition (PEM) will ensue. PEM covers a spectrum of manifestations of symptoms from mild
cases with some deficits in weight to more severe cases presenting as marasmus or kwashiorkor.
Children are the main victims of this disease because of their increased needs during growth at the
younger age. If these needs are not satisfied, their health will be affected and manifested in their
nutritional status.
`It is implicated in more than half of all the child deaths worldwide -a proportion unmatched
by any infectious disease since the Black Death. Yet it is not an infectious disease. Its ravages extend
to the millions of survivors who are left crippled, chronically vulnerable to illness - and intellectually
1
disabled It imperils women, families and, ultimately, the viability of whole societies. It undermines
the struggle of the United Nations for peace, equity and justice. It is an egregious violation of child
rights that undermines virtually every aspect of UNICEF's work for the survival, protection and full
development of the world's children. ' This description was used by UNICEF (1998) to describe the
worldwide crisis of malnutrition.
Many have seen pictures of malnourished children in the African continent on television or
newspapers. The most vivid ones are the potbellied children with very thin limbs suffering from
marasmus. These children with severely affected nutritional status remind us of the reality of our
world.
`Many children do not get enough of the right foods to eat. They do not grow well, they
become ill, many die or they do not grow up as clever, as healthy, or as tall as they should be. ' These
famous words introduced the first edition of the book Nutrition for Developing Countries by King and
Burgess (1992).
We in Malaysia are fortunate not to have so many of such severe cases of malnutrition
amounting to marasmus, kwashiorkor or both. However, based on reports by other researchers (Chen
et al, 1981; Ismail et al, 1988; Khor & Tee, 1987; Soon & Khor, 1995; Yap, 1985) in Malaysia, there
is still a fraction of malnutrition cases found especially among children in the rural areas. These cases
of undernourished children oftentimes escape the attention of city folks.
This research conducted in Debak, Betong Division of Sarawak will bring our attention and
hopefully the attention of other authorities to the nutritional status of children below the age of seven
years. This study will therefore look into the nutritional status of the children and also the factors that
could possibly play a role in influencing their nutritional status.
2
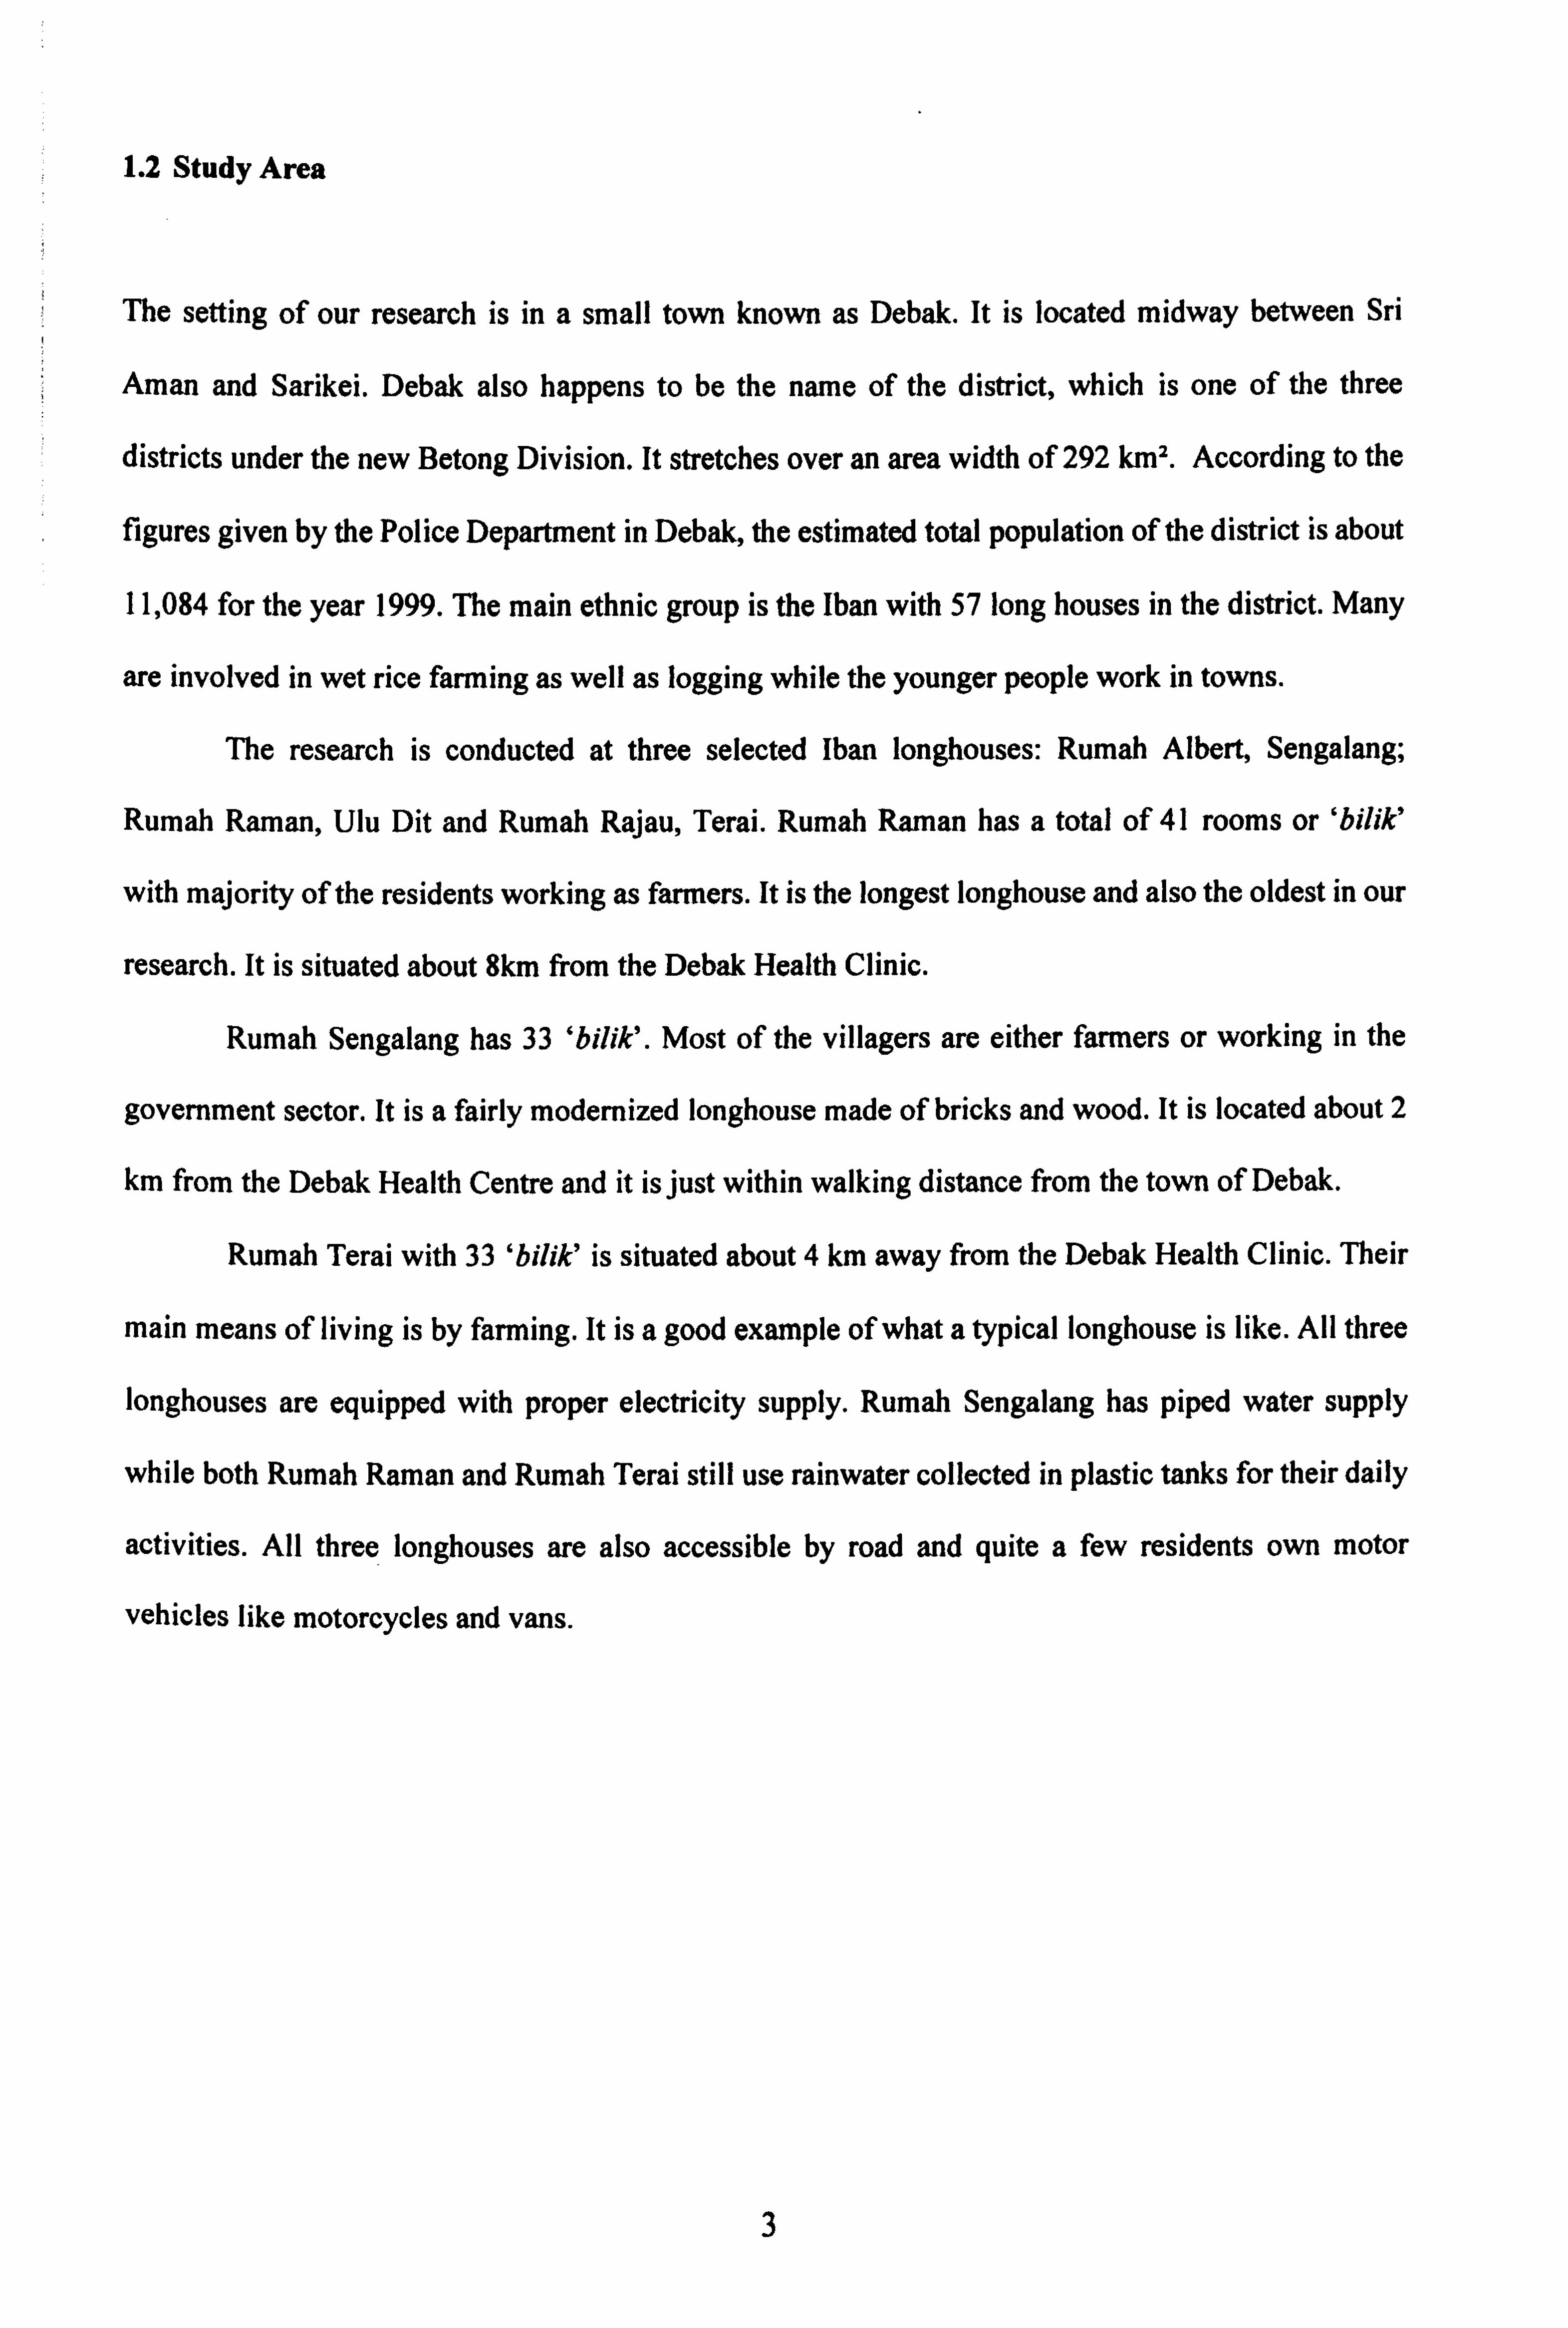
1.2 Study Area
The setting of our research is in a small town known as Debak. It is located midway between Sri
Aman and Sarikei. Debak also happens to be the name of the district, which is one of the three
districts under the new Betong Division. It stretches over an area width of 292 km2. According to the
figures given by the Police Department in Debak, the estimated total population of the district is about
11,084 for the year 1999. The main ethnic group is the Than with 57 long houses in the district. Many
are involved in wet rice farming as well as logging while the younger people work in towns.
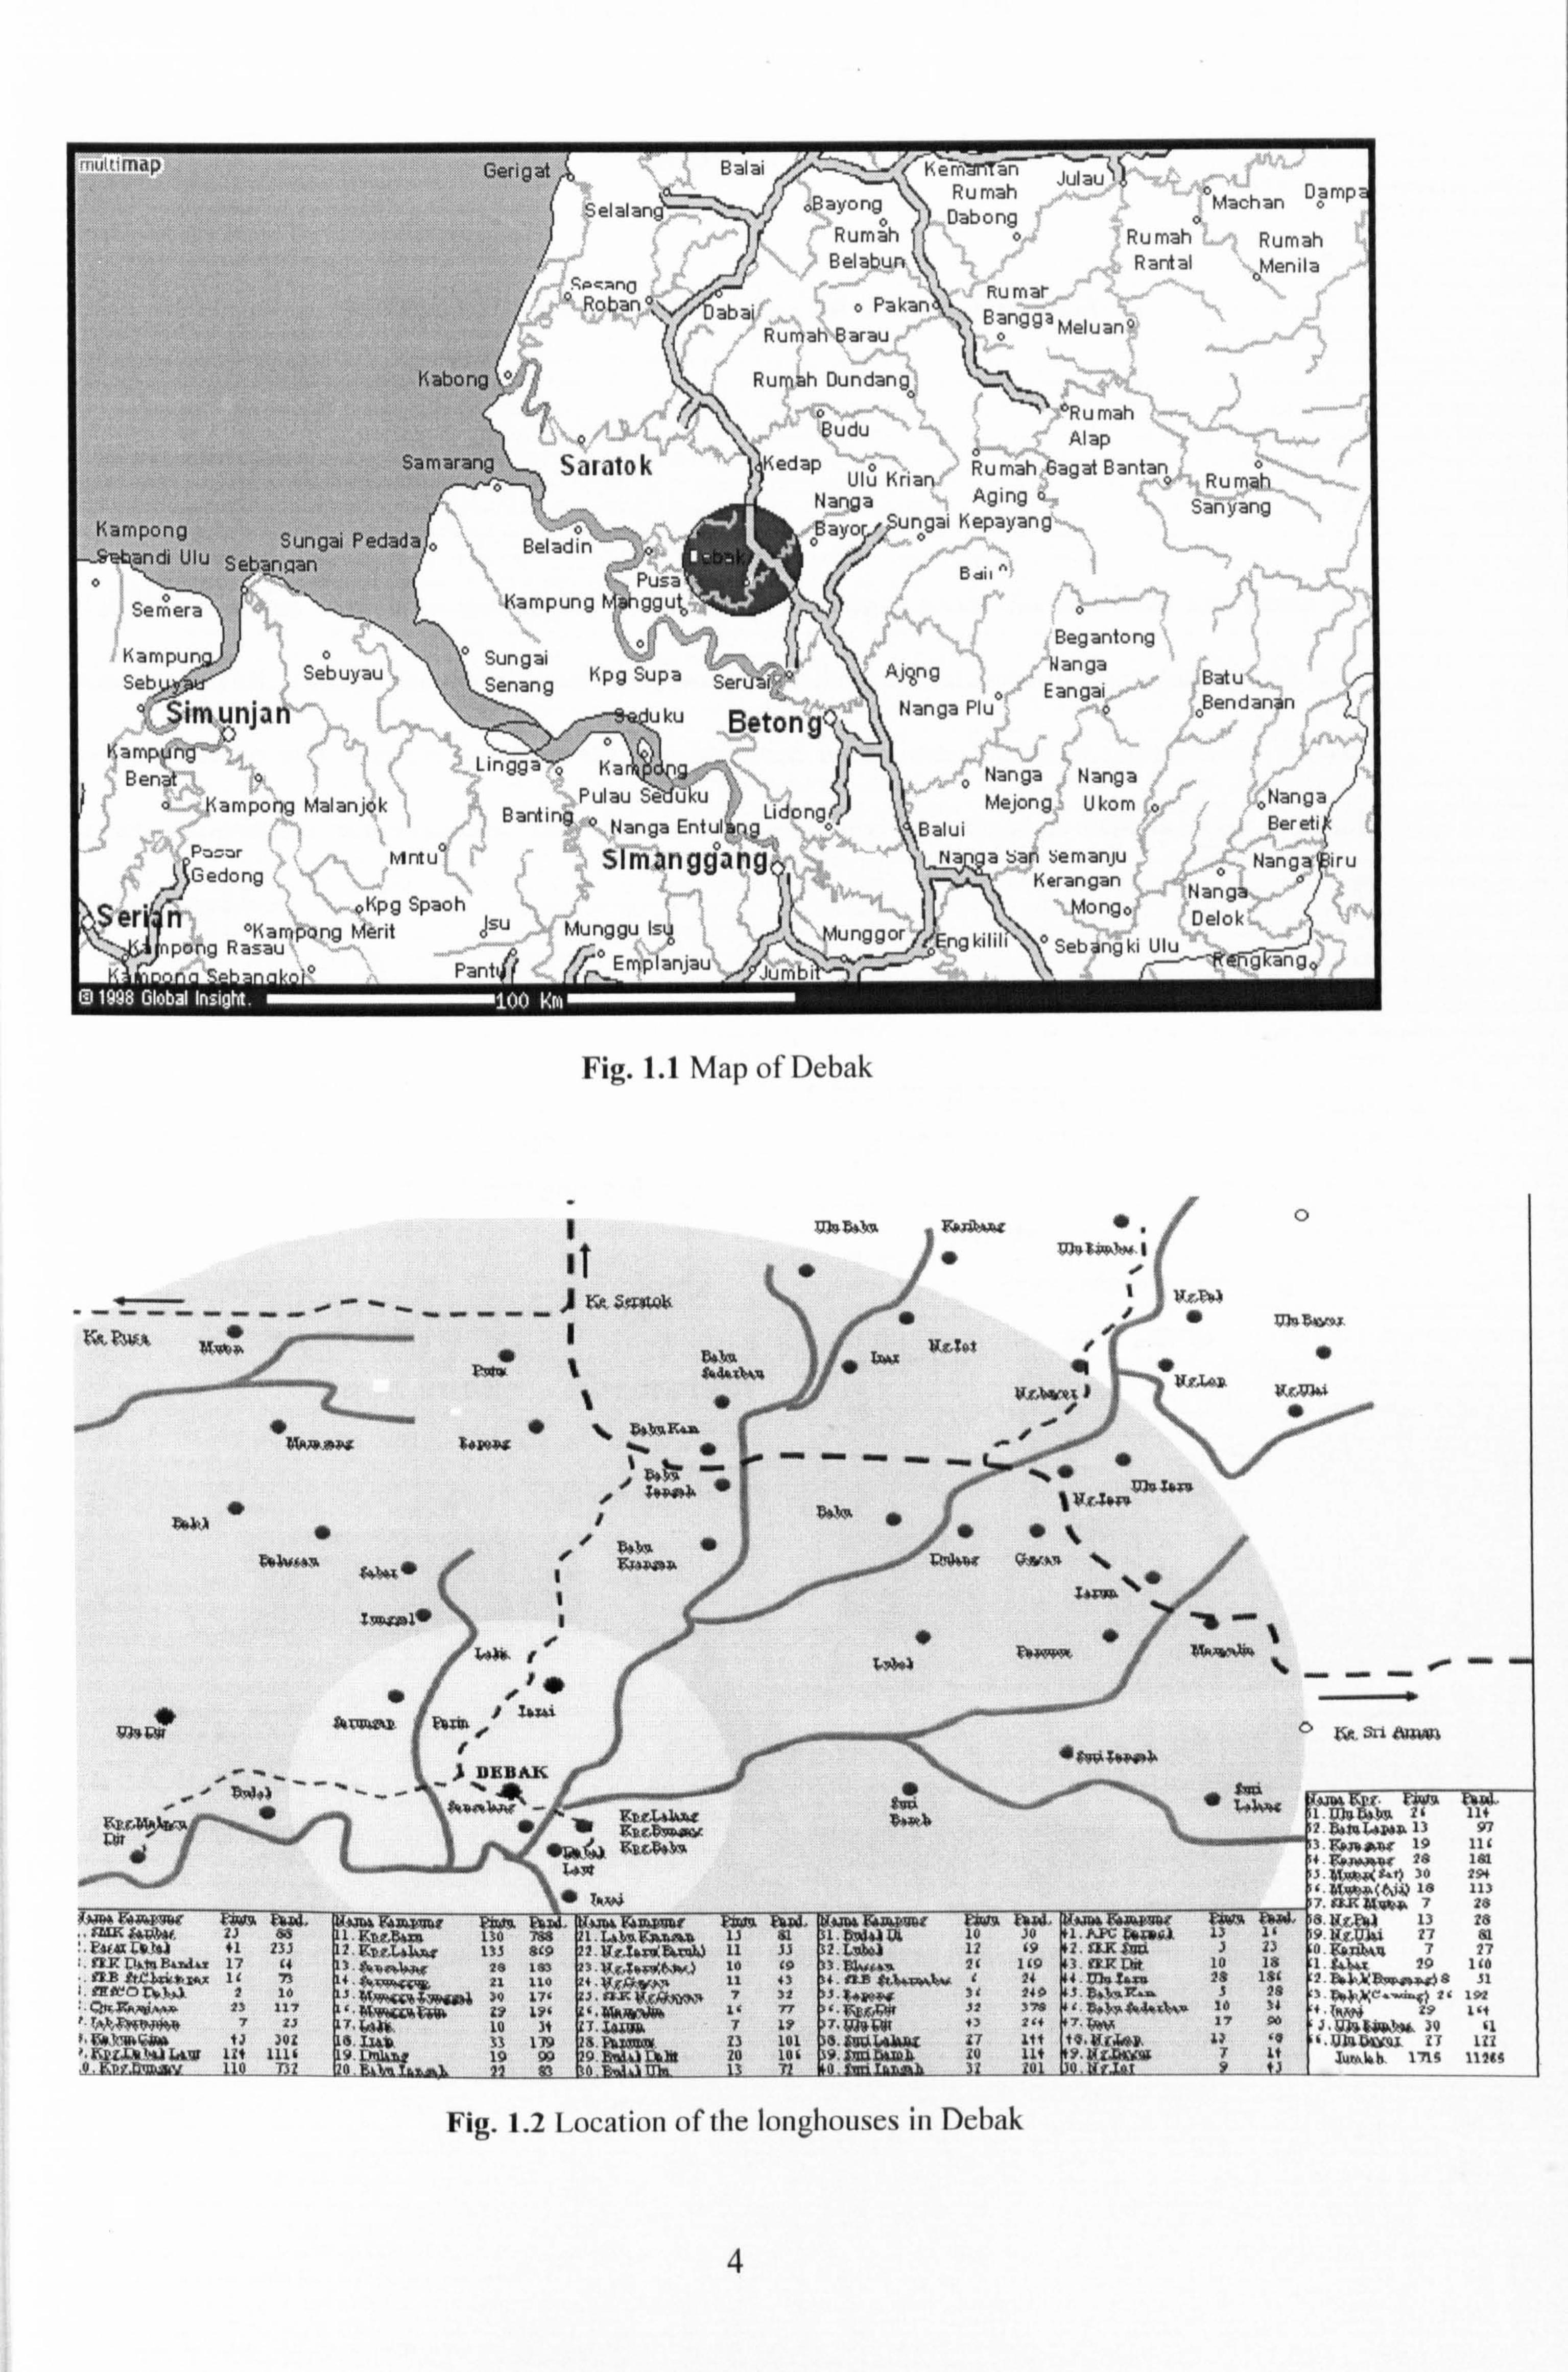
The research is conducted at three selected Than longhouses: Rumah Albert, Sengalang;
Rumah Raman, Ulu Dit and Rumah Rajau, Terai. Rumah Raman has a total of 41 rooms or `bilik'
with majority of the residents working as farmers. It is the longest longhouse and also the oldest in our
research. It is situated about 8km from the Debak Health Clinic.
Rumah Sengalang has 33 `bilik'. Most of the villagers are either farmers or working in the
government sector. It is a fairly modernized longhouse made of bricks and wood. It is located about 2
km from the Debak Health Centre and it is just within walking distance from the town of Debak.
Rumah Terai with 33 `bilik' is situated about 4 km away from the Debak Health Clinic. Their
main means of living is by farming. It is a good example of what a typical longhouse is like. All three
longhouses are equipped with proper electricity supply. Rumah Sengalang has piped water supply
while both Rumah Raman and Rumah Terai still use rainwater collected in plastic tanks for their daily
activities. All three longhouses are also accessible by road and quite a few residents own motor
vehicles like motorcycles and vans.
3
Samaran2 il
. ýr,,,.. ^°"ý
KarnGona ., . _.
(
q ý.:.. -
Saratak
zýungai reaaaa o Beladin ýandi Ulu SeGanaan o\
ý\
;o Panti/ ý%tmpianjau
Fig. 1.1 Map of Debak
Lingga ö ISarýýiS
E: 7iai ý. ̂ ý _ '! ý Fý, erýýtSTýn Julaulý
. _. ý/ ý ýý'ý ^_--ý .; ý, --- human Machara uaniý
... _ 0. /)__. uauJna ý. Rumah Rumah ýýý_"°; Rumah Belabun Rantal Menila
b
If .o PakanBRu mar
anggä Runiah°Barau '1i21
o MeluanQ
, Bayong
Begantong Nanga
. ý ý' Batuxý,,
$udu Alap o v_ Kedap ý=o Rumah 6agat Bantan {öý
Ulu Krian, ' . Rumah Nanga .
Aging ä.,, � Sanyang ýý B YO uö9aii KePaYan8ý
'/',
ý "
ti edit
Ser"C
Beton g
Pulau ý'ed-du Lidong Barding 0 Nanga Entul Rý
,... .. _. o -. simanggangý oKpg Spaoh
II °Kampong Merit asu Munggu lsý pong Rasau A r-o -
"-- tät PWA
ý
itlJw Faw. l. uHr am 7F417ýMi zi Bs
: "kAfOlL4? al 41 237 ff3i Lyt¢ B-3- 17 (1
. 4PE 4tL"ý. AMU 12 73
7, fPPCO L"qLý. 3.2 10 ý. 6, McRh, q, -ww 13 Ilý r. ropýW3N9P 7 17 t; iy, *"lqýyp 1J 302 ý"KPL, C. NSM, IIAIY 12f 1116
_Q, iVL'. jI' 4"
"' `'
1470l. $InR7'AGA Fh0. ¢ iDAi. 4'm F. fACp. W1 ±Zn¢, 134xn 130 788
2. iiBg"L4le4s 133 899 YFNR1lJli 28 183
/. fisýg, 21 110 a. at. p. ýQ7.. 7fVillAd 30 17' `ý"WKi'AýTG 19 19' 7"FýJK. 10 11 811 119 9. L. n1Läl 19 99
_f. kMlraý 12 a
nm ao 1 mongo Delok ° Sebangki Ulu 1- Rýfig
ý 4. . -ý. ý 10 JO 1. APGWW4a 12 L9 2.31. R S&p 2L 1L9 3lTRRit
24 lIIlu Saxa JL 1L9 J 32 3 78 4
. aOýRdl6ý!
fJ Si 7(w
z7 irr ra. gc, iay, äu lit K4. ljz, p"py
Fig. 1.2 Location of the Ionghouses in Debak
4
aernera \f ý_,
o `a"yd'^`ý' ? Bendan4n Nanga Plu ao
o Nanga ; Nanga Mejong= Ukom
Balui
oMenila
; Nangar Ber eti
Na a Sars semanju Nanga iru Kerangan ý, _.... i
0
0
2. patpbApAA 13 3. ItaT9ýPt 19 f. l; pdydlyi 28 3. ySmpýo( R. tj 30
P, AL1*w. tAtii? 10 7. üR A[yg. y, 7 8. Ag, Eyj 13 28 9. HF. Akl 27 81 O. giA7M6 7 27 1. Part 29 1f0 2. ZýJalt&wwy, ýy8 51
21 192 1. iRFAy 29 114 J. AYlý, kss. 30 f1 c"A1GSº1NF. 37 l12
Iuu kb 171; 1126s
Pusat Kbidmat Makluuat Akademik tJNWERSITI MALAYSIA SARAWAK
CHAPTER II
2.1 Introduction
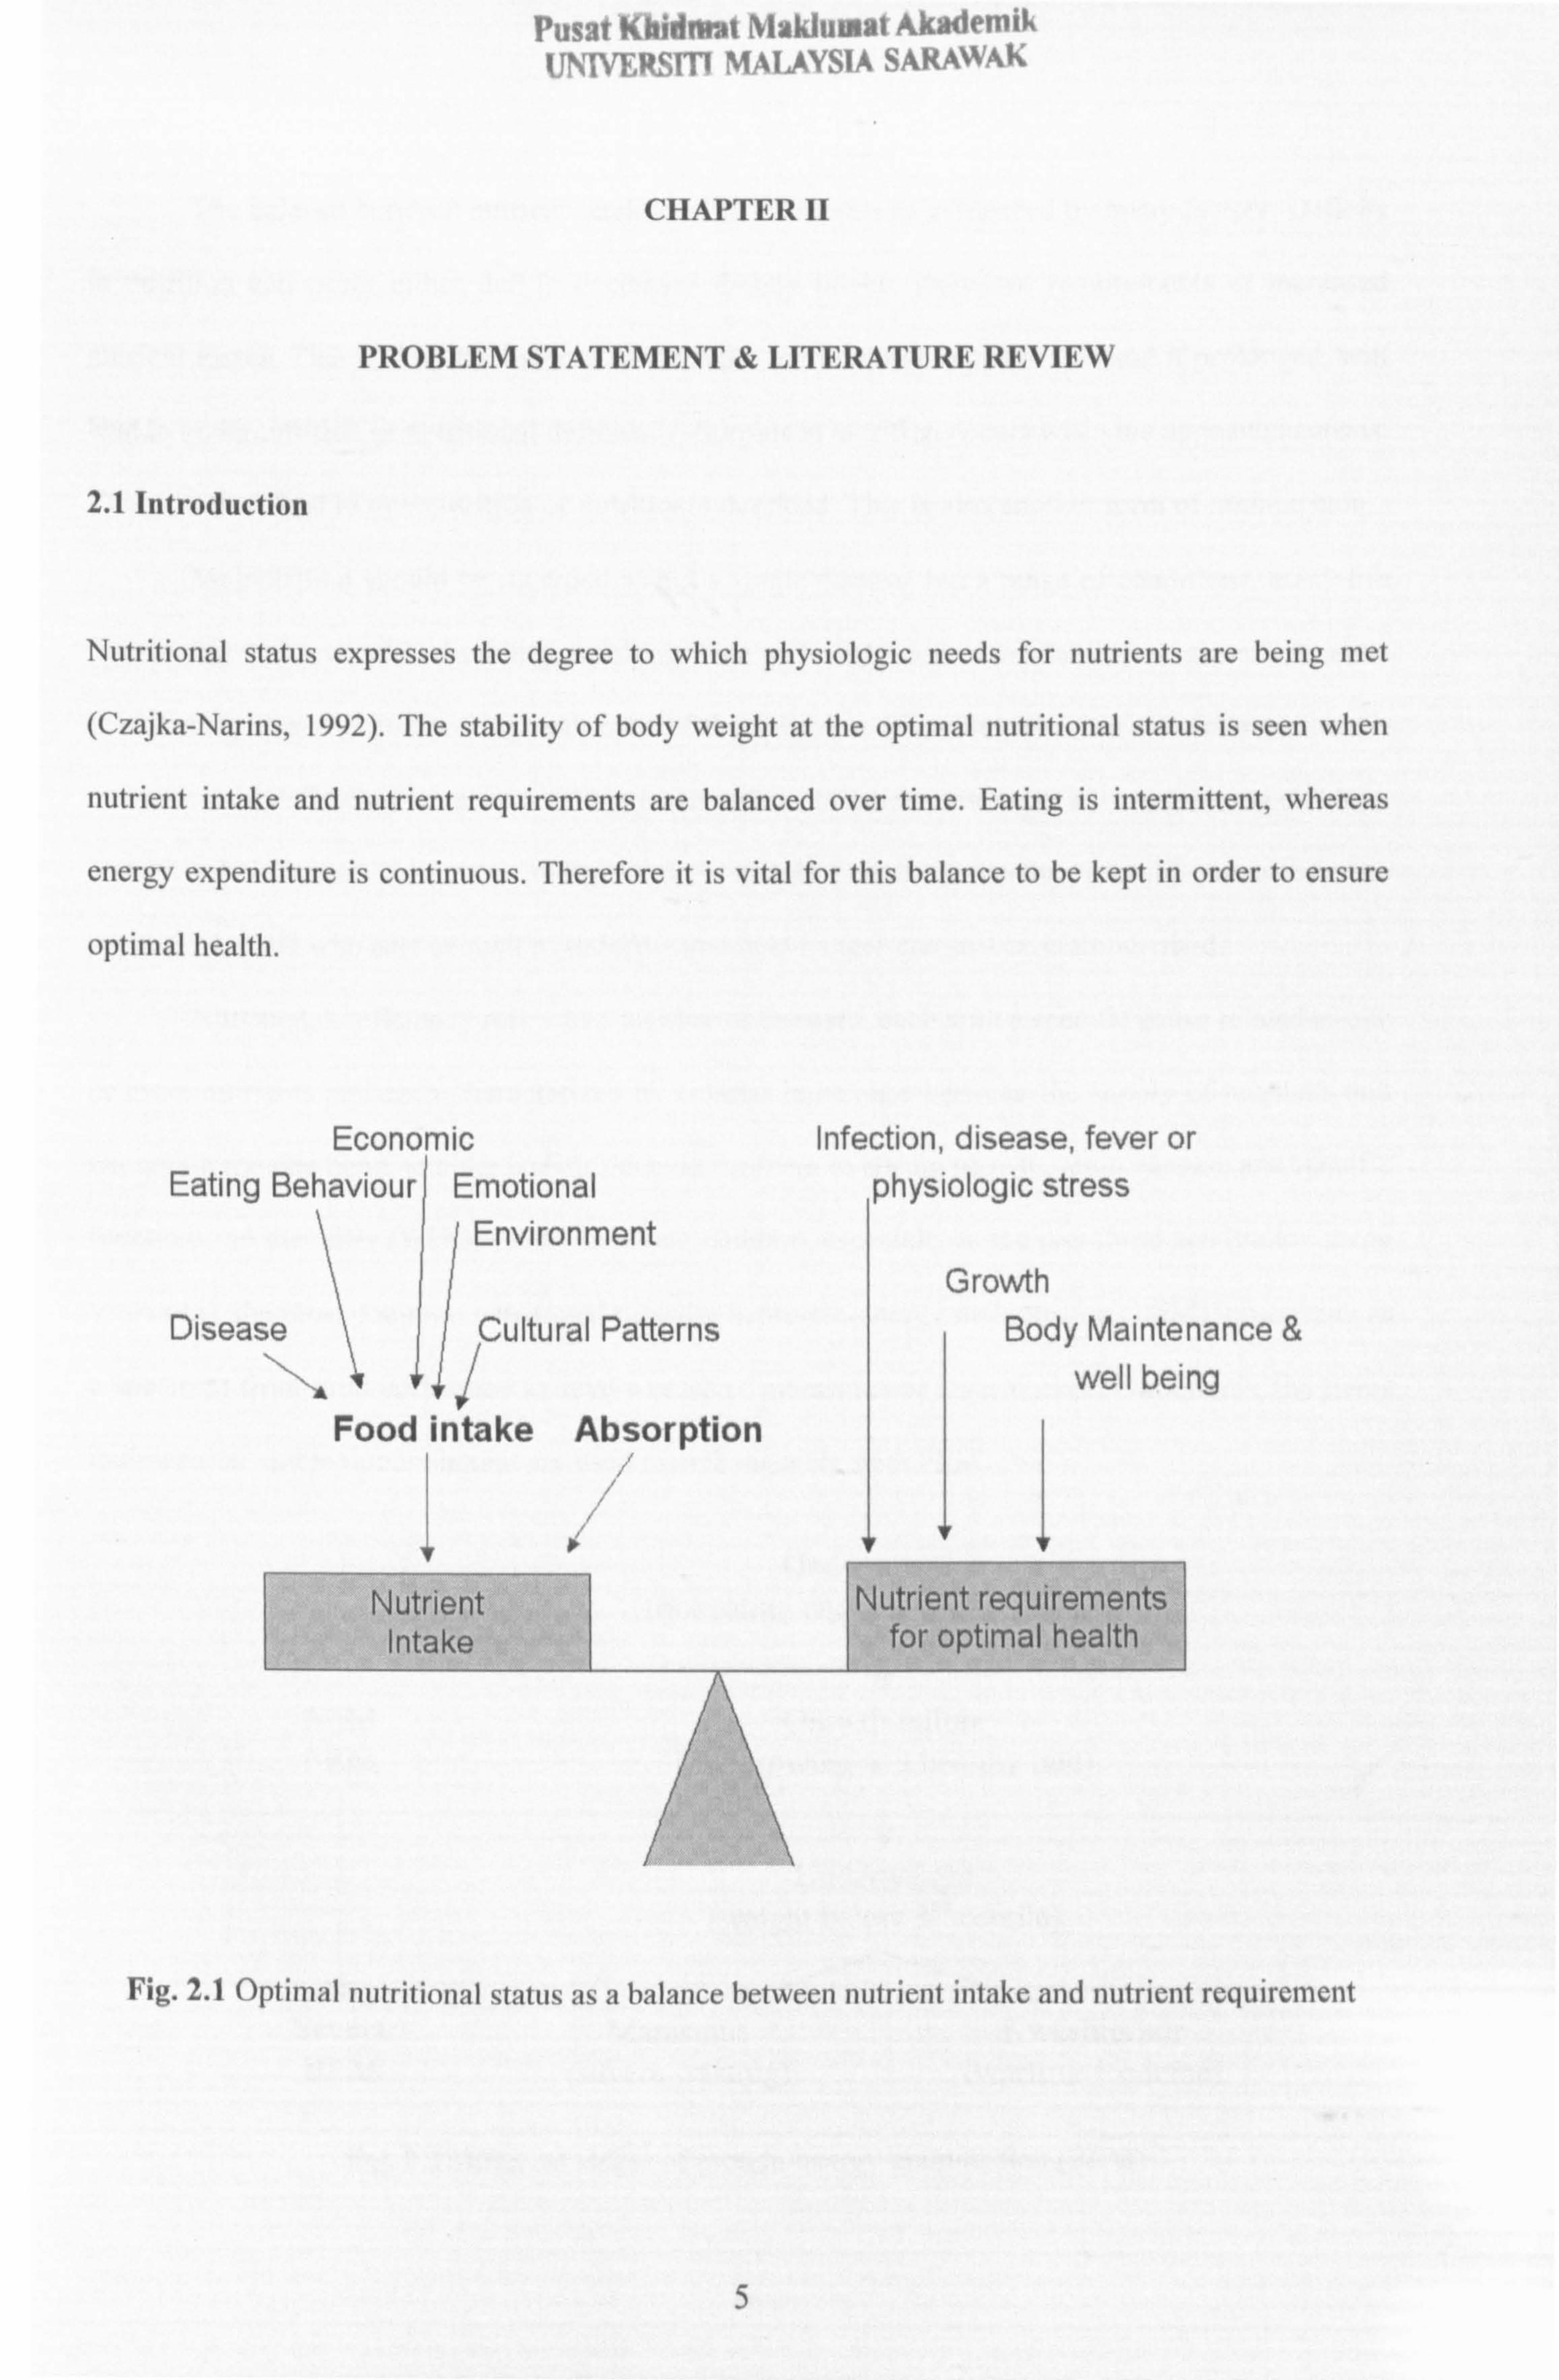
Nutritional status expresses the degree to which physiologic needs for nutrients are being met
(Czajka-Narins, 1992). The stability of body weight at the optimal nutritional status is seen when
nutrient intake and nutrient requirements are balanced over time. Eating is intermittent, whereas
energy expenditure is continuous. Therefore it is vital for this balance to be kept in order to ensure
optimal health.
PROBLEM STATEMENT & LITERATURE REVIEW
Economic Infection, disease, fever or Eating Behaviour Emotional physiologic stress
I Environment
Disease Cultural Patterns Growth
Body Maintenance &
well being ýs 111 Food intake Absorption
T
Nutrient Intake
1! Nutrient requirements
for optimal health
Fig. 2.1 Optimal nutritional status as a balance between nutrient intake and nutrient requirement
5
The balance between nutrient intake and requirements is influenced by many factors. Deficits
in nutrition can occur either due to decreased dietary intake, increased requirements or increased
nutrient losses. This will tip the balance towards the nutrient requirements side and if prolonged, will
lead to undernutrition or nutritional deficiency. Surplus in nutrition occurs when the opposite happens.
This will then lead to overnutrition or nutritional overload. This is also another form of malnutrition.
Malnutrition should be regarded as not a single disease, but a range of conditions, many life
threatening or irreversible disabling, resulting from an imbalanced in availability or use of nutrients.
In our study, we will be covering both ends of the spectrum of malnutrition but our main concern is
on nutritional deficiency because it causes more severe complications, especially to growing children.
Nutritional deficiency is not, as many think, a simple matter of whether a child can satisfy her
appetite. A child who eats enough to satisfy immediate hunger can still be malnourished.
Nutritional deficiency refers to a number of diseases, each with a specific cause related to one
or more nutrients and each characterized by cellular imbalance between the supply of nutrients and
energy on the one hand, and the body's demand for them to ensure growth, maintenance, and specific
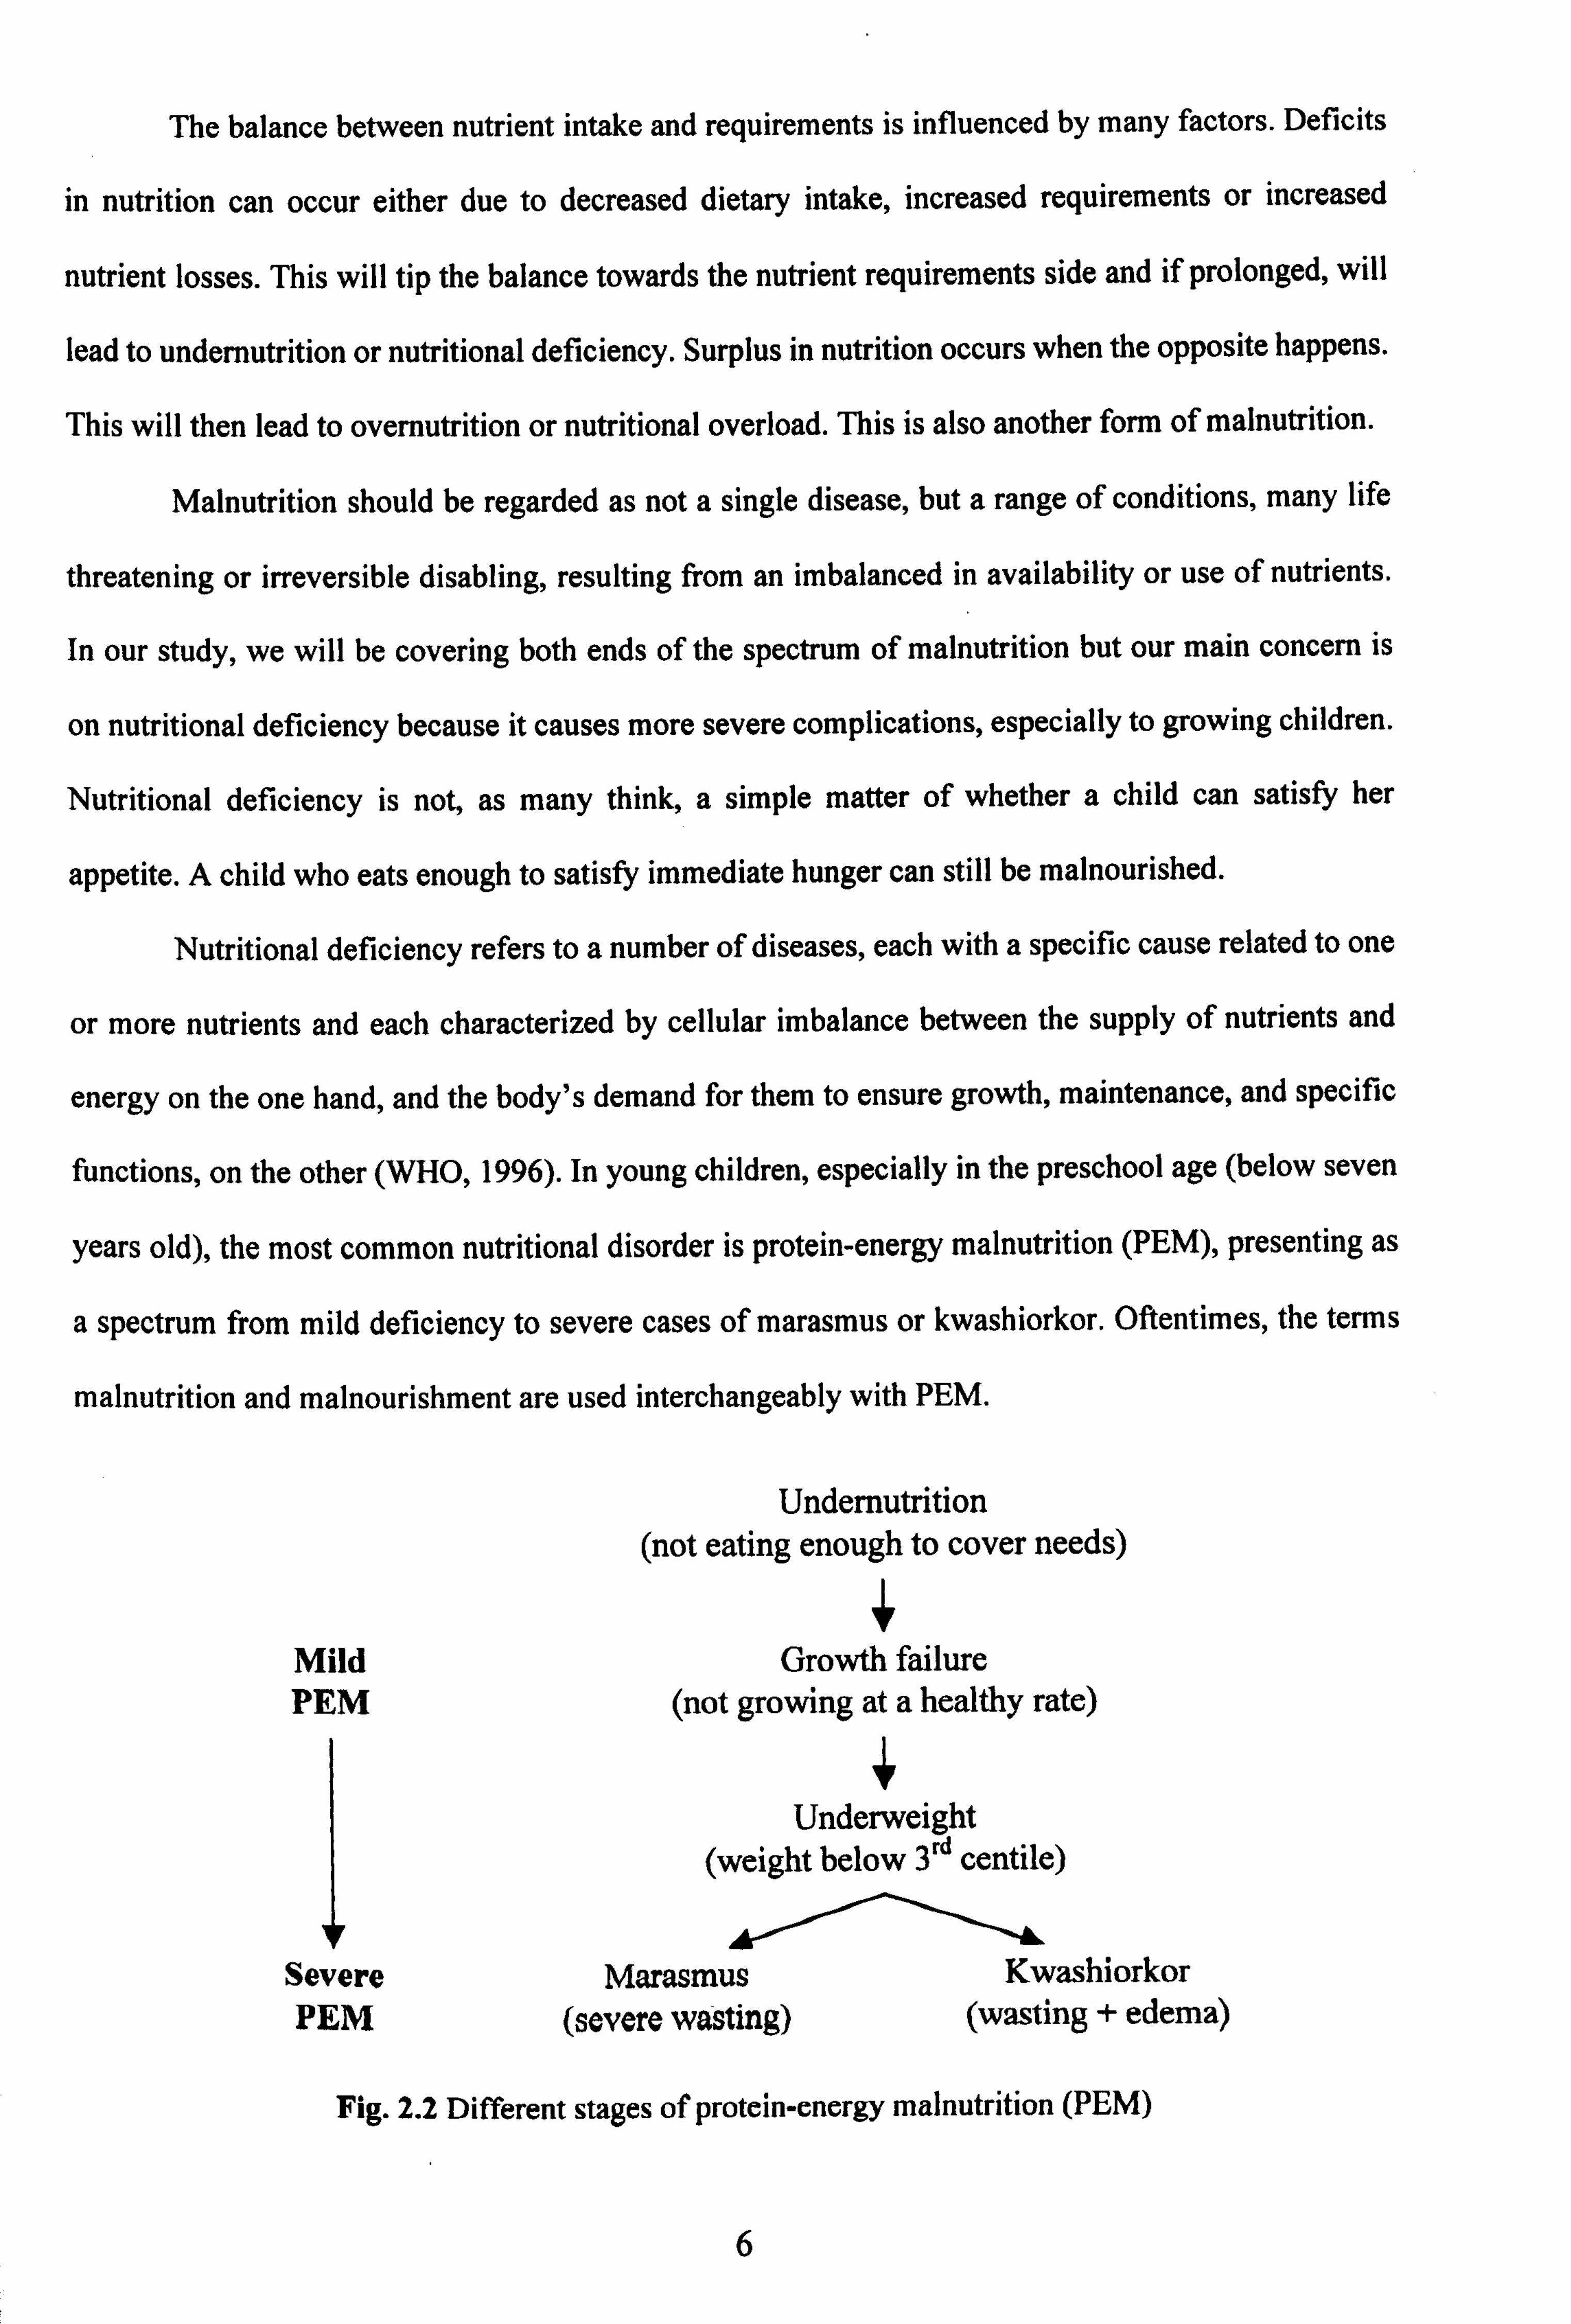
functions, on the other (WHO, 1996). In young children, especially in the preschool age (below seven
years old), the most common nutritional disorder is protein-energy malnutrition (PEM), presenting as
a spectrum from mild deficiency to severe cases of marasmus or kwashiorkor. Oftentimes, the terms
malnutrition and malnourishment are used interchangeably with PEM.
Undernutrition (not eating enough to cover needs)
Mild Growth failure PEM (not growing at a healthy rate)
Underweight (weight below 3rd centile)
Severe Marasmus Kwashiorkor (wasting + edema) PEM (severe wasting)
Fig. 2.2 Different stages of protein-energy malnutrition (PEM)
6
A child with PEM may be failing to grow, underweight or stunted. In mild to moderate cases
of malnutrition, the child may appear to be normal and betray no outward signs of problem to the
casual observer. However, three quarters of the children who die worldwide of causes related to
malnutrition are categorized as having mild to moderate malnutrition. This has caused UNICEF to
regard malnutrition as an invisible silent emergency (UNICEF, 1998).
Mortality rates in children under 5 are 2.5 times higher in those that are moderately
underweight, and 5 times higher in the severely underweight, as compared to children with normal
body weight for age (WHO Regional Office for South East-Asia, 2000).
By the time malnourished children catches our attention, most are already suffering from
severe malnutrition. They will look thin, severely wasted as in marasmus or edematous as in
kwashiorkor. Death is almost inevitable by then. In one study, children who were severely
underweight were found to be 2 to 8 times more likely to die within the following year as children of
normal weight for their age (UNICEF, 1998). Thus early detection of nutritional deficits and timely
and adequate nutritional interventions can help in reducing the majority of toddler deaths.
2.2 Global Malnutrition
Global data show no change in the overall prevalence of PEM in children less than five years of age
from 1990 to 1995. WHO estimated that in 1995,38% of all children under five, or 168 million, were
underweight. In developing countries, about 206 million children (38%) were stunted, and about 49
million (9%) wasted. About 50% of deaths in these children are estimated to be associated with
malnutrition.
According to WHO (1996), an estimated 174 million children under the age of five in the
developing world are malnourished as indicated by low weight for age, and 230 million are stunted. It
is now recognized that 6.6 million out of 12.2 trillion deaths among children under five or 54% of
toddler mortality in developing countries is associated with malnutrition.
7
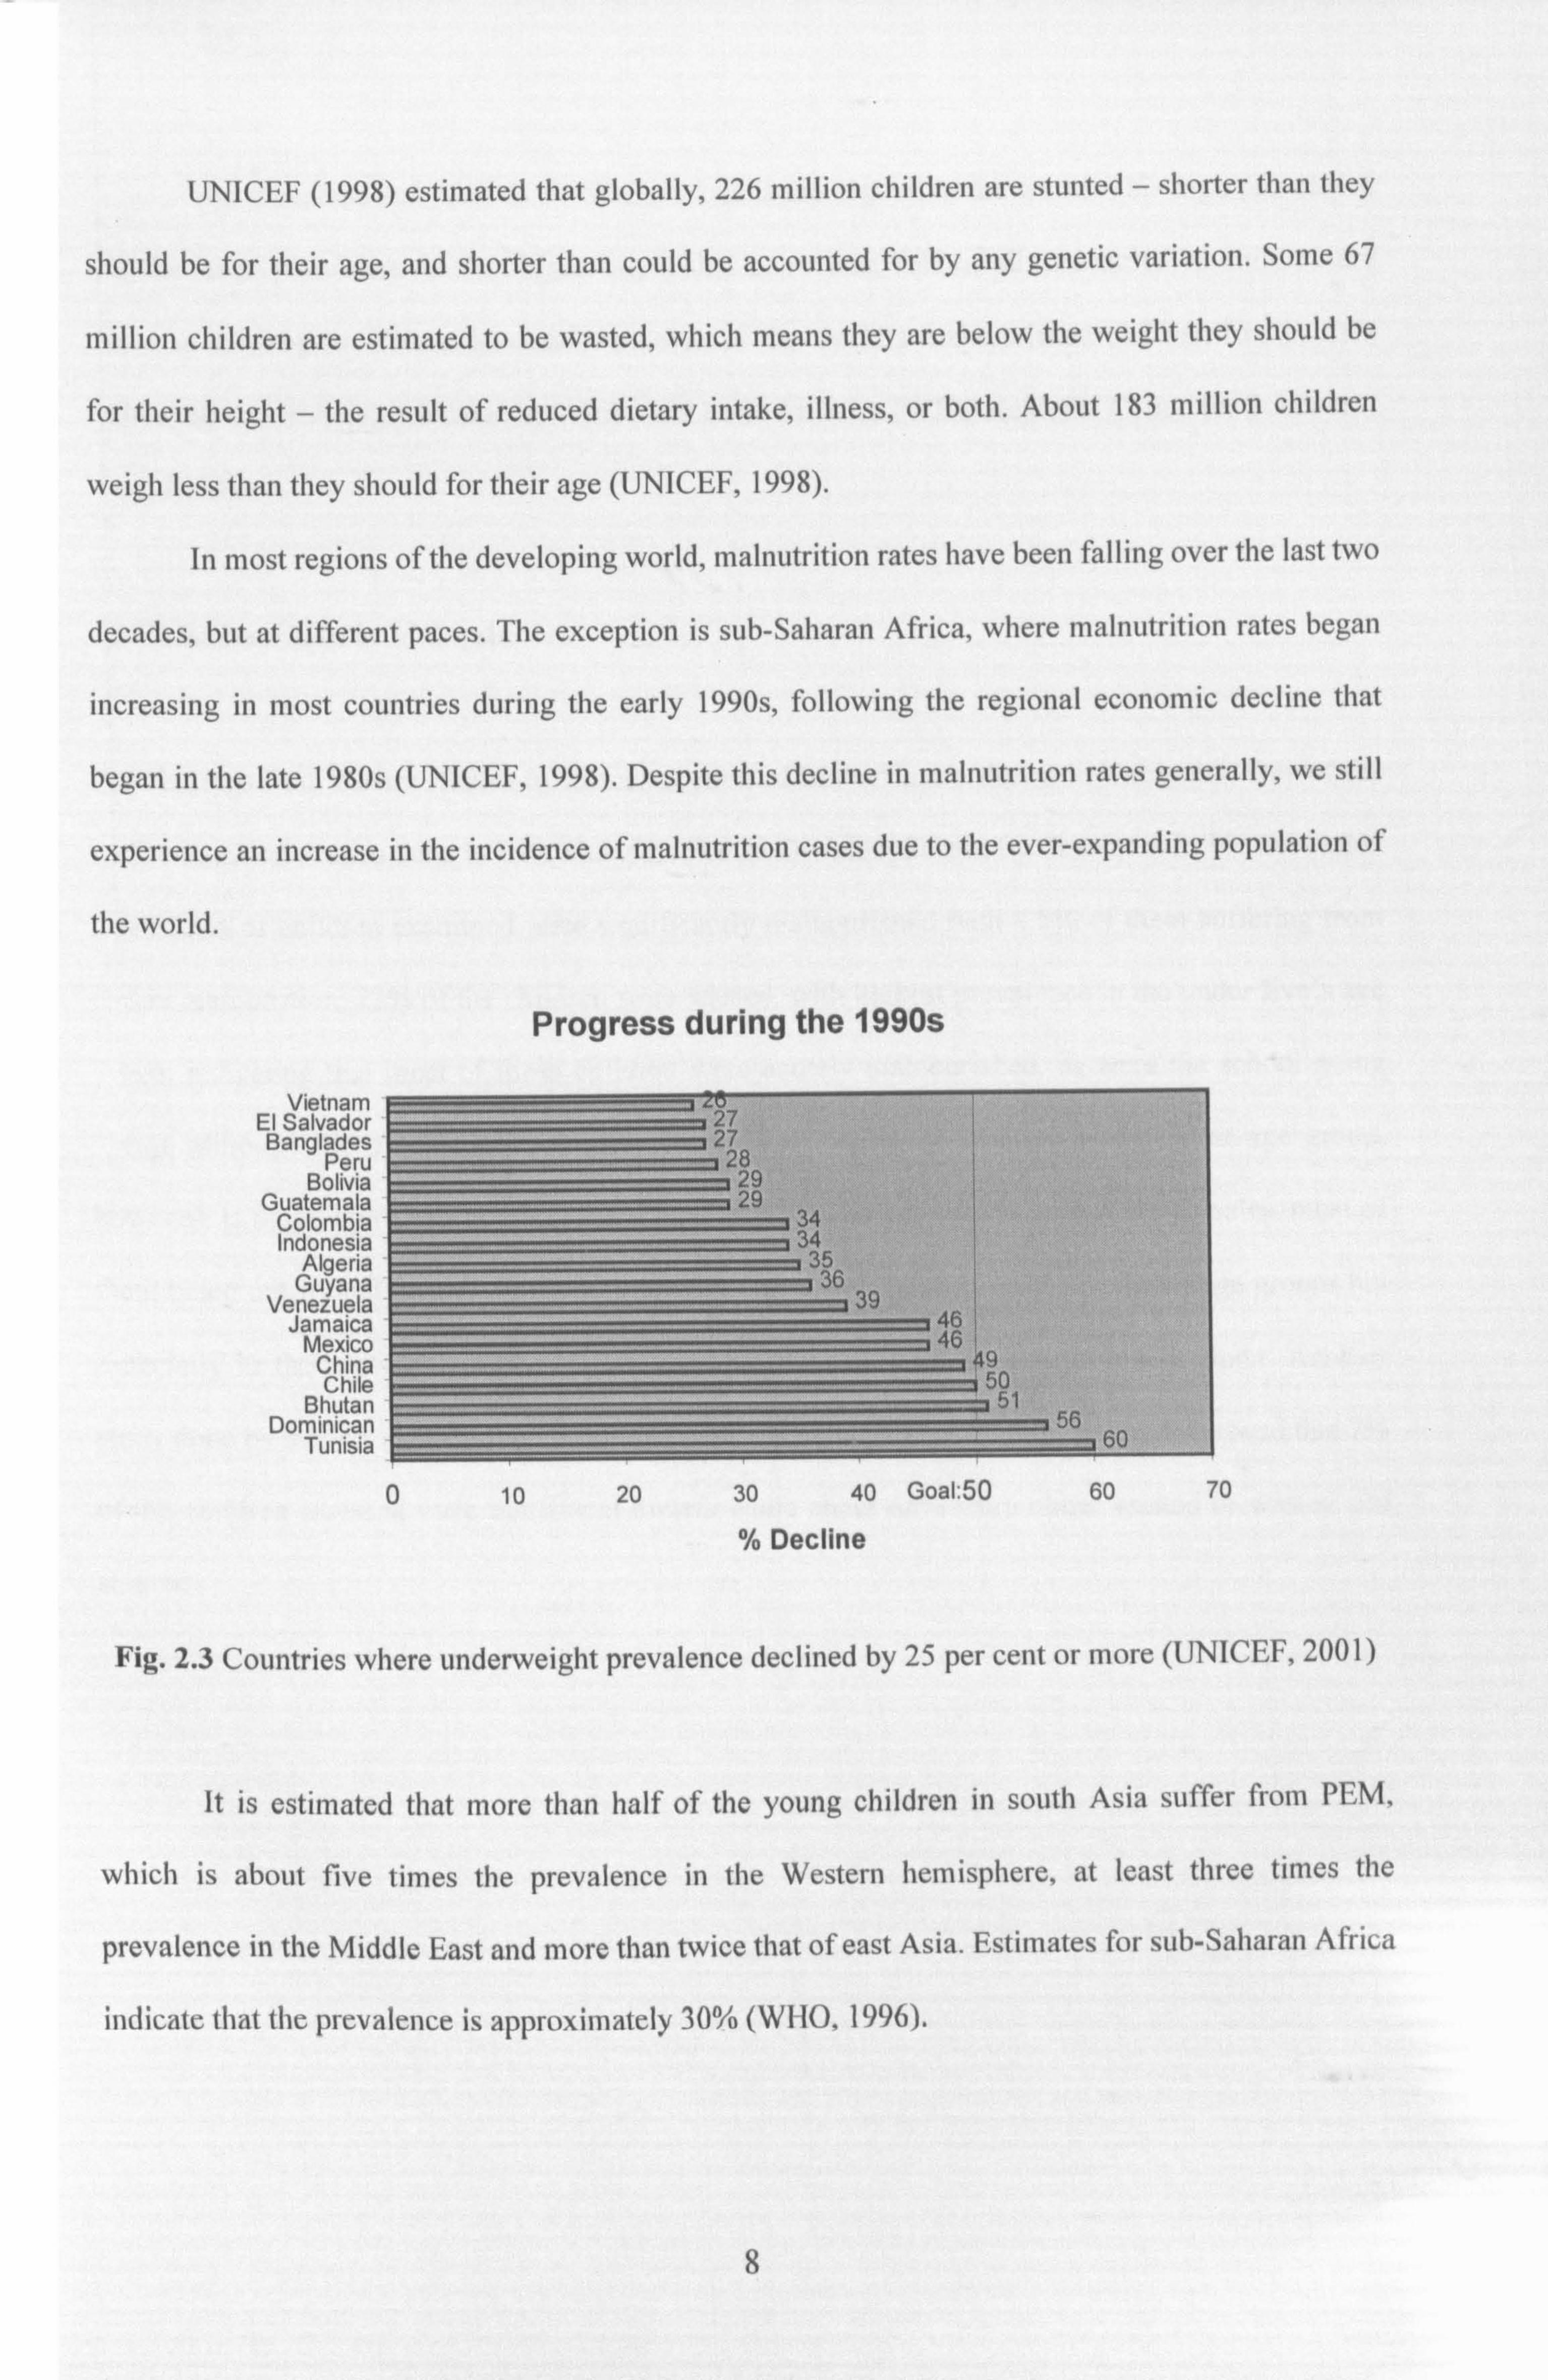
UNICEF (1998) estimated that globally, 226 million children are stunted - shorter than they
should be for their age, and shorter than could be accounted for by any genetic variation. Some 67
million children are estimated to be wasted, which means they are below the weight they should be
for their height - the result of reduced dietary intake, illness, or both. About 183 million children
weigh less than they should for their age (UNICEF, 1998).
In most regions of the developing world, malnutrition rates have been falling over the last two
decades, but at different paces. The exception is sub-Saharan Africa, where malnutrition rates began
increasing in most countries during the early 1990s, following the regional economic decline that
began in the late 1980s (UNICEF, 1998). Despite this decline in malnutrition rates generally, we still
experience an increase in the incidence of malnutrition cases due to the ever-expanding population of
the world.
Progress during the 1990s
Vietnam El Salvador Banglades
Peru Bolivia
Guatemala Colombia Indonesia
Algeria Guyana
Venezuela Jamaica
Mexico China Chile
Bhutan Dominican
Tunisia
2d ý 27
28
-, _
29
3 34 334 ý
36 39
ý46 ! , 46' ý 49
--=i 50
1 56 160
0 10 20 30 40 Goal. 50 60 70
% Decline
Fig. 2.3 Countries where underweight prevalence declined by 25 per cent or more (UNICEF, 2001)
It is estimated that more than half of the young children in south Asia suffer from PEM,
which is about five times the prevalence in the Western hemisphere, at least three times the
prevalence in the Middle East and more than twice that of east Asia. Estimates for sub-Saharan Africa
indicate that the prevalence is approximately 30% (WHO, 1996).
8
The prevalence of PEM in South-East Asia is the highest in the world. This high prevalence
and the large population of the region imply that more than half of all malnourished children are
found in this region. Currently, over two-thirds of the world's malnourished children live in Asia
(especially south Asia), followed by Africa and Latin America (WHO Regional Office for South-east
Asia, 2000).
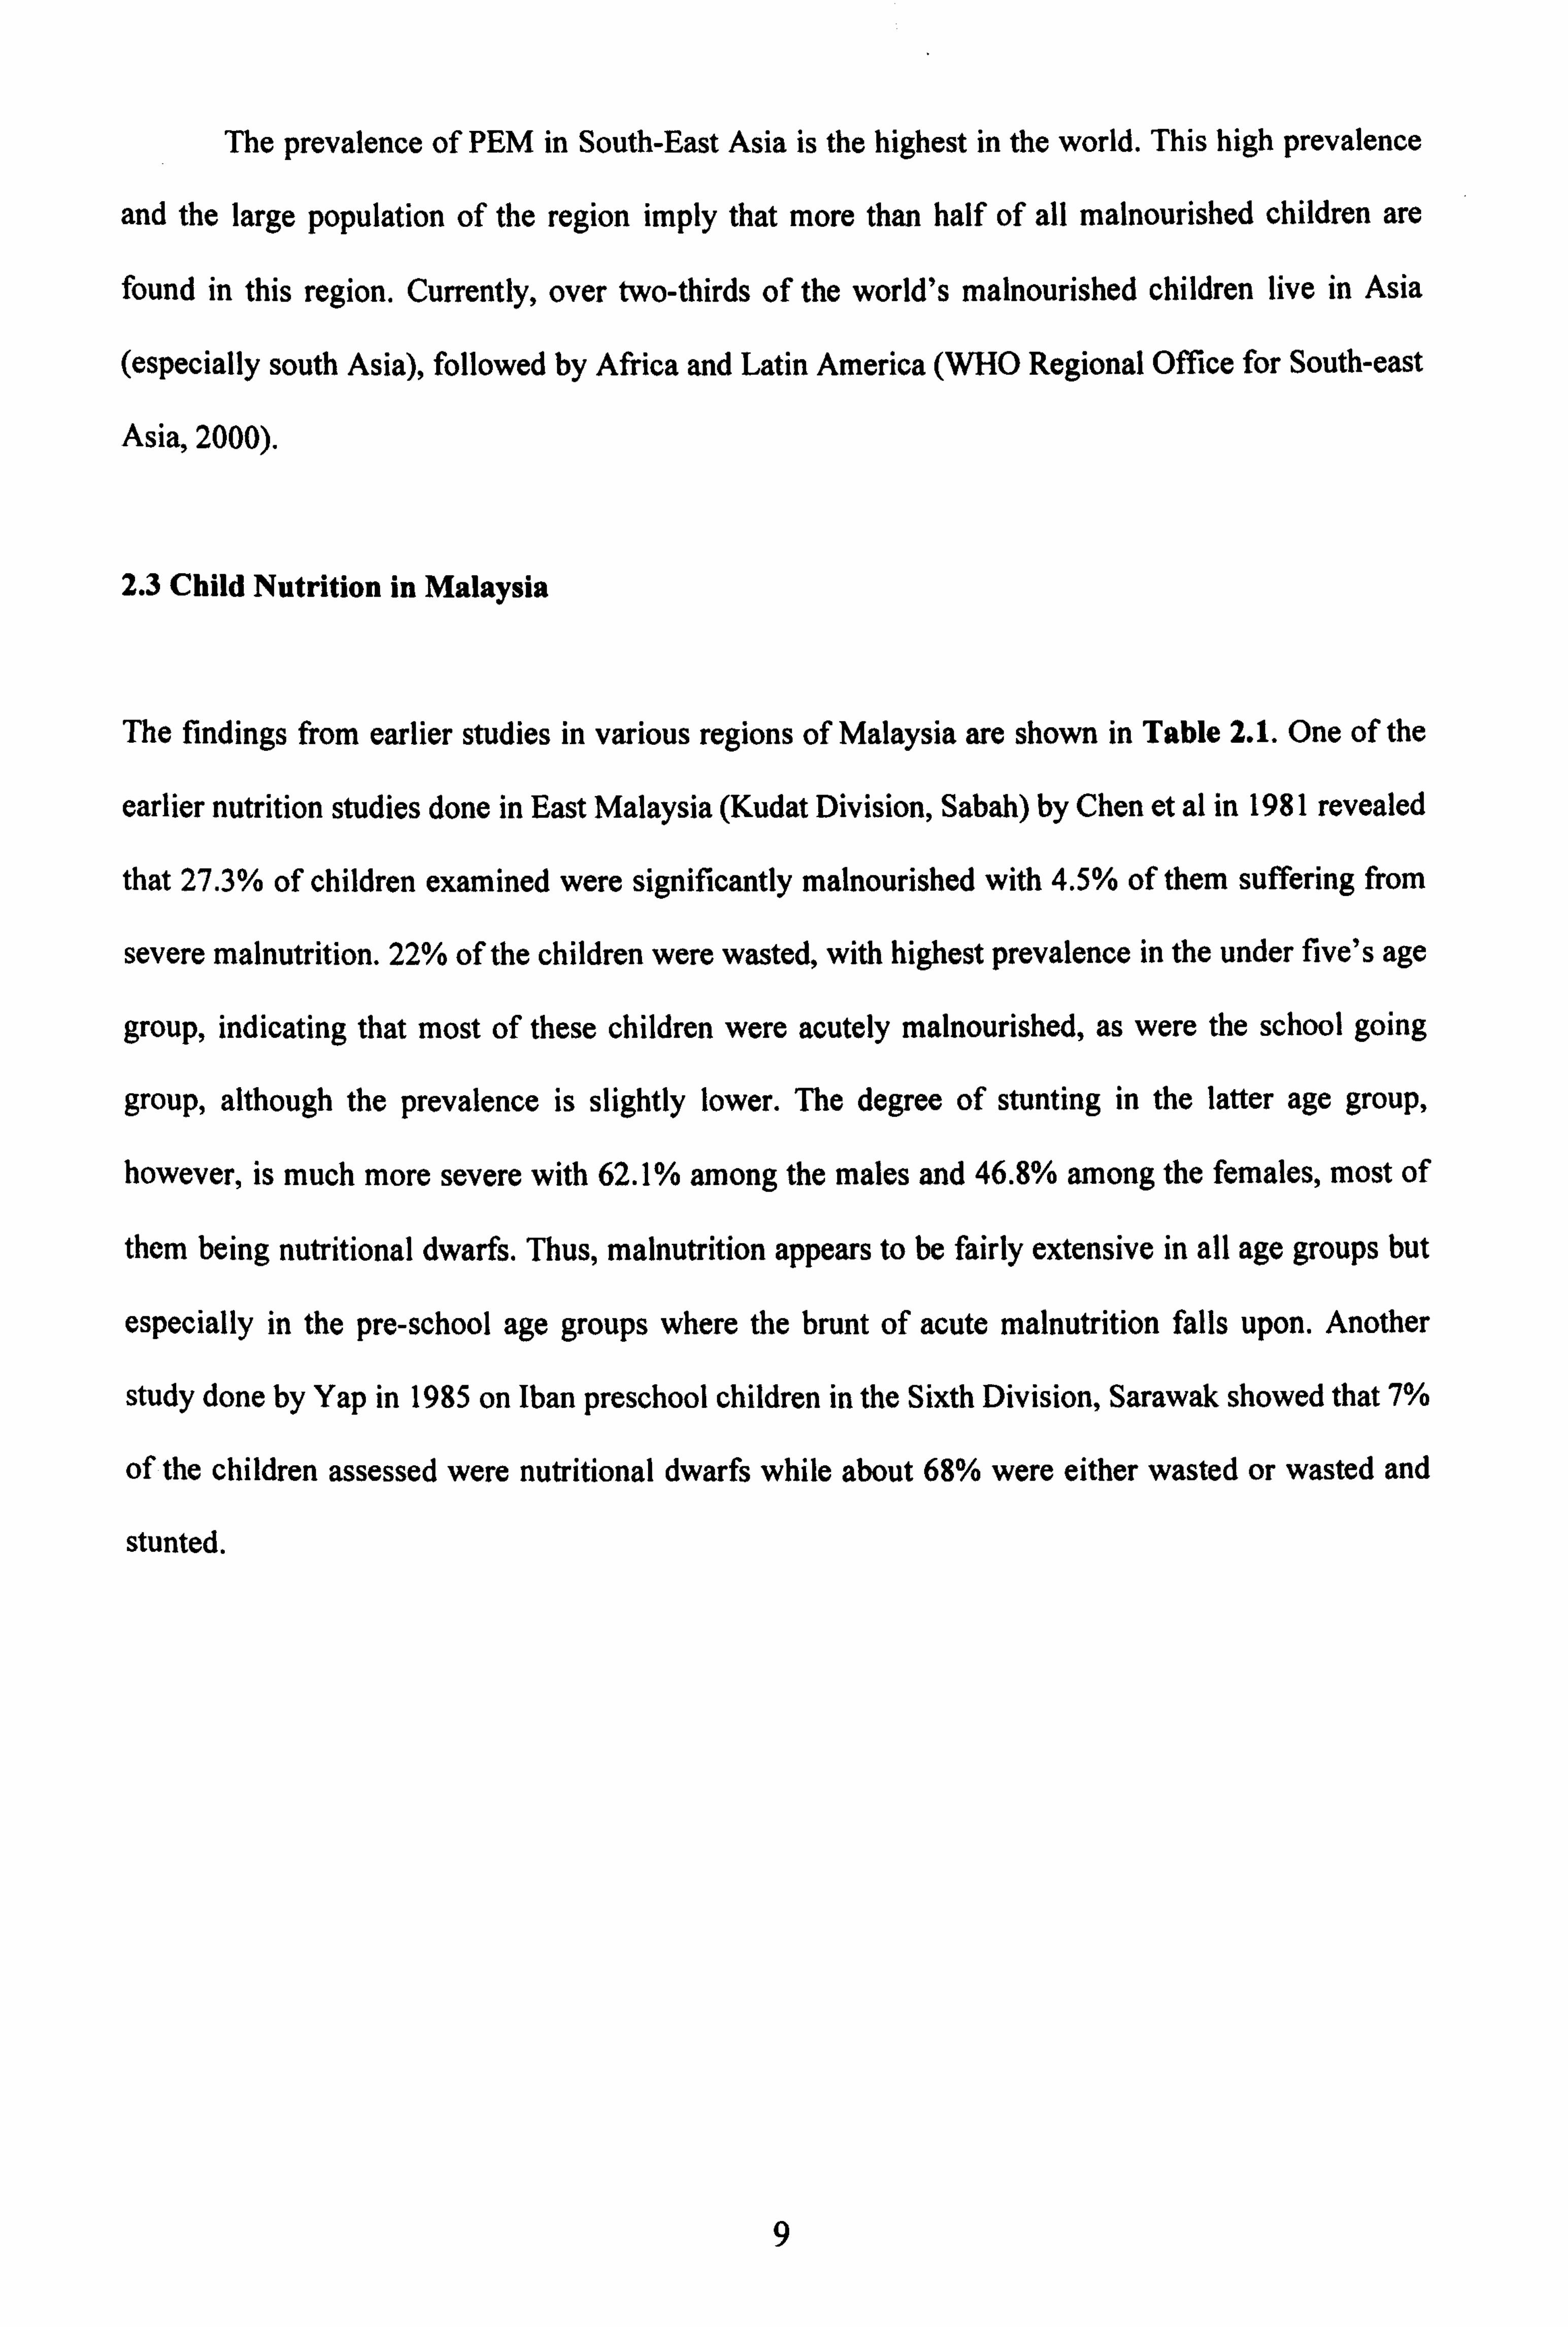
2.3 Child Nutrition in Malaysia
The findings from earlier studies in various regions of Malaysia are shown in Table 2.1. One of the
earlier nutrition studies done in East Malaysia (Kudat Division, Sabah) by Chen et al in 1981 revealed
that 27.3% of children examined were significantly malnourished with 4.5% of them suffering from
severe malnutrition. 22% of the children were wasted, with highest prevalence in the under five's age
group, indicating that most of these children were acutely malnourished, as were the school going
group, although the prevalence is slightly lower. The degree of stunting in the latter age group,
however, is much more severe with 62.1% among the males and 46.8% among the females, most of
them being nutritional dwarfs. Thus, malnutrition appears to be fairly extensive in all age groups but
especially in the pre-school age groups where the brunt of acute malnutrition falls upon. Another
study done by Yap in 1985 on Than preschool children in the Sixth Division, Sarawak showed that 7%
of the children assessed were nutritional dwarfs while about 68% were either wasted or wasted and
stunted.
9
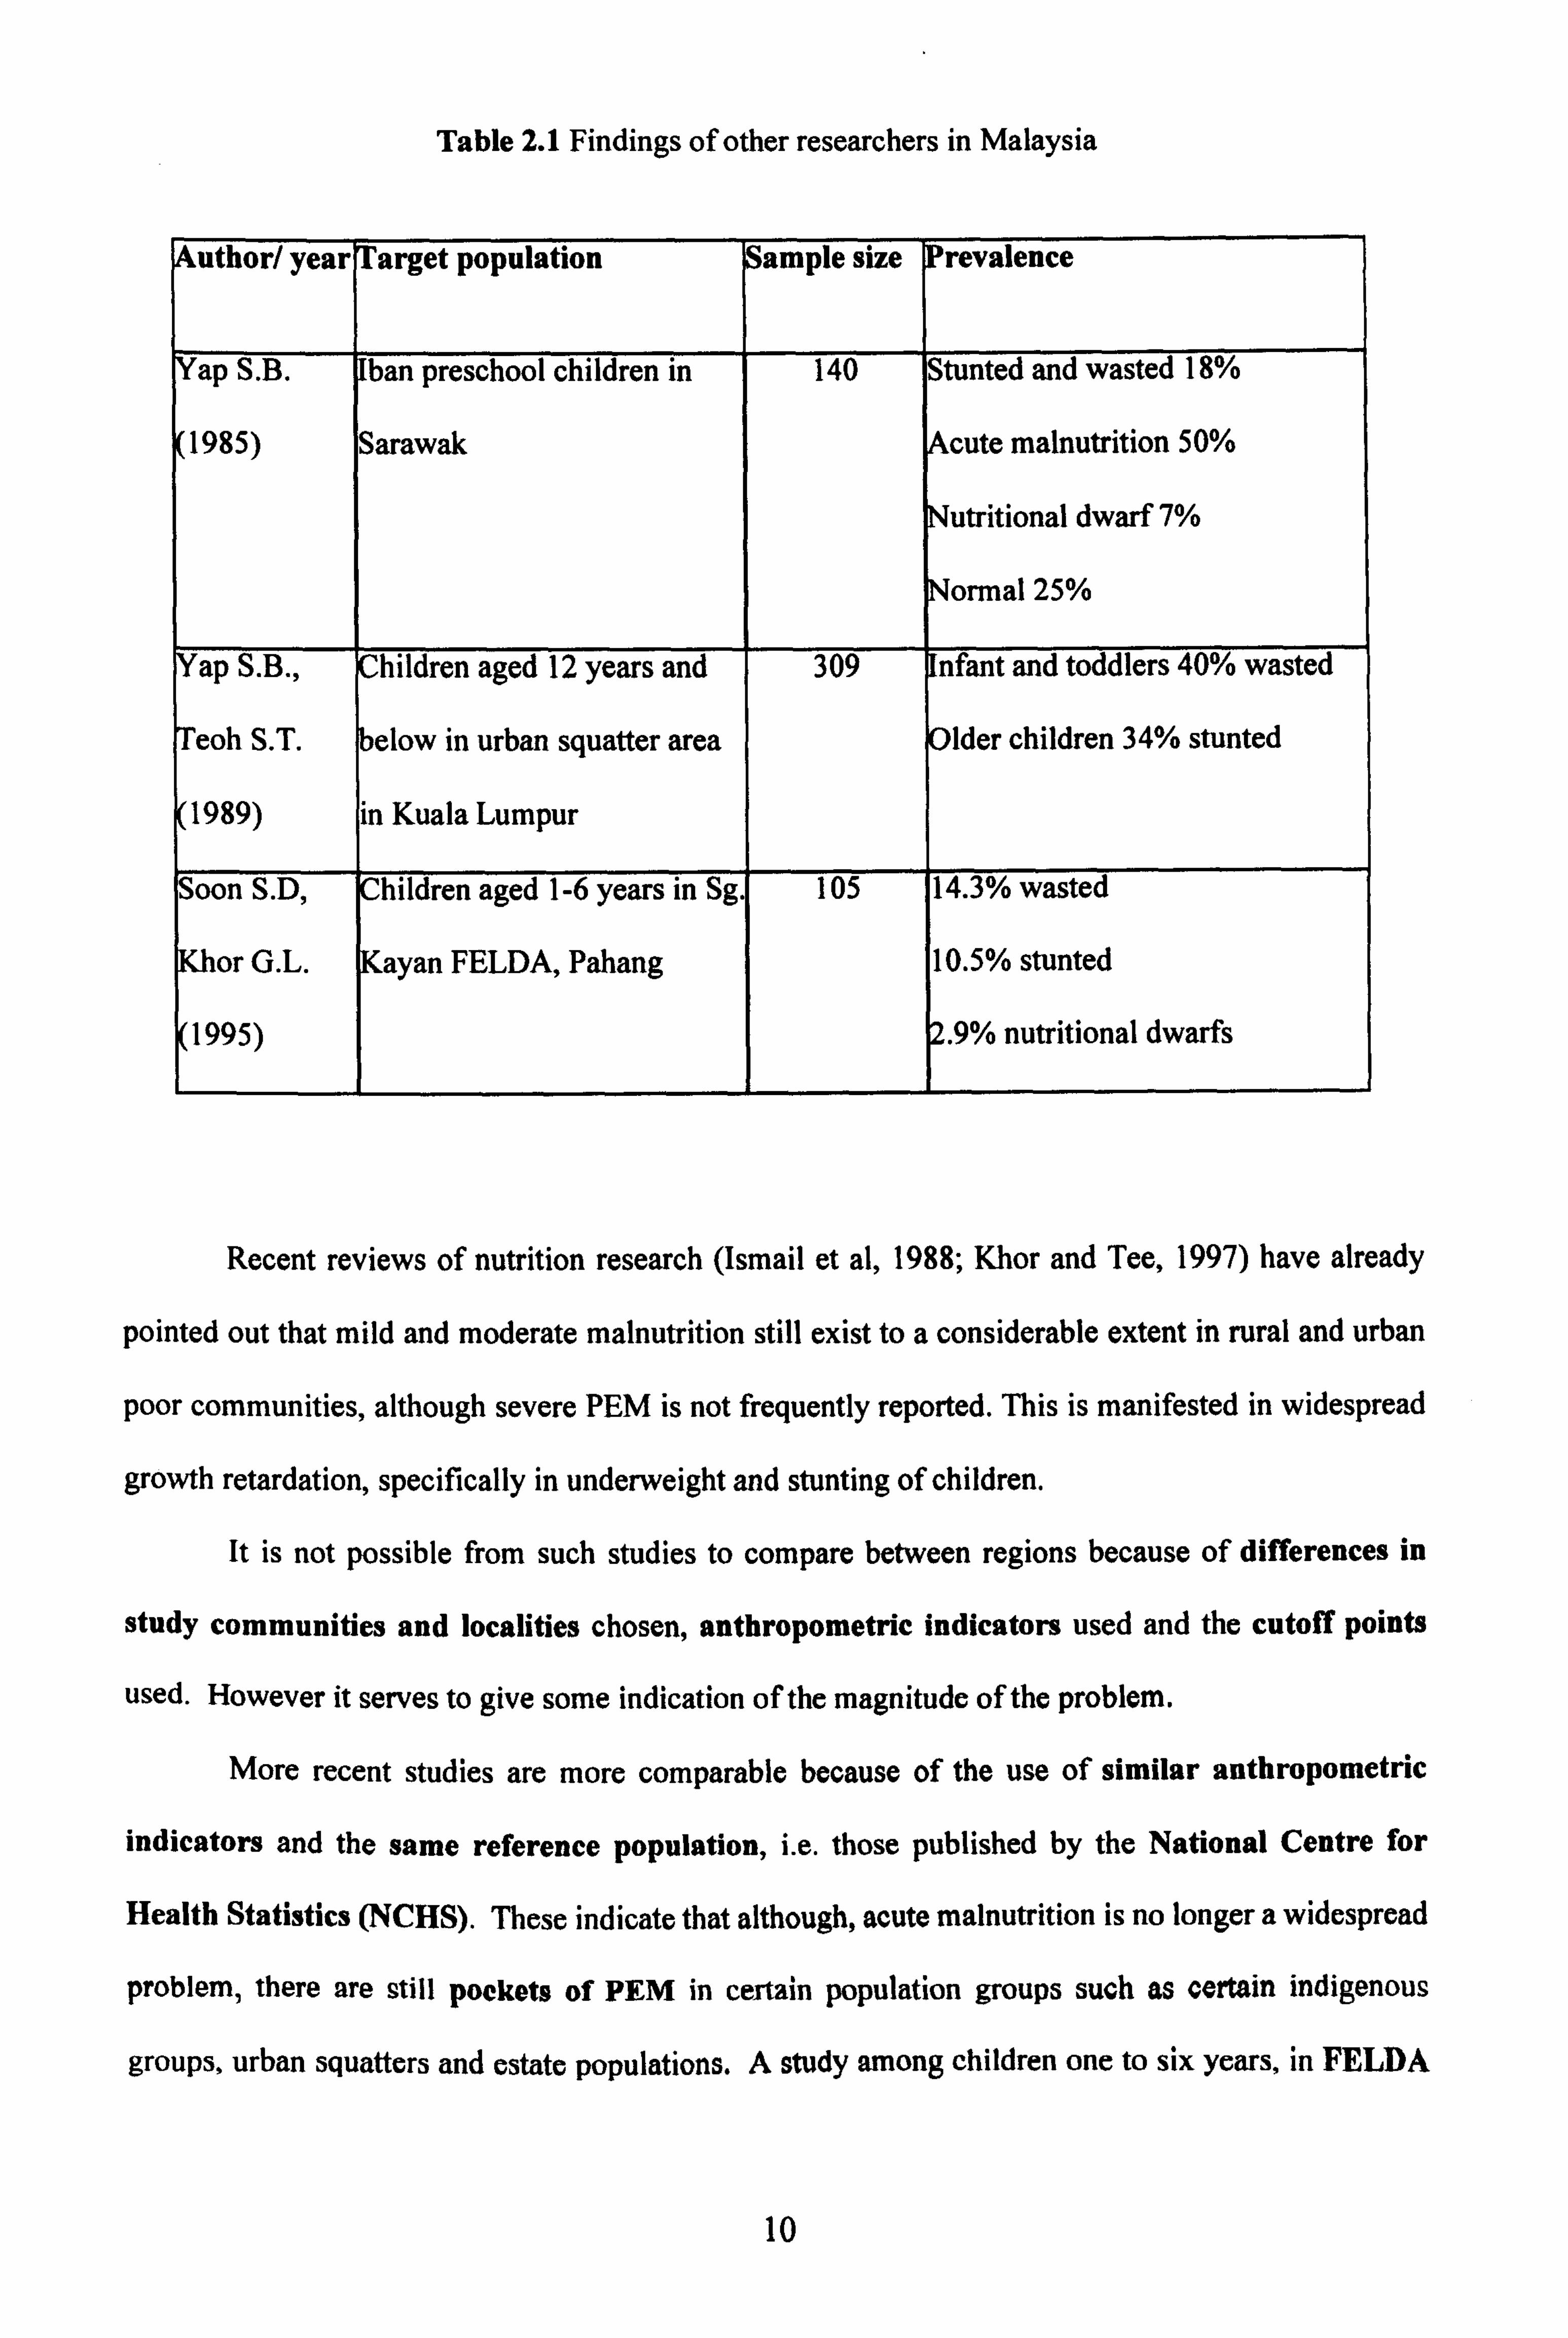
Table 2.1 Findings of other researchers in Malaysia
uthor/ year Target population ample size Prevalence
Yap S. B. Than preschool children in 140 Stunted and wasted 18%
1985) Sarawak cute malnutrition 50%
Nutritional dwarf 7%
Normal 25%
ap S. B., Children aged 12 years and 309 nfant and toddlers 40% wasted
eoh S. T. below in urban squatter area Older children 34% stunted
1989) in Kuala Lumpur
Soon S. D, Children aged 1-6 years in Sg. 105 14.3% wasted
or G. L. Kayan FELDA, Pahang 10.5% stunted
1995) . 9% nutritional dwarfs
Recent reviews of nutrition research (Ismail et al, 1988; Khor and Tee, 1997) have already
pointed out that mild and moderate malnutrition still exist to a considerable extent in rural and urban
poor communities, although severe PEM is not frequently reported. This is manifested in widespread
growth retardation, specifically in underweight and stunting of children.
It is not possible from such studies to compare between regions because of differences in
study communities and localities chosen, anthropometric indicators used and the cutoff points
used. However it serves to give some indication of the magnitude of the problem.
More recent studies are more comparable because of the use of similar anthropometric
indicators and the same reference population, i. e. those published by the National Centre for
Health Statistics (NCHS). These indicate that although, acute malnutrition is no longer a widespread
problem, there are still pockets of PEM in certain population groups such as certain indigenous
groups, urban squatters and estate populations. A study among children one to six years, in FELDA
10
schemes (Soon & Khor, 1995) showed that 14.3% of the children were underweight, 10.5% were
stunted while only < 3% were wasted (Table 2.2).
A nationwide nutritional survey of rural villages and estates (Khor and Tee, 1997) revealed
the persistence of underweight, stunting and wasting amongst children in the study communities. By
age groups, the prevalence of underweight was lowest among the infants (16.8% for boys and 13.3%
for girls), and highest among children aged one to six years with about one third of the children
affected but slightly higher among the girls (32.6% and 35.9% for boys and girls respectively). The
prevalence of stunting was about 28% for both sexes while wasting was seen in 10% of the study
sample.
Table 2.2 Prevalence of malnutrition among children aged 1 to 6 years, in various rural communities
Indicator Boys (n = 700) Girls (n = 727)
Weight for age* 32.6% 35.9%
Height for age* 28.0% 28.8%
Weight for height* 10.5% 10.1%
* Using as the cut-off points -2 SD from median of the NCHS Standards.
Most recently a report from the Ministry of National Unity and Social Development (2000)
indicated that the prevalence of severely underweight children was 0.6% for infants and 1.4% among
toddlers. The proportion of children found to be moderately malnourished increased with age, with
11.6% for infants and 16.7% for toddlers.
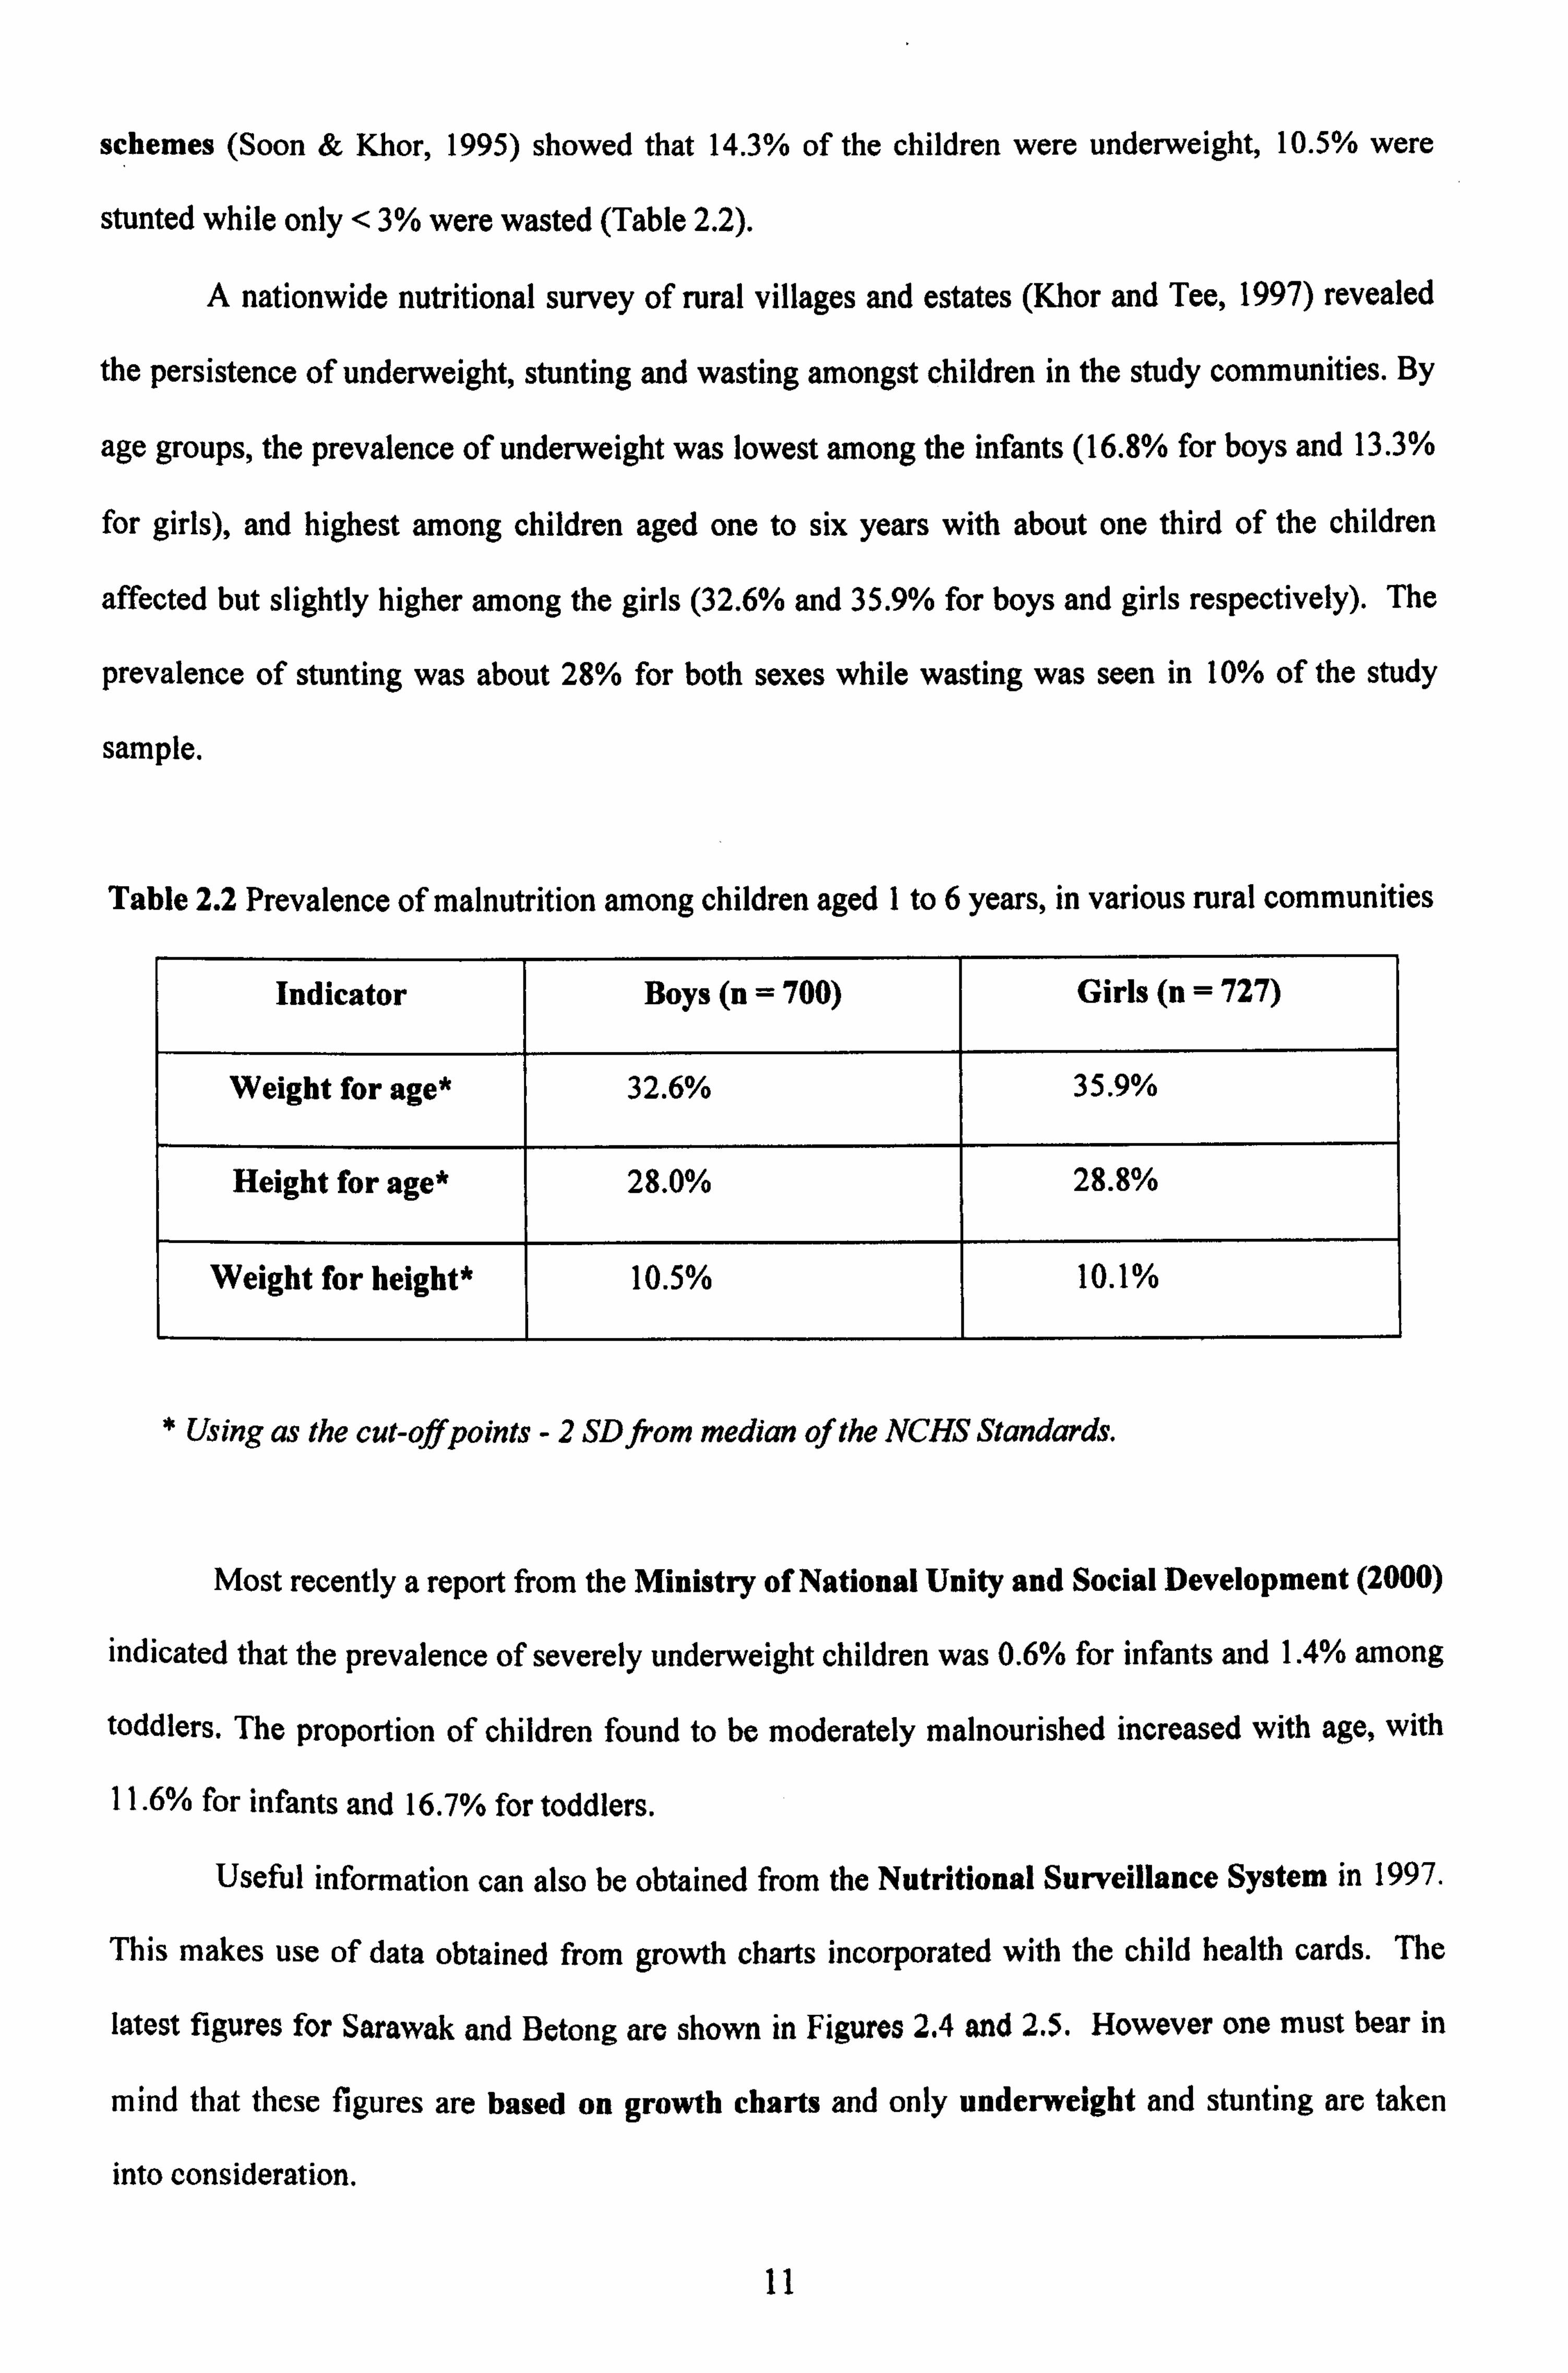
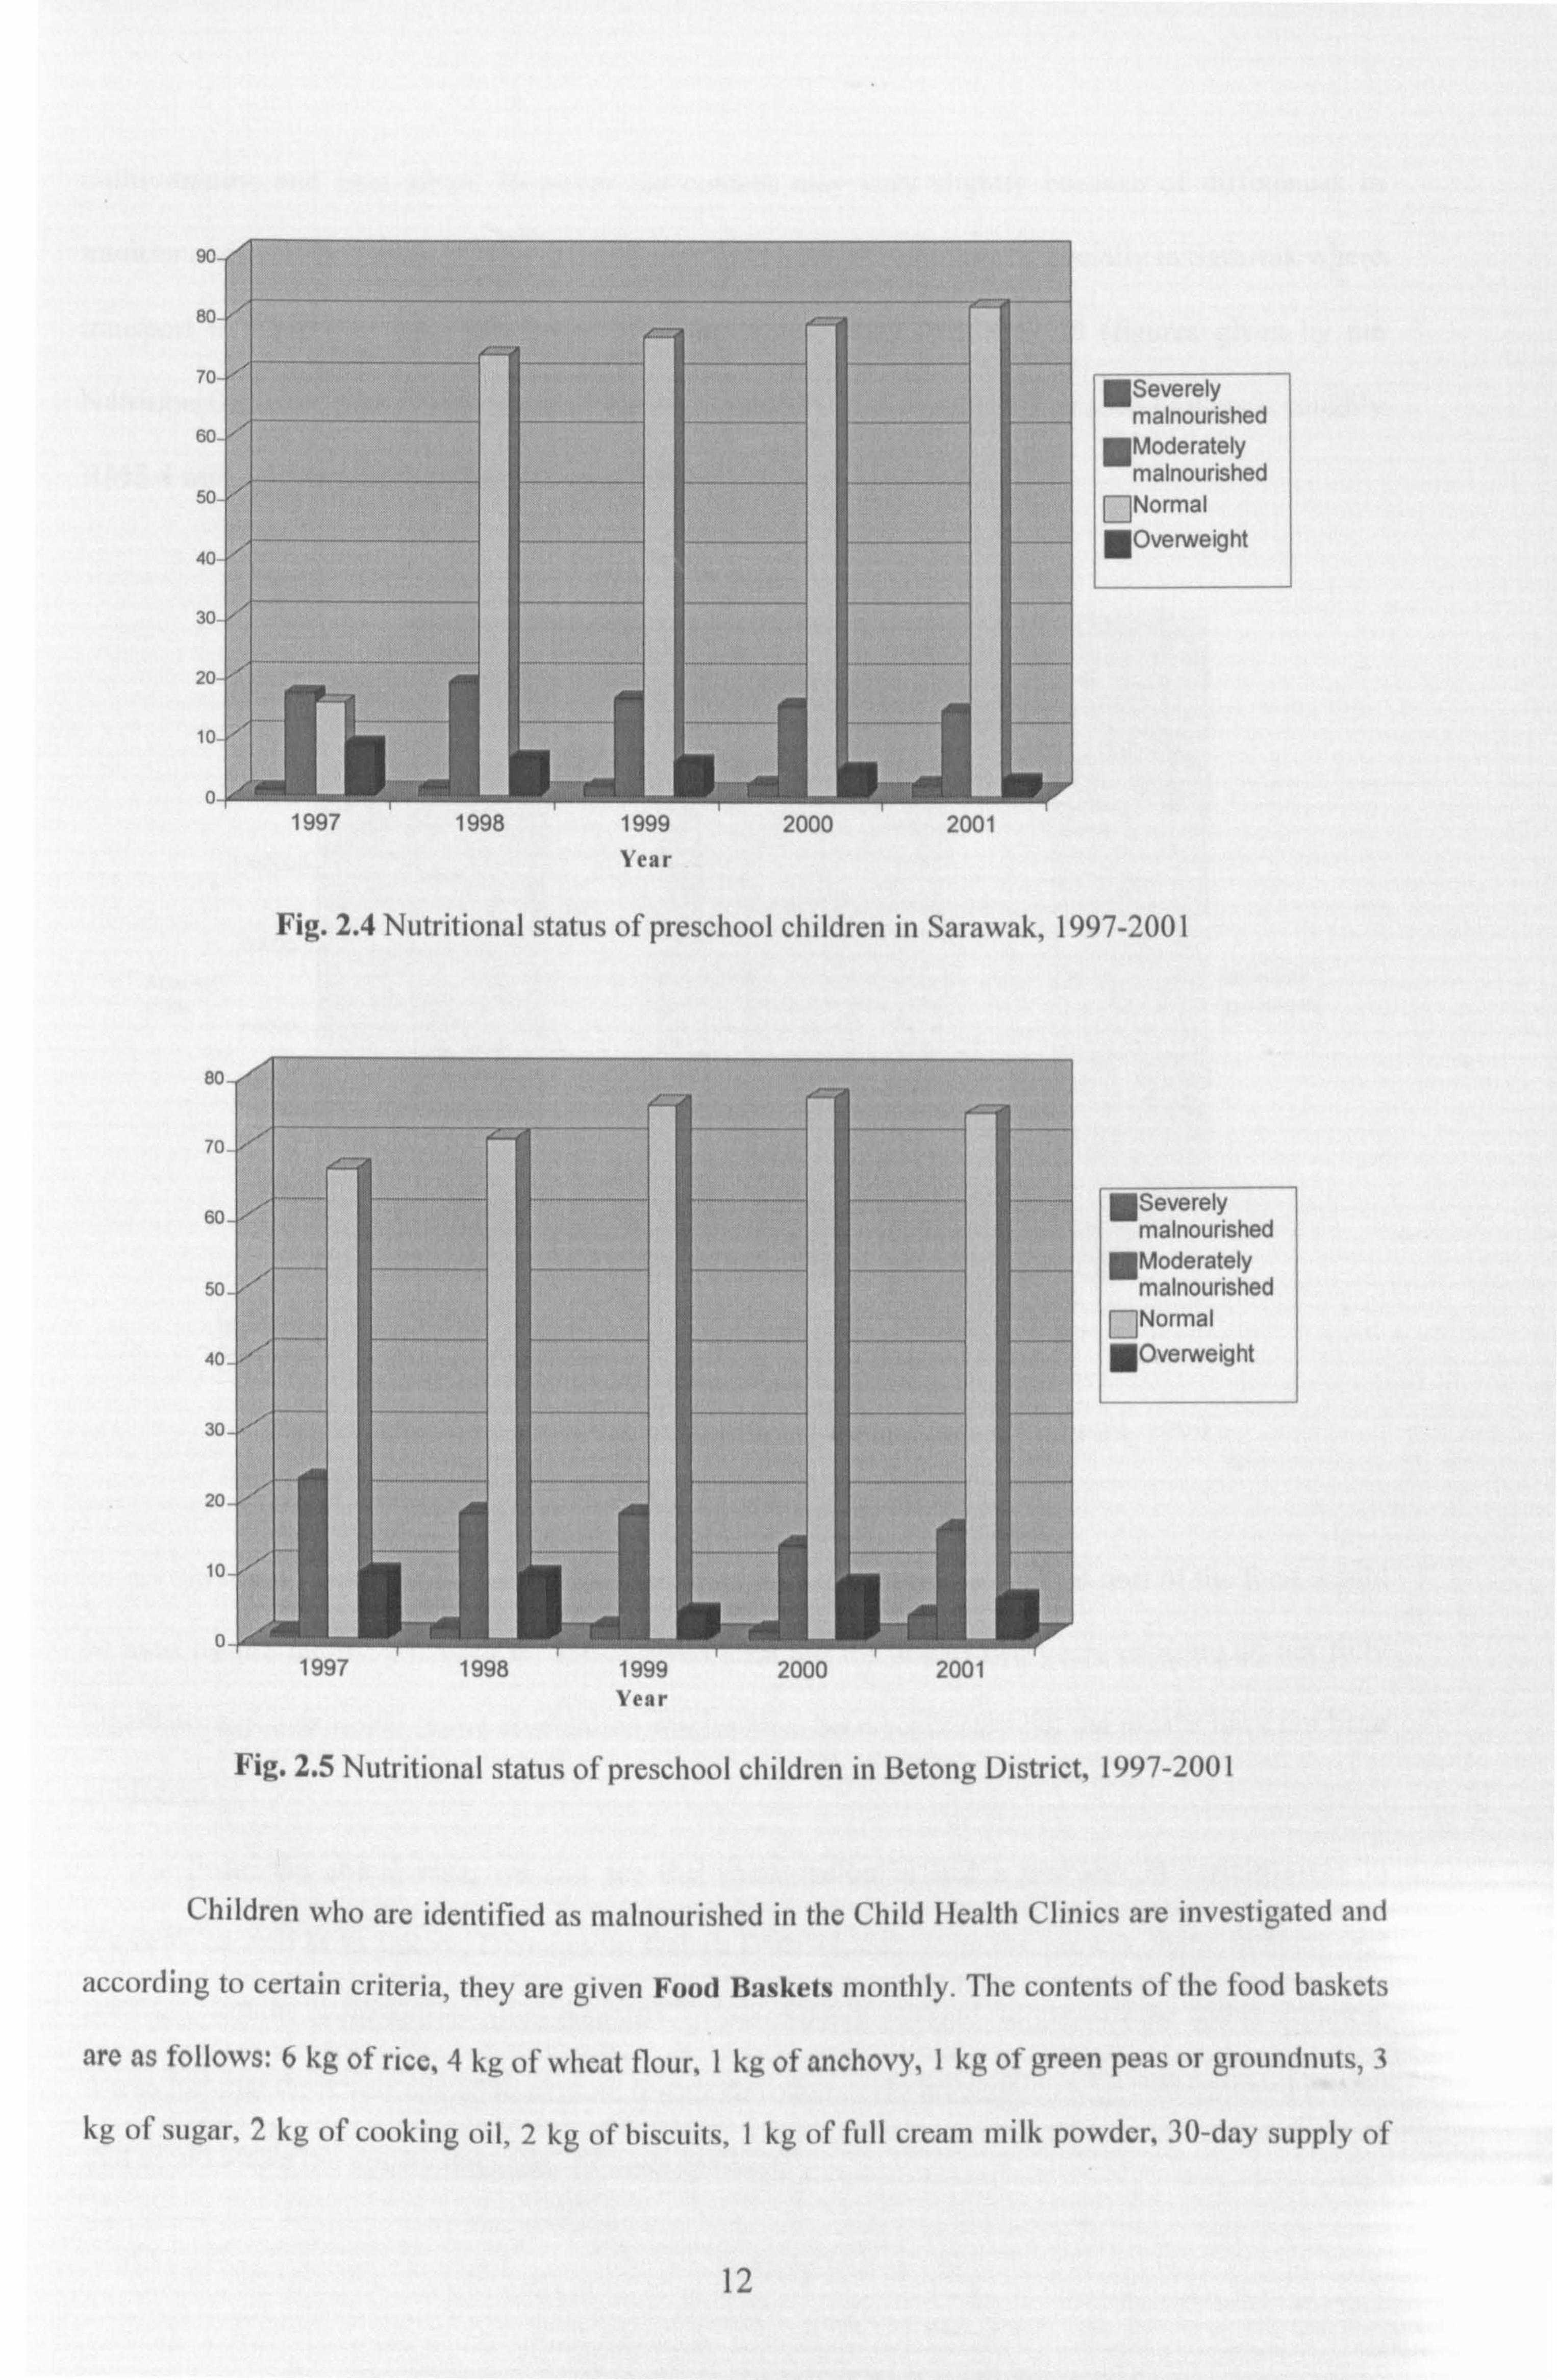
Useful information can also be obtained from the Nutritional Surveillance System in 1997.
This makes use of data obtained from growth charts incorporated with the child health cards. The
latest figures for Sarawak and Betong are shown in Figures 2.4 and 2.5. However one must bear in
mind that these figures are based on growth charts and only underweight and stunting are taken
into consideration.
11
"Severely malnourished Moderately malnourished Normal
"Overweight
1997 1998 1999 Year
2000 2001
Fig. 2.4 Nutritional status of preschool children in Sarawak, 1997-2001
Severely malnourished Moderately malnourished Normal
"Overweight
1997 Pj 194'', Year
2000 2001
Fig. 2.5 Nutritional status of preschool children in Betong District, 1997-2001
Children who are identified as malnourished in the Child Health Clinics are investigated and
according to certain criteria, they are given Food Baskets monthly. The contents of the food baskets
are as follows: 6 kg of rice, 4 kg of wheat flour, 1 kg of anchovy, 1 kg of green peas or groundnuts, 3
kg of sugar, 2 kg of cooking oil, 2 kg of biscuits, 1 kg of full cream milk powder, 30-day supply of
12