Embed Size (px)
Citation preview

FACTSHEET - SEPTEMBER 2016

1
SIP PERFORMANCE OF SELECT SCHEMES (as on 30th September 2016)The Fund offers flexible and convenient Systematic Investment Plan (SIP) facility. To illustrate the advantages of SIP investments, this is how your investments would have grown if you had invested say Rs. 10,000 systematically on the first Business Day of every month over a period of time.
^Past performance may or may not be sustained in future. Returns greater than 1 year period are compounded annualized. Benchmark: Nifty 50. Additional Benchmak: S&P BSE Sensex. Inception Date: Jan 05, 2010. This scheme is managed by Jinesh Gopani & Ashish Naik. Please refer to the Annexure for returns of all the schemes managed by them.
Axis Equity Fund - Growth Option
^Past performance may or may not be sustained in future. Returns greater than 1 year period are compounded annualized. Benchmark: S&P BSE 200. Additional Benchmak: Nifty 50. Inception Date: Dec 29, 2009. This scheme is managed by Jinesh Gopani. Please refer to the Annexure for returns of all the schemes managed by him.
SIP Investments Since Inception SIP 5 Year SIP 3 Year SIP 1 Year SIP
Total Amount Invested (Rs) 8,10,000 6,00,000 3,60,000 1,20,000 Market value as on September 30, 2016 (Rs) 16,59,339 10,68,606 4,74,697 1,29,772 Returns (Annualised) 20.94% 23.29% 18.81% 15.43%Benchmark Returns (Annualised) 10.82% 13.04% 11.29% 18.74%Additional Benchmark Returns (Annualised) 9.40% 10.81% 8.17% 14.72%
Axis Long Term Equity Fund - Growth Option
^Past performance may or may not be sustained in future. Returns greater than 1 year period are compounded annualized. Benchmark: S&P BSE Midcap. Additional Benchmak: Nifty 50. Inception Date: Feb 18, 2011. This scheme is managed by Ashish Naik. Please refer to the Annexure for returns of all the schemes managed by him.
SIP Investments Since Inception SIP 5 Year SIP 3 Year SIP 1 Year SIP
Total Amount Invested (Rs) 6,70,000 6,00,000 3,60,000 1,20,000 Market value as on September 30, 2016 (Rs) 12,30,918 10,49,124 4,71,439 1,30,595 Returns (Annualised) 21.79% 22.53% 18.32% 16.76%Benchmark Returns (Annualised) 20.76% 22.43% 24.23% 33.80%Additional Benchmark Returns (Annualised) 10.33% 10.82% 8.17% 14.72%
Axis Midcap Fund - Growth Option
^Past performance may or may not be sustained in future. Returns greater than 1 year period are compounded annualized. Benchmark: Nifty 50. Additional Benchmak: S&P BSE 200. Inception Date: Jun 29, 2012. This scheme is managed by Jinesh Gopani. Please refer to the Annexure for returns of all the schemes managed by him.
SIP Investments Since Inception SIP 3 Year SIP 1 Year SIP
Total Amount Invested (Rs) 5,10,000 3,60,000 1,20,000
Market value as on September 30, 2016 (Rs) 7,23,859 4,56,846 1,34,931
Returns (Annualised) 16.60% 16.10% 23.83%
Benchmark Returns (Annualised) 10.24% 8.17% 14.72%
Additional Benchmark Returns (Annualised) 12.79% 11.29% 18.74%
Axis Focused 25 Fund - Growth Option
^Past performance may or may not be sustained in future. Returns greater than 1 year period are compounded annualized. Benchmark: 35% Nifty 50+ 35% CRISIL Composite Bond Fund Index + 30% INR Price of Gold. Additional Benchmak: Crisil 10 Year Gilt Index. Inception Date: Aug 23, 2010. This scheme is managed by R. Sivakumar & Ashish Naik. Please refer to the Annexure for returns of all the schemes managed by them.
SIP Investments Since Inception SIP 5 Year SIP 3 Year SIP 1 Year SIP
Total Amount Invested (Rs) 7,30,000 6,00,000 3,60,000 1,20,000 Market value as on September 30, 2016 (Rs) 9,70,539 7,60,713 4,17,711 1,30,250 Returns (Annualised) 9.25% 9.43% 9.90% 16.20%Benchmark Returns (Annualised) 8.70% 8.91% 10.10% 16.77%Additional Benchmark Returns (Annualised) 8.92% 9.51% 11.71% 14.35%
Axis Triple Advantage Fund - Growth Option
^Past performance may or may not be sustained in future. Returns greater than 1 year period are compounded annualized. Benchmark: CRISIL MIP Blended Index. Additional Benchmak: CRISIL 10 year Gilt Index Inception Date: Jul 16, 2010. This scheme is managed by Devang Shah, Jinesh Gopani & Ashish Naik. Please refer to the Annexure for returns of all the schemes managed by them.
SIP Investments Since Inception SIP 5 Year SIP 3 Year SIP 1 Year SIP
Total Amount Invested (Rs) 7,40,000 6,00,000 3,60,000 1,20,000 Market value as on September 30, 2016 (Rs) 10,08,158 7,79,475 4,17,922 1,26,359 Returns (Annualised) 9.91% 10.41% 9.94% 9.98%Benchmark Returns (Annualised) 10.10% 10.66% 11.48% 14.31%Additional Benchmark Returns (Annualised) 8.87% 9.51% 11.71% 14.30%
Axis Income Saver - Growth Option
SIP Investments Since Inception SIP 5 Year SIP 3 Year SIP 1 Year SIPTotal Amount Invested (Rs) 8,00,000 6,00,000 3,60,000 1,20,000 Market value as on September 30, 2016 (Rs) 12,40,742 8,65,153 4,23,178 1,28,719 Returns (Annualised) 12.97% 14.62% 10.79% 13.73%Benchmark Returns (Annualised) 9.45% 10.81% 8.17% 14.72%Additional Benchmark Returns (Annualised) 8.69% 9.84% 6.51% 12.26%
SIP returns are computed after accounting for the cash flow by using XIRR method (investment internal rate of return)
^Past performance may or may not be sustained in future. Returns greater than 1 year period are compounded annualized. Benchmark: CRISIL MIP Blended Index. Additional Benchmak: Nifty 50. Inception Date: August 14, 2015. This scheme is managed by Anupam Tiwari & R. Sivakumar. Please refer to the Annexure for returns of all the schemes managed by them.
SIP Investments Since Inception SIP 1 Year SIP
Total Amount Invested (Rs) 1,40,000 1,20,000
Market value as on September 30, 2016 (Rs) 1,46,649 1,25,396
Returns (Annualised) 7.71% 8.44%
Benchmark Returns (Annualised) 13.49% 14.36%
Additional Benchmark Returns (Annualised) 12.22% 14.72%
Axis Equity Saver Fund - Growth Option

FUND STYLE
TYPE OF SCHEME / INVESTMENT OBJECTIVEAn Open-ended Growth SchemeTo achieve long term capital appreciation by investing in a diversified portfolio predominantly consisting of equity and equity related securities including derivatives. However, there can be no assurance that the investment objective of the Scheme will be achieved.
DATE OF ALLOTMENT5th January 2010
FUND MANAGER
Jinesh Gopani Work experience: 14 yearsHe has been managing this fund since 16th July 2016
Ashish NaikWork experience: 7 yearsHe has been managing this fund since 22nd June 2016
LATEST NAV (`) as on 30th September 2016 Regular Plan Direct PlanGrowth 20.33 21.17 Dividend 14.71 15.32
BENCHMARK
Nifty 50
FUND SIZE (`)Monthly Average AUM 2,184.07 Crore Latest AUM 2,124.84 Crore (as on 30th September 2016)
STATISTICAL MEASURES (3 years)Standard deviation 14.43%Beta 0.95Sharpe Ratio* 0.78
*Risk-free rate assumed to be 6.50% (MIBOR as on 30-09-16) Source: www.fimmda.org
Please note that as per AMFI guidelines for factsheet, the ratios are calculated based on month rolling returns (absolute) for last 3 years.
Data as on 30th September 2016. Source: ACEMF
PORTFOLIO TURNOVER* (1 year)0.57 times* Based on equity, equity derivatives and Fixed Income Securities transactions only. CBLO/Repo/FD/Margin FD/MFU/SLB are not considered.
MINIMUM INVESTMENT AMOUNT (`)5,000/1
MINIMUM ADDITIONAL PURCHASE AMOUNT (`)100/1
MINIMUM SIP INSTALLMENT AMOUNT (`)1,000/1
LOAD STRUCTUREEntry load - Not applicableExit load - 1% if Units are redeemed / switched-out within 12 months from the date of allotment (Effective from 1st October 2013)
PORTFOLIO
DIVIDENDS
FACTSHEET30th September 2016
Value
Inve
stm
ent S
tyle
Market Cap
Blend
Growth
Large Mid Small
Past performance may or may not be sustained in future. Calculations are based on Growth Option NAV. Since inception returns are calculated on ` 10 invested at inception. Since inception returns for Axis Equity Fund - Growth Option & Direct Plan - Growth Option are calculated from 5th January 2010 & 1st January 2013 respectively. Direct Plan was introduced on 1st January 2013.Jinesh Gopani manages 5 schemes & Ashish Naik manages 6 schemes. Please refer to annexure on Page 19 for performance of all schemes managed by the fund manager.
Please note that after the payment of dividend, the NAV falls to the extent of dividend, distribution tax and cess wherever applicable.Past performance may or may not be sustained in future. Face Value of units is ` 10Dividends disclosed above are since the inception of the fund.
Option Record Date
Direct PlanDividend (` Per unit) NAV per
unit (Cum Dividend)
NAV per unit (Ex
Dividend)
Dividend (` Per unit) NAV per unit (Cum Dividend)
NAV per unit (Ex
Dividend) Individu-als/ HUF Others Individu-
als/HUF Others
Dividend
March 10, 2016 1.00 1.00 13.78 12.78 1.00 1.00 14.24 13.24
March 05, 2015 1.00 1.00 16.53 15.53 1.00 1.00 16.89 15.89
March 17, 2014 1.00 1.00 12.57 11.57 1.00 1.00 12.69 11.69
2
SECTOR ALLOCATION (%)Banks 26.68Finance 10.09Auto 9.88Software 6.83Pharmaceuticals 6.80Construction Project 6.33Media & Entertainment 6.18Consumer Non Durables 5.42Gas 2.78Hotels, Resorts And Other Recreational Activities 2.53Transportation 2.41Industrial Capital Goods 2.30Petroleum Products 1.73Power 1.55Chemicals 1.49Industrial Products 1.38Cement 1.37Consumer Durables 1.17
¢¢¢¢¢¢¢¢¢¢
¢¢¢¢¢¢¢¢
SCHEME PERFORMANCE (as on 30th September 2016)
Sep 30, 2013 To Sep 30,
2014
Sep 30, 2014 To Sep 30,
2015
Sep 30, 2015 To Sep 30,
2016
Since Inception
Current Value of Investment if
` 10,000 wasinvested on
inception date
Date of inceptionAbsolute Return
(%)Absolute Return
(%)Absolute Return
(%) CAGR (%)
Axis Equity Fund - Growth 42.97% 5.45% 8.31% 11.10% 20,33005-Jan-10Nifty 50 (Benchmark) 38.87% -0.20% 8.33% 7.53% 16,315
S&P BSE Sensex (Additional Benchmark) 37.41% -1.79% 6.54% 6.98% 15,756Axis Equity Fund - Direct Plan - Growth 44.74% 6.61% 9.41% 15.89% 17,381
01-Jan-13Nifty 50 (Benchmark) 38.87% -0.20% 8.33% 10.36% 14,470S&P BSE Sensex (Additional Benchmark) 37.41% -1.79% 6.54% 9.87% 14,231
Banks 26.26HDFC Bank Limited 8.99ICICI Bank Limited 5.28Kotak Mahindra Bank Limited 4.75Bank of Baroda 3.60DCB Bank Limited 2.25IndusInd Bank Limited 1.41Finance 10.09HDFC Limited 6.89CRISIL Limited 1.84Cholamandalam Investment and Finance Company Limited 1.37Auto 9.88Maruti Suzuki India Limited 3.71Tata Motors Limited 3.19Mahindra & Mahindra Limited 2.98Software 6.83Infosys Limited 4.88Ramco Systems Limited 1.02Oracle Financial Services Software Limited 0.93Construction Project 6.33Larsen & Toubro Limited 6.33Pharmaceuticals 6.31Sun Pharmaceuticals Industries Limited 3.36Torrent Pharmaceuticals Limited 1.83Sanofi India Limited 1.12Media & Entertainment 6.18Zee Entertainment Enterprises Limited 6.18Consumer Non Durables 5.42Asian Paints Limited 4.05ITC Limited 1.36
Gas 2.78Indraprastha Gas Limited 1.65Gujarat State Petronet Limited 1.13Hotels, Resorts And Other Recreational Activities 2.53Mahindra Holidays & Resorts India Limited 2.53Transportation 2.41Gateway Distriparks Limited 1.21Gujarat Pipavav Port Limited 1.20Industrial Capital Goods 2.30Siemens Limited 1.57Bharat Electronics Limited 0.73Petroleum Products 1.73Gulf Oil Lubricants India Limited 1.73Power 1.55Torrent Power Limited 1.55Chemicals 1.49Tata Chemicals Limited 1.49Industrial Products 1.38Cummins India Limited 1.38Cement 1.37UltraTech Cement Limited 1.37Consumer Durables 1.17Bata India Limited 1.17Other Equity (less than 0.50% of the corpus) 0.90Total Equity 96.91Cash & Other Receivables 3.09
Net Assets 100%
Company Name Rating % of Assets
Company Name Rating % of Assets
For Statutory Details & Risk Factors please refer page 24.

FUND STYLE
TYPE OF SCHEME / INVESTMENT OBJECTIVEAn Open-ended Growth SchemeTo generate long term capital appreciation by investing in a concentrated portfolio of equity & equity related instruments of up to 25 companies.
DATE OF ALLOTMENT29th June 2012
FUND MANAGER
Jinesh Gopani Work experience: 14 yearsHe has been managing this fund since 07th June 2016
LATEST NAV (`) as on 30th September 2016
Regular Plan Direct PlanGrowth 19.79 20.70Dividend 16.63 20.46
BENCHMARK
Nifty 50 FUND SIZE (`)Monthly Average AUM 580.42 Crore Latest AUM 605.43 Crore (as on 30th September 2016)
STATISTICAL MEASURES (3 years)Standard deviation 15.00%Beta 0.98Sharpe Ratio* 0.95
*Risk-free rate assumed to be 6.50% (MIBOR as on 30-09-16) Source: www.fimmda.org
Please note that as per AMFI guidelines for factsheet, the ratios are calculated based on month rolling returns (absolute) for last 3 years. Data as on 30th September 2016. Source: ACEMF
PORTFOLIO TURNOVER* (1 year)
0.53 times* Based on equity, equity derivatives and Fixed Income Securities transactions only. CBLO/Repo/FD/Margin FD/MFU/SLB are not considered.
MINIMUM INVESTMENT AMOUNT (`)5,000/1
MINIMUM ADDITIONAL PURCHASE AMOUNT (`)100/1
MINIMUM SIP INSTALLMENT AMOUNT (`)1,000/1
LOAD STRUCTUREEntry load - Not applicableExit load - 1% if redeemed/ switched out within 1 year from the date of allotment. (w.e.f. 15th May 2015)
Banks 18.58Kotak Mahindra Bank Limited 7.08HDFC Bank Limited 6.02IndusInd Bank Limited 3.00RBL Bank Limited 2.49Finance 13.70Cholamandalam Investment and Finance Company Limited 5.59Gruh Finance Limited 4.06Bajaj Finance Limited 4.05Pharmaceuticals 8.62Sun Pharmaceuticals Industries Limited 6.15IPCA Laboratories Limited 2.48Software 6.43Tata Consultancy Services Limited 4.04Info Edge (India) Limited 2.39Cement 6.34Shree Cements Limited 6.34Auto Ancillaries 4.96Motherson Sumi Systems Limited 4.96Industrial Products 4.86Cummins India Limited 4.86Construction Project 4.40Larsen & Toubro Limited 4.40
Company Name % of Assets
Company Name % of Assets
PORTFOLIO
FACTSHEET30th September 2016
Past performance may or may not be sustained in future. Calculations are based on Growth Option NAV. Since inception returns are calculated on ̀ 10 invested at inception. Since inception returns for Axis Focused 25 Fund - Growth Option & Direct Plan - Growth Option are calculated from 29th June 2012 & 1st January 2013 respectively. Direct Plan was introduced on 1st January 2013.Jinesh Gopani manages 5 schemes. Please refer to annexure on Page 19 for performance of all schemes managed by the fund managers.
Market CapLarge Mid Small
Value
Inve
stm
ent S
tyle
Blend
Growth
3
SECTOR ALLOCATION (%)Banks 18.58Finance 13.70Pharmaceuticals 8.62Software 6.43Cement 6.34Auto Ancillaries 4.96Industrial Products 4.86Construction Project 4.40Media & Entertainment 4.37Chemicals 3.85Auto 3.80Consumer Non Durables 3.19Retailing 2.93Commercial Services 2.47Textile Products 2.45Industrial Capital Goods 2.33Petroleum Products 1.91
¢¢¢¢¢¢¢¢¢¢¢¢¢¢¢¢¢
Option Record Date Dividend (` Per unit) NAV per unit (Cum Dividend) NAV per unit (Ex Dividend) Individuals/HUF Others
DividendMarch 10, 2016 1.00 1.00 14.56 13.56February 25, 2015 1.75 1.75 17.90 16.15
Please note that after the payment of dividend, the NAV falls to the extent of dividend, distribution tax and cess wherever applicable.Past performance may or may not be sustained in future. Face Value of units is ` 10Dividends disclosed above are since the inception of the fund.
DIVIDENDS
SCHEME PERFORMANCE (as on 30th September 2016)
Sep 30, 2013 To Sep 30,
2014
Sep 30, 2014 To Sep 30,
2015
Sep 30, 2015 To Sep 30,
2016
Since Inception
Current Value of Investment if
` 10,000 wasinvested on
inception date
Date of inceptionAbsolute
Return (%)Absolute
Return (%)
Absolute Return
(%)
CAGR (%)
Axis Focused 25 Fund - Growth 37.04% 12.74% 14.06% 17.39% 19,790
29-Jun-12Nifty 50 (Benchmark) 38.87% -0.20% 8.33% 12.18% 16,312
S&P BSE 200 (Additional Benchmark) 42.50% 3.08% 10.96% 13.89% 17,397
Axis Focused 25 Fund - Direct Plan - Growth 38.52% 14.35% 15.45% 16.55% 17,753
01-Jan-13Nifty 50 (Benchmark) 38.87% -0.20% 8.33% 10.36% 14,470
S&P BSE 200 (Additional Benchmark) 42.50% 3.08% 10.96% 11.83% 15,205
Media & Entertainment 4.37Zee Entertainment Enterprises Limited 4.37Chemicals 3.85Pidilite Industries Limited 3.85Auto 3.80Maruti Suzuki India Limited 3.80Consumer Non Durables 3.19Nestle India Limited 3.19Retailing 2.93Trent Limited 2.93Commercial Services 2.47Quess Corp Limited 2.47Textile Products 2.45Page Industries Limited 2.45Industrial Capital Goods 2.33Siemens Limited 2.33Petroleum Products 1.91Castrol India Limited 1.91Finance 1.70HDFC Limited 1.70Total Equity 96.88Cash & Other Receivables 3.12
Net Assets 100%
For Statutory Details & Risk Factors please refer page 24.
FUND STYLE
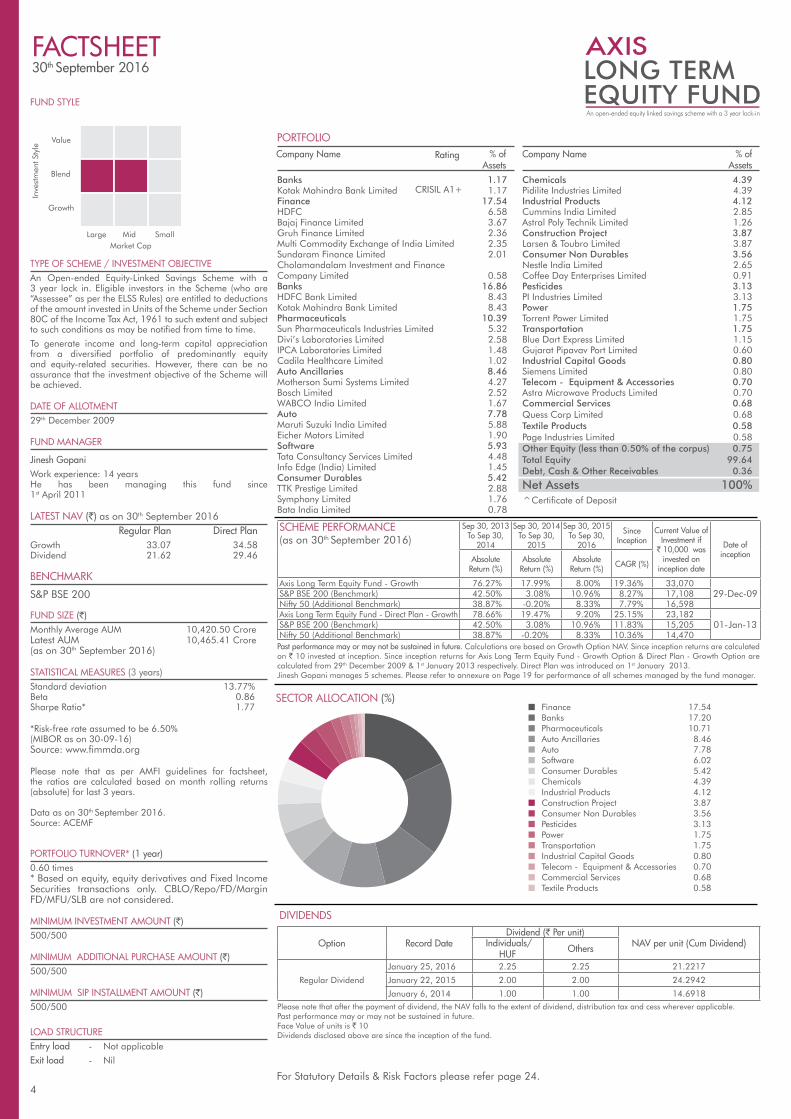
TYPE OF SCHEME / INVESTMENT OBJECTIVEAn Open-ended Equity-Linked Savings Scheme with a 3 year lock in. Eligible investors in the Scheme (who are “Assessee” as per the ELSS Rules) are entitled to deductions of the amount invested in Units of the Scheme under Section 80C of the Income Tax Act, 1961 to such extent and subject to such conditions as may be notified from time to time.
To generate income and long-term capital appreciation from a diversified portfolio of predominantly equity and equity-related securities. However, there can be no assurance that the investment objective of the Scheme will be achieved.
DATE OF ALLOTMENT29th December 2009
FUND MANAGER
Jinesh Gopani Work experience: 14 yearsHe has been managing this fund since 1st April 2011
LATEST NAV (`) as on 30th September 2016 Regular Plan Direct PlanGrowth 33.07 34.58Dividend 21.62 29.46
BENCHMARK
S&P BSE 200
FUND SIZE (`)Monthly Average AUM 10,420.50 Crore Latest AUM 10,465.41 Crore (as on 30th September 2016)
STATISTICAL MEASURES (3 years)Standard deviation 13.77%Beta 0.86Sharpe Ratio* 1.77
*Risk-free rate assumed to be 6.50% (MIBOR as on 30-09-16) Source: www.fimmda.org
Please note that as per AMFI guidelines for factsheet, the ratios are calculated based on month rolling returns (absolute) for last 3 years.
Data as on 30th September 2016. Source: ACEMF
PORTFOLIO TURNOVER* (1 year)0.60 times* Based on equity, equity derivatives and Fixed Income Securities transactions only. CBLO/Repo/FD/Margin FD/MFU/SLB are not considered.
MINIMUM INVESTMENT AMOUNT (`)500/500
MINIMUM ADDITIONAL PURCHASE AMOUNT (`)500/500
MINIMUM SIP INSTALLMENT AMOUNT (`)500/500
LOAD STRUCTUREEntry load - Not applicable
Exit load - Nil
Banks 1.17Kotak Mahindra Bank Limited 1.17Finance 17.54HDFC 6.58Bajaj Finance Limited 3.67Gruh Finance Limited 2.36Multi Commodity Exchange of India Limited 2.35Sundaram Finance Limited 2.01Cholamandalam Investment and Finance Company Limited 0.58Banks 16.86HDFC Bank Limited 8.43Kotak Mahindra Bank Limited 8.43Pharmaceuticals 10.39Sun Pharmaceuticals Industries Limited 5.32Divi’s Laboratories Limited 2.58IPCA Laboratories Limited 1.48Cadila Healthcare Limited 1.02Auto Ancillaries 8.46Motherson Sumi Systems Limited 4.27Bosch Limited 2.52WABCO India Limited 1.67Auto 7.78Maruti Suzuki India Limited 5.88Eicher Motors Limited 1.90Software 5.93Tata Consultancy Services Limited 4.48Info Edge (India) Limited 1.45Consumer Durables 5.42TTK Prestige Limited 2.88Symphony Limited 1.76Bata India Limited 0.78
Company Name % of Assets
Company Name % of Assets
PORTFOLIO
DIVIDENDS
FACTSHEET30th September 2016
Please note that after the payment of dividend, the NAV falls to the extent of dividend, distribution tax and cess wherever applicable.Past performance may or may not be sustained in future. Face Value of units is ` 10Dividends disclosed above are since the inception of the fund.
Option Record DateDividend (` Per unit)
NAV per unit (Cum Dividend) Individuals/ HUF Others
Regular Dividend
January 25, 2016 2.25 2.25 21.2217
January 22, 2015 2.00 2.00 24.2942
January 6, 2014 1.00 1.00 14.6918
Market CapLarge Mid Small
Value
Inve
stm
ent S
tyle
Blend
Growth
4
SECTOR ALLOCATION (%)Finance 17.54Banks 17.20Pharmaceuticals 10.71Auto Ancillaries 8.46Auto 7.78Software 6.02Consumer Durables 5.42Chemicals 4.39Industrial Products 4.12Construction Project 3.87Consumer Non Durables 3.56Pesticides 3.13Power 1.75Transportation 1.75Industrial Capital Goods 0.80Telecom - Equipment & Accessories 0.70Commercial Services 0.68Textile Products 0.58
¢¢¢¢¢¢¢¢¢¢¢¢¢¢¢¢¢¢
SCHEME PERFORMANCE (as on 30th September 2016)
Sep 30, 2013 To Sep 30,
2014
Sep 30, 2014 To Sep 30,
2015
Sep 30, 2015 To Sep 30,
2016
Since Inception
Current Value of Investment if
` 10,000 wasinvested on
inception date
Date of inceptionAbsolute
Return (%)Absolute
Return (%)Absolute
Return (%) CAGR (%)
Axis Long Term Equity Fund - Growth 76.27% 17.99% 8.00% 19.36% 33,07029-Dec-09S&P BSE 200 (Benchmark) 42.50% 3.08% 10.96% 8.27% 17,108
Nifty 50 (Additional Benchmark) 38.87% -0.20% 8.33% 7.79% 16,598Axis Long Term Equity Fund - Direct Plan - Growth 78.66% 19.47% 9.20% 25.15% 23,182
01-Jan-13S&P BSE 200 (Benchmark) 42.50% 3.08% 10.96% 11.83% 15,205Nifty 50 (Additional Benchmark) 38.87% -0.20% 8.33% 10.36% 14,470Past performance may or may not be sustained in future. Calculations are based on Growth Option NAV. Since inception returns are calculated on ` 10 invested at inception. Since inception returns for Axis Long Term Equity Fund - Growth Option & Direct Plan - Growth Option are calculated from 29th December 2009 & 1st January 2013 respectively. Direct Plan was introduced on 1st January 2013.Jinesh Gopani manages 5 schemes. Please refer to annexure on Page 19 for performance of all schemes managed by the fund manager.
Chemicals 4.39Pidilite Industries Limited 4.39Industrial Products 4.12Cummins India Limited 2.85Astral Poly Technik Limited 1.26Construction Project 3.87Larsen & Toubro Limited 3.87Consumer Non Durables 3.56Nestle India Limited 2.65Coffee Day Enterprises Limited 0.91Pesticides 3.13PI Industries Limited 3.13Power 1.75Torrent Power Limited 1.75Transportation 1.75Blue Dart Express Limited 1.15Gujarat Pipavav Port Limited 0.60Industrial Capital Goods 0.80Siemens Limited 0.80Telecom - Equipment & Accessories 0.70Astra Microwave Products Limited 0.70Commercial Services 0.68Quess Corp Limited 0.68Textile Products 0.58Page Industries Limited 0.58Other Equity (less than 0.50% of the corpus) 0.75Total Equity 99.64Debt, Cash & Other Receivables 0.36
Net Assets 100%
Rating
^Certificate of Deposit
For Statutory Details & Risk Factors please refer page 24.
CRISIL A1+

Finance 23.51Gruh Finance Limited 5.50Cholamandalam Investment and Finance Company Limited 5.03Multi Commodity Exchange of India Limited 3.73CRISIL Limited 3.28Bajaj Finserv Limited 3.03Sundaram Finance Limited 2.94Auto Ancillaries 11.81Motherson Sumi Systems Limited 5.06Amara Raja Batteries Limited 2.73WABCO India Limited 2.31Igarashi Motors India Limited 1.71Pharmaceuticals 7.99Sanofi India Limited 2.86Torrent Pharmaceuticals Limited 2.61Divi’s Laboratories Limited 2.51Auto 7.33V.S.T Tillers Tractors Limited 3.37Eicher Motors Limited 2.76Ashok Leyland Limited 1.20Consumer Non Durables 7.22Berger Paints (I) Limited 3.87Procter & Gamble Hygiene and Health Care Limited 3.36Media & Entertainment 6.04PVR Limited 3.64Zee Entertainment Enterprises Limited 2.40Textile Products 4.37Page Industries Limited 4.37
Company Name % of Assets
Company Name % of Assets
PORTFOLIO
FACTSHEET30th September 2016
Past performance may or may not be sustained in future. Calculations are based on Growth Option NAV. Since inception returns are calculated on ` 10 invested at inception. Since inception returns for Axis Midcap Fund - Growth Option & Direct Plan - Growth Option are calculated from 18th February 2011 & 1st January 2013 respectively. Direct Plan was introduced on 1st January 2013.Ashish Naik manages 6 schemes. Please refer to annexure on Page 19 for performance of all schemes managed by the fund manager.
5
DIVIDENDS
Please note that after the payment of dividend, the NAV falls to the extent of dividend, distribution tax and cess wherever applicable.Past performance may or may not be sustained in future. Face Value of units is ` 10Dividends disclosed above are since the inception of the fund.
Option Record Date
Direct PlanDividend (` Per unit) NAV per
unit (Cum Dividend)
NAV per unit (Ex
Dividend)
Dividend (` Per unit) NAV per unit (Cum Dividend)
NAV per unit (Ex
Dividend) Individu-als/ HUF Others Individu-
als/HUF Others
DividendSep 15, 2016 2.00 2.00 22.64 20.64 2.00 2.00 25.83 23.83Sep 10, 2015 1.75 1.75 23.29 21.54 1.75 - 26.04 24.29July 31, 2014 1.50 1.50 19.91 18.41 - - - -
SECTOR ALLOCATION (%)Finance 23.51Auto Ancillaries 11.81Pharmaceuticals 7.99Auto 7.33Consumer Non Durables 7.22Media & Entertainment 6.04Textile Products 4.37Petroleum Products 4.25Transportation 4.21Banks 4.20Industrial Products 3.26Chemicals 3.00Power 2.85Software 2.43Construction 2.10Industrial Capital Goods 1.58Consumer Durables 1.48
FUND STYLE
TYPE OF SCHEME / INVESTMENT OBJECTIVEAn Open-ended Equity Scheme.
To achieve long term capital appreciation by investing predominantly in equity & equity related instruments of mid size companies. The focus of the fund would be to invest in relatively larger companies within this category.
DATE OF ALLOTMENT18th February 2011
FUND MANAGER
Ashish NaikWork experience: 7 yearsHe has been managing this fund since 13th August 2016
LATEST NAV (`) as on 30th September 2016 Regular Plan Direct PlanGrowth 26.84 28.09Dividend 20.91 24.15
BENCHMARK
S&P BSE Midcap
FUND SIZE (`)Monthly Average AUM 1,344.80 Crore Latest AUM 1,310.48 Crore (as on 30th September 2016)
STATISTICAL MEASURES (3 years)
Standard deviation 18.88%Beta 1.05Sharpe Ratio* 1.35
*Risk-free rate assumed to be 6.50% (MIBOR as on 30-09-16) Source: www.fimmda.org
Please note that as per AMFI guidelines for factsheet, the ratios are calculated based on month rolling returns (absolute) for last 3 years.
Data as on 30th September 2016. Source: ACEMF
PORTFOLIO TURNOVER* (1 year)0.69 times* Based on equity, equity derivatives and Fixed Income Securities transactions only. CBLO/Repo/FD/Margin FD/MFU/SLB are not considered.
MINIMUM INVESTMENT AMOUNT (`)5,000/1
MINIMUM ADDITIONAL PURCHASE AMOUNT (`)100/1
MINIMUM SIP INSTALLMENT AMOUNT (`)1,000/1
LOAD STRUCTUREEntry load - Not applicable
Exit load - 1% if redeemed / switched - out within 12 months from the date of allotment (w.e.f. 5th May 2014)
Market CapLarge Mid Small
Value
Inve
stm
ent S
tyle
Blend
Growth
¢¢¢¢¢¢¢¢¢¢¢¢¢¢¢¢¢
SCHEME PERFORMANCE (as on 30th September 2016)
Sep 30, 2013 To Sep 30,
2014
Sep 30, 2014 To Sep 30,
2015
Sep 30, 2015 To Sep 30,
2016
Since Inception
Current Value of Investment if
` 10,000 wasinvested on
inception date
Date of inceptionAbsolute
Return (%)Absolute
Return (%)Absolute
Return (%) CAGR (%)
Axis Midcap Fund - Growth 89.00% 17.00% 4.27% 19.21% 26,84018-Feb-11S&P BSE Midcap (Benchmark) 70.00% 13.31% 21.92% 12.89% 19,765
Nifty 50 (Additional Benchmark) 38.87% -0.20% 8.33% 8.45% 15,774Axis Midcap Fund - Direct Plan - Growth 91.89% 18.47% 5.52% 21.14% 20,519
01-Jan-13S&P BSE Midcap (Benchmark) 70.00% 13.31% 21.92% 17.48% 18,293Nifty 50 (Additional Benchmark) 38.87% -0.20% 8.33% 10.36% 14,470
Petroleum Products 4.25Gulf Oil Lubricants India Limited 4.25Transportation 4.21Blue Dart Express Limited 1.72Gateway Distriparks Limited 1.54Container Corporation of India Limited 0.94Banks 4.20City Union Bank Limited 4.20Industrial Products 3.26Cummins India Limited 1.85FAG Bearings India Limited 1.40Chemicals 3.00Tata Chemicals Limited 3.00Power 2.85Torrent Power Limited 2.85Software 2.43Ramco Systems Limited 1.40Info Edge (India) Limited 1.03Construction 2.10ITD Cementation India Limited 2.10Industrial Capital Goods 1.58V-Guard Industries Limited 1.58Consumer Durables 1.48Blue Star Limited 1.48Total Equity 97.65Cash & Other Receivables 2.35Net Assets 100%
For Statutory Details & Risk Factors please refer page 24.

TYPE OF SCHEME / INVESTMENT OBJECTIVEAn Open-ended Equity SchemeThe investment objective of the scheme is to provide capital appreciation and income distribution to the investors by using equity and equity related instruments, arbitrage opportunities, and investments in debt and money market instruments. However, there is no assurance or guarantee that the investment objective of the Scheme will be achieved.
DATE OF ALLOTMENT14th August 2015
FUND MANAGERAnupam Tiwari Work experience: 10 years He has been managing this fund since 06th October 2016
R. Sivakumar Work experience: 16 years He has been managing this fund since inception
LATEST NAV (`) as on 30th September 2016 Regular Plan Direct PlanGrowth 10.53 10.68Dividend 10.22 9.94Monthly Dividend 10.34 10.50 Quarterly Dividend 10.34 10.47
BENCHMARK
Crisil MIP Blended Fund Index
FUND SIZE (`)Monthly Average AUM 1,010.72 Crore Latest AUM 967.69 Crore (as on 30th September 2016)
AVERAGE MATURITY@*5.0 years
MODIFIED DURATION@*3.3 years
PORTFOLIO YIELD (YIELD TO MATURITY &)7.69%
MINIMUM INVESTMENT AMOUNT (`)5000/1
MINIMUM ADDITIONAL PURCHASE AMOUNT (`)100/1
MINIMUM SIP INSTALLMENT AMOUNT (`)1000/1
LOAD STRUCTUREEntry load - NAExit load - If redeemed / switched-out within 12 months from the date of allotment, - For 10% of investments : NIL - For remaining investment : 1% If redeemed / switched - out after 12 months from the date of allotment : NIL
FACTSHEET30th September 2016
AXIS EQUITY SAVER FUND
PORTFOLIOCompany Name Rating % of Assets
Company Name Rating % of Assets
6
Ass
et C
lass
FUND STYLE
*Hedged Equity/ Cash-futures arbitrage
For Statutory Details & Risk Factors please refer page 24.
Equity
Duration
Debt
Equity Arbitrage
Low Mid High
Nestle India Limited 2.41Finance 5.77HDFC Limited 2.72Multi Commodity Exchange of India Limited 1.12Sundaram Finance Limited 1.93Industrial Capital Goods 1.49Siemens Limited 1.49Industrial Products 2.49Astral Poly Technik Limited 0.76Cummins India Limited 1.73Pesticides 1.29PI Industries Limited 1.29Pharmaceuticals 3.01Sun Pharmaceuticals Industries Limited 3.01Power 1.69Torrent Power Limited 1.69Software 2.96Tata Consultancy Services Limited 2.96Telecom - Equipment & Accessories 0.47Astra Microwave Products Limited 0.47Total Hedged Equity 22.92IDFC Limited 0.15Sun Pharmaceuticals Industries Limited 0.25Reliance Industries Limited 5.51Larsen & Toubro Limited 1.83Cipla Limited 0.83Asian Paints Limited 0.97Aurobindo Pharma Limited 0.67Tata Motors Limited 0.12Maruti Suzuki India Limited 0.61Kotak Mahindra Bank Limited 0.36Infosys Limited 5.55HDFC Limited 2.03HDFC Bank Limited 3.85Zee Entertainment Enterprises Limited 0.19Debt, Cash & Other Receivables 0.65
Net Assets 100%
Total Debt 32.07Total Fixed Deposit 3.10Corporate Bond 15.99Cholamandalam Investment and Finance Company Limited ICRA AA 4.71Reliance Jio Infocomm Limited CRISIL AAA 3.15HDFC Limited CRISIL AAA 2.30Power Finance Corporation Limited CRISIL AAA 1.95Indiabulls Housing Finance Limited CARE AAA 1.14Export Import Bank of India CRISIL AAA 1.12Dewan Housing Finance Corporation Limited BWR AAA 1.04Adani Properties Pvt. Ltd. BWR AA-(SO) 0.31Power Grid Corporation of India Limited CRISIL AAA 0.27Government Bond Sovereign 9.36Zero Coupon Bond 3.62JM Financial Products Ltd ICRA AA 2.00Sprit Textile Pvt. Ltd. BWR A+(SO) 1.62Total Equity 67.28Total Unhedged Equity 44.36Auto 2.04Maruti Suzuki India Limited 2.04Auto Ancillaries 2.19Motherson Sumi Systems Limited 2.19Banks 6.57HDFC Bank Limited 2.26Kotak Mahindra Bank Limited 4.30Cement 1.94Shree Cements Limited 1.94Chemicals 1.77Pidilite Industries Limited 1.77Construction Project 2.96Larsen & Toubro Limited 2.96Consumer Durables 4.34Bata India Limited 0.86Symphony Limited 1.48TTK Prestige Limited 2.00Consumer Non Durables 3.38Coffee Day Enterprises Limited 0.97
@ Based on debt portfolio only.* For instruments with put/call option, the put/call date has been taken as the maturity date.& The yield to maturity given above is based on the portfolio of funds as on date given above. This should not be taken as an indication of the returns that maybe generated by the fund and the securities bought by the fund may or may not be held till their respective maturities. The calculation is based on the invested corpus of the debt portfolio.
COMPOSITION BY ASSET (%) COMPOSITION BY RATING (%)@
¢ SOV, AAA & Equivalent ¢ ICRA AA ¢ BWR A+(SO) ¢ BWR AA-(SO)¢ Unhedged Equity ¢ Debt, Cash and Other Receivables ¢ Hedged Equity DIVIDENDS
Please note that after the payment of dividend, the NAV falls to the extent of dividend, distribution tax and cess wherever applicable.Past performance may or may not be sustained in future.Face Value of units is ` 10Dividends disclosed above are since the inception of the fund.
Option Record Date
Direct PlanDividend (` Per unit) NAV per
unit (Cum Dividend)
NAV per unit (Ex
Dividend)
Dividend (` Per unit) NAV per unit (Cum Dividend)
NAV per unit (Ex
Dividend) Individu-als/ HUF Others Individuals/
HUF Others
MonthlyDividend
Sep 26, 2016 0.0625 0.0625 10.4225 10.3600 0.0625 0.0625 10.5725 10.5100Aug 25, 2016 0.0620 0.0620 10.4520 10.3900 0.0620 0.0620 10.6020 10.5400Jul 28, 2016 0.0625 0.0625 10.5725 10.5100 0.0625 0.0625 10.6825 10.6200
Quarterly Dividend
Sep 26, 2016 0.1875 0.1875 10.5475 10.3600 0.1875 0.1875 10.6775 10.4900
SCHEME PERFORMANCE (as on 30th September 2016)
Sep 30, 2013 To Sep 30,
2014
Sep 30, 2014 To Sep 30,
2015
Sep 30, 2015 To Sep 30,
2016
Since Inception
Current Value of Investment if
` 10,000 wasinvested on
inception date
Date of inceptionAbsolute
Return (%)Absolute
Return (%)Absolute
Return (%) CAGR (%)
Axis Equity Saver Fund - Growth - - 5.62% 4.67% 10,53014-Aug-
15CRISIL MIP Blended Index (Benchmark) - - 11.17% 10.32% 11,176Nifty 50 (Additional Benchmark) - - 8.33% 0.96% 10,109Axis Equity Saver Fund - Direct Plan - Growth - - 6.91% 5.99% 10,680
14-Aug-15
CRISIL MIP Blended Index (Benchmark) - - 11.17% 10.32% 11,176Nifty 50 (Additional Benchmark) - - 8.33% 0.96% 10,109
Past performance may or may not be sustained in future. Calculations are based on Growth Option NAV. Since inception returns are calculated on ` 10 invested at inception. Since inception returns for Axis Equity Saver Fund - Growth Option & Direct Plan - Growth Option are calculated from 14th August 2015. Anupam Tiwari manages 2 schemes & R. Sivakumar manages 5 schemes. Please refer to annexure on Page 19 - 22 for performance of all schemes managed by the fund managers.
44.36%
32.72%
22.92%
20.98%
6.71%
1.62% 0.31%

FUND STYLE
TYPE OF SCHEME / INVESTMENT OBJECTIVEAn Open-ended Hybrid Fund
To generate long term capital appreciation by investing in a diversified portfolio of equity and equity related instruments, fixed income instruments & gold exchange traded funds.
DATE OF ALLOTMENT23rd August 2010
FUND MANAGERR. Sivakumar Work experience: 16 yearsHe has been managing the fund since 14th September 2010
Ashish Naik
Work experience: 7 yearsHe has been managing this fund since 22nd June 2016
LATEST NAV (`) as on 30th September 2016
Regular Plan Direct PlanGrowth 16.7646 17.3955Dividend 13.6732 14.9748
BENCHMARK
35% of Nifty 50 + 35% of Crisil Composite Bond Fund Index + 30% Of INR Price of Gold
FUND SIZE (`) Monthly Average AUM 366.67 Crore Latest AUM 363.47 Crore (as on 30th September 2016)
AVERAGE MATURITY@*8.5 years
MODIFIED DURATION@*5.4 years
PORTFOLIO YIELD (YIELD TO MATURITY &)7.89%
MINIMUM INVESTMENT AMOUNT (`)5,000/1
MINIMUM ADDITIONAL PURCHASE AMOUNT (`)100/1
MINIMUM SIP INSTALLMENT AMOUNT (`)1,000/1
LOAD STRUCTUREEntry load - Not applicableExit load - If redeemed/switch out within 12 months from the date of allotment:- For 10% of investment : Nil- For remaining investment : 1%If redeemed/switch out after 12 months from thedate of allotment: Nil(w.e.f. 15th June 2015)
PORTFOLIO
DIVIDENDS
FACTSHEET30th September 2016
Equity
Ass
et C
lass
Debt
Gold
DurationLow Mid High
Past performance may or may not be sustained in future. Calculations are based on Growth Option NAV. Since inception returns are calculated on ` 10 invested at inception. Since inception returns for Axis Triple Advantage Fund - Growth Option & Direct Plan - Growth Option are calculated from 23rd August 2010 & 1st January 2013 respectively. Direct Plan was introduced on 1st January 2013.R. Sivakumar manages 5 schemes & Ashish Naik manages 6 schemes. Please refer to annexure on Page 19 for performance of all schemes managed by the fund managers. Scheme Performance may not be strictly comparable with that of its additional benchmark in view of hybrid nature of the scheme.
Please note that after the payment of dividend, the NAV falls to the extent of dividend, distribution tax and cess wherever applicable. Past performance may or may not be sustained in future. Face Value of units is ̀ 10. Dividends disclosed above are since the inception of the fund. @ Based on debt portfolio only.* For instruments with put/call option, the put/call date has been taken as the maturity date.& The yield to maturity given above is based on the portfolio of funds as on date given above. This should not be taken as an indication of the returns that maybe generated by the fund and the securities bought by the fund may or may not be held till their respective maturities. The calculation is based on the invested corpus of the debt portfolio.
Option Record Date Dividend (` Per unit) NAV per unit (Cum Dividend) NAV per unit (Ex Dividend) Individuals/HUF Others
DividendApril 17, 2014 0.4676 0.4478 11.3222 10.7222 September 17, 2012 0.7047 0.6040 11.2694 10.4694 September 21, 2011 0.7047 0.6040 10.9561 10.1561
Company Name Rating % of Assets
Company Name Rating % of Assets
7
COMPOSITION BY ASSET (%) COMPOSITION BY RATING (%)@
¢ CRISIL AAA & Equivalent ¢ SOV ¢ CRISIL AA- ¢ CRISIL AA+
¢ Debt^¢ Equity ¢ ETFs ^ Includes Net Current Assets
SCHEME PERFORMANCE (as on 30th September 2016)
Sep 30, 2013 To Sep 30,
2014
Sep 30, 2014 To Sep 30,
2015
Sep 30, 2015 To Sep 30,
2016
Since Inception
Current Value of Investment if
` 10,000 wasinvested on
inception date
Date of inceptionAbsolute
Return (%)Absolute
Return (%)Absolute
Return (%) CAGR (%)
Axis Triple Advantage Fund - Growth 15.37% 6.11% 11.55% 8.82% 16,76523-Aug-
1035% of Nifty 50 + 35% of Crisil Composite Bond Fund Index + 30% Of INR Price of Gold (Benchmark)
13.03% 4.17% 13.67% 8.66% 16,613
Crisil 10 Year Gilt Index (Additional Benchmark) 6.85% 13.76% 11.11% 7.67% 15,708Axis Triple Advantage Fund - Direct Plan Growth 16.92% 7.12% 12.52% 8.79% 13,711
01-Jan-13
35% of Nifty 50 + 35% of Crisil Composite Bond Fund Index + 30% Of INR Price of Gold (Benchmark)
13.03% 4.17% 13.67% 7.34% 13,041
Crisil 10 Year Gilt Index (Additional Benchmark) 6.85% 13.76% 11.11% 8.15% 13,415
Auto Ancillaries 2.71WABCO India Limited 1.03Motherson Sumi Systems Limited 0.85Amara Raja Batteries Limited 0.84Auto 1.98Maruti Suzuki India Limited 1.07Eicher Motors Limited 0.91Construction Project 1.66Larsen & Toubro Limited 1.66Consumer Durables 1.63Blue Star Limited 1.63Pharmaceuticals 1.55Sun Pharmaceuticals Industries Limited 0.92Cadila Healthcare Limited 0.63Transportation 1.44Container Corporation of India Limited 0.76Blue Dart Express Limited 0.68Cement 1.26Shree Cements Limited 1.26Industrial Products 1.19Cummins India Limited 1.19Pesticides 1.09PI Industries Limited 1.09Industrial Capital Goods 0.80Siemens Limited 0.80Power 0.76Torrent Power Limited 0.76Exchange Traded Funds 29.71Axis Gold ETF 29.71Net Current Assets 1.36
Net Assets 100%
Total Debt 33.93Corporate Bond 25.21Reliance Gas Transportation Infrastructure Ltd CRISIL AAA 7.07Rural Electrification Corporation Limited CRISIL AAA 6.08Hindalco Industries Limited CRISIL AA- 4.37Tata Power Company Limited CRISIL AA- 3.58Shriram Transport Finance Company Limited CRISIL AA+ 2.23Power Finance Corporation Limited CRISIL AAA 1.07India Infrastructure Fin Co Ltd CRISIL AAA 0.83Government Bond Sovereign 8.72Total Equity 35.00Banks 6.97Kotak Mahindra Bank Limited 2.62HDFC Bank Limited 2.50ICICI Bank Limited 1.84Finance 5.02HDFC Limited 2.30Gruh Finance Limited 0.90Max Financial Services Limited 0.69Cholamandalam Investment and Finance Company Limited 0.57Bajaj Holdings & Investment Limited 0.55Software 3.64Tata Consultancy Services Limited 1.74Infosys Limited 0.95Info Edge (India) Limited 0.95Consumer Non Durables 3.31ITC Limited 1.52Asian Paints Limited 1.26Emami Limited 0.53
For Statutory Details & Risk Factors please refer page 24.
16.40%
8.72%
7.94%
2.23%35.29%
35.00%
29.71%

FUND STYLE
TYPE OF SCHEME / INVESTMENT OBJECTIVEAn Open-ended Income FundTo generate regular income through investments in debt & money market instruments, along with capital appreciation through limited exposure to equity and equity related instruments. It also aims to manage risk through active asset allocation.
DATE OF ALLOTMENT16th July 2010
FUND MANAGER
Devang ShahWork experience: 11 yearsHe has been managing this fund since 07th June 2016
Jinesh GopaniWork experience: 14 yearsHe has been managing this fund since 2nd September 2013
Ashish NaikWork experience: 7 yearsHe has been managing this fund since 22nd June 2016
LATEST NAV (`) as on 30th September 2016
Regular Plan Direct PlanGrowth 16.8550 17.7484Quarterly Dividend 11.1632 13.1318Half yearly Dividend 11.4382 11.8574Annual Dividend 12.3730 12.5329
BENCHMARK
Crisil MIP Blended Fund Index
FUND SIZE (`)
Monthly Average AUM 664.75 Crore Latest AUM 671.02 Crore (as on 30th September 2016)
AVERAGE MATURITY@*
1.1 yearsMODIFIED DURATION@*
1 year
PORTFOLIO YIELD (YIELD TO MATURITY &)
7.84%MINIMUM INVESTMENT AMOUNT (`)
5,000/1MINIMUM ADDITIONAL PURCHASE AMOUNT (`)
100/1MINIMUM SIP INSTALLMENT AMOUNT (`)
1,000/1LOAD STRUCTURE
Entry load - Not applicableExit load - If redeemed/switch out within 12 months from the date of allotment:- For 10% of investment : Nil- For remaining investment : 1%If redeemed/switch out after 12 months from thedate of allotment: Nil(w.e.f. 15th June 2015)
PORTFOLIO
DIVIDENDS
FACTSHEET30th September 2016
Please note that after the payment of dividend, the NAV falls to the extent of dividend, distribution tax and cess wherever applicable.Past performance may or may not be sustained in future.Face Value of units is ` 10Annual Dividends disclosed above are since inception. Half Yearly Dividends disclosed above are for the last 2 Years. Quarterly Dividends disclosed above are for the last 3 quarters.@ Based on debt portfolio only.* For instruments with put/call option, the put/call date has been taken as the maturity date.& The yield to maturity given above is based on the portfolio of funds as on date given above. This should not be taken as an indication of the returns that maybe generated by the fund and the securities bought by the fund may or may not be held till their respective maturities. The calculation is based on the invested corpus of the debt portfolio.For Statutory Details & Risk Factors please refer page 24.
Company Name Rating % of Assets
Company Name Rating % of Assets
Option Record Date
Direct PlanDividend (` Per unit) NAV per
unit (Cum Dividend)
NAV per unit (Ex
Dividend)
Dividend (` Per unit) NAV per unit (Cum Dividend)
NAV per unit (Ex
Dividend) Individuals/
HUF Others Individuals/HUF Others
Annual Dividend
March 28, 2016 0.7222 0.6691 12.5739 11.5739 0.7222 0.6691 12.6583 11.6583March 25, 2015 0.3629 0.3365 12.6035 12.1035 0.3629 0.3365 12.5849 12.0849March 25, 2014 0.3117 0.2985 10.9526 10.5526 - - - -March 25, 2013 0.7928 0.6795 10.9668 10.0668 - - - -
Half Yearly
Dividend
September 26, 2016 0.3611 0.3346 11.9394 11.4394 0.3611 0.3346 12.3576 11.8576March 28, 2016 0.3611 0.3345 11.6671 11.1671 0.3611 0.3345 11.9950 11.4950September 28, 2015 0.3611 0.3345 12.0570 11.5570 0.3611 0.3345 12.3170 11.8170March 25, 2015 0.3629 0.3365 12.2152 11.7152 0.3629 0.3365 12.4039 11.9039
QuarterlyDividend
September 26, 2016 0.1806 0.1673 11.4144 11.1644 0.1806 0.1673 13.3820 13.1320June 27, 2016 0.1805 0.1672 11.2342 10.9842 0.1805 0.1672 13.0924 12.8424March 28, 2016 0.1805 0.1672 11.1691 10.9191 0.1805 0.1672 12.9320 12.6820
Past performance may or may not be sustained in future. Calculations are based on Growth Option NAV. Since inception returns are calculated on ` 10 invested at inception. Since inception returns for Axis Income Saver - Growth Option & Direct Plan - Growth Option are calculated from 16th July 2010 & 4th January 2013 respectively. Direct Plan was introduced on 1st January 2013.Jinesh Gopani manages 5 schemes, Devang Shah manages 46 schemes & Ashish Naik manages 6 schemes. Please refer to annexure on Page 19 & 20 for performance of all schemes managed by the fund managers. Scheme Performance may not be strictly comparable with that of its additional benchmark in view of hybrid nature of the scheme.
Equity
Ass
et C
lass
Debt
8
COMPOSITION BY ASSET (%) COMPOSITION BY RATING (%)@
¢ Debt^ ¢ Equity^ Includes Net Current Assets
SCHEME PERFORMANCE (as on 30th September 2016)
Sep 30, 2013 To Sep 30,
2014
Sep 30, 2014 To Sep 30,
2015
Sep 30, 2015 To Sep 30,
2016
Since Inception
Current Value of Investment if
` 10,000 wasinvested on
inception date
Date of inceptionAbsolute
Return (%)Absolute
Return (%)Absolute
Return (%) CAGR (%)
Axis Income Saver - Growth 20.67% 9.37% 7.61% 8.76% 16,85516-Jul-10Crisil MIP Blended Fund Index (Benchmark) 15.45% 10.72% 11.17% 8.84% 16,926
CRISIL 10 year Gilt Index (Additional Benchmark) 6.85% 13.76% 11.11% 7.25% 15,450Axis Income Saver - Direct Plan - Growth 22.58% 11.00% 9.35% 11.60% 15,077
04-Jan-13Crisil MIP Blended Fund Index (Benchmark) 15.45% 10.72% 11.17% 9.89% 14,229CRISIL 10 year Gilt Index (Additional Benchmark) 6.85% 13.76% 11.11% 8.03% 13,351
¢ ICRA A1+/ CRISIL A1+/ CRISIL AAA/ CARE AAA & Equivalent ¢ ICRA AA/ CRISIL AA/ ICRA AA(SO)/ IND AA ¢ CARE AA-/ IND AA-(SO)¢ BWR A+(SO) ¢ CRISIL AA+/ ICRA AA+/ IND AA+
Multi Commodity Exchange of India Limited 1.61ICICI Prudential Life Insurance Company Limited 0.69Cholamandalam Investment and Finance Company Limited 0.54Auto 3.89Maruti Suzuki India Limited 2.04Eicher Motors Limited 1.85Pharmaceuticals 3.76Sun Pharmaceuticals Industries Limited 2.05Divi’s Laboratories Limited 1.15Lupin Limited 0.55Software 2.34Tata Consultancy Services Limited 1.74Info Edge (India) Limited 0.60Auto Ancillaries 2.18Motherson Sumi Systems Limited 1.45Amara Raja Batteries Limited 0.74Cement 1.78Shree Cements Limited 1.78Transportation 1.74Container Corporation of India Limited 0.93Blue Dart Express Limited 0.82Consumer Non Durables 1.25Nestle India Limited 1.25Pesticides 1.24PI Industries Limited 1.24Industrial Products 1.15Cummins India Limited 1.15Consumer Durables 1.03Titan Company Limited 1.03Construction Project 0.85Larsen & Toubro Limited 0.85Chemicals 0.79Pidilite Industries Limited 0.79Power 0.62Torrent Power Limited 0.62Other Equity (less than 0.50% of the corpus) 0.67Net Current Assets 10.38
Net Assets 100%
DurationLow Mid High
Total Debt 44.21Corporate Bond 29.12Power Finance Corporation Limited CRISIL AAA 8.63Tata Sons Ltd CRISIL AAA 5.64Rural Electrification Corporation Limited CRISIL AAA 5.21Indiabulls Housing Finance Limited CARE AAA 2.85SRF Limited IND AA 1.63Cholamandalam Investment and Finance Company Limited ICRA AA 1.51Export Import Bank of India CRISIL AAA 1.50HDFC Limited CRISIL AAA 0.85Nirchem Cement Limited CRISIL AA 0.75Shriram Transport Finance Company Limited CRISIL AA+ 0.28Adani Ports and Special Economic Zone Limited ICRA AA+ 0.26Blue Dart Express Limited ICRA AA 0.02Zero Coupon Bond 15.09SVL Ltd. ICRA AA(SO) 4.44JM Financial Products Ltd ICRA AA 2.40Dev Infracity Pvt Ltd IND AA-(SO) 2.38Sprit Textile Pvt. Ltd. BWR A+(SO) 2.15India Infoline Finance Ltd ICRA AA 1.84Magma Fincorp Limited CARE AA- 1.66Dewan Housing Finance Corporation Limited CARE AAA 0.17Shriram Transport Finance Company Limited IND AA+ 0.03Total Money Market Instruments^ 12.95Banks 9.31Dena Bank CRISIL A1+ 6.51ICICI Bank Limited ICRA A1+ 1.42IDBI Bank Limited CRISIL A1+ 1.38Others 3.64HDFC Limited ICRA A1+ 3.64Total Equity 32.46Banks 4.25Kotak Mahindra Bank Limited 2.15HDFC Bank Limited 2.10Finance 4.92HDFC Limited 2.08
Equity Arbitrage
^Certificate of Deposit/Commercial Paper
48.17%
12.60%
4.04%2.15% 0.57%
67.54%
32.46%

FUND STYLE
TYPE OF SCHEME / INVESTMENT OBJECTIVEAn Open-ended Gilt Scheme
To generate returns similar to that of 10 year government bonds.
DATE OF ALLOTMENT23rd January 2012
FUND MANAGERDevang ShahWork experience: 11 years
He has been managing this fund since 5th November 2012.
LATEST NAV (`) as on 30th September 2016
Regular Plan Direct PlanGrowth 14.3310 14.6107Regular Dividend 10.3626 10.3665Half yearly Dividend 11.7198 -Bonus - 14.6105
BENCHMARK
Crisil 10 Year Gilt Index
FUND SIZE (`)Monthly Average AUM 84.71 Crore Latest AUM 70.14 Crore (as on 30th September 2016)
AVERAGE MATURITY9.4 years
MODIFIED DURATION6.1 years
PORTFOLIO YIELD (YIELD TO MATURITY &)6.91%
MINIMUM INVESTMENT AMOUNT (`)5,000/1
MINIMUM ADDITIONAL PURCHASE AMOUNT (`)100/1
MINIMUM SIP INSTALLMENT AMOUNT (`)1000/1
LOAD STRUCTUREEntry load - Not applicable
Exit load - Nil
PORTFOLIO
FACTSHEET30th September 2016
High
Inte
rnal
Rat
e Se
nsiti
vity
Credit Quality
Med
Low
High Mid Low
& The yield to maturity given above is based on the portfolio of funds as on date given above. This should not be taken as an indication of the returns that maybe generated by the fund and the securities bought by the fund may or may not be held till their respective maturities. The calculation is based on the invested corpus.
Company Name Rating % of Assets
DIVIDENDS
Please note that after the payment of dividend, the NAV falls to the extent of dividend, distribution tax and cess wherever applicable.Past performance may or may not be sustained in future.Face Value of units is ` 10Half yearly dividend disclosed above are since the inception of the fund. Regular dividends disclosed above are for the last 3 months.
Option Record Date
Direct PlanDividend (` Per unit) NAV per
unit (Cum Dividend)
NAV per unit (Ex
Dividend)
Dividend (` Per unit) NAV per unit (Cum Dividend)
NAV per unit (Ex
Dividend) Individu-als/ HUF Others Individu-
als/HUF Others
Half Yearly Dividend
September 26, 2016 0.1806 0.1673 11.9880 11.7380 - - - -March 28, 2016 0.3611 0.3345 11.5547 11.0547 0.3611 0.3345 11.7019 11.2019September 28, 2015 0.1805 0.1672 11.5626 11.1994 0.1805 0.1672 11.4494 11.3126
RegularDividend
September 26, 2016 0.0703 0.0960 10.4643 10.3669 0.0736 - 10.4723 10.3703August 25, 2016 0.0927 0.1295 10.4218 10.2934 0.0961 - 10.4296 10.2966July 25, 2016 0.0817 0.1146 10.3742 10.2610 0.0849 - 10.3817 10.2641
Past performance may or may not be sustained in future. Calculations are based on Growth Option NAV. Since inception returns are calculated on ̀ 10 invested at inception. Since inception returns for Axis Constant Maturity 10 Year Fund - Growth Option & Direct Plan - Growth Option are calculated from 23rd January 2012 & 1st January 2013 respectively. Direct Plan was introduced on 1st January 2013.Devang Shah manages 46 schemes. Please refer to annexure on Page 19 & 20 for performance of all schemes managed by the fund manager.
9
COMPOSITION BY ASSET (%) COMPOSITION BY RATING (%)@
¢ Government Bond ¢ Total Money Market Instruments^ ^ Includes Net Current Assets
SCHEME PERFORMANCE (as on 30th September 2016)
Sep 30, 2013 To Sep 30,
2014
Sep 30, 2014 To Sep 30,
2015
Sep 30, 2015 To Sep 30,
2016
Since Inception
Current Value of Investment if `
10,000 was invested on inception date
Date of inceptionAbsolute
Return (%)Absolute
Return (%)Absolute
Return (%) CAGR (%)
Axis Constant Maturity 10 Year Fund - Growth 8.71% 13.03% 11.14% 7.97% 14,33123-Jan-12
Crisil 10 Year Gilt Index (Benchmark) 6.85% 13.76% 11.11% 8.17% 14,457Axis Constant Maturity 10 Year Fund - Direct Plan - Growth
9.18% 13.57% 11.72% 8.70% 13,67301-Jan-13
Crisil 10 Year Gilt Index (Benchmark) 6.85% 13.76% 11.11% 8.15% 13,415
Total Debt 92.09Government Bond 92.097.59% GOI Sovereign 41.628.60% GOI Sovereign 10.967.61% GOI Sovereign 7.527.35% GOI Sovereign 7.288.20% GOI Sovereign 4.607.88% GOI Sovereign 4.587.68% GOI Sovereign 4.458.28% GOI Sovereign 3.898.83% GOI Sovereign 3.148.40% GOI Sovereign 2.468.17% GOI Sovereign 1.59Net Current Assets 7.91
Net Assets 100%
¢ SOV & Equivalent
For Statutory Details & Risk Factors please refer page 24.
100.00%
92.09%
7.91%

FUND STYLE
TYPE OF SCHEME / INVESTMENT OBJECTIVEAn Open-ended Debt Scheme
To generate optimal returns while maintaining liquidity through active management of a portfolio of debt and money market instruments.
DATE OF ALLOTMENT27th April 2011
FUND MANAGER
R. SivakumarWork experience: 16 yearsHe has been managing this fund since inception
Devang ShahWork experience: 11 yearsHe has been managing this fund since 5th November 2012.
LATEST NAV (`) as on 30th September 2016
Regular Plan Direct PlanGrowth 16.3444 17.1219Quarterly Dividend 10.6887 11.2466Half Yearly Dividend 10.8816 11.3895
BENCHMARK
Crisil Composite Bond Fund Index
FUND SIZE (`) Monthly Average AUM 298.57 Crore Latest AUM 298.61 Crore (as on 30th September 2016)
AVERAGE MATURITY*8.9 years
MODIFIED DURATION*5.6 years
PORTFOLIO YIELD (YIELD TO MATURITY &)7.48%
MINIMUM INVESTMENT AMOUNT (`)5,000/1
MINIMUM ADDITIONAL PURCHASE AMOUNT (`)100/1
MINIMUM SIP INSTALLMENT AMOUNT (`)1000/1
LOAD STRUCTUREEntry load - Not applicable
Exit load - If redeemed/switched out within 12 months from the date of allotment:- For 10% of investment : Nil- For remaining investment : 1% If redeemed/switched out after 12 months from the date of allotment: Nil (w.e.f. 22nd June 2015)
FACTSHEET30th September 2016
High
Inte
rnal
Rat
e Se
nsiti
vity
Credit Quality
Med
Low
High Mid Low
& The yield to maturity given above is based on the portfolio of funds as on date given above. This should not be taken as an indication of the returns that maybe generated by the fund and the securities bought by the fund may or may not be held till their respective maturities. The calculation is based on the invested corpus.
DIVIDENDS
Please note that after the payment of dividend, the NAV falls to the extent of dividend, distribution tax and cess wherever applicable.Past performance may or may not be sustained in future.Face Value of units is ` 10Half Yearly Dividends disclosed above are for the last 2 Years. Quarterly Dividends disclosed above are for the last 3 quarters.* For instruments with put/call option, the put/call date has been taken as the maturity date.
Option Record Date
Direct PlanDividend (` Per unit) NAV per
unit (Cum Dividend)
NAV per unit (Ex
Dividend)
Dividend (` Per unit) NAV per unit (Cum Dividend)
NAV per unit (Ex
Dividend) Individuals/
HUF Others Individuals/HUF Others
Half Yearly
Dividend
September 26, 2016 0.3611 0.3346 11.3942 10.8942 0.3611 0.3346 11.9017 11.4017March 28, 2016 0.3611 0.3345 11.0764 10.5764 0.3611 0.3345 11.4947 10.9947September 28, 2015 0.2889 0.2676 11.1709 10.7709 0.2889 0.2676 11.5136 11.1136March 25, 2015 0.3629 0.3365 11.2365 10.7365 0.3629 0.3365 11.4928 10.9928
QuarterlyDividend
September 26, 2016 0.1806 0.1673 10.9510 10.7010 0.1806 0.1673 11.5087 11.2587June 27, 2016 0.1805 0.1672 10.6589 10.4089 0.1805 0.1672 11.1621 10.9121March 28, 2016 0.1444 0.1338 10.6095 10.4095 0.1805 0.1672 11.1245 10.8745
Past performance may or may not be sustained in future. Calculations are based on Growth Option NAV. Since inception returns are calculated on ` 10 invested at inception. Since inception returns for Axis Dynamic Bond Fund - Growth Option & Direct Plan - Growth Option are calculated from 27th April 2011 & 1st January 2013 respectively. Direct Plan was introduced on 1st January 2013.R. Sivakumar manages 5 schemes & Devang Shah manages 46 schemes. Please refer to annexure on Page 19 & 20 for performance of all schemes managed by the fund managers.
10
COMPOSITION BY ASSET (%) COMPOSITION BY RATING (%)
¢ SOV ¢ CRISIL AAA/ BWR AAA/ ICRA AAA & Equivalent ¢ ICRA AA+ ¢ ICRA AA ¢ CRISIL AA-/ BWR AA-(SO)
¢ Corporate Bond ¢ Government Bond ¢ Total Money Market Instruments^
¢ Zero Coupon Bond ¢ State Government Bond^ Includes Net Current Assets
SCHEME PERFORMANCE (as on 30th September 2016)
Sep 30, 2013 To Sep 30,
2014
Sep 30, 2014 To Sep 30,
2015
Sep 30, 2015 To Sep 30,
2016
Since Inception
Current Value of Investment if
` 10,000 wasinvested on
inception date
Date of inceptionAbsolute
Return (%)Absolute
Return (%)Absolute
Return (%) CAGR (%)
Axis Dynamic Bond Fund - Growth 9.49% 13.26% 10.14% 9.46% 16,34427-Apr-
11Crisil Composite Bond Fund Index (Benchmark) 11.61% 12.56% 11.51% 9.43% 16,316CRISIL 10 year Gilt Index (Additional Benchmark) 6.85% 13.76% 11.11% 7.90% 15,114Axis Dynamic Bond Fund - Direct Plan -Growth 11.13% 14.71% 11.32% 10.81% 14,692
01-Jan-13
Crisil Composite Bond Fund Index (Benchmark) 11.61% 12.56% 11.51% 9.74% 14,166CRISIL 10 year Gilt Index (Additional Benchmark) 6.85% 13.76% 11.11% 8.15% 13,415
PORTFOLIOCompany Name Rating % of Assets
Company Name Rating % of Assets
Total Debt 95.15Corporate Bond 49.93Power Finance Corporation Limited CRISIL AAA 8.46Yes Bank Limited ICRA AA+ 6.71Reliance Gas Transportation Infrastructure Ltd CRISIL AAA 6.10Power Grid Corporation of India Limited CRISIL AAA 5.24Rural Electrification Corporation Limited CRISIL AAA 4.59Reliance Jio Infocomm Limited CRISIL AAA 4.25Cholamandalam Investment and Finance Company Limited ICRA AA 3.42IDFC Bank Limited ICRA AAA 2.62HDFC Bank Limited CRISIL AAA 1.70Vedanta Limited CRISIL AA- 1.69
Dewan Housing Finance Corporation Limited BWR AAA 1.68Tata Power Company Limited CRISIL AA- 1.45Adani Properties Pvt. Ltd. BWR AA-(SO) 1.01India Infrastructure Fin Co Ltd CRISIL AAA 1.01Government Bond Sovereign 43.27Zero Coupon Bond 1.08JM Financial Products Ltd ICRA AA 1.08State Government Bond Sovereign 0.87Net Current Assets 4.85
Net Assets 100%
For Statutory Details & Risk Factors please refer page 24.
44.15%40.49%
6.71%
4.50% 4.15%
49.93%43.27%
4.85%1.08%
0.87%

FUND STYLE
TYPE OF SCHEME / INVESTMENT OBJECTIVEAn Open-ended Debt Scheme
To generate optimal returns in the medium term while maintaining liquidity of the portfolio by investing in debt and money market instruments.
DATE OF ALLOTMENT28th March 2012
FUND MANAGER
Devang ShahWork experience: 11 yearsHe has been managing this fund since 5th November 2012.
LATEST NAV (`) as on 30th September 2016
Regular Plan Direct PlanGrowth 15.1959 15.7449Quarterly Dividend 10.6426 11.1088Half yearly Dividend 10.9957 11.1546
BENCHMARK
Crisil Composite Bond Fund Index
FUND SIZE (`)Monthly Average AUM 215.95 Crore Latest AUM 214.30 Crore (as on 30th September 2016)
AVERAGE MATURITY*6.2 years
MODIFIED DURATION*4.3 years
PORTFOLIO YIELD (YIELD TO MATURITY &)7.84%
MINIMUM INVESTMENT AMOUNT (`)5,000/1
MINIMUM ADDITIONAL PURCHASE AMOUNT (`)100/1
MINIMUM SIP INSTALLMENT AMOUNT (`)1,000/1
LOAD STRUCTUREEntry load - Not applicable
Exit load - If redeemed / switched-out within 12 months from the date of allotmentFor 10% of investment : NilFor remaining investment : 1%If redeemed/switched out after 12 months from the date of allotment : Nil (w.e.f. 30th June 2016)
DIVIDENDS
FACTSHEET30th September 2016
& The yield to maturity given above is based on the portfolio of funds as on date given above. This should not be taken as an indication of the returns that maybe generated by the fund and the securities bought by the fund may or may not be held till their respective maturities. The calculation is based on the invested corpus.
Option Record Date
Direct PlanDividend (` Per unit) NAV per
unit (Cum Dividend)
NAV per unit (Ex
Dividend)
Dividend (` Per unit) NAV per unit (Cum Dividend)
NAV per unit (Ex
Dividend) Individuals/
HUF Others Individuals/HUF Others
Half Yearly
Dividend
September 26, 2016 0.3611 0.3346 11.4980 10.9980 0.3611 0.3346 11.6564 11.1564March 28, 2016 0.3611 0.3345 11.2292 10.7292 0.3611 0.3345 11.3351 10.8351September 28, 2015 0.2889 0.2676 11.3054 10.9054 0.2889 0.2676 11.3459 10.9459March 25, 2015 0.3629 0.3365 11.3899 10.8899 - - - -
QuarterlyDividend
September 26, 2016 0.1806 0.1673 10.8953 10.6453 0.1806 0.1673 11.3606 11.1106June 27, 2016 0.1805 0.1672 10.6469 10.3969 0.1805 0.1672 11.0754 10.8254March 28, 2016 0.1805 0.1672 10.6613 10.4113 0.1805 0.1672 11.0536 10.8036
Past performance may or may not be sustained in future. Calculations are based on Growth Option NAV. Since inception returns are calculated on ` 10 invested at inception. Since inception returns for Axis Income Fund - Growth Option & Direct Plan - Growth Option are calculated from 28th March 2012 & 7th January 2013 respectively. Direct Plan was introduced on 1st January 2013.Devang Shah manages 46 schemes. Please refer to annexure on Page 19 & 20 for performance of all schemes managed by the fund managers.
Credit Risk Rating[ICRA]AAAmfs$
Please note that after the payment of dividend, the NAV falls to the extent of dividend, distribution tax and cess wherever applicable.Past performance may or may not be sustained in future.Face Value of units is ` 10Half yearly dividend disclosed above are since the inception of the fund. Quarterly dividends disclosed above are for the last 3 Quarters.* For instruments with put/call option, the put/call date has been taken as the maturity date.
11
COMPOSITION BY ASSET (%) COMPOSITION BY RATING (%)
¢ CRISIL AAA/ BWR AAA/ ICRA AAA & Equivalent ¢ SOV ¢ ICRA AA/ CRISIL AA/ CARE AA ¢ CRISIL AA-/ BWR AA-(SO)/ CARE AA- ¢ CRISIL AA+/ ICRA AA+/ IND AA+ ¢ BWR A+(SO)
¢ Corporate Bond ¢ Government Bond ¢ State Government Bond ¢ Zero Coupon Bond ¢ Total Money Market Instruments^
^ Includes Net Current Assets
SCHEME PERFORMANCE (as on 30th September 2016)
Sep 30, 2013 To Sep 30,
2014
Sep 30, 2014 To Sep 30,
2015
Sep 30, 2015 To Sep 30,
2016
Since Inception
Current Value of Investment if
` 10,000 wasinvested on
inception date
Date of inceptionAbsolute
Return (%)Absolute
Return (%)Absolute
Return (%) CAGR (%)
Axis Income Fund - Growth 10.99% 13.21% 9.82% 9.72% 15,19628-Mar-
12Crisil Composite Bond Fund Index (Benchmark) 11.61% 12.56% 11.51% 9.74% 15,210Crisil 10 Year Gilt Index (Additional Benchmark) 6.85% 13.76% 11.11% 8.84% 14,654Axis Income Fund - Direct Plan - Growth 12.16% 14.39% 10.90% 10.47% 14,499
07-Jan-13
Crisil Composite Bond Fund Index (Benchmark) 11.61% 12.56% 11.51% 9.66% 14,106Crisil 10 Year Gilt Index (Additional Benchmark) 6.85% 13.76% 11.11% 7.98% 13,316
High
Inte
rnal
Rat
e Se
nsiti
vity
Credit Quality
Med
Low
High Mid Low
PORTFOLIOCompany Name Rating % of Assets
Company Name Rating % of Assets
Total Debt 96.10Corporate Bond 56.64Power Finance Corporation Limited CRISIL AAA 6.66Reliance Gas Transportation Infrastructure Ltd CRISIL AAA 5.65Rural Electrification Corporation Limited CRISIL AAA 5.42Power Grid Corporation of India Limited CRISIL AAA 4.90Reliance Jio Infocomm Limited CRISIL AAA 4.75Tata Power Company Limited CRISIL AA- 4.55Cholamandalam Investment and Finance Company Limited ICRA AA 3.81IDFC Bank Limited ICRA AAA 3.64Dewan Housing Finance Corporation Limited BWR AAA 2.34Yes Bank Limited ICRA AA+ 2.34India Infoline Finance Ltd ICRA AA 2.33
IndoStar Capital Finance Ltd CARE AA- 1.97Nirchem Cement Limited CRISIL AA 1.88Emami Limited CRISIL AA+ 1.88Adani Transmission Limited IND AA+ 1.87Adani Properties Pvt. Ltd. BWR AA-(SO) 1.41Hindalco Industries Limited CRISIL AA- 1.24Government Bond Sovereign 26.91State Government Bond Sovereign 6.45Zero Coupon Bond 6.10Edelweiss Commodities Services Ltd CARE AA 2.35Sprit Textile Pvt. Ltd. BWR A+(SO) 2.25JM Financial Products Ltd ICRA AA 1.51Net Current Assets 3.90
Net Assets 100%
For Statutory Details & Risk Factors please refer page 24.
37.25%
33.37%
11.88%
9.17%
6.09% 2.25%
56.64%
26.91%
6.45%
6.10% 3.90%

FUND STYLE
TYPE OF SCHEME / INVESTMENT OBJECTIVEAn Open-ended Debt Scheme
To generate stable returns by investing in debt & money market instruments across the yield curve & credit spectrum. However, there is no assurance or guarantee that the investment objective of the Scheme will be achieved. The Scheme does not assure or guarantee any returns.
DATE OF ALLOTMENT15th July 2014
FUND MANAGERDevang ShahWork experience: 11 years
He has been managing this fund since inception.
LATEST NAV (`) as on 30th September 2016
Regular Plan Direct PlanGrowth 12.3506 12.6225Weekly Dividend 10.1484 10.1729Monthly Dividend 10.1565 10.1321
BENCHMARK
Crisil Short Term Bond Fund Index
FUND SIZE (`)Monthly Average AUM 1,101.60 Crore Latest AUM 1,152.46 Crore (as on 30th September 2016)
AVERAGE MATURITY*3.2 years
MODIFIED DURATION*2.4 years
PORTFOLIO YIELD (YIELD TO MATURITY &)7.92%
MINIMUM INVESTMENT AMOUNT (`)5,000/1
MINIMUM ADDITIONAL PURCHASE AMOUNT (`)100/1
MINIMUM SIP INSTALLMENT AMOUNT (`)1000/1
LOAD STRUCTUREEntry load - NA
Exit load - For 30% of investment: Nil For remaining investment: 1.5% if redeemed/switched out within 1 year, 1% if redeemed/switched out after 1 year and upto 2 years, 0.5% if redeemed/switched out after 2 years and upto 3 years from the date of allotment (w.e.f. 14th December 2015)
FACTSHEET30th September 2016
& The yield to maturity given above is based on the portfolio of funds as on date given above. This should not be taken as an indication of the returns that maybe generated by the fund and the securities bought by the fund may or may not be held till their respective maturities. The calculation is based on the invested corpus of the debt portfolio.
* For instruments with put/call option, the put/call date has been taken as the maturity date.
12
AXIS FIXED INCOME
OPPORTUNIT I ES
FUND
PORTFOLIOCompany Name Rating % of Assets
DIVIDENDS
Option Record Date
Direct PlanDividend (` Per unit) NAV per
unit (Cum Dividend)
NAV per unit (Ex
Dividend)
Dividend (` Per unit) NAV per unit (Cum Dividend)
NAV per unit (Ex
Dividend) Individuals/
HUF Others Individuals/HUF Others
Monthly Dividend
Sep 26, 2016 0.0532 0.0493 10.2243 10.1506 0.0623 - 10.2108 10.1246Aug 25, 2016 0.0537 0.0498 10.2045 10.1300 0.0639 - 10.1932 10.1047July 25, 2016 0.0482 0.0447 10.1842 10.1174 0.0558 - 10.1720 10.0946
Company Name Rating % of Assets
Please note that after the payment of dividend, the NAV falls to the extent of dividend, distribution tax and cess wherever applicable.Past performance may or may not be sustained in future. Face Value of units is ` 10Dividends disclosed above are since the inception of the fund.
COMPOSITION BY ASSET (%) COMPOSITION BY RATING (%)
¢ ICRA A1+/ CRISIL A1+/ CARE A1+/ CRISIL AAA/ CARE AAA/ BWR AAA/ ICRA AAA/ IND AAA & Equivalent ¢ SOV ¢ ICRA AA/ CRISIL AA/ CARE AA/ ICRA AA(SO) ¢ IND AA-(SO)/ CARE AA-/ BWR AA-(SO) ¢ CRISIL AA+/ CARE AA+/ IND AA+ ¢ BWR A+(SO)/ ICRA A+(SO)
¢ Corporate Bond ¢ Government Bond ¢ Total Money Market Instruments^
¢ Zero Coupon Bond ¢ State Government Bond ¢ Reduced Face Value Bonds - Non Amortisation^ Includes Net Current Assets
SCHEME PERFORMANCE (as on 30th September 2016)
Sep 30, 2013 To Sep 30,
2014
Sep 30, 2014 To Sep 30,
2015
Sep 30, 2015 To Sep 30,
2016
Since Inception
Current Value of Investment if
` 10,000 wasinvested on
inception date
Date of inceptionAbsolute
Return (%)Absolute
Return (%)Absolute
Return (%) CAGR (%)
Axis Fixed Income Opportunities Fund - Growth - 10.70% 9.08% 10.01% 12,35115-July-
14CRISIL Short-Term Bond Fund Index (Benchmark) - 9.90% 9.31% 9.60% 12,250CRISIL 1 Year T-Bill (Additional Benchmark) - 8.86% 7.36% 8.09% 11,880Axis Fixed Income Opportunities Fund - Direct Plan - Growth
- 11.73% 10.34% 11.09% 12,62315-July-
14CRISIL Short-Term Bond Fund Index (Benchmark) - 9.90% 9.31% 9.60% 12,250CRISIL 1 Year T-Bill (Additional Benchmark) - 8.86% 7.36% 8.09% 11,880
Past performance may or may not be sustained in future. Calculations are based on Growth Option NAV. Since inception returns are calculated on ` 10 invested at inception. Since inception returns for Axis Fixed Income Opportunities Fund - Growth Option & Direct Plan - Growth Option are calculated from 15th July 2014. Devang Shah manages 46 schemes. Please refer to annexure on Page 19 & 20 for performance of all schemes managed by the fund manager.
Total Debt 84.96Corporate Bond 53.08Reliance Jio Infocomm Limited CRISIL AAA 7.38Rural Electrification Corporation Limited CRISIL AAA 6.39Power Finance Corporation Limited CRISIL AAA 4.97Nirchem Cement Limited CRISIL AA 4.01Cholamandalam Investment and Finance Company Limited ICRA AA 3.65Power Grid Corporation of India Limited CRISIL AAA 3.15IndoStar Capital Finance Ltd CARE AA- 2.22Indiabulls Housing Finance Limited CARE AAA 2.18Birla Corporation Limited ICRA AA 2.18Dewan Housing Finance Corporation Limited BWR AAA 2.17Shriram Transport Finance Company Limited CRISIL AA+ 2.02India Infoline Finance Ltd ICRA AA 1.96Indiabulls Housing Finance Limited BWR AAA 1.91Adani Properties Pvt. Ltd. BWR AA-(SO) 1.31Adani Transmission Limited IND AA+ 1.30Tata Motors Limited CARE AA+ 1.10Small Industries Dev Bank of India CARE AAA 0.88ECL Finance Ltd ICRA AA 0.88Emami Limited CRISIL AA+ 0.87Daimler Financial Services India Pvt Ltd IND AAA 0.87Tata Power Company Limited ICRA AA 0.79NABARD CRISIL AAA 0.54Tata Sons Ltd CRISIL AAA 0.26IDFC Bank Limited ICRA AAA 0.09Government Bond Sovereign 17.06Zero Coupon Bond 11.68
SVL Ltd. ICRA AA(SO) 2.28Dewan Housing Finance Corporation Limited CARE AAA 2.19Magma Fincorp Limited CARE AA- 1.45JM Financial Products Ltd ICRA AA 1.40Sprit Textile Pvt. Ltd. BWR A+(SO) 1.25Edelweiss Commodities Services Ltd CARE AA 1.09Dev Infracity Pvt Ltd IND AA-(SO) 0.89Cholamandalam Investment and Finance Company Limited ICRA AA 0.62India Infoline Finance Ltd ICRA AA 0.51State Government Bond Sovereign 2.65Reduced Face Value Bonds - Non Amortisation 0.50Asirvad Microfinance Pvt Ltd ICRA A+(SO) 0.15Future Financial Services Pvt Ltd ICRA A+(SO) 0.15Arohan Financial Services Pvt Ltd ICRA A+(SO) 0.12Sonata Finance Pvt Ltd ICRA A+(SO) 0.08Total Money Market Instruments^ 12.08Others 10.00Adani Ports and Special Economic Zone Limited ICRA A1+ 2.95Piramal Enterprises Limited ICRA A1+ 2.52HDFC Limited ICRA A1+ 2.07IFMR Capital Finance Pvt Ltd ICRA A1+ 2.03Indiabulls Housing Finance Limited CRISIL A1+ 0.43Banks 2.08HDFC Bank Limited CARE A1+ 2.08Net Current Assets 2.95
Net Assets 100%
High
Inte
rnal
Rat
e Se
nsiti
vity
Credit Quality
Med
Low
High Mid Low
^Certificate of Deposit/Commercial Paper
For Statutory Details & Risk Factors please refer page 24.
48.01%
19.71%
19.36%
5.87%
5.29% 1.75%
53.08%17.06%
15.04%
11.68%
2.65% 0.50%

FUND STYLE
TYPE OF SCHEME / INVESTMENT OBJECTIVEAn Open-ended Debt Scheme
To generate stable returns with a low risk strategy while maintaining liquidity through a portfolio comprising of debt and money market instruments. However, there can be no assurance that the investment objective of the scheme will be achieved.
DATE OF ALLOTMENT22nd January 2010
FUND MANAGER
Devang ShahWork experience: 11 years
He has been managing this fund since 5th November 2012.
LATEST NAV (`) as on 30th September 2016
Regular Plan Direct Plan Retail PlanGrowth 17.1337 17.6717 16.9404Regular Dividend 11.4621 10.7650 - Monthly Dividend 10.2485 10.1473 10.1072Bonus 17.2318 - -Weekly Dividend 10.1515 10.2533 10.1581
BENCHMARK
Crisil Short Term Bond Fund Index
FUND SIZE (`)Monthly Average AUM 5,336.40 Crore Latest AUM 4,983.67 Crore (as on 30th September 2016)
AVERAGE MATURITY*3.0 years
MODIFIED DURATION*2.3 years
PORTFOLIO YIELD (YIELD TO MATURITY &)7.50%
MINIMUM INVESTMENT AMOUNT (`)5,000/1
MINIMUM ADDITIONAL PURCHASE AMOUNT (`)1,000/1
MINIMUM SIP INSTALLMENT AMOUNT (`)1000/1
LOAD STRUCTUREEntry load - Not applicable
Exit load - NIL (w.e.f. 28th August 2015)
PORTFOLIO
DIVIDENDS
FACTSHEET30th September 2016
High
Inte
rnal
Rat
e Se
nsiti
vity
Credit Quality
Med
Low
High Mid Low
& The yield to maturity given above is based on the portfolio of funds as on date given above. This should not be taken as an indication of the returns that maybe generated by the fund and the securities bought by the fund may or may not be held till their respective maturities. The calculation is based on the invested corpus.
Company Name Rating % of Assets
Company Name Rating % of Assets
Past performance may or may not be sustained in future. Calculations are based on Growth Option NAV. Since inception returns are calculated on ` 10 invested at inception. Since inception returns for Axis Short Term Fund - Growth Option, Direct Plan & Retail Plan - Growth Option are calculated from 22nd January 2010, 1st January 2013 & 2nd March 2010 respectively. Retail Plan was introduced on 2nd March 2010. and has been discontinued from 1st October 2012. Direct Plan was introduced on 1st January 2013.Devang Shah manages 46 schemes. Please refer to annexure on Page 19 & 20 for performance of all schemes managed by the fund manager.
Credit Risk Rating[ICRA]AAAmfs$
Option Record Date
Retail Plan Direct PlanDividend (` Per unit) NAV per
unit (Cum Dividend
NAV per unit (Ex
Dividend)
Dividend (` Per unit) NAV per unit (Cum Dividend)
NAV per unit (Ex
Dividend)
Dividend (` Per unit) NAV per unit (Cum Dividend)
NAV per unit (Ex
Dividend)Individuals/
HUF Others Individuals/ HUF Others Individuals/
HUF Others
MonthlyDividend
Sep 26, 2016 0.0530 0.0491 10.3143 10.2410 0.0520 0.0482 10.1719 10.0999 0.0645 0.0597 10.2284 10.1392Aug 25, 2016 0.0540 0.0500 10.2995 10.2247 0.0590 0.0547 10.1652 10.0834 0.0634 0.0587 10.2211 10.1333Jul 25, 2016 0.0527 0.0488 10.2824 10.2094 0.0525 0.0486 10.1491 10.0764 0.0571 0.0529 10.2049 10.1259
^Certificate of Deposit/Commercial Paper/Treasury Bill
Please note that after the payment of dividend, the NAV falls to the extent of dividend, distribution tax and cess wherever applicable.Past performance may or may not be sustained in future.Face Value of units is ` 10Dividends disclosed above are for the past 3 months. * For instruments with put/call option, the put/call date has been taken as the maturity date.
13
COMPOSITION BY ASSET (%) COMPOSITION BY RATING (%)
¢ Corporate Bond ¢ Government Bond ¢ Total Money Market Instruments^ ¢ State Government Bond ¢ Zero Coupon Bond ^ Includes Net Current Assets
SCHEME PERFORMANCE (as on 30th September 2016)
Sep 30, 2013 To Sep 30,
2014
Sep 30, 2014 To Sep 30,
2015
Sep 30, 2015 To Sep 30,
2016
Since Inception
Current Value of Investment if
` 10,000 wasinvested on
inception date
Date of inceptionAbsolute
Return (%)Absolute
Return (%)Absolute
Return (%) CAGR (%)
Axis Short Term Fund - Growth 9.60% 9.65% 8.88% 8.38% 17,13422-Jan-
10Crisil Short Term Bond Fund Index (Benchmark) 10.12% 9.90% 9.31% 8.39% 17,150Crisil 1 Year T-Bill Index (Additional Benchmark) 8.35% 8.86% 7.36% 6.78% 15,508Axis Short Term Fund - Direct Plan - Growth 10.58% 10.57% 9.71% 9.62% 14,111
01-Jan-13
Crisil Short Term Bond Fund Index (Benchmark) 10.12% 9.90% 9.31% 9.33% 13,968Crisil 1 Year T-Bill Index (Additional Benchmark) 8.35% 8.86% 7.36% 7.53% 13,128Axis Short Term Fund - Retail Plan - Growth 9.62% 9.67% 8.88% 8.33% 16,940
02-Mar-10
Crisil Short Term Bond Fund Index (Benchmark) 10.12% 9.90% 9.31% 8.50% 17,115Crisil 1 Year T-Bill Index (Additional Benchmark) 8.35% 8.86% 7.36% 6.85% 15,471
¢ ICRA A1+/ CRISIL A1+/ CARE A1+/ CRISIL AAA/ CARE AAA/ ICRA AAA/IND AAA/ BWR AAA & Equivalent ¢ SOV ¢ CRISIL AA+/ CARE AA+/ ICRA AA+/ BWR AA+
Total Debt 86.35Corporate Bond 63.80Reliance Jio Infocomm Limited CRISIL AAA 9.85LIC Housing Finance Limited CRISIL AAA 6.20HDFC Limited CRISIL AAA 6.01NABARD CRISIL AAA 5.65Power Finance Corporation Limited CRISIL AAA 4.04Power Grid Corporation of India Limited CRISIL AAA 3.82Indiabulls Housing Finance Limited BWR AAA 3.04Tata Capital Financial Services Ltd CRISIL AA+ 2.93Small Industries Dev Bank of India CARE AAA 2.52Rural Electrification Corporation Limited CRISIL AAA 2.37Dewan Housing Finance Corporation Limited BWR AAA 2.17Tata Sons Ltd CRISIL AAA 1.94Mahindra & Mahindra Financial Services Limited IND AAA 1.82HDB Financial Services Ltd CRISIL AAA 1.52Gruh Finance Limited ICRA AAA 1.52UPL Limited BWR AA+ 1.15Indiabulls Housing Finance Limited CARE AAA 1.14National Housing Bank CRISIL AAA 1.11IDFC Bank Limited ICRA AAA 0.82L&T Infrastructure Finance Co Ltd CARE AA+ 0.81Dewan Housing Finance Corporation Limited CARE AAA 0.60Tata Motors Limited CARE AA+ 0.53Export Import Bank of India CRISIL AAA 0.53Tata Capital Financial Services Ltd ICRA AA+ 0.51Rural Electrification Corporation Limited CARE AAA 0.42UltraTech Cement Limited CRISIL AAA 0.37Bajaj Finance Limited CARE AAA 0.22LIC Housing Finance Limited CARE AAA 0.10Indian Railway Finance Corp Ltd CRISIL AAA 0.08
Mahindra Vehicle Mfg Ltd ICRA AAA 0.02Government Bond Sovereign 14.04State Government Bond Sovereign 5.92Zero Coupon Bond 2.58Dewan Housing Finance Corporation Limited CARE AAA 1.99Indiabulls Housing Finance Limited CARE AAA 0.26Mahindra & Mahindra Financial Services Limited IND AAA 0.22HDFC Limited ICRA AAA 0.08Axis Finance Limited IND AAA 0.02HDB Financial Services Ltd CRISIL AAA 0.004Total Money Market Instruments^ 12.69Banks 10.92ICICI Bank Limited ICRA A1+ 3.81Andhra Bank CARE A1+ 3.21IDBI Bank Limited CRISIL A1+ 2.10Kotak Mahindra Bank Limited CRISIL A1+ 0.54Corporation Bank CRISIL A1+ 0.47Dena Bank CRISIL A1+ 0.29Vijaya Bank CARE A1+ 0.23IDFC Bank Limited ICRA A1+ 0.10HDFC Bank Limited CARE A1+ 0.10Punjab & Sind Bank ICRA A1+ 0.06Others 1.61L&T Fincorp Limited CARE A1+ 1.61Treasury Bill 0.1691 Days Tbill Sovereign 0.11182 Days Tbill Sovereign 0.05Net Current Assets 0.97
Net Assets 100%
For Statutory Details & Risk Factors please refer page 24.
73.95%
20.13%
5.93%
63.80%
14.04%
13.65%
5.92% 2.58%
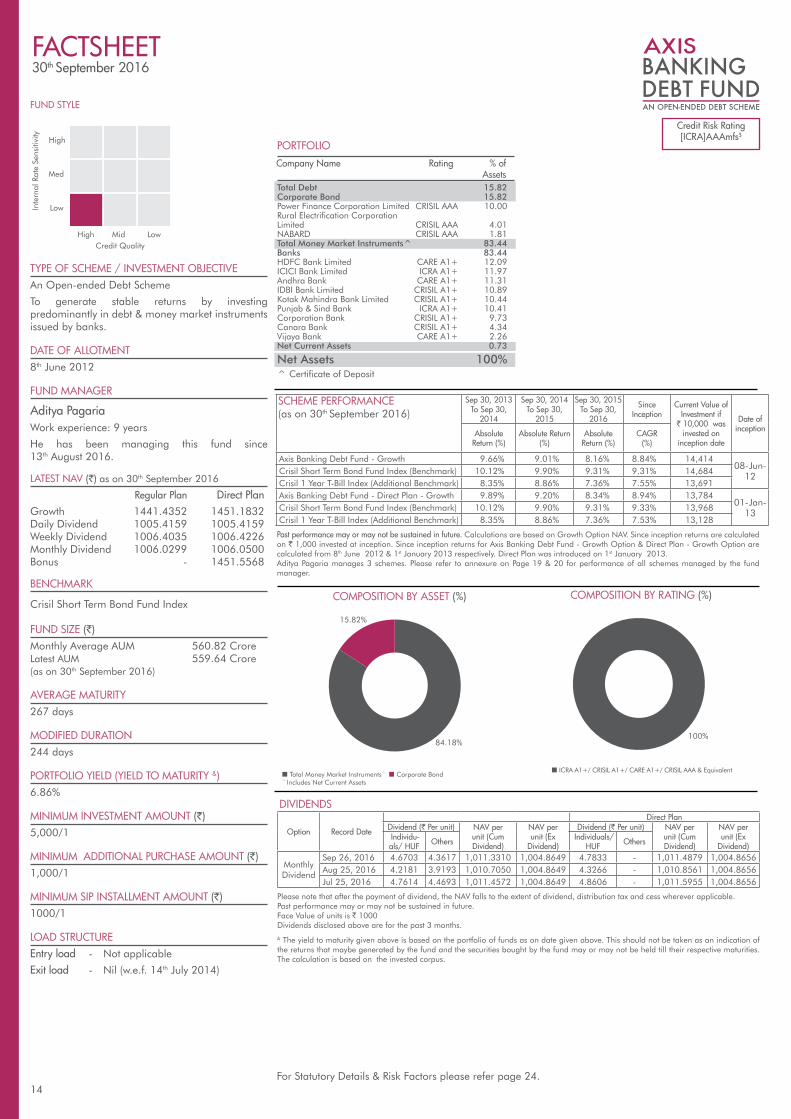
FUND STYLE
TYPE OF SCHEME / INVESTMENT OBJECTIVEAn Open-ended Debt Scheme
To generate stable returns by investing predominantly in debt & money market instruments issued by banks.
DATE OF ALLOTMENT8th June 2012
FUND MANAGER
Aditya PagariaWork experience: 9 years
He has been managing this fund since 13th August 2016.
LATEST NAV (`) as on 30th September 2016
Regular Plan Direct PlanGrowth 1441.4352 1451.1832Daily Dividend 1005.4159 1005.4159Weekly Dividend 1006.4035 1006.4226Monthly Dividend 1006.0299 1006.0500Bonus - 1451.5568
BENCHMARK
Crisil Short Term Bond Fund Index
FUND SIZE (`)Monthly Average AUM 560.82 Crore Latest AUM 559.64 Crore (as on 30th September 2016)
AVERAGE MATURITY267 days
MODIFIED DURATION244 days
PORTFOLIO YIELD (YIELD TO MATURITY &)6.86%
MINIMUM INVESTMENT AMOUNT (`)5,000/1
MINIMUM ADDITIONAL PURCHASE AMOUNT (`)1,000/1
MINIMUM SIP INSTALLMENT AMOUNT (`)1000/1
LOAD STRUCTUREEntry load - Not applicable
Exit load - Nil (w.e.f. 14th July 2014)
PORTFOLIO
FACTSHEET30th September 2016
High
Inte
rnal
Rat
e Se
nsiti
vity
Credit Quality
Med
Low
High Mid Low
Company Name Rating % of Assets
DIVIDENDS
Please note that after the payment of dividend, the NAV falls to the extent of dividend, distribution tax and cess wherever applicable.Past performance may or may not be sustained in future.Face Value of units is ` 1000Dividends disclosed above are for the past 3 months.
Option Record Date
Direct PlanDividend (` Per unit) NAV per
unit (Cum Dividend)
NAV per unit (Ex
Dividend)
Dividend (` Per unit) NAV per unit (Cum Dividend)
NAV per unit (Ex
Dividend) Individu-als/ HUF Others Individuals/
HUF Others
MonthlyDividend
Sep 26, 2016 4.6703 4.3617 1,011.3310 1,004.8649 4.7833 - 1,011.4879 1,004.8656Aug 25, 2016 4.2181 3.9193 1,010.7050 1,004.8649 4.3266 - 1,010.8561 1,004.8656Jul 25, 2016 4.7614 4.4693 1,011.4572 1,004.8649 4.8606 - 1,011.5955 1,004.8656
Past performance may or may not be sustained in future. Calculations are based on Growth Option NAV. Since inception returns are calculated on ` 1,000 invested at inception. Since inception returns for Axis Banking Debt Fund - Growth Option & Direct Plan - Growth Option are calculated from 8th June 2012 & 1st January 2013 respectively. Direct Plan was introduced on 1st January 2013.Aditya Pagaria manages 3 schemes. Please refer to annexure on Page 19 & 20 for performance of all schemes managed by the fund manager.
Credit Risk Rating[ICRA]AAAmfs$
^ Certificate of Deposit
& The yield to maturity given above is based on the portfolio of funds as on date given above. This should not be taken as an indication of the returns that maybe generated by the fund and the securities bought by the fund may or may not be held till their respective maturities. The calculation is based on the invested corpus.
14
COMPOSITION BY ASSET (%) COMPOSITION BY RATING (%)
¢ ICRA A1+/ CRISIL A1+/ CARE A1+/ CRISIL AAA & Equivalent ¢ Total Money Market Instruments^ ¢ Corporate Bond ^ Includes Net Current Assets
SCHEME PERFORMANCE (as on 30th September 2016)
Sep 30, 2013 To Sep 30,
2014
Sep 30, 2014 To Sep 30,
2015
Sep 30, 2015 To Sep 30,
2016
Since Inception
Current Value of Investment if
` 10,000 wasinvested on
inception date
Date of inceptionAbsolute
Return (%)Absolute Return
(%)Absolute
Return (%)CAGR
(%)
Axis Banking Debt Fund - Growth 9.66% 9.01% 8.16% 8.84% 14,41408-Jun-
12Crisil Short Term Bond Fund Index (Benchmark) 10.12% 9.90% 9.31% 9.31% 14,684Crisil 1 Year T-Bill Index (Additional Benchmark) 8.35% 8.86% 7.36% 7.55% 13,691Axis Banking Debt Fund - Direct Plan - Growth 9.89% 9.20% 8.34% 8.94% 13,784
01-Jan-13Crisil Short Term Bond Fund Index (Benchmark) 10.12% 9.90% 9.31% 9.33% 13,968
Crisil 1 Year T-Bill Index (Additional Benchmark) 8.35% 8.86% 7.36% 7.53% 13,128
Total Debt 15.82Corporate Bond 15.82Power Finance Corporation Limited CRISIL AAA 10.00Rural Electrification Corporation Limited CRISIL AAA 4.01NABARD CRISIL AAA 1.81Total Money Market Instruments^ 83.44Banks 83.44HDFC Bank Limited CARE A1+ 12.09ICICI Bank Limited ICRA A1+ 11.97Andhra Bank CARE A1+ 11.31IDBI Bank Limited CRISIL A1+ 10.89Kotak Mahindra Bank Limited CRISIL A1+ 10.44Punjab & Sind Bank ICRA A1+ 10.41Corporation Bank CRISIL A1+ 9.73Canara Bank CRISIL A1+ 4.34Vijaya Bank CARE A1+ 2.26Net Current Assets 0.73
Net Assets 100%
For Statutory Details & Risk Factors please refer page 24.
100%84.18%
15.82%
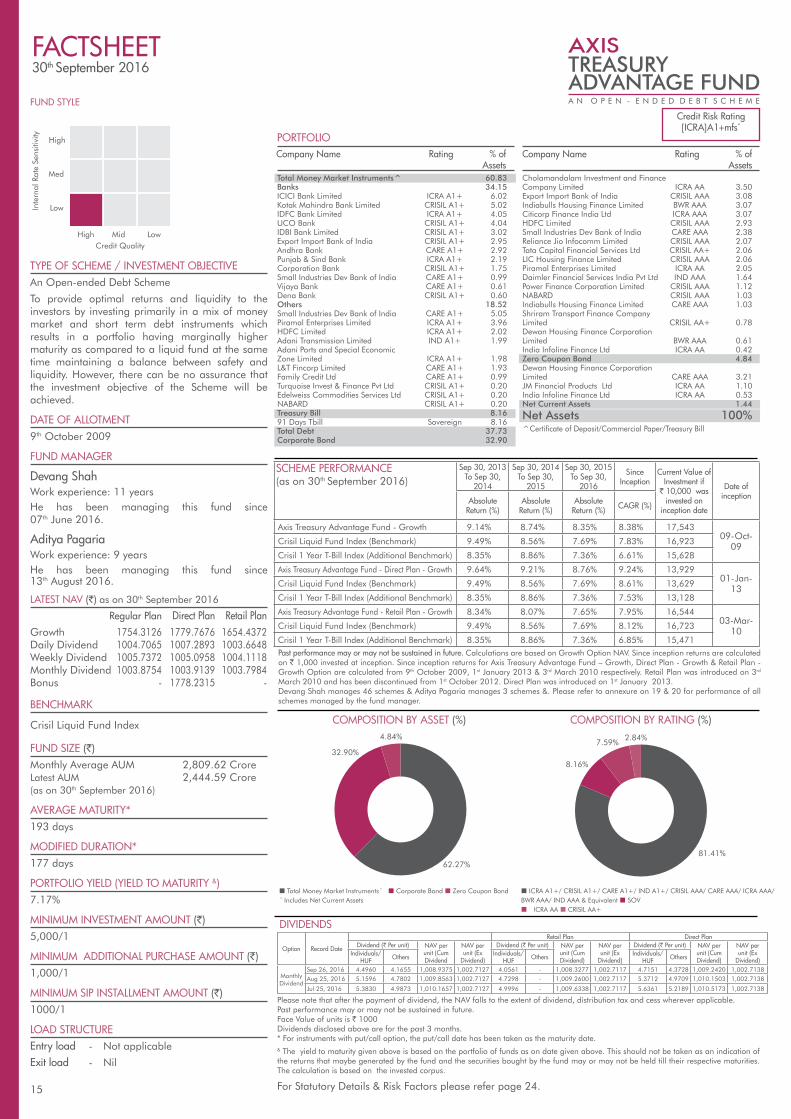
FUND STYLE
TYPE OF SCHEME / INVESTMENT OBJECTIVEAn Open-ended Debt Scheme
To provide optimal returns and liquidity to the investors by investing primarily in a mix of money market and short term debt instruments which results in a portfolio having marginally higher maturity as compared to a liquid fund at the same time maintaining a balance between safety and liquidity. However, there can be no assurance that the investment objective of the Scheme will be achieved.
DATE OF ALLOTMENT9th October 2009
FUND MANAGER
Devang ShahWork experience: 11 yearsHe has been managing this fund since 07th June 2016.
Aditya PagariaWork experience: 9 yearsHe has been managing this fund since 13th August 2016.
LATEST NAV (`) as on 30th September 2016
Regular Plan Direct Plan Retail PlanGrowth 1754.3126 1779.7676 1654.4372Daily Dividend 1004.7065 1007.2893 1003.6648Weekly Dividend 1005.7372 1005.0958 1004.1118Monthly Dividend 1003.8754 1003.9139 1003.7984Bonus - 1778.2315 -
BENCHMARK
Crisil Liquid Fund Index
FUND SIZE (`)Monthly Average AUM 2,809.62 Crore Latest AUM 2,444.59 Crore (as on 30th September 2016)
AVERAGE MATURITY*193 days
MODIFIED DURATION*177 days
PORTFOLIO YIELD (YIELD TO MATURITY &)7.17%
MINIMUM INVESTMENT AMOUNT (`)5,000/1
MINIMUM ADDITIONAL PURCHASE AMOUNT (`)1,000/1
MINIMUM SIP INSTALLMENT AMOUNT (`)1000/1
LOAD STRUCTUREEntry load - Not applicable
Exit load - Nil
PORTFOLIO
FACTSHEET30th September 2016
High
Inte
rnal
Rat
e Se
nsiti
vity
Credit Quality
Med
Low
High Mid Low
Please note that after the payment of dividend, the NAV falls to the extent of dividend, distribution tax and cess wherever applicable.Past performance may or may not be sustained in future. Face Value of units is ` 1000Dividends disclosed above are for the past 3 months. * For instruments with put/call option, the put/call date has been taken as the maturity date.
For Statutory Details & Risk Factors please refer page 24.
Company Name Rating % of Assets
Company Name Rating % of Assets
Credit Risk Rating[ICRA]A1+mfs^
DIVIDENDS
Past performance may or may not be sustained in future. Calculations are based on Growth Option NAV. Since inception returns are calculated on ` 1,000 invested at inception. Since inception returns for Axis Treasury Advantage Fund – Growth, Direct Plan - Growth & Retail Plan - Growth Option are calculated from 9th October 2009, 1st January 2013 & 3rd March 2010 respectively. Retail Plan was introduced on 3rd March 2010 and has been discontinued from 1st October 2012. Direct Plan was introduced on 1st January 2013.Devang Shah manages 46 schemes & Aditya Pagaria manages 3 schemes &. Please refer to annexure on 19 & 20 for performance of all schemes managed by the fund manager.
Option Record Date
Retail Plan Direct PlanDividend (` Per unit) NAV per
unit (Cum Dividend
NAV per unit (Ex
Dividend)
Dividend (` Per unit) NAV per unit (Cum Dividend)
NAV per unit (Ex
Dividend)
Dividend (` Per unit) NAV per unit (Cum Dividend)
NAV per unit (Ex
Dividend)Individuals/
HUF Others Individuals/ HUF Others Individuals/
HUF Others
MonthlyDividend
Sep 26, 2016 4.4960 4.1655 1,008.9375 1,002.7127 4.0561 - 1,008.3277 1,002.7117 4.7151 4.3728 1,009.2420 1,002.7138Aug 25, 2016 5.1596 4.7802 1,009.8563 1,002.7127 4.7298 - 1,009.2600 1,002.7117 5.3712 4.9709 1,010.1503 1,002.7138
Jul 25, 2016 5.3830 4.9873 1,010.1657 1,002.7127 4.9996 - 1,009.6338 1,002.7117 5.6361 5.2189 1,010.5173 1,002.7138
& The yield to maturity given above is based on the portfolio of funds as on date given above. This should not be taken as an indication of the returns that maybe generated by the fund and the securities bought by the fund may or may not be held till their respective maturities. The calculation is based on the invested corpus.
15
COMPOSITION BY ASSET (%) COMPOSITION BY RATING (%)
¢ Total Money Market Instruments^ ¢ Corporate Bond ¢ Zero Coupon Bond ^ Includes Net Current Assets
SCHEME PERFORMANCE (as on 30th September 2016)
Sep 30, 2013 To Sep 30,
2014
Sep 30, 2014 To Sep 30,
2015
Sep 30, 2015 To Sep 30,
2016
Since Inception
Current Value of Investment if
` 10,000 wasinvested on
inception date
Date of inceptionAbsolute
Return (%)Absolute
Return (%)Absolute
Return (%) CAGR (%)
Axis Treasury Advantage Fund - Growth 9.14% 8.74% 8.35% 8.38% 17,54309-Oct-
09Crisil Liquid Fund Index (Benchmark) 9.49% 8.56% 7.69% 7.83% 16,923
Crisil 1 Year T-Bill Index (Additional Benchmark) 8.35% 8.86% 7.36% 6.61% 15,628
Axis Treasury Advantage Fund - Direct Plan - Growth 9.64% 9.21% 8.76% 9.24% 13,92901-Jan-
13Crisil Liquid Fund Index (Benchmark) 9.49% 8.56% 7.69% 8.61% 13,629
Crisil 1 Year T-Bill Index (Additional Benchmark) 8.35% 8.86% 7.36% 7.53% 13,128
Axis Treasury Advantage Fund - Retail Plan - Growth 8.34% 8.07% 7.65% 7.95% 16,54403-Mar-
10Crisil Liquid Fund Index (Benchmark) 9.49% 8.56% 7.69% 8.12% 16,723
Crisil 1 Year T-Bill Index (Additional Benchmark) 8.35% 8.86% 7.36% 6.85% 15,471
¢ ICRA A1+/ CRISIL A1+/ CARE A1+/ IND A1+/ CRISIL AAA/ CARE AAA/ ICRA AAA/BWR AAA/ IND AAA & Equivalent ¢ SOV¢ ICRA AA ¢ CRISIL AA+
Total Money Market Instruments^ 60.83Banks 34.15ICICI Bank Limited ICRA A1+ 6.02Kotak Mahindra Bank Limited CRISIL A1+ 5.02IDFC Bank Limited ICRA A1+ 4.05UCO Bank CRISIL A1+ 4.04IDBI Bank Limited CRISIL A1+ 3.02Export Import Bank of India CRISIL A1+ 2.95Andhra Bank CARE A1+ 2.92Punjab & Sind Bank ICRA A1+ 2.19Corporation Bank CRISIL A1+ 1.75Small Industries Dev Bank of India CARE A1+ 0.99Vijaya Bank CARE A1+ 0.61Dena Bank CRISIL A1+ 0.60Others 18.52Small Industries Dev Bank of India CARE A1+ 5.05Piramal Enterprises Limited ICRA A1+ 3.96HDFC Limited ICRA A1+ 2.02Adani Transmission Limited IND A1+ 1.99Adani Ports and Special Economic Zone Limited ICRA A1+ 1.98L&T Fincorp Limited CARE A1+ 1.93Family Credit Ltd CARE A1+ 0.99Turquoise Invest & Finance Pvt Ltd CRISIL A1+ 0.20Edelweiss Commodities Services Ltd CRISIL A1+ 0.20NABARD CRISIL A1+ 0.20Treasury Bill 8.1691 Days Tbill Sovereign 8.16Total Debt 37.73Corporate Bond 32.90
Cholamandalam Investment and Finance Company Limited ICRA AA 3.50Export Import Bank of India CRISIL AAA 3.08Indiabulls Housing Finance Limited BWR AAA 3.07Citicorp Finance India Ltd ICRA AAA 3.07HDFC Limited CRISIL AAA 2.93Small Industries Dev Bank of India CARE AAA 2.38Reliance Jio Infocomm Limited CRISIL AAA 2.07Tata Capital Financial Services Ltd CRISIL AA+ 2.06LIC Housing Finance Limited CRISIL AAA 2.06Piramal Enterprises Limited ICRA AA 2.05Daimler Financial Services India Pvt Ltd IND AAA 1.64Power Finance Corporation Limited CRISIL AAA 1.12NABARD CRISIL AAA 1.03Indiabulls Housing Finance Limited CARE AAA 1.03Shriram Transport Finance Company Limited CRISIL AA+ 0.78Dewan Housing Finance Corporation Limited BWR AAA 0.61India Infoline Finance Ltd ICRA AA 0.42Zero Coupon Bond 4.84Dewan Housing Finance Corporation Limited CARE AAA 3.21JM Financial Products Ltd ICRA AA 1.10India Infoline Finance Ltd ICRA AA 0.53Net Current Assets 1.44
Net Assets 100%^Certificate of Deposit/Commercial Paper/Treasury Bill
81.41%
8.16%
7.59%2.84%
62.27%
32.90%
4.84%

FUND STYLE
TYPE OF SCHEME / INVESTMENT OBJECTIVEAn Open-ended Liquid Scheme
To provide a high level of liquidity with reasonable returns commensurating with low risk through a portfolio of money market and debt securities. However, there can be no assurance that the investment objective of the Scheme will be achieved.
DATE OF ALLOTMENT9th October 2009
FUND MANAGER
Devang ShahWork experience: 11 years
He has been managing this fund since 5th November 2012.
Aditya PagariaWork experience: 9 years
He has been managing this fund since 13th August 2016.
LATEST NAV (`) as on 30th September 2016
Regular Plan Direct Plan Retail PlanGrowth 1739.4290 1743.7434 1665.3119Daily Dividend 1000.8759 1000.6413 1000.6413Weekly Dividend 1002.8895 1002.8985 1001.2637Monthly Dividend 1001.3866 1001.0245 1000.9599Bonus - 1743.6485 -
BENCHMARK
Crisil Liquid Fund Index
FUND SIZE (`)Monthly Average AUM 11,478.75 Crore Latest AUM 9,104.71 Crore (as on 30th September 2016)
AVERAGE MATURITY66 days
MODIFIED DURATION61 days
PORTFOLIO YIELD (YIELD TO MATURITY &)6.70%
MINIMUM INVESTMENT AMOUNT (`)5,000/1
MINIMUM ADDITIONAL PURCHASE AMOUNT (`)1,000/1
LOAD STRUCTUREEntry load - Not applicable
Exit load - Nil
PORTFOLIO
FACTSHEET30th September 2016
High
Inte
rnal
Rat
e Se
nsiti
vity
Credit Quality
Med
Low
High Mid Low
Please note that after the payment of dividend, the NAV falls to the extent of dividend, distribution tax and cess wherever applicable.Past performance may or may not be sustained in future. Face Value of units is ` 1000Dividends disclosed above are for the past 3 months.& The yield to maturity given above is based on the portfolio of funds as on date given above. This should not be taken as an indication of the returns that maybe generated by the fund and the securities bought by the fund may or may not be held till their respective maturities. The calculation is based on the invested corpus.
Company Name Rating % of Assets
Company Name Rating % of Assets
Credit Risk Rating[ICRA]A1+mfs^ CARE AAA mfs^
DIVIDENDS
Past performance may or may not be sustained in future. Calculations are based on Growth Option NAV. Since inception returns are calculated on ` 1,000 invested at inception.Since inception returns for Axis Liquid Fund Plan - Growth Option, Retail Plan - Growth Option & Direct Plan - Growth Option are calculated from 9th October 2009, 1st March 2010 & 31st December 2012 respectively. Retail Plan was introduced on 1st March 2010 and has been discontinued from 1st October 2012. Direct Plan was introduced on 31st December 2012.Devang Shah manages 46 schemes & Aditya Pagaria 3 schemes. Please refer to annexure on Page 19 & 20 for performance of all schemes managed by the fund manager.
Option Record Date
Retail Plan Direct PlanDividend (` Per unit) NAV per
unit (Cum Dividend
NAV per unit (Ex
Dividend)
Dividend (` Per unit) NAV per unit (Cum Dividend)
NAV per unit (Ex
Dividend)
Dividend (` Per unit) NAV per unit (Cum Dividend)
NAV per unit (Ex
Dividend)Individuals/
HUF Others Individuals/ HUF Others Individuals/
HUF Others
MonthlyDividend
Sep 26, 2016 4.3092 3.9924 1,006.5558 1,000.5896 3.9829 - 1,005.7343 1,000.2195 4.3592 - 1,006.2546 1,000.2192Aug 25, 2016 4.2886 3.9733 1,006.5274 1,000.5896 3.9654 - 1,005.7097 1,000.2195 4.3340 - 1,006.2198 1,000.2192Jul 25, 2016 4.1307 3.8270 1,006.3088 1,000.5896 3.8380 - 1,005.5331 1,000.2195 4.1795 - 1,006.0058 1,000.2192
16
COMPOSITION BY ASSET (%)
¢ Total Money Market Instruments^ ¢ Corporate Bond ^ Includes Net Current Assets
SCHEME PERFORMANCE (as on 30th September 2016) 7 Days 15 Days 30 Days
Sep 30, 2013 To Sep 30, 2014
Sep 30, 2014 To Sep 30, 2015
Sep 30, 2015 To Sep 30, 2016
SinceInception
Current Value of Investment if ` 10,000 was invested on inception
date
Date of incep-tion
Annualised Return (%) Absolute Return (%)
Absolute Return (%)
Absolute Return (%)
CAGR (%)
Axis Liquid Fund - Growth 7.35% 7.16% 7.07% 9.34% 8.64% 7.87% 8.25% 17,394 09-Oct-09
Crisil Liquid Fund Index (Benchmark) 8.05% 7.40% 7.23% 9.49% 8.56% 7.69% 7.83% 16,923Crisil 1 Year T-Bill Index (Additional Benchmark) 13.19% 9.90% 8.18% 8.35% 8.86% 7.36% 6.61% 15,628Axis Liquid Fund - Direct Plan - Growth 7.44% 7.25% 7.16% 9.41% 8.70% 7.95% 8.75% 13,698 31-
Dec-12
Crisil Liquid Fund Index (Benchmark) 8.05% 7.40% 7.23% 9.49% 8.56% 7.69% 8.61% 13,631Crisil 1 Year T-Bill Index (Additional Benchmark) 13.19% 9.90% 8.18% 8.35% 8.86% 7.36% 7.54% 13,134Axis Liquid Fund - Retail Plan - Growth 6.80% 6.62% 6.53% 8.79% 8.08% 7.31% 8.05% 16,653 01-
Mar-10
Crisil Liquid Fund Index (Benchmark) 8.05% 7.40% 7.23% 9.49% 8.56% 7.69% 8.13% 16,733Crisil 1 Year T-Bill Index (Additional Benchmark) 13.19% 9.90% 8.18% 8.35% 8.86% 7.36% 6.85% 15,473
Total Money Market Instruments^ 106.51Banks 28.36IDFC Bank Limited ICRA A1+ 7.08Punjab & Sind Bank ICRA A1+ 5.11Oriental Bank of Commerce CRISIL A1+ 4.79Vijaya Bank CARE A1+ 3.27RBL Bank Limited ICRA A1+ 3.11Kotak Mahindra Bank Limited CRISIL A1+ 2.17Andhra Bank CARE A1+ 1.09Corporation Bank CRISIL A1+ 1.09Yes Bank Limited ICRA A1+ 0.54Dena Bank CRISIL A1+ 0.05Allahabad Bank ICRA A1+ 0.05Others 59.55Small Industries Dev Bank of India CARE A1+ 7.19Reliance Jio Infocomm Limited CARE A1+ 4.83Network18 Media & Investments Ltd ICRA A1+ 4.35Indiabulls Housing Finance Limited CRISIL A1+ 3.76Chennai Petroleum Corporation Limited ICRA A1+ 3.55Edelweiss Commodities Services Ltd CRISIL A1+ 3.27Dewan Housing Finance Corporation Limited CRISIL A1+ 3.22IIFL Wealth Finance Limited ICRA A1+ 3.21Cholamandalam Investment and Finance Company Limited ICRA A1+ 2.73Piramal Finance Priviate limited ICRA A1+ 2.18Nirma Ltd CRISIL A1+ 2.18NABARD CRISIL A1+ 2.17Sundaram Finance Limited ICRA A1+ 1.63Power Finance Corporation Limited CRISIL A1+ 1.63IndoStar Capital Finance Ltd CRISIL A1+ 1.63
JM Financial Products Ltd ICRA A1+ 1.36HDFC Limited ICRA A1+ 1.36Rural Electrification Corporation Limited CARE A1+ 1.09Larsen & Toubro Limited CRISIL A1+ 1.09Redington (India) Limited ICRA A1+ 1.03Adani Gas Ltd. CARE A1+ 0.82Adani Transmission Limited IND A1+ 0.81Piramal Enterprises Limited ICRA A1+ 0.81Ujjivan Financial Services Limited CRISIL A1+ 0.81JM Financial Limited ICRA A1+ 0.56Adani Ports and Special Economic Zone Limited ICRA A1+ 0.55Kotak Mahindra Investments Ltd CRISIL A1+ 0.54IFMR Capital Finance Pvt Ltd ICRA A1+ 0.54ECL Finance Ltd CRISIL A1+ 0.38Turquoise Invest & Finance Pvt Ltd CRISIL A1+ 0.27Treasury Bill 18.6091 Days Tbill Sovereign 8.46182 Days Tbill Sovereign 7.20364 Days Tbill Sovereign 2.94Total Debt 3.03Corporate Bond 3.03HDFC Limited CRISIL AAA 1.37Dewan Housing Finance Corporation Limited CARE AAA 1.10Indiabulls Housing Finance Limited CARE AAA 0.28Tata Sons Ltd CRISIL AAA 0.28Net Current Assets -9.53
Net Assets 100%
COMPOSITION BY RATING (%)
¢ ICRA A1+/ CRISIL A1+/ CARE A1+/ IND A1+/ CRISIL AAA/ CARE AAA & Equivalent ¢ SOV
^Certificate of Deposit/Commercial Paper/BRDS/Treasury Bill
For Statutory Details & Risk Factors please refer page 24.
81.40%
18.60%
96.97%
3.03%

TYPE OF SCHEME / INVESTMENT OBJECTIVEAn Open-ended arbitrage fund
To generate income through low volatility absolute return strategies that take advantage of opportunities in the cash and the derivative segments of the equity markets including the arbitrage opportunities available within the derivative segment, by using other derivative based strategies and by investing the balance in debt and money market instruments. However, there is no assurance or guarantee that the investment objective of the Scheme will be achieved. The Scheme does not assure or guarantee any returns.
DATE OF ALLOTMENT14th August 2014
FUND MANAGER
Ashwin Patni Work experience: 13 years He has been managing the fund since 27th April 2015
Devang ShahWork experience: 11 years
He has been managing this fund since inception.
LATEST NAV (`) as on 30th September 2016
Regular Plan Direct PlanGrowth 11.5502 11.7621Dividend 10.4438 10.7406
BENCHMARK
Crisil Liquid Fund Index
FUND SIZE (`)Monthly Average AUM 347.05 Crore Latest AUM 331.99 Crore (as on 30th September 2016)
MINIMUM INVESTMENT AMOUNT (`)5,000/1
MINIMUM ADDITIONAL PURCHASE AMOUNT (`)100/1
MINIMUM SIP INSTALLMENT AMOUNT (`)1000/1
LOAD STRUCTUREEntry load - NA
Exit load - 0.25% if redeemed / switched out within 7 days from the date of allotment. (w.e.f. 15th May 2015)
FACTSHEET30th September 2016
17
AXIS ENHANCED
ARBITRAGE FUND
PORTFOLIOCompany Name % of Assets
Company Name % of Assets
Please note that after the payment of dividend, the NAV falls to the extent of dividend, distribution tax and cess wherever applicable.Past performance may or may not be sustained in future. Face Value of units is ` 10Dividends disclosed above are since the inception of the fund.
Option Record Date /Ex NAV Date
Direct PlanDividend (` Per unit) NAV per
unit (Cum Dividend)
NAV per unit (Ex
Dividend)
Dividend (` Per unit) NAV per unit (Cum Dividend)
NAV per unit (Ex
Dividend) Individu-als/ HUF Others Individu-
als/HUF Others
Dividend
Sep 26, 2016 0.05 0.05 10.4776 10.4276 0.15 0.15 10.8731 10.7231
Aug 25, 2016 0.05 0.05 10.4759 10.4277 - - - -
Jul 25, 2016 0.05 0.05 10.4749 10.4249 - - - -
DIVIDENDS
SCHEME PERFORMANCE (as on 30th September 2016)
Sep 30, 2013 To Sep 30,
2014
Sep 30, 2014 To Sep 30,
2015
Sep 30, 2015 To Sep 30,
2016
Since Inception
Current Value of Investment if
` 10,000 wasinvested on
inception date
Date of inceptionAbsolute
Return (%)Absolute
Return (%)Absolute
Return (%) CAGR (%)
Axis Enhanced Arbitrage Fund - Growth - 7.78% 6.11% 7.00% 11,55014-Aug-
14CRISIL Liquid Fund Index (Benchmark) - 8.56% 7.69% 8.18% 11,824CRISIL 1 Year T-Bill (Additional Benchmark) - 8.86% 7.36% 8.11% 11,807Axis Enhanced Arbitrage - Direct Plan - Growth - 8.70% 7.01% 7.91% 11,762
14-Aug-14
CRISIL Liquid Fund Index (Benchmark) - 8.56% 7.69% 8.18% 11,824CRISIL 1 Year T-Bill (Additional Benchmark) - 8.86% 7.36% 8.11% 11,807
Past performance may or may not be sustained in future. Calculations are based on Growth Option NAV. Since inception returns are calculated on ` 10 invested at inception. Since inception returns for Axis Enhanced Arbitrage Fund - Growth Option & Direct Plan - Growth Option are calculated from 14th August 2014. Devang Shah manages 46 schemes & Ashwin Patni manages 21 schemes. Please refer to annexure on Page 19 - 21 for performance of all schemes managed by the fund managers.
Total Hedged Equity 66.31HDFC Limited 9.74Reliance Industries Limited 9.66HDFC Bank Limited 9.57Cipla Limited 7.91Aurobindo Pharma Limited 7.29Sun Pharmaceuticals Industries Limited 5.28Britannia Industries Limited 3.97Infosys Limited 2.84Bharat Financial Inclusion Limited 2.31Dish TV India Limited 1.45LIC Housing Finance Limited 1.40NIIT Technologies Limited 0.97
Zee Entertainment Enterprises Limited 0.94Indiabulls Housing Finance Limited 0.90UPL Limited 0.46Century Textiles & Industries Limited 0.44IndusInd Bank Limited 0.35ICICI Bank Limited 0.34United Spirits Limited 0.15IRB Infrastructure Developers Limited 0.15Power Grid Corporation of India Limited 0.13Oracle Financial Services Software Limited 0.07
Debt, Cash & Other Receivables 33.69
Net Assets 100%
For Statutory Details & Risk Factors please refer page 24.

TYPE OF SCHEME / INVESTMENT OBJECTIVEAn Open Ended Balanced SchemeThe investment objective of the scheme is to generate income by investing in debt & money market instruments along with long-term capital appreciation through investments in equity & equity related instruments. However, there is no assurance or guarantee that the investment objective of the Scheme will be achieved. The Scheme does not assure or guarantee any returns.
DATE OF ALLOTMENT08th December 2015
FUND MANAGERAshish NaikWork experience: 7 yearsHe has been managing this fund since 6th July 2016
R. Sivakumar Work experience: 16 years He has been managing this fund 07th June 2016.
LATEST NAV (`) as on 30th September 2016 No Lock-In Direct No Lock-InGrowth 10.8334 11.0143Dividend 10.8368 10.9723 Compulsory Direct Compulsory Lock-In Lock-In Growth 10.8337 10.9741 Dividend 10.8386 10.9722
BENCHMARK50% Nifty 50 + 50% Crisil Composite Bond Fund Index
FUND SIZE (`)Monthly Average AUM 256.56 Crore Latest AUM 256.70 Crore (as on 30th September 2016)
AVERAGE MATURITY@*6.3 years
MODIFIED DURATION@*4.3 years
PORTFOLIO YIELD (YIELD TO MATURITY &)7.25%
MINIMUM INVESTMENT AMOUNT (`)5000/1
MINIMUM ADDITIONAL PURCHASE AMOUNT (`)100/1
MINIMUM SIP INSTALLMENT AMOUNT (`)1000/1
LOAD STRUCTUREEntry load - NAExit load - 3% is payable if Units are redeemed / switched out upto 1 year from the date of allotment, - 2% is payable if Units are redeemed / switched - out after 1 year and upto 2 years from the date of allotment - 1% is payable if are redeemed / switched-out after 2 years and upto 3 years from the date of allotment - NIL if Units are redeemed / switched-out after 3 years from the date of allotment
FACTSHEET30th September 2016
The scheme has not completed 1 year, hence performance is not provided.
PORTFOLIOCompany Name Rating % of Assets
Company Name Rating % of Assets
@ Based on debt portfolio only.* For instruments with put/call option, the put/call date has been taken as the maturity date.& The yield to maturity given above is based on the portfolio of funds as on date given above. This should not be taken as an indication of the returns that maybe generated by the fund and the securities bought by the fund may or may not be held till their respective maturities. The calculation is based on the invested corpus of the debt portfolio.
18
Ass
et C
lass
FUND STYLE
*Hedged Equity/ Cash-futures arbitrage
COMPOSITION BY ASSET (%)
¢ Unhedged Equity ¢ Debt, Cash and Other Receivables ¢ Hedged Equity
Industrial Products 1.77Carborundum Universal Limited 1.06Cummins India Limited 0.71Media & Entertainment 2.67Dish TV India Limited 0.54Zee Entertainment Enterprises Limited 2.13Petroleum Products 1.43Gulf Oil Lubricants India Limited 1.43Pharmaceuticals 6.66Cadila Healthcare Limited 0.91Divi’s Laboratories Limited 1.96Pfizer Limited 0.75Sanofi India Limited 0.97Sun Pharmaceuticals Industries Limited 1.45Torrent Pharmaceuticals Limited 0.63Power 0.91Torrent Power Limited 0.91Retailing 0.81Aditya Birla Fashion and Retail Limited 0.81Services 1.33Aditya Birla Nuvo Limited 1.33Software 7.44Info Edge (India) Limited 1.09Infosys Limited 2.58Oracle Financial Services Software Limited 0.75Ramco Systems Limited 0.55Tata Consultancy Services Limited 1.16Tech Mahindra Limited 1.31Transportation 1.41Gateway Distriparks Limited 0.74Gujarat Pipavav Port Limited 0.68Total Hedged Equity 6.99Lupin Limited 0.99IDFC Limited 0.62Aurobindo Pharma Limited 2.01HDFC Bank Limited 1.09HDFC Limited 2.28Debt, Cash & Other Receivables 0.29
Net Assets 100%
Total Debt 34.08Total Fixed Deposit 1.95Government Bond Sovereign 18.54Corporate Bond 13.17Power Finance Corporation Limited CRISIL AAA 6.88HDFC Limited CRISIL AAA 3.16Cholamandalam Investment and Finance Company Limited ICRA AA 2.73Adani Properties Pvt. Ltd. BWR AA-(SO) 0.39Zero Coupon Bond 0.42JM Financial Products Ltd ICRA AA 0.42Total Equity 65.63Total Unhedged Equity 58.64Auto 6.36Mahindra & Mahindra Limited 1.31Maruti Suzuki India Limited 2.96Tata Motors Limited 2.08Auto Ancillaries 2.20Motherson Sumi Systems Limited 2.20Banks 12.79Bank of Baroda 0.65DCB Bank Limited 1.46HDFC Bank Limited 4.51ICICI Bank Limited 1.76Kotak Mahindra Bank Limited 3.28The Federal Bank Limited 1.12Chemicals 1.23Tata Chemicals Limited 1.23Construction Project 2.23Larsen & Toubro Limited 2.23Consumer Non Durables 1.18ITC Limited 1.18Finance 5.46CRISIL Limited 1.04HDFC Limited 3.80Sundaram Finance Limited 0.62Gas 0.91Indraprastha Gas Limited 0.91Hotels, Resorts And Other Recreational Activities 0.87Mahindra Holidays & Resorts India Limited 0.87Industrial Capital Goods 0.97Siemens Limited 0.97
COMPOSITION BY RATING (%)
¢ SOV, AAA & Equivalent ¢ ICRA AA ¢ BWR AA-(SO)
Equity
Debt
DurationLow Mid High
Equity Arbitrage
For Statutory Details & Risk Factors please refer page 24.
28.88%
3.15% 0.39%
58.64%
34.37%
6.99%

ANNEXURE FOR RETURNS OF ALL THE SCHEMES (as on 30th September 2016)Sep 30, 2013 to Sep 30, 2014
Absolute Return (%)
Sep 30, 2014 to Sep 30, 2015
Absolute Return (%)
Sep 30, 2015 to Sep 30, 2016
Absolute Return (%)
Since Inception CAGR (%)
Current Value of Investment if ` 10,000 was invested on inception
date
Date of inception
Funds managed by Jinesh GopaniAxis Equity Fund - Growth 42.97% 5.45% 8.31% 11.10% 20,330
05-Jan-10Nifty 50 (Benchmark) 38.87% -0.20% 8.33% 7.53% 16,315S&P BSE Sensex (Additional Benchmark) 37.41% -1.79% 6.54% 6.98% 15,756Axis Equity Fund - Direct Plan - Growth 44.74% 6.61% 9.41% 15.89% 17,381
01-Jan-13Nifty 50 (Benchmark) 38.87% -0.20% 8.33% 10.36% 14,470S&P BSE Sensex (Additional Benchmark) 37.41% -1.79% 6.54% 9.87% 14,231Axis Long Term Equity Fund - Growth* 76.27% 17.99% 8.00% 19.36% 33,070
29-Dec-09S&P BSE 200 (Benchmark) 42.50% 3.08% 10.96% 8.27% 17,108Nifty 50 (Additional Benchmark) 38.87% -0.20% 8.33% 7.79% 16,598Axis Long Term Equity Fund - Direct Plan - Growth* 78.66% 19.47% 9.20% 25.15% 23,182
01-Jan-13S&P BSE 200 (Benchmark) 42.50% 3.08% 10.96% 11.83% 15,205Nifty 50 (Additional Benchmark) 38.87% -0.20% 8.33% 10.36% 14,470Axis Income Saver - Growth # 20.67% 9.37% 7.61% 8.76% 16,855
16-Jul-10Crisil MIP Blended Fund Index (Benchmark) 15.45% 10.72% 11.17% 8.84% 16,926CRISIL 10 year Gilt Index (Additional Benchmark) 6.85% 13.76% 11.11% 7.25% 15,450Axis Income Saver - Direct Plan - Growth # 22.58% 11.00% 9.35% 11.60% 15,077
04-Jan-13Crisil MIP Blended Fund Index (Benchmark) 15.45% 10.72% 11.17% 9.89% 14,229CRISIL 10 year Gilt Index (Additional Benchmark) 6.85% 13.76% 11.11% 8.03% 13,351Axis Focused 25 Fund - Growth 37.04% 12.74% 14.06% 17.39% 19,790
29-Jun-12Nifty 50 (Benchmark) 38.87% -0.20% 8.33% 12.18% 16,312S&P BSE 200 (Additional Benchmark) 42.50% 3.08% 10.96% 13.89% 17,397Axis Focused 25 Fund - Direct Plan - Growth 38.52% 14.35% 15.45% 16.55% 17,753
01-Jan-13Nifty 50 (Benchmark) 38.87% -0.20% 8.33% 10.36% 14,470S&P BSE 200 (Additional Benchmark) 42.50% 3.08% 10.96% 11.83% 15,205
Funds managed by R.SivakumarAxis Equity Saver Fund - Growth - - 5.62% 4.67% 10,530
14-Aug-15CRISIL MIP Blended Index (Benchmark) - - 11.17% 10.32% 11,176Nifty 50 (Additional Benchmark) - - 8.33% 0.96% 10,109Axis Equity Saver Fund - Direct Plan - Growth - - 6.91% 5.99% 10,680
14-Aug-15CRISIL MIP Blended Index (Benchmark) - - 11.17% 10.32% 11,176Nifty 50 (Additional Benchmark) - - 8.33% 0.96% 10,109Axis Triple Advantage Fund - Growth 15.37% 6.11% 11.55% 8.82% 16,765
23-Aug-1035% of Nifty 50 + 35% of Crisil Composite Bond Fund Index + 30% Of INR Price of Gold (Benchmark) 13.03% 4.17% 13.67% 8.66% 16,613
Crisil 10 Year Gilt Index (Additional Benchmark) 6.85% 13.76% 11.11% 7.67% 15,708Axis Triple Advantage Fund - Direct Plan Growth 16.92% 7.12% 12.52% 8.79% 13,711
01-Jan-1335% of Nifty 50 + 35% of Crisil Composite Bond Fund Index + 30% Of INR Price of Gold (Benchmark)
13.03% 4.17% 13.67% 7.34% 13,041
Crisil 10 Year Gilt Index (Additional Benchmark) 6.85% 13.76% 11.11% 8.15% 13,415 Axis Dynamic Bond Fund - Growth 9.49% 13.26% 10.14% 9.46% 16,344
27-Apr-11Crisil Composite Bond Fund Index (Benchmark) 11.61% 12.56% 11.51% 9.43% 16,316Crisil 10 Year Gilt Index (Additional Benchmark) 6.85% 13.76% 11.11% 7.90% 15,114Axis Dynamic Bond Fund - Direct Plan - Growth 11.13% 14.71% 11.32% 10.81% 14,692
01-Jan-13Crisil Composite Bond Fund Index (Benchmark) 11.61% 12.56% 11.51% 9.74% 14,166Crisil 10 Year Gilt Index (Additional Benchmark) 6.85% 13.76% 11.11% 8.15% 13,415Axis Capital Protection Oriented Fund - Series 5 # 27.53% 0.36% 4.89% 8.23% 13,627
02-Nov-12Crisil MIP Blended Fund Index (Benchmark) 15.45% 10.72% 11.17% 10.14% 14,590Crisil 1 Year T-Bill Index (Additional Benchmark) 8.35% 8.86% 7.36% 7.56% 13,300
Funds managed by Devang ShahAxis Income Saver - Growth # 20.67% 9.37% 7.61% 8.76% 16,855
16-Jul-10Crisil MIP Blended Fund Index (Benchmark) 15.45% 10.72% 11.17% 8.84% 16,926Crisil 10 Year Gilt Index (Additional Benchmark) 6.85% 13.76% 11.11% 7.25% 15,450Axis Income Saver - Direct Plan - Growth # 22.58% 11.00% 9.35% 11.60% 15,077
04-Jan-13Crisil MIP Blended Fund Index (Benchmark) 15.45% 10.72% 11.17% 9.89% 14,229Crisil 10 Year Gilt Index (Additional Benchmark) 6.85% 13.76% 11.11% 8.03% 13,351Axis Dynamic Bond Fund - Growth 9.49% 13.26% 10.14% 9.46% 16,344
27-Apr-11Crisil Composite Bond Fund Index (Benchmark) 11.61% 12.56% 11.51% 9.43% 16,316Crisil 10 Year Gilt Index (Additional Benchmark) 6.85% 13.76% 11.11% 7.90% 15,114Axis Dynamic Bond Fund - Direct Plan - Growth 11.13% 14.71% 11.32% 10.81% 14,692
01-Jan-13Crisil Composite Bond Fund Index (Benchmark) 11.61% 12.56% 11.51% 9.74% 14,166Crisil 10 Year Gilt Index (Additional Benchmark) 6.85% 13.76% 11.11% 8.15% 13,415Axis Fixed Income Opportunities Fund - 10.70% 9.08% 10.01% 12,351
15-July-14CRISIL Short-Term Bond Fund Index (Benchmark) - 9.90% 9.31% 9.60% 12,250CRISIL 1 Year T-Bill (Additional Benchmark) - 8.86% 7.36% 8.09% 11,880Axis Fixed Income Opportunities Fund - Direct Plan - Growth - 11.73% 10.34% 11.09% 12,623
15-July-14CRISIL Short-Term Bond Fund Index (Benchmark) - 9.90% 9.31% 9.60% 12,250CRISIL 1 Year T-Bill (Additional Benchmark) - 8.86% 7.36% 8.09% 11,880Axis Income Fund - Growth 10.99% 13.21% 9.82% 9.72% 15,196
28-Mar-12Crisil Composite Bond Fund Index (Benchmark) 11.61% 12.56% 11.51% 9.74% 15,210Crisil 10 Year Gilt Index (Additional Benchmark) 6.85% 13.76% 11.11% 8.84% 14,654Axis Income Fund - Direct Plan - Growth 12.16% 14.39% 10.90% 10.47% 14,499
07-Jan-13Crisil Composite Bond Fund Index (Benchmark) 11.61% 12.56% 11.51% 9.66% 14,106Crisil 10 Year Gilt Index (Additional Benchmark) 6.85% 13.76% 11.11% 7.98% 13,316Axis Short Term Fund - Growth 9.60% 9.65% 8.88% 8.38% 17,134
22-Jan-10Crisil Short Term Bond Fund Index (Benchmark) 10.12% 9.90% 9.31% 8.39% 17,150Crisil 1 Year T-Bill Index (Additional Benchmark) 8.35% 8.86% 7.36% 6.78% 15,508Axis Short Term Fund - Direct Plan - Growth 10.58% 10.57% 9.71% 9.62% 14,111
01-Jan-13Crisil Short Term Bond Fund Index (Benchmark) 10.12% 9.90% 9.31% 9.33% 13,968Crisil 1 Year T-Bill Index (Additional Benchmark) 8.35% 8.86% 7.36% 7.53% 13,128Axis Short Term Fund - Retail Plan - Growth 9.62% 9.67% 8.88% 8.33% 16,940
02-Mar-10Crisil Short Term Bond Fund Index (Benchmark) 10.12% 9.90% 9.31% 8.50% 17,115Crisil 1 Year T-Bill Index (Additional Benchmark) 8.35% 8.86% 7.36% 6.85% 15,471Axis Liquid Fund - Growth 9.34% 8.64% 7.87% 8.25% 17,394
09-Oct-09Crisil Liquid Fund Index (Benchmark) 9.49% 8.56% 7.69% 7.83% 16,923Crisil 1 Year T-Bill Index (Additional Benchmark) 8.35% 8.86% 7.36% 6.61% 15,628Axis Liquid Fund - Direct Plan - Growth 9.41% 8.70% 7.95% 8.75% 13,698
31-Dec-12Crisil Liquid Fund Index (Benchmark) 9.49% 8.56% 7.69% 8.61% 13,631Crisil 1 Year T-Bill Index (Additional Benchmark) 8.35% 8.86% 7.36% 7.54% 13,134Axis Liquid Fund - Retail Plan - Growth 8.79% 8.08% 7.31% 8.05% 16,653
01-Mar-10Crisil Liquid Fund Index (Benchmark) 9.49% 8.56% 7.69% 8.13% 16,733Crisil 1 Year T-Bill Index (Additional Benchmark) 8.35% 8.86% 7.36% 6.85% 15,473Axis Treasury Advantage Fund - Growth 9.14% 8.74% 8.35% 8.38% 17,543
09-Oct-09Crisil Liquid Fund Index (Benchmark) 9.49% 8.56% 7.69% 7.83% 16,923Crisil 1 Year T-Bill Index (Additional Benchmark) 8.35% 8.86% 7.36% 6.61% 15,628Axis Treasury Advantage Fund - Direct Plan - Growth 9.64% 9.21% 8.76% 9.24% 13,929
01-Jan-13Crisil Liquid Fund Index (Benchmark) 9.49% 8.56% 7.69% 8.61% 13,629Crisil 1 Year T-Bill Index (Additional Benchmark) 8.35% 8.86% 7.36% 7.53% 13,128Axis Treasury Advantage Fund - Retail Plan - Growth 8.34% 8.07% 7.65% 7.95% 16,544
03-Mar-10Crisil Liquid Fund Index (Benchmark) 9.49% 8.56% 7.69% 8.12% 16,723Crisil 1 Year T-Bill Index (Additional Benchmark) 8.35% 8.86% 7.36% 6.85% 15,471Axis Gold ETF -12.00% -1.86% 18.50% 6.52% 14,510
10-Nov-10Domestic Price of Gold -11.09% -1.02% 19.95% 6.16% 14,223 Additional Benchmark Not ApplicableAxis Gold Fund -13.38% -8.04% 18.76% 0.66% 10,329
20-Oct-11Domestic Price of Gold -11.09% -1.02% 19.95% 1.81% 10,931 Additional Benchmark Not ApplicableAxis Gold Fund - Direct Plan -12.08% -6.58% 20.23% -1.34% 9,506
01-Jan-13Domestic Price of Gold -11.09% -1.02% 19.95% -0.78% 9,711 Additional Benchmark Not ApplicableAxis Enhanced Arbitrage Fund - Growth - 7.78% 6.11% 7.00% 11,550
14-Aug-14CRISIL Liquid Fund Index (Benchmark) - 8.56% 7.69% 8.18% 11,824CRISIL 1 Year T-Bill (Additional Benchmark) - 8.86% 7.36% 8.11% 11,807
Past performance may or may not be sustained in future. Calculations are based on Growth Option NAV. Above data excludes schemes which have not completed a year. W.e.f January 1st, 2013, Axis Short Term Fund – Institutional Plan, Axis Treasury Advantage Fund – Institutional Plan & Axis Liquid Fund – Institutional Plan have been renamed Axis Short Term Fund, Axis Treasury Advantage Fund & Axis Liquid Fund respectively. The above data excludes performance of direct plans of schemes which have not completed a year.
19

Sep 30, 2013 to Sep 30, 2014
Absolute Return (%)
Sep 30, 2014 to Sep 30, 2015
Absolute Return (%)
Sep 30, 2015 to Sep 30, 2016
Absolute Return (%)
Since Inception CAGR (%)
Current Value of Investment if ` 10,000 was invested on inception
date
Date of inception
Axis Enhanced Arbitrage Fund - Direct Plan - Growth - 8.70% 7.01% 7.91% 11,76214-Aug-14CRISIL Liquid Fund Index (Benchmark) - 8.56% 7.69% 8.18% 11,824
CRISIL 1 Year T-Bill (Additional Benchmark) - 8.86% 7.36% 8.11% 11,807Axis Constant Maturity 10 Year Fund - Growth 8.71% 13.03% 11.14% 7.97% 14,331 23-Jan-12Crisil 10 Year Gilt Index (Benchmark) 6.85% 13.76% 11.11% 8.17% 14,457Axis Constant Maturity 10 Year Fund - Direct Plan - Growth 9.18% 13.57% 11.72% 8.70% 13,673 01-Jan-13Crisil 10 Year Gilt Index (Benchmark) 6.85% 13.76% 11.11% 8.15% 13,415Axis Hybrid Fund - Series 5 - Growth # 24.93% 1.40% 6.01% 8.59% 13,003
25-Jul-13Crisil MIP Blended Fund Index (Benchmark) 15.45% 10.72% 11.17% 11.49% 14,142Crisil 1 Year T-Bill Index (Additional Benchmark) 8.35% 8.86% 7.36% 8.21% 12,858Axis Hybrid Fund - Series 5 - Direct Plan - Growth # 26.09% 2.37% 7.05% 9.63% 13,406
25-Jul-13Crisil MIP Blended Fund Index (Benchmark) 15.45% 10.72% 11.17% 11.49% 14,142Crisil 1 Year T-Bill Index (Additional Benchmark) 8.35% 8.86% 7.36% 8.21% 12,858Axis Hybrid Fund - Series 6 - Growth # 19.69% 0.83% 5.13% 9.35% 13,224
16-Aug-13Crisil MIP Blended Fund Index (Benchmark) 15.45% 10.72% 11.17% 12.80% 14,574Crisil 1 Year T-Bill Index (Additional Benchmark) 8.35% 8.86% 7.36% 8.30% 12,832Axis Hybrid Fund - Series 6 - Direct Plan - Growth # 20.84% 1.80% 6.16% 10.41% 13,629
16-Aug-13Crisil MIP Blended Fund Index (Benchmark) 15.45% 10.72% 11.17% 12.80% 14,574Crisil 1 Year T-Bill Index (Additional Benchmark) 8.35% 8.86% 7.36% 8.30% 12,832Axis Hybrid Fund - Series 7 - Growth # 22.82% 0.47% 5.31% 9.33% 13,153
05-Sep-13Crisil MIP Blended Fund Index (Benchmark) 15.45% 10.72% 11.17% 12.14% 14,219Crisil 1 Year T-Bill Index (Additional Benchmark) 8.35% 8.86% 7.36% 8.18% 12,732Axis Hybrid Fund - Series 7 - Direct Plan - Growth # 24.06% 1.43% 6.37% 10.42% 13,558
05-Sep-13Crisil MIP Blended Fund Index (Benchmark) 15.45% 10.72% 11.17% 12.14% 14,219Crisil 1 Year T-Bill Index (Additional Benchmark) 8.35% 8.86% 7.36% 8.18% 12,732Axis Hybrid Fund - Series 8 - Growth # - 1.58% 3.21% 6.89% 11,958
24-Jan-14Crisil MIP Blended Fund Index (Benchmark) - 10.72% 11.17% 12.14% 13,602Crisil 1 yr Tbill Index (Additional Benchmark) - 8.86% 7.36% 8.11% 12,330Axis Hybrid Fund - Series 8 - Direct Plan - Growth # - 2.54% 4.14% 7.89% 12,262
24-Jan-14Crisil MIP Blended Fund Index (Benchmark) - 10.72% 11.17% 12.14% 13,602Crisil 1 yr Tbill Index (Additional Benchmark) - 8.86% 7.36% 8.11% 12,330Axis Hybrid Fund - Series 9 - Growth # - 1.80% 3.13% 7.06% 11,966
13-Feb-14Crisil MIP Blended Fund Index (Benchmark) - 10.72% 11.17% 12.83% 13,737Crisil 1 yr Tbill Index (Additional Benchmark) - 8.86% 7.36% 8.23% 12,312Axis Hybrid Fund - Series 9 - Direct Plan - Growth # - 2.76% 4.06% 8.06% 12,261
13-Feb-14Crisil MIP Blended Fund Index (Benchmark) - 10.72% 11.17% 12.83% 13,737Crisil 1 yr Tbill Index (Additional Benchmark) - 8.86% 7.36% 8.23% 12,312Axis Hybrid Fund - Series 11 - Growth # - 2.13% 3.22% 5.29% 11,314
9-May-14CRISIL MIP Blended Index (Benchmark) - 10.72% 11.17% 11.85% 13,079CRISIL 1 Year T-Bill (Additional Benchmark) - 8.86% 7.36% 8.13% 12,062Axis Hybrid Fund - Series 11 - Direct Plan - Growth # - 3.24% 4.14% 6.36% 11,592
9-May-14CRISIL MIP Blended Index (Benchmark) - 10.72% 11.17% 11.85% 13,079CRISIL 1 Year T-Bill (Additional Benchmark) - 8.86% 7.36% 8.13% 12,062Axis Hybrid Fund - Series 12 - Growth # - 2.34% 3.07% 5.03% 11,222
27-May-14CRISIL MIP Blended Index (Benchmark) - 10.72% 11.17% 11.22% 12,837CRISIL 1 Year T-Bill (Additional Benchmark) - 8.86% 7.36% 8.09% 12,004Axis Hybrid Fund - Series 12 - Direct Plan - Growth # - 3.46% 4.00% 6.11% 11,494
27-May-14CRISIL MIP Blended Index (Benchmark) - 10.72% 11.17% 11.22% 12,837CRISIL 1 Year T-Bill (Additional Benchmark) - 8.86% 7.36% 8.09% 12,004Axis Hybrid Fund - Series 13 - Growth # - 2.42% 2.72% 4.80% 11,133
18-Jun-14CRISIL MIP Blended Index (Benchmark) - 10.72% 11.17% 10.84% 12,655CRISIL 1 Year T-Bill (Additional Benchmark) - 8.86% 7.36% 8.08% 11,944Axis Hybrid Fund - Series 13 - Direct Plan - Growth # - 3.53% 3.65% 5.86% 11,391
18-Jun-14CRISIL MIP Blended Index (Benchmark) - 10.72% 11.17% 10.84% 12,655CRISIL 1 Year T-Bill (Additional Benchmark) - 8.86% 7.36% 8.08% 11,944Axis Hybrid Fund - Series 14 - Growth # - 5.07% 3.85% 3.71% 10,786
2-Sep-14CRISIL MIP Blended Index (Benchmark) - 10.72% 11.17% 10.82% 12,381CRISIL 1 Year T-Bill (Additional Benchmark) - 8.86% 7.36% 8.11% 11,760Axis Hybrid Fund - Series 14 - Direct Plan - Growth # - 6.90% 4.81% 5.11% 11,091
2-Sep-14CRISIL MIP Blended Index (Benchmark) - 10.72% 11.17% 10.82% 12,381CRISIL 1 Year T-Bill (Additional Benchmark) - 8.86% 7.36% 8.11% 11,760Axis Hybrid Fund - Series 15 - Growth # - 4.34% 3.77% 3.36% 10,698
17-Sep-14CRISIL MIP Blended Index (Benchmark) - 10.72% 11.17% 10.92% 12,353CRISIL 1 Year T-Bill (Additional Benchmark) - 8.86% 7.36% 8.10% 11,720Axis Hybrid Fund - Series 15 - Direct Plan - Growth # - 5.54% 4.72% 4.44% 10,926
17-Sep-14CRISIL MIP Blended Index (Benchmark) - 10.72% 11.17% 10.92% 12,353CRISIL 1 Year T-Bill (Additional Benchmark) - 8.86% 7.36% 8.10% 11,720Axis Hybrid Fund - Series 18 - Growth # - - 3.77% 1.54% 10,263
19-Jan-15CRISIL MIP Blended Index (Benchmark) - - 11.17% 8.88% 11,555CRISIL 1 Year T-Bill (Additional Benchmark) - - 7.36% 7.82% 11,364Axis Hybrid Fund - Series 18 - Direct Plan - Growth # - - 4.74% 2.45% 10,420
19-Jan-15CRISIL MIP Blended Index (Benchmark) - - 11.17% 8.88% 11,555CRISIL 1 Year T-Bill (Additional Benchmark) - - 7.36% 7.82% 11,364Axis Hybrid Fund - Series 19 - Growth # - - 4.22% 0.94% 10,157
04-Feb-15CRISIL MIP Blended Index (Benchmark) - - 11.17% 8.77% 11,492CRISIL 1 Year T-Bill (Additional Benchmark) - - 7.36% 7.89% 11,339Axis Hybrid Fund - Series 19 - Direct Plan - Growth # - - 5.20% 1.87% 10,311
04-Feb-15CRISIL MIP Blended Index (Benchmark) - - 11.17% 8.77% 11,492CRISIL 1 Year T-Bill (Additional Benchmark) - - 7.36% 7.89% 11,339Axis Hybrid Fund - Series 22 - Growth # - - 3.62% 0.61% 10,085
11-May-15CRISIL MIP Blended Index (Benchmark) - - 11.17% 10.20% 11,447CRISIL 1 Year T-Bill (Additional Benchmark) - - 7.36% 7.83% 11,107Axis Hybrid Fund - Series 22 - Direct Plan - Growth # - - 4.80% 1.74% 10,243
11-May-15CRISIL MIP Blended Index (Benchmark) - - 11.17% 10.20% 11,447CRISIL 1 Year T-Bill (Additional Benchmark) - - 7.36% 7.83% 11,107Axis Hybrid Fund - Series 23 - Growth # - - 4.98% 0.99% 10,133
28-May-15CRISIL MIP Blended Index (Benchmark) - - 11.17% 10.08% 11,380CRISIL 1 Year T-Bill (Additional Benchmark) - - 7.36% 7.77% 11,058Axis Hybrid Fund - Series 23 - Direct Plan - Growth # - - 6.18% 2.13% 10,287
28-May-15CRISIL MIP Blended Index (Benchmark) - - 11.17% 10.08% 11,380CRISIL 1 Year T-Bill (Additional Benchmark) - - 7.36% 7.77% 11,058Axis Hybrid Fund - Series 24 - Growth # - - 3.50% 1.77% 10,229
17-Jun-15CRISIL MIP Blended Index (Benchmark) - - 11.17% 11.20% 11,468CRISIL 1 Year T-Bill (Additional Benchmark) - - 7.36% 7.75% 11,011Axis Hybrid Fund - Series 24 - Direct Plan - Growth # - - 4.68% 2.92% 10,379
17-Jun-15CRISIL MIP Blended Index (Benchmark) - - 11.17% 11.20% 11,468CRISIL 1 Year T-Bill (Additional Benchmark) - - 7.36% 7.75% 11,011Axis Hybrid Fund - Series 25 - Growth # - - 2.43% 3.09% 10,341
25-Aug-15CRISIL MIP Blended Index (Benchmark) - - 11.17% 11.80% 11,307CRISIL 1 Year T-Bill (Additional Benchmark) - - 7.36% 7.66% 10,847Axis Hybrid Fund - Series 25 - Direct Plan - Growth # - - 3.60% 4.26% 10,470
25-Aug-15CRISIL MIP Blended Index (Benchmark) - - 11.17% 11.80% 11,307CRISIL 1 Year T-Bill (Additional Benchmark) - - 7.36% 7.66% 10,847Axis Hybrid Fund - Series 26 - Growth # - - 2.38% 4.15% 10,440
10-Sep-15Crisil Composite Bond Fund Index (85%) and Nifty 50 Index (15%) (Benchmark) - - 11.17% 12.14% 11,288 CRISIL 1 Year T-Bill (Additional Benchmark) - - 7.36% 7.58% 10,803 Axis Hybrid Fund - Series 26 - Direct Plan - Growth # - - 3.54% 5.34% 10,565
10-Sep-15Crisil Composite Bond Fund Index (85%) and Nifty 50 Index (15%) (Benchmark) - - 11.17% 12.14% 11,288 CRISIL 1 Year T-Bill (Additional Benchmark) - - 7.36% 7.58% 10,803
Funds managed by Ashwin PatniAxis Enhanced Arbitrage Fund - Growth - 7.78% 6.11% 7.00% 11,550
14-Aug-14CRISIL Liquid Fund Index (Benchmark) - 8.56% 7.69% 8.18% 11,824CRISIL 1 Year T-Bill (Additional Benchmark) - 8.86% 7.36% 8.11% 11,807Axis Enhanced Arbitrage Fund - Direct Plan - Growth - 8.70% 7.01% 7.91% 11,762
14-Aug-14CRISIL Liquid Fund Index (Benchmark) - 8.56% 7.69% 8.18% 11,824CRISIL 1 Year T-Bill (Additional Benchmark) - 8.86% 7.36% 8.11% 11,807
20
ANNEXURE FOR RETURNS OF ALL THE SCHEMES (as on 30th September 2016)

21
Sep 30, 2013 to Sep 30, 2014
Absolute Return (%)
Sep 30, 2014 to Sep 30, 2015
Absolute Return (%)
Sep 30, 2015 to Sep 30, 2016
Absolute Return (%)
Since Inception CAGR (%)
Current Value of Investment if ` 10,000 was invested on inception
date
Date of inception
Axis Hybrid Fund - Series 5 - Growth # 24.93% 1.40% 6.01% 8.59% 13,00325-Jul-13Crisil MIP Blended Fund Index (Benchmark) 15.45% 10.72% 11.17% 11.49% 14,142
Crisil 1 Year T-Bill Index (Additional Benchmark) 8.35% 8.86% 7.36% 8.21% 12,858Axis Hybrid Fund - Series 5 - Direct Plan - Growth # 26.09% 2.37% 7.05% 9.63% 13,406
25-Jul-13Crisil MIP Blended Fund Index (Benchmark) 15.45% 10.72% 11.17% 11.49% 14,142Crisil 1 Year T-Bill Index (Additional Benchmark) 8.35% 8.86% 7.36% 8.21% 12,858Axis Hybrid Fund - Series 6 - Growth # 19.69% 0.83% 5.13% 9.35% 13,224
16-Aug-13Crisil MIP Blended Fund Index (Benchmark) 15.45% 10.72% 11.17% 12.80% 14,574Crisil 1 Year T-Bill Index (Additional Benchmark) 8.35% 8.86% 7.36% 8.30% 12,832Axis Hybrid Fund - Series 6 - Direct Plan - Growth # 20.84% 1.80% 6.16% 10.41% 13,629
16-Aug-13Crisil MIP Blended Fund Index (Benchmark) 15.45% 10.72% 11.17% 12.80% 14,574Crisil 1 Year T-Bill Index (Additional Benchmark) 8.35% 8.86% 7.36% 8.30% 12,832Axis Hybrid Fund - Series 7 - Growth # 22.82% 0.47% 5.31% 9.33% 13,153
05-Sep-13Crisil MIP Blended Fund Index (Benchmark) 15.45% 10.72% 11.17% 12.14% 14,219Crisil 1 Year T-Bill Index (Additional Benchmark) 8.35% 8.86% 7.36% 8.18% 12,732Axis Hybrid Fund - Series 7 - Direct Plan - Growth # 24.06% 1.43% 6.37% 10.42% 13,558
05-Sep-13Crisil MIP Blended Fund Index (Benchmark) 15.45% 10.72% 11.17% 12.14% 14,219Crisil 1 Year T-Bill Index (Additional Benchmark) 8.35% 8.86% 7.36% 8.18% 12,732Axis Hybrid Fund - Series 8 - Growth # - 1.58% 3.21% 6.89% 11,958
24-Jan-14Crisil MIP Blended Fund Index (Benchmark) - 10.72% 11.17% 12.14% 13,602Crisil 1 yr Tbill Index (Additional Benchmark) - 8.86% 7.36% 8.11% 12,330Axis Hybrid Fund - Series 8 - Direct Plan - Growth # - 2.54% 4.14% 7.89% 12,262
24-Jan-14Crisil MIP Blended Fund Index (Benchmark) - 10.72% 11.17% 12.14% 13,602Crisil 1 yr Tbill Index (Additional Benchmark) - 8.86% 7.36% 8.11% 12,330Axis Hybrid Fund - Series 9 - Growth # - 1.80% 3.13% 7.06% 11,966
13-Feb-14Crisil MIP Blended Fund Index (Benchmark) - 10.72% 11.17% 12.83% 13,737Crisil 1 yr Tbill Index (Additional Benchmark) - 8.86% 7.36% 8.23% 12,312Axis Hybrid Fund - Series 9 - Direct Plan - Growth # - 2.76% 4.06% 8.06% 12,261
13-Feb-14Crisil MIP Blended Fund Index (Benchmark) - 10.72% 11.17% 12.83% 13,737Crisil 1 yr Tbill Index (Additional Benchmark) - 8.86% 7.36% 8.23% 12,312Axis Hybrid Fund - Series 11 - Growth # - 2.13% 3.22% 5.29% 11,314
9-May-14CRISIL MIP Blended Index (Benchmark) - 10.72% 11.17% 11.85% 13,079CRISIL 1 Year T-Bill (Additional Benchmark) - 8.86% 7.36% 8.13% 12,062Axis Hybrid Fund - Series 11 - Direct Plan - Growth # - 3.24% 4.14% 6.36% 11,592
9-May-14CRISIL MIP Blended Index (Benchmark) - 10.72% 11.17% 11.85% 13,079CRISIL 1 Year T-Bill (Additional Benchmark) - 8.86% 7.36% 8.13% 12,062Axis Hybrid Fund - Series 12 - Growth # - 2.34% 3.07% 5.03% 11,222
27-May-14CRISIL MIP Blended Index (Benchmark) - 10.72% 11.17% 11.22% 12,837CRISIL 1 Year T-Bill (Additional Benchmark) - 8.86% 7.36% 8.09% 12,004Axis Hybrid Fund - Series 12 - Direct Plan - Growth # - 3.46% 4.00% 6.11% 11,494
27-May-14CRISIL MIP Blended Index (Benchmark) - 10.72% 11.17% 11.22% 12,837CRISIL 1 Year T-Bill (Additional Benchmark) - 8.86% 7.36% 8.09% 12,004Axis Hybrid Fund - Series 13 - Growth # - 2.42% 2.72% 4.80% 11,133
18-Jun-14CRISIL MIP Blended Index (Benchmark) - 10.72% 11.17% 10.84% 12,655CRISIL 1 Year T-Bill (Additional Benchmark) - 8.86% 7.36% 8.08% 11,944Axis Hybrid Fund - Series 13 - Direct Plan - Growth # - 3.53% 3.65% 5.86% 11,391
18-Jun-14CRISIL MIP Blended Index (Benchmark) - 10.72% 11.17% 10.84% 12,655CRISIL 1 Year T-Bill (Additional Benchmark) - 8.86% 7.36% 8.08% 11,944Axis Hybrid Fund - Series 14 - Growth # - 5.07% 3.85% 3.71% 10,786
2-Sep-14CRISIL MIP Blended Index (Benchmark) - 10.72% 11.17% 10.82% 12,381CRISIL 1 Year T-Bill (Additional Benchmark) - 8.86% 7.36% 8.11% 11,760Axis Hybrid Fund - Series 14 - Direct Plan - Growth # - 6.90% 4.81% 5.11% 11,091
2-Sep-14CRISIL MIP Blended Index (Benchmark) - 10.72% 11.17% 10.82% 12,381CRISIL 1 Year T-Bill (Additional Benchmark) - 8.86% 7.36% 8.11% 11,760Axis Hybrid Fund - Series 15 - Growth # - 4.34% 3.77% 3.36% 10,698
17-Sep-14CRISIL MIP Blended Index (Benchmark) - 10.72% 11.17% 10.92% 12,353CRISIL 1 Year T-Bill (Additional Benchmark) - 8.86% 7.36% 8.10% 11,720Axis Hybrid Fund - Series 15 - Direct Plan - Growth # - 5.54% 4.72% 4.44% 10,926
17-Sep-14CRISIL MIP Blended Index (Benchmark) - 10.72% 11.17% 10.92% 12,353CRISIL 1 Year T-Bill (Additional Benchmark) - 8.86% 7.36% 8.10% 11,720Axis Hybrid Fund - Series 18 - Growth # - - 3.77% 1.54% 10,263
19-Jan-15CRISIL MIP Blended Index (Benchmark) - - 11.17% 8.88% 11,555CRISIL 1 Year T-Bill (Additional Benchmark) - - 7.36% 7.82% 11,364Axis Hybrid Fund - Series 18 - Direct Plan - Growth # - - 4.74% 2.45% 10,420
19-Jan-15CRISIL MIP Blended Index (Benchmark) - - 11.17% 8.88% 11,555CRISIL 1 Year T-Bill (Additional Benchmark) - - 7.36% 7.82% 11,364Axis Hybrid Fund - Series 19 - Growth # - - 4.22% 0.94% 10,157
04-Feb-15CRISIL MIP Blended Index (Benchmark) - - 11.17% 8.77% 11,492CRISIL 1 Year T-Bill (Additional Benchmark) - - 7.36% 7.89% 11,339Axis Hybrid Fund - Series 19 - Direct Plan - Growth # - - 5.20% 1.87% 10,311
04-Feb-15CRISIL MIP Blended Index (Benchmark) - - 11.17% 8.77% 11,492CRISIL 1 Year T-Bill (Additional Benchmark) - - 7.36% 7.89% 11,339Axis Hybrid Fund - Series 22 - Growth # - - 3.62% 0.61% 10,085
11-May-15CRISIL MIP Blended Index (Benchmark) - - 11.17% 10.20% 11,447CRISIL 1 Year T-Bill (Additional Benchmark) - - 7.36% 7.83% 11,107Axis Hybrid Fund - Series 22 - Direct Plan - Growth # - - 4.80% 1.74% 10,243
11-May-15CRISIL MIP Blended Index (Benchmark) - - 11.17% 10.20% 11,447CRISIL 1 Year T-Bill (Additional Benchmark) - - 7.36% 7.83% 11,107Axis Hybrid Fund - Series 23 - Growth # - - 4.98% 0.99% 10,133
28-May-15CRISIL MIP Blended Index (Benchmark) - - 11.17% 10.08% 11,380CRISIL 1 Year T-Bill (Additional Benchmark) - - 7.36% 7.77% 11,058Axis Hybrid Fund - Series 23 - Direct Plan - Growth # - - 6.18% 2.13% 10,287
28-May-15CRISIL MIP Blended Index (Benchmark) - - 11.17% 10.08% 11,380CRISIL 1 Year T-Bill (Additional Benchmark) - - 7.36% 7.77% 11,058Axis Hybrid Fund - Series 24 - Growth # - - 3.50% 1.77% 10,229
17-Jun-15CRISIL MIP Blended Index (Benchmark) - - 11.17% 11.20% 11,468CRISIL 1 Year T-Bill (Additional Benchmark) - - 7.36% 7.75% 11,011Axis Hybrid Fund - Series 24 - Direct Plan - Growth # - - 4.68% 2.92% 10,379
17-Jun-15CRISIL MIP Blended Index (Benchmark) - - 11.17% 11.20% 11,468CRISIL 1 Year T-Bill (Additional Benchmark) - - 7.36% 7.75% 11,011Axis Hybrid Fund - Series 25 - Growth # - - 2.43% 3.09% 10,341
25-Aug-15CRISIL MIP Blended Index (Benchmark) - - 11.17% 11.80% 11,307CRISIL 1 Year T-Bill (Additional Benchmark) - - 7.36% 7.66% 10,847Axis Hybrid Fund - Series 25 - Direct Plan - Growth # - - 3.60% 4.26% 10,470
25-Aug-15CRISIL MIP Blended Index (Benchmark) - - 11.17% 11.80% 11,307CRISIL 1 Year T-Bill (Additional Benchmark) - - 7.36% 7.66% 10,847Axis Hybrid Fund - Series 26 - Growth # - - 2.38% 4.15% 10,440
10-Sep-15Crisil Composite Bond Fund Index (85%) and Nifty 50 Index (15%) (Benchmark) - - 11.17% 12.14% 11,288 CRISIL 1 Year T-Bill (Additional Benchmark) - - 7.36% 7.58% 10,803 Axis Hybrid Fund - Series 26 - Direct Plan - Growth # - - 3.54% 5.34% 10,565
10-Sep-15Crisil Composite Bond Fund Index (85%) and Nifty 50 Index (15%) (Benchmark) - - 11.17% 12.14% 11,288 CRISIL 1 Year T-Bill (Additional Benchmark) - - 7.36% 7.58% 10,803 Axis Capital Protection Oriented Fund - Series 5 # 27.53% 0.36% 4.89% 8.23% 13,627
02-Nov-12Crisil MIP Blended Fund Index (Benchmark) 15.45% 10.72% 11.17% 10.14% 14,590Crisil 1 Year T-Bill Index (Additional Benchmark) 8.35% 8.86% 7.36% 7.56% 13,300
Funds managed by Ashish NaikAxis Equity Fund - Growth 42.97% 5.45% 8.31% 11.10% 20,330
05-Jan-10Nifty 50 (Benchmark) 38.87% -0.20% 8.33% 7.53% 16,315S&P BSE Sensex (Additional Benchmark) 37.41% -1.79% 6.54% 6.98% 15,756Axis Equity Fund - Direct Plan - Growth 44.74% 6.61% 9.41% 15.89% 17,381
01-Jan-13Nifty 50 (Benchmark) 38.87% -0.20% 8.33% 10.36% 14,470S&P BSE Sensex (Additional Benchmark) 37.41% -1.79% 6.54% 9.87% 14,231
ANNEXURE FOR RETURNS OF ALL THE SCHEMES (as on 30th September 2016)

22
Sep 30, 2013 to Sep 30, 2014
Absolute Return (%)
Sep 30, 2014 to Sep 30, 2015
Absolute Return (%)
Sep 30, 2015 to Sep 30, 2016
Absolute Return (%)
Since Inception CAGR (%)
Current Value of Investment if ` 10,000 was invested on inception
date
Date of inception
Axis Triple Advantage Fund - Growth 15.37% 6.11% 11.55% 8.82% 16,765
23-Aug-1035% of Nifty 50 + 35% of Crisil Composite Bond Fund Index + 30% Of INR Price of Gold (Benchmark) 13.03% 4.17% 13.67% 8.66% 16,613
Crisil 10 Year Gilt Index (Additional Benchmark) 6.85% 13.76% 11.11% 7.67% 15,708Axis Triple Advantage Fund - Direct Plan Growth 16.92% 7.12% 12.52% 8.79% 13,711
01-Jan-1335% of Nifty 50 + 35% of Crisil Composite Bond Fund Index + 30% Of INR Price of Gold (Benchmark) 13.03% 4.17% 13.67% 7.34% 13,041
Crisil 10 Year Gilt Index (Additional Benchmark) 6.85% 13.76% 11.11% 8.15% 13,415Axis Income Saver - Growth # 20.67% 9.37% 7.61% 8.76% 16,855
16-Jul-10Crisil MIP Blended Fund Index (Benchmark) 15.45% 10.72% 11.17% 8.84% 16,926CRISIL 10 year Gilt Index (Additional Benchmark) 6.85% 13.76% 11.11% 7.25% 15,450Axis Income Saver - Direct Plan - Growth # 22.58% 11.00% 9.35% 11.60% 15,077
04-Jan-13Crisil MIP Blended Fund Index (Benchmark) 15.45% 10.72% 11.17% 9.89% 14,229CRISIL 10 year Gilt Index (Additional Benchmark) 6.85% 13.76% 11.11% 8.03% 13,351Axis Midcap Fund - Growth 89.00% 17.00% 4.27% 19.21% 26,840
18-Feb-11S&P BSE Midcap (Benchmark) 70.00% 13.31% 21.92% 12.89% 19,765Nifty 50 (Additional Benchmark) 38.87% -0.20% 8.33% 8.45% 15,774Axis Midcap Fund - Direct Plan - Growth 91.89% 18.47% 5.52% 21.14% 20,519
01-Jan-13S&P BSE Midcap (Benchmark) 70.00% 13.31% 21.92% 17.48% 18,293Nifty 50 (Additional Benchmark) 38.87% -0.20% 8.33% 10.36% 14,470
Funds managed by Aditya PagariaAxis Liquid Fund - Growth 9.34% 8.64% 7.87% 8.25% 17,394
09-Oct-09Crisil Liquid Fund Index (Benchmark) 9.49% 8.56% 7.69% 7.83% 16,923Crisil 1 Year T-Bill Index (Additional Benchmark) 8.35% 8.86% 7.36% 6.61% 15,628Axis Liquid Fund - Direct Plan - Growth 9.41% 8.70% 7.95% 8.75% 13,698
31-Dec-12Crisil Liquid Fund Index (Benchmark) 9.49% 8.56% 7.69% 8.61% 13,631Crisil 1 Year T-Bill Index (Additional Benchmark) 8.35% 8.86% 7.36% 7.54% 13,134Axis Liquid Fund - Retail Plan - Growth 8.79% 8.08% 7.31% 8.05% 16,653
01-Mar-10Crisil Liquid Fund Index (Benchmark) 9.49% 8.56% 7.69% 8.13% 16,733Crisil 1 Year T-Bill Index (Additional Benchmark) 8.35% 8.86% 7.36% 6.85% 15,473Axis Treasury Advantage Fund - Growth 9.14% 8.74% 8.35% 8.38% 17,543
09-Oct-09Crisil Liquid Fund Index (Benchmark) 9.49% 8.56% 7.69% 7.83% 16,923Crisil 1 Year T-Bill Index (Additional Benchmark) 8.35% 8.86% 7.36% 6.61% 15,628Axis Treasury Advantage Fund - Direct Plan - Growth 9.64% 9.21% 8.76% 9.24% 13,929
01-Jan-13Crisil Liquid Fund Index (Benchmark) 9.49% 8.56% 7.69% 8.61% 13,629Crisil 1 Year T-Bill Index (Additional Benchmark) 8.35% 8.86% 7.36% 7.53% 13,128Axis Treasury Advantage Fund - Retail Plan - Growth 8.34% 8.07% 7.65% 7.95% 16,544
03-Mar-10Crisil Liquid Fund Index (Benchmark) 9.49% 8.56% 7.69% 8.12% 16,723Crisil 1 Year T-Bill Index (Additional Benchmark) 8.35% 8.86% 7.36% 6.85% 15,471Axis Banking Debt Fund - Growth 9.66% 9.01% 8.16% 8.84% 14,414
08-Jun-12Crisil Short Term Bond Fund Index (Benchmark) 10.12% 9.90% 9.31% 9.31% 14,684Crisil 1 Year T-Bill Index (Additional Benchmark) 8.35% 8.86% 7.36% 7.55% 13,691Axis Banking Debt Fund - Direct Plan - Growth 9.89% 9.20% 8.34% 8.94% 13,784
01-Jan-13Crisil Short Term Bond Fund Index (Benchmark) 10.12% 9.90% 9.31% 9.33% 13,968Crisil 1 Year T-Bill Index (Additional Benchmark) 8.35% 8.86% 7.36% 7.53% 13,128
Funds managed by Anupam Tiwari Axis Equity Saver Fund - Growth - - 5.62% 4.67% 10,530
14-Aug-15CRISIL MIP Blended Index (Benchmark) - - 11.17% 10.32% 11,176Nifty 50 (Additional Benchmark) - - 8.33% 0.96% 10,109Axis Equity Saver Fund - Direct Plan - Growth - - 6.91% 5.99% 10,680
14-Aug-15CRISIL MIP Blended Index (Benchmark) - - 11.17% 10.32% 11,176Nifty 50 (Additional Benchmark) - - 8.33% 0.96% 10,109Axis Small Cap Fund - Growth - 15.39% 13.96% 32.46% 22,210
29-Nov-13Nifty Free Float Smallcap 100 (Benchmark) - 5.87% 17.27% 26.01% 19,276Nifty 50 (Additional Benchmark) - -0.20% 8.33% 12.42% 13,943Axis Small Cap Fund - Direct Plan - Growth - 16.59% 15.28% 33.96% 22,930
29-Nov-13Nifty Free Float Smallcap 100 (Benchmark) - 5.87% 17.27% 26.01% 19,276Nifty 50 (Additional Benchmark) - -0.20% 8.33% 12.42% 13,943
Past performance may or may not be sustained in future. Calculations are based of Growth Option NAV. Since inception returns are calculated on Rs. 1,000/- invested at inception for Axis Liquid Fund, Axis Treasury Advantage Fund and Axis Banking & Debt Fund, on Rs. 2,026.8434/- invested at inception for Axis Gold Exchange Traded Fund and on Rs. 10/- invested at inception for all other schemes. Above data excludes returns of Fixed Maturity Plans and schemes which have not completed a year.W.e.f January 1st, 2013, Axis Short Term Fund – Institutional Plan, Axis Treasury Advantage Fund – Institutional Plan & Axis Liquid Fund – Institutional Plan have been renamed Axis Short Term Fund, Axis Treasury Advantage Fund & Axis Liquid Fund respectively. * An open ended equity linked savings scheme with a 3 year lock-in.# Scheme Performance may not be strictly comparable with that of its additional benchmark in view of hybrid nature of the scheme.$ Rating Details (Axis Income Fund, Axis Short Term Fund & Axis Banking Debt Fund)Schemes with this rating are considered to have the highest degree of safety regarding timely receipt of payments from the investments that they have made. This rating should however, not be construed as an indication of the performance of the Mutual Fund scheme or of volatility in its returns. The rating should not be treated as a recommendation to buy, sell or hold units issued by the Mutual Fund.^ Rating Details (Axis Treasury Advantage Fund and Axis Liquid Fund)Schemes with this rating are considered to have very strong degree of safety regarding timely receipt of payments from the investments that they have made. This rating should however, not be construed as an indication of the performance of the Mutual Fund scheme or of volatility in its returns. The rating should not be treated as a recommendation to buy, sell or hold units issued by the Mutual Fund.
ANNEXURE FOR RETURNS OF ALL THE SCHEMES (as on 30th September 2016)

HOW TO READ FACTSHEET
23
Fund Manager : An employee of the asset management company such as a mutual fund or life insurer, who manages investments of the scheme. He is usually part of a larger team of fund managers and research analysts.
Application Amount for Fresh Subscription : This is the minimum investment amount for a new investor in a mutual fund scheme.
Minimum Additional Amount : This is the minimum investment amount for an existing investor in a mutual fund scheme.
Yield to Maturity : The Yield to Maturity or the YTM is the rate of return anticipated on a bond if held until maturity. YTM is expressed as an annual rate. The YTM factors in the bond’s current market price, par value, coupon interest rate and time to maturity.
SIP : SIP or systematic investment plan works on the principle of making periodic investments of a fixed sum. It works similar to a recurring bank deposit. For instance, an investor may opt for an SIP that invests Rs 500 every 15th of the month in an equity fund for a period of three years.
NAV : The NAV or the net asset value is the total asset value per unit of the mutual fund after deducting all related and permissible expenses. The NAV is calculated at the end of every business day. It is the value at which the investor enters or exits the mutual fund.
Benchmark : A group of securities, usually a market index, whose performance is used as a standard or benchmark to measure investment performance of mutual funds, among other investments. Some typical benchmarks include the Nifty, Sensex, BSE200, BSE500, 10-Year Gsec.
Entry Load : A mutual fund may have a sales charge or load at the time of entry and/or exit to compensate the distributor/agent.
Entry load is charged at the time an investor purchases the units of a mutual fund. The entry load is added to the prevailing NAV at the time of investment. For instance, if the NAV is Rs. 100 and the entry load is 1%, the investor will enter the fund at Rs 101.
Note: SEBI, vide circular dated June 30, 2009 has abolished entry load and mandated that the upfront commission to distributors will be paid by the investor directly to the distributor, based on his assessment of various factors including the service rendered by the distributor
Exit Load : Exit load is charged at the time an investor redeems the units of a mutual fund. The exit load is deducted from the prevailing NAV at the time of redemption. For instance, if the NAV is Rs 100 and the exit load is 1%, the redemption price would be Rs 99 Per Unit.
Modified Duration : Modified duration is the price sensitivity and the percentage change in price for a unit change in yield
Standard Deviation : Standard deviation is a statistical measure of the range of an investment’s performance. When a mutual fund has a high standard deviation, its means its range of performance is wide, implying greater volatility.
Sharpe Ratio : The Sharpe Ratio, named after its founder, the Nobel Laureate William Sharpe, is a measure of risk-adjusted returns. It is calculated using standard deviation and excess return to determine reward per unit of risk.
Beta : Beta is a measure of an investment’s volatility vis-à-vis the market. Beta of less than 1 means that the security will be less volatile than the market. A beta of greater than 1 implies that the security’s price will be more volatile than the market.
AUM : AUM or assets under management refers to the recent / updated cumulative market value of investments managed by a mutual fund or any investment firm.
Holdings : The holdings or the portfolio is a mutual fund’s latest or updated reported statement of investments/securities. These are usually displayed in terms of percentage to net assets or the rupee value or both. The objective is to give investors an idea of where their money is being invested by the fund manager.
Nature of Scheme : The investment objective and underlying investments determine the nature of the mutual fund scheme. For instance, a mutual fund that aims at generating capital appreciation by investing in stock markets is an equity fund or growth fund. Likewise, a mutual fund that aims at capital preservation by investing in debt markets is a debt fund or income fund. Each of these categories may have sub-categories.
Rating Profile : Mutual funds invest in securities after evaluating their creditworthiness as disclosed by the ratings. A depiction of the mutual fund in various investments based on their ratings becomes the rating profile of the fund. Typically, this is a feature of debt funds.
Tracking Error: Tracking error is a measure of how closely a portfolio follows the index to which it is benchmarked. It is calculated as the standard deviation of the difference between the portfolio and index returns.
Weighted Average Expense Ratio for the MonthScheme - Regular Plan / Direct Plan : Axis Hybrid Fund - Series 5: 2.27% / 1.42%, Axis Hybrid Fund - Series 6: 2.28% / 1.43%, Axis Hybrid Fund - Series 7: 2.28% / 1.43%, Axis Hybrid Fund - Series 8: 2.26% / 1.31%, Axis Hybrid Fund - Series 9: 2.27% / 1.32%, Axis Hybrid Fund - Series 11: 2.32% / 1.37%, Axis Hybrid Fund - Series 12: 2.29%/ 1.34%, Axis Hybrid Fund - Series 13 : 2.19% / 1.24%, Axis Hybrid Fund - Series 14 : 2.19% / 1.19%, Axis Hybrid Fund - Series 15 : 2.27% / 1.27%, Axis Hybrid Fund - Series 18 : 2.19% / 1.14%, Axis Hybrid Fund - Series 19 : 2.28% / 1.23%, Axis Hybrid Fund - Series 22 : 2.06% / 0.87%, Axis Hybrid Fund - Series 23 : 2.07% /0.88%, Axis Hybrid Fund - Series 24 : 2.03% / 0.84%, Axis Hybrid Fund - Series 25 : 2.15% / 0.96%, Axis Hybrid Fund - Series 26 : 2.13% / 0.94%, Axis Hybrid Fund - Series 27 : 2.09% /0.90%, Axis Hybrid Fund - Series 28 : 2.10% / 0.91%, Axis Hybrid Fund - Series 29 : 2.25% / 1.06%, Axis Hybrid Fund - Series 30 : 2.20% / 1.01%, Axis Hybrid Fund - Series 31* : 2.11% / 0.81%, Axis Hybrid Fund - Series 32* : 2.07% / 1.07%, Axis Hybrid Fund - Series 33* : 2.08% / 0.78%, Axis Liquid Fund : 0.12% / 0.04%, Axis Treasury Advantage Fund : 0.56% / 0.25%, Axis Banking Debt Fund : 0.35% / 0.20%, Axis Short Term Fund : 0.85% / 0.25%, Axis Dynamic Bond Fund* : 1.30% / 0.54%, Axis Constant Maturity 10 Year Fund : 0.65% / 0.20%, Axis Income Fund : 1.00% / 0.49%, Axis Gold ETF : 1.00% / -, Axis Gold Fund* :1.00% / 0.15%, Axis Fixed Income Opportunities Fund* : 1.25% / 0.20%, Axis Enhanced Arbitrage Fund : 1.00% / 0.25%, Axis Income Saver* : 2.09% / 1.21%, Axis Long Term Equity Fund*: 1.98% / 1.28%, Axis Focused 25 Fund* : 2.42% / 1.66%, Axis Equity Fund* : 2.09% / 1.38%, Axis Triple Advantage Fund* : 2.52% / 1.62%, Axis Midcap Fund* : 2.17% / 1.36%, Axis Equity Saver Fund* : 2.25% / 1.44%, Axis Small Cap Fund : 2.52% / 1.57%, Axis Children’s Gift Fund* : 2.53% / 2.62%, Axis Capital Protection Oriented Fund -Series 5: 2.45% / -, Axis Fixed Maturity Plan - Series 42 : 0.52% / 0.18%, Axis Fixed Maturity Plan - Series 43 : 0.41% / 0.05%, Axis Fixed Maturity Plan - Series 47 : 0.48% / 0.08%, Axis Fixed Maturity Plan - Series 48 : 0.45% / 0.05%, Axis Fixed Maturity Plan - Series 49 : 0.23% / 0.05%, Axis Fixed Maturity Plan - Series 52 : 0.23% / 0.05%, Axis Fixed Maturity Plan - Series 53 : 0.52% / 0.08%, Axis Fixed Maturity Plan - Series 61 : 0.49% / 0.05%, Axis Fixed Maturity Plan - Series 64 : 0.49% / 0.05%, Axis Fixed Maturity Plan - Series 67 : 0.66% / 0.02%, Axis Fixed Maturity Plan - Series 69 : 0.58% / 0.05%, Axis Fixed Maturity Plan - Series 74 : 0.23% / 0.10%
Service Tax on Management fees to the above mentioned schemes will be charged over and above Total Expense Ratio *In addition to the rates mentioned a proportionate charge in respect sales beyond T-15 cities subject to maximum of 30 bps on daily net assets has been charged in these schemes.

AXIS EQUITY FUND This product is suitable for investors who are seeking*l Capital appreciation over long terml Investment in a diversified portfolio predominantly consisting of equity and equity related instruments
AXIS FOCUSED 25 FUND This product is suitable for investors who are seeking*l Capital appreciation over long terml Investment in a concentrated portfolio of equity & equity related instruments of up to 25 companies
AXIS LONG TERM EQUITY FUND This product is suitable for investors who are seeking*l Capital appreciation & generating income over long terml Investment in a diversified portfolio predominantly consisting of equity and equity related instruments
AXIS MIDCAP FUND This product is suitable for investors who are seeking*l Capital appreciation over long terml Investment predominantly in equity and equity related instruments of mid size companies with focus on relatively larger companies within this category
AXIS TRIPLE ADVANTAGE FUND This product is suitable for investors who are seeking*l Capital appreciation & generating income over long term l Investment in a diversified portfolio of equity and equity related instruments, fixed income instruments & gold exchange traded funds
AXIS INCOME SAVER This product is suitable for investors who are seeking*l Capital appreciation while generating income over medium to long term l Investment in debt and money market instruments as well as equity and equity related instruments while managing risk through active asset allocation
AXIS GOLD ETF This product is suitable for investors who are seeking*l Capital Appreciation over medium to long terml Invests predominantly in gold in order to generate returns similar to the performance of gold, subject to tracking error
AXIS GOLD FUND This product is suitable for investors who are seeking*l Capital Appreciation over medium to long terml Invests predominantly in Axis Gold ETF in order to generate returns similar to the underlying fund, subject to tracking error
AXIS EQUITY SAVER FUND This product is suitable for investors who are seeking*l Capital Appreciation while generating income over medium to long terml Provide capiltal appreciation and income distribution to the investors by using equity and equity related instruments, arbitrage opportunities and investments in debt and money market instruments
AXIS CHILDREN’S GIFT FUND This product is suitable for investors who are seeking*l Capital appreciation & generating income over medium to long terml Investment in debt and money market instruments as well as equity and equity related instruments
AXIS CONSTANT MATURITY 10 YEAR FUND This product is suitable for investors who are seeking*l Credit risk free returns over medium to long terml Investment mainly in Government securities to generate returns similar to that of 10 year government bonds
AXIS DYNAMIC BOND FUND This product is suitable for investors who are seeking*l Optimal returns over medium to long terml To generate stable returns while maintaining liquidity through active management of a portfolio of debt and money market instruments
AXIS INCOME FUND This product is suitable for investors who are seeking*l Optimal returns over medium terml Investment in diversified portfolio of high quality debt and money market securities to generate optimal risk adjusted returns while maintaining liquidity
AXIS ENHANCED ARBITRAGE FUND This product is suitable for investors who are seeking*l Income over short to medium terml Investment in arbitrage opportunities in the cash & derivatives segment of the equity market
AXIS FIXED INCOME OPPORTUNITIES FUND This product is suitable for investors who are seeking*l Stable returns in the short to medium terml Investment in debt and money market instruments across the yield curve and credit spectrum
AXIS SHORT TERM FUND This product is suitable for investors who are seeking*l Regular income while maintaining liquidity over short to medium term l Investment in debt and money market instruments
AXIS BANKING DEBT FUND This product is suitable for investors who are seeking* l Regular income over short to medium terml Investment in debt and money market instruments issued by banks
AXIS TREASURY ADVANTAGE FUND This product is suitable for investors who are seeking*l Regular income over short terml Investment in debt and money market instruments
AXIS LIQUID FUND This product is suitable for investors who are seeking*l Regular income over short terml Investment in debt and money market instruments
PRODUCT LABELLING
24
*Investors should consult their financial advisers if in doubt about whether the product is suitable for them
Riskometer
Investors understand that their principal will be
at moderately high risk
LOW HIGH
Moderate ModeratelyHighM
oderate
ly
Low
HighLo
w
Riskometer
Investors understand that their principal will be
at moderate risk
LOW HIGH
Moderate ModeratelyHighM
oderate
ly
Low
HighLo
w
Riskometer
Investors understand that their principal will be
at moderately low risk
LOW HIGH
Moderate ModeratelyHighM
oderate
ly
Low
HighLo
w
Riskometer
Investors understand that their principal will be
at low risk
LOW HIGH
Moderate ModeratelyHighM
oderate
ly
Low
HighLo
w
Statutory Details & Disclaimers :Axis Mutual Fund has been established as a Trust under the Indian Trusts Act, 1882, sponsored by Axis Bank Ltd. (liability restricted to ` 1 Lakh). Trustee: Axis Mutual Fund Trustee Limited. Investment Manager: Axis Asset Management Company Limited (the AMC). Risk Factors: Axis Bank Limited is not liable or responsible for any loss or shortfall resulting from the operation of any of the mutual fund schemes launched by the AMC. Mutual Fund Investments are subject to market risks, read all scheme related documents carefully.


![Factsheet - Joinup · Belgium ABR Factsheet 2017 [page 6] The Crossroads Bank for Vehicles was created under the “Act of 19 May 2010 on the establishment of the Crossroads Bank](https://img.pdfslide.us/doc/110x75/5f1061967e708231d448d44d/factsheet-joinup-belgium-abr-factsheet-2017-page-6-the-crossroads-bank-for-vehicles.jpg)