Embed Size (px)
Citation preview

1 Assistant Professor, Department of Management Studies, Kingston Engineering College, Vellore.2 Associate Professor and Head, Department of Management Studies, Anna University Regional Centre,
Coimbatore.3 Assistant Professor, Department of Management Studies, Kongu Engineering College, Perundurai,
Erode.
FACTORS RELATED TO QUALITY OF WORK LIFE OFFACULTY MEMBERS: INDIAN PERSPECTIVE
K. G. Senthilkumar1, S. Chandrakumaramangalam2 andM. Umasankar3
Abstract: This is an empirical study conducted with 364 faculty members from 45 AnnaUniversity affiliated private engineering colleges situated in Coimbatore District of Tamilnadustate, India. This study investigated the factors that affect the overall perception of quality ofwork life (QWL) of the faculty members. A 64 item QWL questionnaire with socio-demographicdata was performed. After checking the reliability of scale and the test of appropriateness of thedata so collected, factor analysis was applied for data reduction. Then, correlation analysis wasperformed to know about the feature and extent of the inherent linear relationship existingbetween the factors and QWL. Results of factor analyses indicated that the QWL measure wasfound to be consisted of eight dimensions such as teaching learning process, learningopportunity, work life balance, compensation, leadership, professional relationship, employeesupport services and feedback on performance. The factor loadings in the eight factors rangefrom .486 to .777. It is obvious that all eight dimensions contributed highly to the QWL offaculty members. The result of regression analysis indicates that excluding the employee supportservices 74.2% of the variance is explained by all other independent variables.
Key words: Quality of Work Life, Work Life Balance, Compensation, Teaching LearningProcess, Private Engineering College.
INTRODUCTION
India, one of the rapidly growing economies among the BRIC nation, has nowbecome a key player in the global knowledge economy. Skill-based activities havemade important contribution to this growth. Such activities depend on the largepool of qualified manpower that is fed by its large higher education system. India’shigher education system is the third largest in the world after China and UnitedStates in terms of enrolment. India now possesses a highly developed highereducation system that offers facility of education and training in almost all aspectsof human creation and intellectual endeavors. Higher educational institutions play
I J A B E R, Vol. 13, No. 5, (2015): 2793-2815

2794 � K. G. Senthilkumar, S. Chandrakumaramangalam and M. Umasankar
vital role in nation’s progress (Tsai, 2012). It is now widely accepted that highereducation has been vital to India’s emergence in the global knowledge economy.Today, the Indian higher educational institutions, particularly technical institutionsare facing significant challenges in building both capacity and excellence. Onlythe Indian Institute of Technology and its related institutes acquire internationalrecognition. The mainstream technical institutions are recognized as lacking inquality. It is because of the rapid expansion of tier-2 and tier-3 technical institutionswithout adequate quality control. And also the frequent turnover of qualifiedfaculty members resulted in the poor quality. Faculty turnover has consequencesfor educational institutions. Being the core stakeholders in the higher educationalinstitutions they are the definers, gatekeepers of academic quality and excellence(Tsai, 2012). They love what they do, would like to repeat it again, but are seldomsatisfied with their institutions and working conditions (Boyer, Altbach, andWhitelaw, 1994). Colleges and universities have to pay the prices if they ignorethe quality of work life experienced by their faculty members (Johnsurd L. K, 2002).Hence, it is imperative for the higher educational institutions to have thoroughunderstanding of faculty members’ Quality of Work Life.
OBJECTIVES OF THE STUDY
The study purports to explore and gain a better understanding of the QWL offaculty members of the private engineering colleges in Coimbatore District ofTamilnadu, India. The findings of this study will help both management and facultymembers to understand QWL. Specifically, the objective is to investigate the factorsthat affect the overall perception of QWL of the faculty members.
LITERATURE REVIEW
Quality of Work Life
Many researches have been conducted on the subject of QWL since its inceptioninto the Human Research Management to till date. The concept of quality of workin 1960s focused on psychology of individuals and their perception of the industrialenvironment (Reyan 1995). The QWL in 1980s was a general term to include a setof conditions in different fields such as organization, work environment, andpartnership (Huzzard , 2003). This was parallel to concepts such as “humanizationof work”, “improvement of working conditions”, or “protection of workers”. Thesedifferences emphasized that the concept of quality of working life severedpsychology and approached a social approach; which is related to the social-technical systems theory which ensures autonomy in work, interdependence, andself-involvement. It improves culture of the organization that will lead to thedevelopment and growth of employees. Initially the focal issue was on the peoplepersonal lives.

Factors Related to Quality of Work Life of Faculty Members: Indian Perspective � 2795
It is learned from the literature review that the faculty work life encompassedprofessional priorities, institutional support, and the quality of life (Johnsrud, L.K. and Heck, R. H. 1998). These three dimensions had been shown to be significantto faculty work life. These three dimensions were reconstructed as professionalpriorities and rewards, administrative relations and support, and benefits andservices associated with the faculty member’s appointment (Johnsrud and Rosser,2002). Work Life of academic faculty can also be viewed with the work environmentdomains such as, role stress, job characteristics to directly and indirectly shapeacademic staff’s experiences, attitudes and bahaviour (Winter, Taylor and Sarros,2000). Apart from work environment, the organizational characteristic such asinstitutional type, resources and unit size were also be viewed as dimensions ofperceived quality of work life among faculty members and administrative staff(Johnsurd L. K, 2002).
The review of literature also revealed that in Malaysia the work life of facultymembers were studied with the help of ten dimensions such as support fromorganization, work-family conflict, relationship with peers, self competence, impacton job, meaningfulness of job, optimism on organizational change, autonomy,access to resources and time control. It is observed that all the dimensions on itsown were a salient predictor of Job Satisfaction but only three dimensions namelymeaningfulness of job, optimism on organizational change and autonomy weresignificantly related to Job Satisfaction (Saad, H.S, Samah, A.J.A, and Juhdi, N,2008). The seven dimensions, viz. growth and development, participation, physicalenvironment, supervision, pay and benefits, social relevance and workplaceintegration were shown to be significant to academic faculty work life in Malaysia(Daud N, 2010).
The eight dimensions model that was advocated by Walton viz., adequate andfair compensation, safe and healthy working conditions, chance of growth,constitutionalism in the work organization, the social relevance of work life, totallife space, social integration in the work organization and human progresscapabilities have positive and significant relation with job satisfaction amongfaculty members of University of Teharan (Mirkamalia, S.M and Thani, F.M, 2011).Further, it is confirmed that the same eight dimensions were significantly relatedto teachers’ efficiency among secondary school teachers in Kordestan province ofIran (Hamidi, F and Mohamadi, B, 2012).
Today QWL has become a dynamic multidimensional concept which includesconcepts such as job security, rewarding systems, career opportunities, work- lifebalance and employee participation. Now, this concept is mostly related to jobcontent and embodies the results of job content and working relations (Tamjidi,2007). Although considerable researches have been done in USA, Europe and Japan,there has been very little research that examines the quality of work life in Asia,with the exception of Japan. From the literature it is learned that few studies have

2796 � K. G. Senthilkumar, S. Chandrakumaramangalam and M. Umasankar
examined the quality of work life dimensions among faculty members. However,there is a dearth of research that examines the quality of work life within educationalinstitutions especially with regard to technical institutions in India and requiresmore inclusive research. These educational institutions, as key factors in social,economic and cultural development, play vital role in educating and developinghuman capital. Hence, the purpose of the present study is to fill this vacuumpresently existing in the areas of quality of work life research.
Dimensions of Faculty members’ Quality of Work Life
The review of literature on quality of work life, specifically among faculty members,suggests that quality of work life is a multifaceted paradigm, built upon a numberof interrelated factors that seek meticulous consideration to conceptualize andmeasure. Hence, a detailed review was made to identify the important dimensionsof quality of work life. After a careful analysis of the responses of the pilot surveyand also the views of academicians, to measure the quality of work life, eightdimensions were included in this study. These include compensation, employeesupport services, work life balance, teaching learning process, learning opportunity,leadership, feedback on performance, and professional relationship.
RESEARCH METHODOLOGY
Development of the Measuring Instruments
The above mentioned dimensions were derived from the QWL survey Report(Curtin University of Technology, 2006) of Western Australia and the study fromMalaysia (Saad, H.S, Samah, A.J.A, and Juhdi, N, 2008). These dimensions werebelieved to be appropriate and reliable in the context of Asia generally and Indiaspecifically since some of the dimensions were used separately by researchers inSingapore (Lau et al., 2001) and Malaysia (Rethinam, Maimunah, Musa andBahaman, 2004; Rethinam, G. S., I., Maimunah, 2008; Daud N 2010).
After developing a construct, the scale development process was undertaken.The questionnaire used in the survey consisted of two sections. The first sectionwas designed to get demographic information about respondents, namely: gender,age, marital status, number of children, education level, income level, positionand years of service. The last section, including 64 statements, was designed tomeasure the perception by faculty members on eight dimensions of QWL. These64 items were selected from initial pool of one hundred and nine items generatedat the beginning stage of the instrument. Respondents were asked to rate theirlevel of agreement on each statement from “1” as “strongly disagree” to “5” as“strongly agree”. To increase reliability and to assure the appropriateness of thedata collection instrument, the questionnaire was subject to a pilot test conductedwith 20 faculty members working in private engineering colleges in Coimbatore

Factors Related to Quality of Work Life of Faculty Members: Indian Perspective � 2797
District of Tamilnadu, India. Some of the statements were subject to a refinementafter pilot survey.
Population and Sample
The population for the study comprised the faculty members from 45 privateengineering colleges of Coimbatore District of Tamilnadu, India where about 5187fulltime faculty members are employed during the study period (Till May 2013).Thus, 5187 faculty members are the target population for this research study. Fromthis target population the researchers drew a sample of 683 full time facultymembers through simple random sampling method which represents roughly 13.2percent of the overall samples. Data were collected by distributing thequestionnaires and also through online survey. Finally 364 useable questionnaireswere obtained from among the sample respondents.
Statistical Tools of Data Analysis
At first, factor analysis was applied for data reduction. Then, correlation analysiswas performed to know about the feature and extent of the inherent linearrelationship existing between the factors and quality of work life. Before performingfactor analysis, testing of the reliability of the scale was done as it is very muchimportant as its shows the extent to which a scale produces consistent result ifmeasurements are made repeatedly.
Reliability and Validity Analysis
In this regard the Cronbach’s alpha is most widely used method. It may bementioned that its value varies from 0 to 1 but, satisfactory value is required to bemore than 0.6 for the scale to be reliable (Malhotra, 2002). If compared reliabilityvalue with the standard value alpha of 0.6 advocated by Cronbach (Cronbach,1951), it was found that the scales used were highly reliable for factor analysis.
After checking the reliability of scale, test of appropriateness of the data socollected was done. Kaiser-Meyer-Olkin (KMO) measure of sampling adequacy isuseful method to show the appropriateness of data for factor analysis. The KMOstatistics varies between 0 and 1. It is relevant that the values greater than 0.5 isacceptable. In this study, the value of KMO for overall matrix is 0.890, there byindicating that the sample taken to process the factor analysis is statisticallysignificant.
Profile of the Respondents
The demographic profile of the respondents is depicted in Table 1. From the table,the age range of 36-45 (nearly 35.4%) was the dominant age of the faculty membersin the study. Male and female respondents were distributed almost equally with

2798 � K. G. Senthilkumar, S. Chandrakumaramangalam and M. Umasankar
males being 3.3 percent more than females. The table also shows that about 78.6percent of the faculty members having master degree as their academic qualificationand only 21.4 percent have completed doctorate.
Factor Analysis
After examining the reliability of the scale and testing appropriateness of data asabove, the 64 items QWL measure were subjected to principal component factoranalysis with varimax rotation to determine if there were any underlyingdimensions within the data on the attitude to the Quality of Work Life statements.The results of the analysis were depicted in the tables from the table 2 to table 6.From the output, eight factor solutions emerged with Eigen values exceeding 1.Results of factor analyses indicated that the QWL measure was found to be
Table 1Socio-demographic Characteristics of the Respondents
Respondents profile Total number of Percentage ofrespondents Respondents
GenderMale 188 51.64Female 176 48.35Age26- 35 years 94 25.636- 45 years 128 35.446-55 years 87 23.9Above 55 years 55 15.1Marital statusMarried 213 58.5Unmarried 151 41.5QualificationMasters Degree 286 78.6Masters Degree with Ph.D 78 21.4DesignationAssistant Professor 127 34.9Assistant Professor (SG) 99 27.2Associate Professor 82 22.5Professor 56 15.4Teaching hours/weekAssistant Professor 21 Average hours/Assistant Professor (SG) 18 week 11-12Associate Professor 12-16Professor 8-10

Factors Related to Quality of Work Life of Faculty Members: Indian Perspective � 2799
Table 2KMO and Bartlett’s Test
Kaiser-Meyer-Olkin Measure of Sampling Adequacy. .890Bartlett’s Test of Sphericity Approx. Chi-Square 18768.892
Df 3655Sig. .000
Table 3Total Variance Explained
Component Initial Eigenvalues Extraction Sums of Squared Rotation Sums ofLoadings Squared Loadings
Total % of Cumula- Total % of Cumula- Total % of Cumula-Variance tive % Variance tive % Variance tive %
1 20.989 32.795 32.795 20.989 32.795 32.795 8.291 12.954 12.9542 4.481 7.002 39.797 4.481 7.002 39.797 6.341 9.907 22.8613 3.326 5.196 44.993 3.326 5.196 44.993 6.118 9.559 32.4214 2.352 3.675 48.669 2.352 3.675 48.669 4.871 7.611 40.0325 2.086 3.259 51.928 2.086 3.259 51.928 4.801 7.502 47.5336 1.657 2.588 54.516 1.657 2.588 54.516 3.424 5.351 52.8847 1.446 2.260 56.776 1.446 2.260 56.776 2.193 3.427 56.3118 1.172 1.831 58.607 1.172 1.831 58.607 1.470 2.296 58.6079 1.064 1.663 60.27010 .896 1.400 61.67011 .843 1.318 62.98712 .819 1.279 64.26713 .804 1.255 65.52214 .767 1.198 66.72015 .756 1.182 67.90216 .740 1.156 69.05817 .711 1.111 70.16918 .692 1.081 71.24919 .680 1.063 72.31220 .644 1.006 73.31821 .627 .980 74.29822 .624 .976 75.27423 .604 .944 76.21824 .598 .934 77.15225 .590 .922 78.07426 .579 .905 78.979
contd. table 3

2800 � K. G. Senthilkumar, S. Chandrakumaramangalam and M. Umasankar
27 .563 .880 79.85828 .538 .841 80.70029 .520 .813 81.51230 .515 .805 82.31831 .490 .766 83.08432 .486 .759 83.84333 .472 .737 84.58034 .466 .728 85.30835 .447 .698 86.00636 .436 .682 86.68837 .428 .669 87.35838 .422 .659 88.01739 .411 .642 88.65840 .410 .640 89.29941 .395 .618 89.91742 .387 .605 90.52143 .372 .581 91.10244 .366 .572 91.67545 .354 .554 92.22946 .346 .540 92.76947 .338 .529 93.29748 .326 .510 93.80749 .323 .505 94.31350 .314 .491 94.80351 .301 .470 95.27352 .300 .468 95.74153 .279 .437 96.17854 .267 .418 96.59655 .264 .412 97.00856 .260 .407 97.41557 .255 .398 97.81258 .237 .370 98.18359 .229 .358 98.54160 .204 .319 98.86061 .197 .308 99.16862 .185 .289 99.45763 .183 .286 99.74364 .164 .257 100.000
Extraction Method: Principal Component Analysis.
Component Initial Eigenvalues Extraction Sums of Squared Rotation Sums ofLoadings Squared Loadings
Total % of Cumula- Total % of Cumula- Total % of Cumula-Variance tive % Variance tive % Variance tive %
Factors Related to Quality of Work Life of Faculty Members: Indian Perspective � 2801
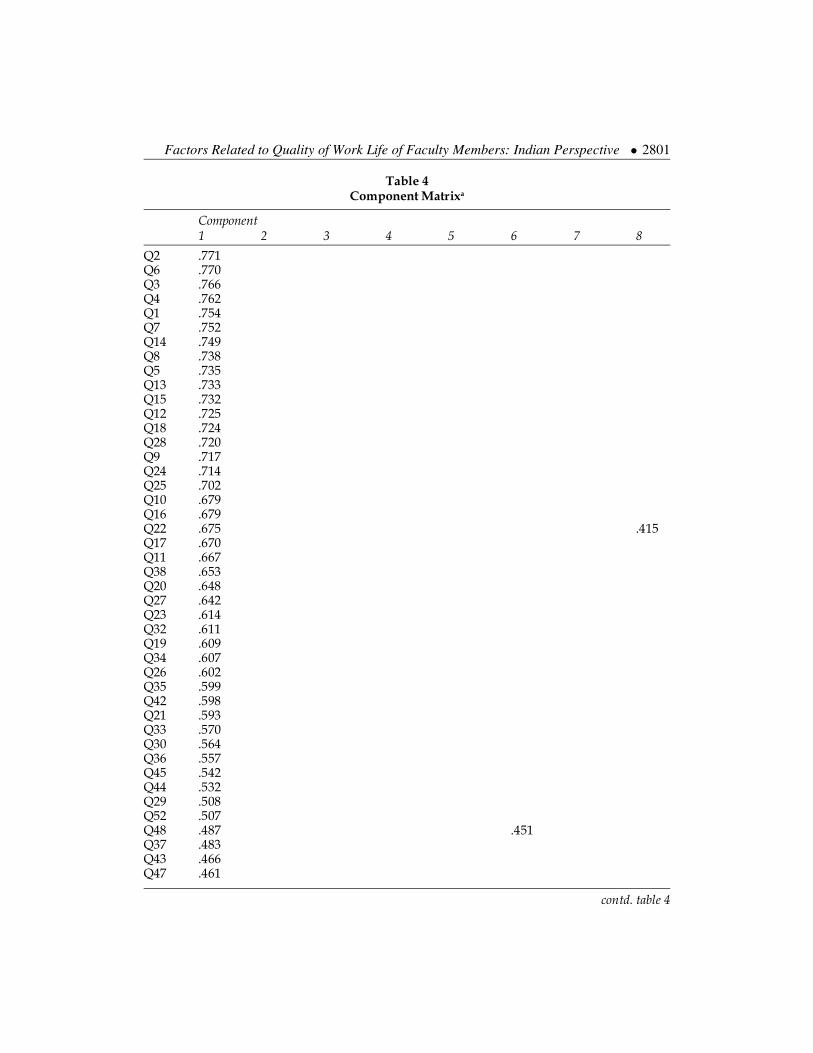
Table 4Component Matrixa
Component1 2 3 4 5 6 7 8
Q2 .771Q6 .770Q3 .766Q4 .762Q1 .754Q7 .752Q14 .749Q8 .738Q5 .735Q13 .733Q15 .732Q12 .725Q18 .724Q28 .720Q9 .717Q24 .714Q25 .702Q10 .679Q16 .679Q22 .675 .415Q17 .670Q11 .667Q38 .653Q20 .648Q27 .642Q23 .614Q32 .611Q19 .609Q34 .607Q26 .602Q35 .599Q42 .598Q21 .593Q33 .570Q30 .564Q36 .557Q45 .542Q44 .532Q29 .508Q52 .507Q48 .487 .451Q37 .483Q43 .466Q47 .461
contd. table 4

2802 � K. G. Senthilkumar, S. Chandrakumaramangalam and M. Umasankar
Q53 .434Q58 .433Q54 .411Q55Q62 .578 .411Q39 .536Q31 .532 .424Q61 .455 .520Q41 .469 .426Q64 -.468Q46 .412 .459Q60 -.449Q57 -.414Q63 .468 .556Q40Q51 .445 .488Q49 -.427 .442Q50 .459Q59 .423 .423Q56 .572
Extraction Method: Principal Component Analysis.a. 8 components extracted.
Table 5Rotated Component Matrixa
Component
1 2 3 4 5 6 7 8
Q2 .763Q6 .729Q3 .713Q4 .688Q1 .675Q7 .669Q14 .659Q8 .658Q5 .593Q13 .592Q15 .590Q12 .552Q18 .497Q28 .732Q9 .711Q24 .707Q25 .701Q10 .694
Component1 2 3 4 5 6 7 8
contd. table 5

Factors Related to Quality of Work Life of Faculty Members: Indian Perspective � 2803
Q16 .672Q22 .635Q17 .626Q11 .467 .512Q38 .666Q20 .632Q27 .617Q23 .613Q32 .607Q19 .595Q34 .564Q26 .555Q35 .546Q42 .544Q21 .530Q33 .500Q30 .661Q36 .642Q45 .623Q44 .622Q29 .601Q52 .583Q48 .534Q37 .531Q43 .503Q47 .777Q53 .772Q58 .767Q54 .729Q55 .728Q62 .684Q39 .662Q31 .636Q61 .762Q41 .665Q64 .661Q46 .613Q60 .609Q57 .533Q63 -.707Q40 -.666Q51 .493 .506Q49 .472 .486Q50 .708Q59 .509Q56 .405
Extraction Method: Principal Component Analysis.Rotation Method: Varimax with Kaiser Normalization.a. Rotation converged in 8 iterations.
Component
1 2 3 4 5 6 7 8

2804 � K. G. Senthilkumar, S. Chandrakumaramangalam and M. Umasankar
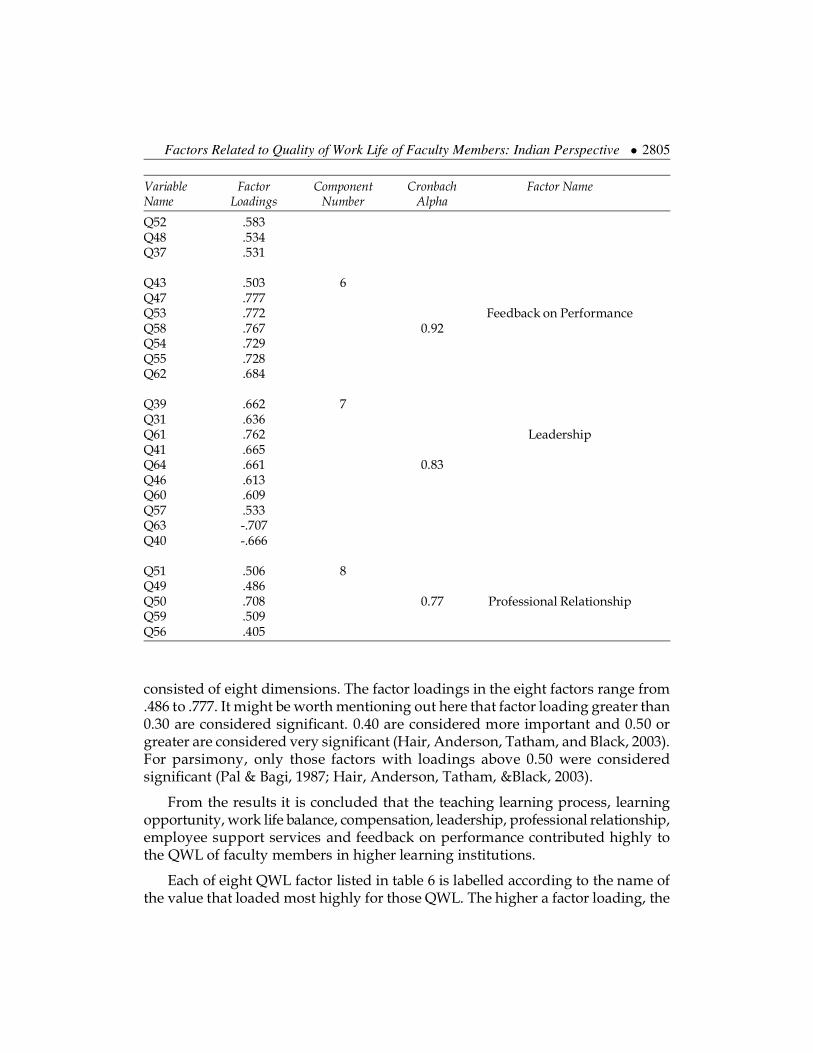
Table 6
Variable Factor Component Cronbach Factor NameName Loadings Number Alpha
Q2 .763 1 Teaching and Learning ProcessQ6 .729Q3 .713Q4 .688Q1 .675 0.89Q7 .669Q14 .659Q8 .658Q5 .593
Q13 .592 2Q15 .590Q12 .552Q18 .497 0.91 Learning OpportunitiesQ28 .732Q9 .711Q24 .707
Q25 .701 3Q10 .694Q16 .672 0.86 Work life BalanceQ22 .635Q17 .626Q11 .512Q38 .666Q20 .632Q27 .617
Q23 .613 5Q32 .607Q19 .595Q34 .564 0.81 Employee Support ServiceQ26 .555Q35 .546Q42 .544
Q21 .530 4Q33 .500Q30 .661Q36 .642Q45 .623 CompensationQ44 .622 0.87Q29 .601
contd. table 6
Factors Related to Quality of Work Life of Faculty Members: Indian Perspective � 2805
Q52 .583Q48 .534Q37 .531
Q43 .503 6Q47 .777Q53 .772 Feedback on PerformanceQ58 .767 0.92Q54 .729Q55 .728Q62 .684
Q39 .662 7Q31 .636Q61 .762 LeadershipQ41 .665Q64 .661 0.83Q46 .613Q60 .609Q57 .533Q63 -.707Q40 -.666
Q51 .506 8Q49 .486Q50 .708 0.77 Professional RelationshipQ59 .509Q56 .405
Variable Factor Component Cronbach Factor NameName Loadings Number Alpha
consisted of eight dimensions. The factor loadings in the eight factors range from.486 to .777. It might be worth mentioning out here that factor loading greater than0.30 are considered significant. 0.40 are considered more important and 0.50 orgreater are considered very significant (Hair, Anderson, Tatham, and Black, 2003).For parsimony, only those factors with loadings above 0.50 were consideredsignificant (Pal & Bagi, 1987; Hair, Anderson, Tatham, &Black, 2003).
From the results it is concluded that the teaching learning process, learningopportunity, work life balance, compensation, leadership, professional relationship,employee support services and feedback on performance contributed highly tothe QWL of faculty members in higher learning institutions.
Each of eight QWL factor listed in table 6 is labelled according to the name ofthe value that loaded most highly for those QWL. The higher a factor loading, the

2806 � K. G. Senthilkumar, S. Chandrakumaramangalam and M. Umasankar
more would its test reflect or measure as QWL (Pallant, 2005).The QWL’s variablegetting highest loading becomes the title of each factor of QWL.
Factor-1: Teaching Learning Process - This factor is represented by nine variablesof QWL with factor loadings ranging from 0.763 to 0.593. The highest factor loadingfor a variable ‘good classroom environment and lecture hall facilities’ (0.763) andthe lowest factor loading for ‘adequate time for thorough Preparation’ (0.593).
Factor-2: Learning Opportunities – Seven variables of QWL factor loadingsranging from 0.732 to 0.552. The variable ‘Opportunities for Training andDevelopment are available’ has highest factor loading (0.732) and the variable‘Physical facilities for research is available’ has the lowest factor loading (0.552).
Factor-3: Work life Balance - This factor comprises nine variables like ‘It isvery difficult to balance work and family’ which has highest factor loading (0.702)and ‘institution provides support in managing work and family commitments’which has the lowest factor loading (0.512).
Factor-4: Compensation – Ten variables of QWL factor loadings ranging from0.661 to 0.500. The variable ‘gives fair salary in comparison with cost of living’ hashighest factor loading (0.661) and the variable ‘Yearly increment of salary is fairlygiven’ has the lowest factor loading (0.500).
Factor-5: Employee Support Service - This factor is represented by sevenvariables of QWL with factor loadings ranging from 0.613 to 0.544. The highest factorloading for a variable ‘Transportation facility is provided in the institution’ (0.613)and the lowest factor loading for ‘institution provides childcare facilities’ (0.544).
Factor-6: Feedback on Performance – Seven variables of QWL ranging from0.777 to 0.503. Among the seven ‘performance feedback occurs in a timely fashion’is the highest factor loading variable and ‘management invites feedback from thestudents’ is the lowest factor loading variable.
Factor-7: Leadership - This factor is represented by ten variables of QWL withfactor loadings ranging from 0.762 to 0.533. The highest factor loading for a variable‘HOD/Director treats people equitably’ and the lowest factor loading for ‘HOD/Director promotes a positive team environment’.
Factor-8: Professional Relationship - This factor is represented by five variablesof QWL with factor loadings ranging from 0.708 to 0.489. The highest factor loadingfor a variable ‘have good relationship with the other faculty members in thedepartment’ (0.708) and the lowest factor loading for ‘have a good relationshipwith superior’ (0.489).
Regression Analysis
In order to explain more on the relationship among teaching learning process,work life balance, learning opportunities, employee support service, compensation,

Factors Related to Quality of Work Life of Faculty Members: Indian Perspective � 2807
feedback on performance, leadership and professional relationship with QWL, aregression analysis was run on the data. The results of the analysis were depictedin the tables from table 7 to table 10. The standardized coefficients for teachinglearning process is.074, work life balance is .312, learning opportunities is .126,employee support service is .048, compensation is.326, feedback on performanceis .135, leadership is .127 and professional relationship is .178. The beta coefficientsindicates the relative importance of each individual variables, thus it shows thatexcept employee support services all other variables explain more of quality ofwork life. Table 10 shows the details.
Table 7Model Summary
Model R R Square Adjusted R Std. Error of theSquare Estimate
1 .863a .744 .742 3.98000
a. Predictors: (Constant), Teaching and Learning Process, Worklife Balance, LearningOpportunities, Employee Support Service, Compensation, Feedback on Performance,Leadership, Professional Relationship
Table 8ANOVAa
Model Sum of Squares Df Mean Square F Sig.
Regression 49586.345 10 4958.634 173.413 .000b
Residual 28394.189 993 28.594Total 77980.534 1003
a. Dependent Variable: QWLb. Predictors: (Constant), Teaching and Learning Process, Worklife Balance, LearningOpportunities, Employee Support Service, Compensation, Feedback on Performance,Leadership, Professional Relationship.
Table 9
Model Unstandardized StandardizedCoefficients Coefficients t Sig.
B Std. Error Beta
(Constant) 4.449 1.467 3.032 .002Teaching and Learning Process .794 .293 .074 2.713 .007Worklife Balance 2.524 .282 .312 8.954 .000Learning Opportunities 1.014 .168 .126 6.050 .000Employee Support Service .411 .221 .048 1.857 .064Compensation 3.619 .348 .326 10.390 .000Feedback on Performance 1.258 .252 .135 4.994 .000Leadership 1.067 .300 .127 3.561 .000Professional Relationship 1.570 .312 .178 5.037 .000

2808 � K. G. Senthilkumar, S. Chandrakumaramangalam and M. Umasankar
Table 10Correlation Analysis
Independent Variables QWL
Teaching and Learning Process .390**
Work life Balance .697**
Learning Opportunities .407**
Employee Support Service .343Compensation .623**
Feedback on Performance .543**
Leadership .635**
Professional Relationship .683**
Model summary (Table 7) shows how much these variables explain quality ofwork life. The result indicates that 74.2% of the variance is explained by all theindependent variables. Hence it is possible to say that 74.2% of the combination ofteaching learning process, work life balance, learning opportunities, employeesupport service, compensation, feedback on performance, leadership andprofessional relationship is able to explain quality of work life in the sample. Fromthe correlation analysis it is confirmed that the employee support service is notsignificant at 0.01 level. Hence, it is concluded that except employee support servicesall other factors explain quality of work life of academicians.
DISCUSSION
Teaching Learning Process
The present study divulged that the work environment especially, the teachinglearning process became an important dimension of quality of work life. TeachingLearning Process of faculty members refers to the aspects such as class roomtimetabling, class room environment, lecture hall facilities, contact time withstudents, time availability for preparation, support available for implementingnew teaching methods etc. in the working environment. The work environmentplays a major role in determining quality of work life of employees. It is capableof fulfilling employees’ personal needs according to their expectations andgenerally leads to an excellent QWL (Shoeb Ahmad, 2013). It is revealed that theelements that are significant in determining an individual’s quality of work lifeinclude the task, and the physical work environment along with other factors(Che Rose, Beh, Uli and Idris, 2006). In teaching, the adequate condition of workis one of the important factors that can affect a positive or negative influence onlanguage teacher education25). Accordingly, the work environment especially,the teaching learning process became an important dimension of quality of worklife.

Factors Related to Quality of Work Life of Faculty Members: Indian Perspective � 2809
Learning Opportunities
From the analysis it is revealed that learning opportunities is one of the importantfactors that determine the QWL of faculty members. The Growth in skills andknowledge is an important aspect of competency development that enhances QWL.Among several critical dimensions of QWL in institutions of higher learning thegrowth and development of the academic staff is also important dimension (DaudN 2010). The growth and development of the academic staff in institutions of higherlearning is based on the learning opportunities available to them. Learningopportunities and skill discretion have also proven to have a positive effect on jobsatisfaction and reduced job stress that will lead to better QWL(Lokanadha Reddy.M and Mohan Reddy. P 2010). QWL can be explained by several factors in that thepossibility of learning and using new skills is very important (Mirsepasi, 2006).The opportunity to develop and the use of skills are associated with learningmechanisms. Consequently, the learning opportunities became one of the importantfacets of QWL.
Work Life Balance
The results of the analysis disclosed that the work life balance of faculty membersplays a vital role in determining QWL. Work Life Balance can be defined as theextent to which an individual is equally engaged in – and equally satisfied with– his or her work role and family role (Greenhaus, Collins and Shaw, 2003). Thus,employees who experience high work-life balance are those who exhibit similarinvestment of time and commitment, to work and non-work domains (Virick,Lily & Casper, 2007). The integration of work and the rest of life have emergedas a major social concern (Jacobs and Gerson, 2004). This is true in India also asthe typical Indian family structure defined by the male breadwinner has nowbeen largely superseded by dual-earner couples. Review of literature hasindicated that academic workplaces seldom acknowledge the multidimensionallives of faculty members constitute an obstructive and hostile environmentespecially for women faculty who undertake several roles and even they haveforgo or delay childbirth to avoid negative career consequences (Mason andGoulden, 2004). The inability of staff members to balance the equally challengingdemands of their work and personal life has contributed to the escalating stressand conflict in today’s workforce (Edward, J.R.,& Rothband, N.P 2000). This inturn escorts to momentous increase in stress related to health problem, which isgoing to have a consequence financially on both the employer as well as thegovernment (Frone, M., Russell, M., & Cooper, 1997; Johnson, K., Duxbury, L., &Higgins 1997). Work-life imbalance decreases job satisfaction and also QOL(Makabe, S., Takagai, J., Asanuma, Y., Ohtomo K, and Kimura . Y, 2015). Hence,the balance between personal life and work life is a major component of qualityof work life.

2810 � K. G. Senthilkumar, S. Chandrakumaramangalam and M. Umasankar
Compensation
The present study emphasized that the adequate and fair compensation is a vitalfactor in determining QWL. The basic driving force behind work is to earn a living.It is therefore apparent that QWL is affected by the extent to which this goal isachieved. Both the factors of adequate and fair compensation are thereforeconsidered important determinants of QWL (Walton, 1973). Study on QWL ofclothing workers confirmed that compensation does indeed play a critical role indetermining QWL (Reid, 1992). It is divulged that one of the most important factorsthat made hospital employees work a positive experience is monetarycompensation (Saraji Nasl and H.Dargahi., 2006). It is also revealed that theeconomic factor is being one of four important factors of QWL (Zare, Hamid,Haghgooyan, Zolfa and Asl, Zahra Karimi, 2012). It is explored that one of thepredictor variables of QWL of the faculty members is adequate and faircompensation (Tabassum, A., Rahman, T., & Jahan, K., 2012). As the nature of theinfluence is positive an increase in each of these variables can lead to an increasein QWL. The lower compensation is the one of the important reasons for leavingthe jobs among faculty members (Akhter, I., Muniruddin, G., & Sogra, K. J., 2008).In today’s globalised business scenario equal pay for equal work is mandated andpay that is linked to responsibility, skill, performance and individualaccomplishment are viewed with great importance. Thus it can be said that theadequate and fair compensation can significantly influence a faculty membersQWL.
Employee Support Services
The level of support provided by the organization is an important indication ofthe work-life quality. Organizational Support is defined as the extent to whichemployees perceive that the organization values their contributions and cares abouttheir wellbeing. It is an important factor in influencing employee commitmentand job satisfaction (Dixon, M. and Sagas, M. 2007). It is also having positive impacton organizational commitment, employee performance as well as job satisfaction(Rhoades, L., & Eisenberger, R., 2002). But, the findings of this study were divergentwith their views. The result of regression analysis revealed that the employeesupport services were not significant in explaining QWL among faculty members.
Feedback on Performance
It is learned from the analysis that the feedback on performance is an importantfacet of faculty members’ QWL. Feedback refers to the necessity of organizationsto speedily provide employees with information and accurate knowledge regardingtheir performance and its wider organizational impact (Orpen, C., 1981). TheConstructive feedback helps employees perform their work more effectively andalso improves communication between supervisors and employees. In general

Factors Related to Quality of Work Life of Faculty Members: Indian Perspective � 2811
employees want to improve their performance on the job, for which they want toreceive constructive suggestions regarding areas they need to work on and to becommended on their job well done. Communicating with employees in a positivemanner when they need to improve their performance will help prevent workproblems. Feedback is one of the important elements in the work environmentthat is able to fulfill employees’ personal needs and also a critical factor in reducingabsenteeism, and employee turnover (Hackman, J.R., and Oldham, G. R., 1980).
Leadership
It is highlighted from the analysis that the strong and effective leadership is apredictor of quality of work life of faculty members. In a quality work place theleadership ensures and facilitates trust and commitment, cooperation andteamwork, problem solving and effective dispute resolution. Leadership, especiallythe treatment of subordinates by supervisors, is a significant predictor of QWL(Davis, L.E., Levine, M.F. and Taylor, J.C., 1984). It is one of the dimensions whichexplain the work life of academic staff in higher learning institutions (Daud, N.2010). Supervision also directly and indirectly shapes academicians’ experiences,attitudes and behaviour (Winter, R., Taylor, T. and J. Sarros., 2000). By usingappropriate leadership styles, managers can affect employee job satisfaction,commitment and productivity. It is the ability of a leader to influence subordinatesto perform at their highest capability. Leaders who effectively communicate areable to make individuals feel like they belong and are accepted and abandon anyfears of rejection. Thus, it is apparent that supporting, developing, recognizing,rewarding and conflict managing supervisor behaviour is conducive to goodquality working relationships.
Professional Relationship
It is divulged from the analysis that the Professional Relationship in the workenvironment plays a crucial role in determining QWL of faculty members.Professional Relationship refers to all aspects involving common work dynamics,both formal and informal relationship with colleagues or with superiors. Animportant factor that contributes to improvement in QWL is to maintain the grouprelationships. The interactions that take place among the members of a group arereferred to as group dynamics. To improve QWL, the management shouldconcentrate on the dynamics of intra- and inter-group relationships to minimizethe unfavourable effects (Shoeb Ahmad, 2013). The relationship aspects in healthcare have a remarkable prominence of the perceived quality of work life, especially,relationship with colleagues as one of the five most important areas (Argentero,P., Miglioretti, M. and Angilletta, C., 2007). It is also asserted that job characteristics,role states, group and organization characteristics and leader relations are generallyconsidered to be antecedents of high quality of work life (Murrells, T., Clinton M.

2812 � K. G. Senthilkumar, S. Chandrakumaramangalam and M. Umasankar
and Robinson, S., 2005). It is affirmed that the most important determinants of QWLare interesting job, good relationships with managers and colleagues, high income,work independence and clearly defined career advancement opportunities (Brock-Utne, 2000). It is also proved that quality of relationships is a critical component ofquality of work life (Saad, H.S, Samah, A.J.A, and Juhdi, N 2008). Thus, professionalrelationship plays an important role in determining quality of work life.
CONCLUSION
The main aim of this research is to investigate the factors that affect the overallperception of QWL of the faculty members. Results of factor analysis showed thatall the eight factors of QWL contributed highly to the QWL of faculty members.Results of regression analysis divulged that excluding employee support servicesall other factors explain more of QWL. Accordingly, it can be concluded that exceptemployee support services all other dimensions elucidate QWL of faculty members.Considering the importance of every QWL dimensions it is recommended thatthe relation and effect of each dimensions with other organizational aspects beevaluated and analyzed.
ReferencesTsai, M.C.H. (2012), An empirical study of the Conceptualization of Overall Organizational
Justices and its Relationship with Psychological Empowerment and Turnover intention inHigher Education (Doctoral dissertation, University of Washington).
Boyer, E. L., Altbach, P. G., and Whitelaw, M. (1994), The Academic Profession: An InternationalPerspective. Princeton, NJ: Carnegie Foundation for the Advancement of Teaching.
Johnsrud, L.K. (2002), Measuring the quality of faculty and administrative work life: Implicationsfor College and University Campuses. Research in Higher Education 43(3): 379–395.
Reyan GM (1995), Theoretical basic for the QWL concept. University of Siena: quality (espritproject 8162) 9 working paper).
Huzzard J. (2003), The Convergence of the Quality of Working Life and Competitiveness: ACurrent Swedish Literature Review, National Institute for Working Life, Stockholm.Bloom,(1956). “Bloom Taxonomy”. http://www.officeport.com/edu/blooms.htm
Johnsrud, L. K., and Heck, R. H. (1998), Faculty worklife: Establishing benchmarks across groups.Research in Higher Education 39(5): 539–555.
Johnsrud, L.K., and Rosser, V.J. (2002), “Faculty members’ morale and their intentions to leave:A Multilevel explanation”. Journal of Higher Education, 73(4).
Winter, R., Taylor, T. and J. Sarros. (2000), “Trouble at mill: quality of academic work life issueswithin a comprehensive Australian university,” Studies in Higher Education, 25, 3, pp.279-294.
Saad, H.S, Samah, A.J.A, and Juhdi, N (2008), “Employees’ Perception on Quality Work Lifeand Job Satisfaction in a Private Higher Learning Institution”, International Review of BusinessResearch Papers, Vol. 4, No. 3 Pp.23-34.

Factors Related to Quality of Work Life of Faculty Members: Indian Perspective � 2813
Daud, N. (2010), “Quality of Work Life and Organizational Commitment Amongst AcademicStaff: Empirical Evidence from Malaysia”. International Conference on Education andManagement Technology (ICEMT 2010).
Seyed Mohammad Mirkamalia, Fatemeh Narenji Thani (2011), “A Study on the Quality ofWork Life (QWL) among faculty members of University of Tehran(UT) and Sharif universityof Technology (SUT)”. Procedia - Social and Behavioural Sciences, 29, 179 – 187.
Hamidi, F and Mohamadi, B (2012), “Teachers’ quality of work life in secondary schools”.International Journal of Vocational and Technical Education, Vol. 4(1), pp. 1-5, January 2012Available online at http://www.academicjournals.org/IJVTE DOI: 10.5897/IJVTE11.018
Tamjidi A. (2007), “Evaluate the Quality of Working Life and Relationship ManagersPerformance Roodsar City State Schools”. MA thesis, Tehran: Allameh TABAEI Tba. Schoolof Psychology and Educational Sciences, p. 28.
Curtin University of Technology, “Quality of Working Life (QWL) Survey Report 2006.” Curtin,Perth.
Lau, T., Wong, Y.H., Chan, K.F., & Law, M. (2001), “Information technology and the workenvironment- does it change the way people interact at work”. Human Systems Management,20(3), 267-280.
Rethinam, G. S., I., Maimunah, A.H., Musa, and A.S., Bahaman, (2004), “Working Conditionsand Predictors of Quality of Work Life: A Psychosocial Perspective of Malaysian InformationSystem Personnel”, In: Proceedings of the 3rd Asian Conference of the Academy of HRD, Nov.20-23, Seoul, Korea, pp. 98-105.
Rethinam, G. S., I., Maimunah, (2008), “Constructs of Quality of Work Life: A Perspective ofInformation and Technology Professionals”. European Journal of Social Sciences, 7(1), 58-70.
Malhotra, N.K. (2002), Marketing research: an applied orientation (3rd ed.). New Delhi : PearsonEducation Asia.
Cronbach, L.J., (1951), Coefficient alpha and the internal structure of tests. Psychometrika, 6, (3),297-334.
Hair, J.F., Anderson, R.E., Tatham, R.L., & Black, W.C. (2003), Multivariate Data Analysis. Delhi:Pearson Education.
Pal,Y. and Bagai, O.P. (1987), A Common Factor Better Reliability Approach to Determine the Numberof Interpretable Factor. Paper presented at the IX Annual Conference of the Indian Societyfor Probability and Statistics held at Delhi, University of Delhi, India.
Pallant, J. (2005), SPSS survival manual. Sydney: Allen & Unwin.
Shoeb Ahmad (2013), “Paradigms of Quality of Work Life”. Journal of Human Values, 19: 73.
Che Rose, R; Beh L.S, Uli, J, Idris K. (2006), “An Analysis of Quality of Work Life (QWL) andCareer- Related Variables”. American Journal of Applied Sciences, 3 (12): 2151-2159.
Johnstone, R. (2004), Language teacher education. In A. Davies & C. Elder, (Ed), The handbook ofapplied linguistics (pp.649-671). Oxford:Blackwell.
Lokanadha Reddy. M and Mohan Reddy. P (2010), “Quality of work life of employees: emergingdimensions”. Asian Journal of Management Research, 827-839.
Mirsepasi, Naser (2006), “The mutual impact of productivity and QWL”. Economics andManagement Journal. 17.

2814 � K. G. Senthilkumar, S. Chandrakumaramangalam and M. Umasankar
Greenhaus, J. H., Collins, K. M., & Shaw, J. D. (2003), “The relation between work-family balanceand quality of life”. Journal of Vocational Behavior, 63, 510-531.
Virick, M, Lily, JD & Casper, WJ (2007), “Doing more with less: An analysis of work life balanceamong layoff survivors”, Career Development International, vol. 12, no. 5, pp. 463-80.
Jacobs, J. A., & Gerson, K. (2004), The time divide: Work, gender, and inequality. Cambridge, MA:Harvard University Press.
Mason, M. A., & Goulden, M. (2004), “Marriage and baby blues: Redefining gender equity inthe academy”. Annals of the American Academy of Political and Social Science, 596(1), 86-103.doi: 10.1177/0002716204268744.
Edward, J.R., & Rothband, N.P (2000), “Mechanism linking work and family: clarifying therelationship between work and family construct”. Academy of Management Journal. 25, pp.178-199.
Frone, M., Russell, M., & Cooper, (1997), “Relation of work-family conflict to health outcomes:a four year longitudinal study of employed parents”. Journal of Occupational andOrganizational Psychology. 670, pp. 325-335.
Johnson, K., Duxbury, L., & Higgins, C. (1997), “Making work and lifestyle initiatives work:Beyond best practices”. Ottawa: Industry Canada.
Makabe, S., Takagai, J., Asanuma, Y., Ohtomo K, and Kimura . Y, (2015), “Impact of work-lifeimbalance on job satisfaction and quality of life among hospital nurses in Japan”. IndustrialHealth, 53, 152–159.
Walton, R.E. (1973), “Quality of working life: what is it”? Sloan Management Review, 11-21.
Reid, C.A. (1992), “An evaluation of the quality of work life of clothing workers in the Durbanarea”. Unpublished Masters Thesis. University of Natal, Durban.
Saraji Nasl and H. Dargahi. (2006), “Study of Quality of Work Life (QWL)”. Iranian J PublicHealth, vol. 35. No. 4, pp. 8-14.
Zare, Hamid, Haghgooyan, Zolfa and Asl, Zahra Karimi (2012), “Determining and Prioritizingthe Criteria and Scales of Quality of Work Life (QWF) by AHP Method”. European Journalof Social Sciences, 27(3), 346-359.
Tabassum, A., Rahman, T., & Jahan, K. (2012), “An Evaluation of the Quality of Work Life: AStudy of the Faculty Members of Private Universities in Bangladesh”. ABAC Journal, Vol.32 No. 3, pp. 36-57.
Akhter, I., Muniruddin, G., & Sogra, K. J. (2008), “A Trend Analysis of Faculty Turnover at theprivate universities in Bangladesh: A Business School Perspective”. Journal of BusinessStudies, 4(1).
Dixon, M. and Sagas, M. (2007), “The relationship between organizational support, work familyconflict, and the job-life satisfaction of university coaches”. Research Quarterly for Exerciseand Sport, 78, 236-247.
Rhoades, L., & Eisenberger, R. (2002), “Perceived organizational support: A review of theliterature”. Journal of Applied Psychology, 87, 698–714.
Orpen, C. (1981), The conceptualization of quality of working life. Perspectives in IndustrialPsychology, 7, 36- 69.
Hackman, J.R., and Oldham, G.R. (1980), Work Redesign. Reading, M.A: Addison-Wesley.

Factors Related to Quality of Work Life of Faculty Members: Indian Perspective � 2815
Davis, L.E., Levine, M.F. and Taylor, J.C. (1984), “Defining quality of working life”. HumanRelations. 37(1), 81-104.
Argentero P., Miglioretti M., Angilletta C. (2007), “Quality of work life in a cohort of italianhealth workers”, Giornale Italiano di Medicina del Lavoro ed Ergonomia Supplemento A,Psicologia Vol. 29, N. 1: A50-A54.
Murrells, T., Clinton M. and Robinson, S. (2005), “Job satisfaction in nursing: Validation of anew instrument for the UK”. J. Nurs. Manag., 13(4): 296-311.
Brock-Utne, B., (2000), “Quality of work life for manual workers, Nurses. Job satisfaction: Aproposed measure”. Nurs. Res., 39(2): 113-117.