Embed Size (px)
Citation preview

Factors Leading to Academic Probation for New UC Berkeley Undergraduates
Sereeta Alexander, Ph.D. Office of Planning and Analysis Greg Dubrow, Ph.D. Office of Undergraduate Admissions
“We include and excel, together.”

• Highlight the relationship between academic probation and graduation rates
• Share the most recent 1st year academic probation rates across various student demographics
• Identify some of the pre-UC Berkeley factors associated with 1st year probation
• Discuss what we learned from our last probation rate analysis
This Presentation will…

Defining Academic Probation
• Cumulative UC GPA < 2.0 (C average)
• Term probation may also occur: UC GPA for a given semester < 1.5 (CED, L&S, and Haas) or < 2.0 (Chemistry, Natural Resources)
• Within the College of Engineering, students are subject to dismissal if cumulative or term GPA falls below a 2.0

The Importance of Probation
UC Berkeley students placed on 1st year academic probation have significantly lower graduation rates than their counterparts:
0%
20%
40%
60%
80%
100%
Fall 2002 Fall 2004 Fall 2006
No 1st-Yr Probation
On 1st-YrProbation
Freshman 6-year graduation rate
0%
20%
40%
60%
80%
100%
Fall 2004 Fall 2006 Fall 2008
No 1st-Yr Probation
On 1st-YrProbation
Transfer 4-year graduation rate

When looking at the graduation rates of only the students who experienced 1st year probation, we see some differences in the trends by Race/Ethnicity:
Graduation Rates of Students On 1st Year Probation
0%
20%
40%
60%
80%
100%
Fall 2002 Fall 2004 Fall 2006
AsianWhite
UREM
UREM (Freshman Entering) 6-year grad rates
0%
20%
40%
60%
80%
100%
Fall 2004 Fall 2006 Fall 2008
AsianWhiteUREM
UREM (Transfer Entering) 4-year grad rates

Historical & Current Probation Stats
1st year probation rates at UC Berkeley have steadily declined
– For the Fall 2011 entering cohort, freshmen had a 1st year
probation rate of 4%, compared to 7% for transfer entrants
0%
4%
8%
12%
1998 2003 2008
Transfers
Freshmen
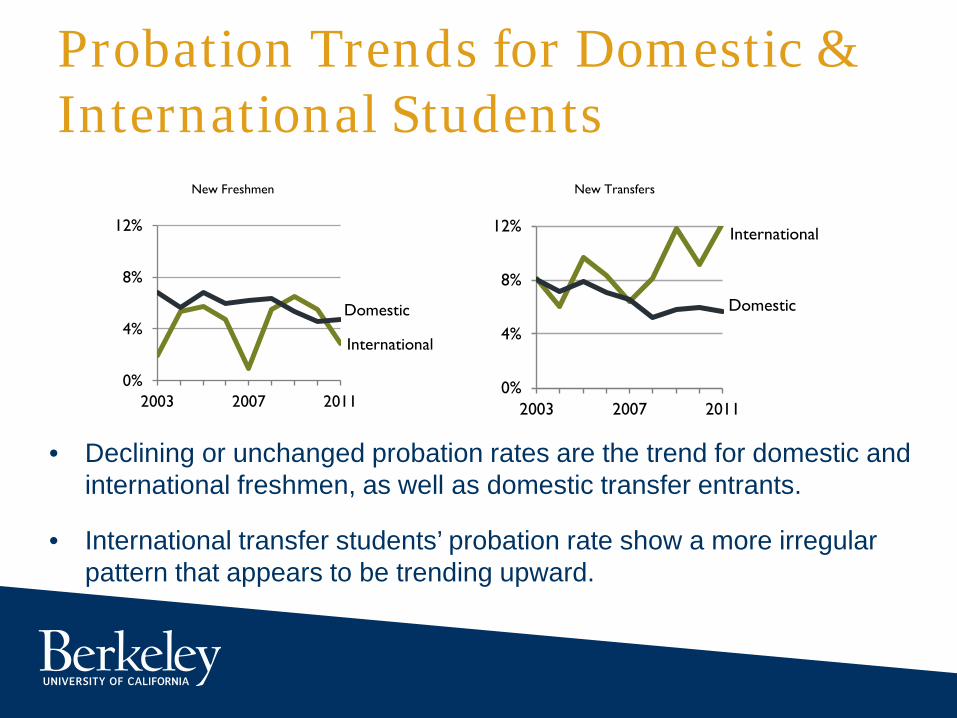
• Declining or unchanged probation rates are the trend for domestic and international freshmen, as well as domestic transfer entrants.
• International transfer students’ probation rate show a more irregular pattern that appears to be trending upward.
Probation Trends for Domestic & International Students
0%
4%
8%
12%
2003 2007 2011
International
Domestic
New Freshmen
0%
4%
8%
12%
2003 2007 2011
International
Domestic
New Transfers

2011 Entering Cohort • 4,449 Freshmen, 2,338 Transfer • Freshmen:
o 65% CA Resident o 14% UREM o 13% 1st-generation college going o 22% neither parent has Bachelor’s degree o 22% from API 1-5 o Avg GPA 3.83, Middle 50% 3.76 to 4.00 o Avg SAT 2030, Middle 50% 1910 to 2190

2011 Entering Cohort • 4,449 Freshmen, 2,338 Transfer • Transfer:
o 77% CA Resident o 29% UREM o 26% 1st-generation college going o 48% neither parent has Bachelor’s degree o 95% from CA Community Colleges o Average Age 23 o Avg GPA 3.73, Middle 50% 3.58 to 3.94

Demographic Profile of Students on 1st Year Probation (Fall 2011 cohort)
Freshmen - 200 (4.5%) total on probation at any time during their 1st year
• 134 (67%) on probation both Fall and Spring • 4 (3%) on probation Fall only • 62 (31%) on probation Spring only
Transfers - 160 (6.8%) total on probation at any time during their 1st year
• 102 (64%) on probation both Fall and Spring • 8 (5%) on probation Fall only • 50 (31%) on probation Spring only

New Freshmen
New Transfers
African American 10% 10%
Chicano/Latino 6% 4%
Asian 4% 7%
White 3% 4%
CA Resident 4% 6%
Out-of-state (domestic) 6% 5%
International 3% 12%
1st Year Probation Rates by Group, Fall 2011 Cohort
Demographic Profile of Students on 1st Year Probation (Fall 2011 cohort) Males, International Transfer Students and Underrepresented Minority (UREM) Freshmen Have Higher Probation Rates than Peers
5%
9%
3%
6%
FemaleUndergraduates
MaleUndergraduates
New Freshmen New Transfers
1st Year Probation Rate
New Freshmen
New Transfers
African American 10% 10%
Chicano/Latino 6% 4%
Asian 4% 7%
White 3% 4%
CA Resident 4% 6%
Out-of-state (domestic) 6% 5%
International 3% 12%
1st Year Probation Rates by Group, Fall 2011 Cohort
Note: the rate for each respective group in the table right above excludes student athletes
Demographic Profile of Students on 1st Year Probation (Fall 2011 cohort)
Predicting factors leading to probation is difficult
• Low probation rates means little variation in the population
• Regressions explained less than 10% of the reason

Demographic Profile of Students on 1st Year Probation (Fall 2011 cohort)
Predicting factors leading to probation is difficult
• Low probation rates means little variation in the population
• Regressions explained less than 10% of the reason

Demographic Profile of Students on 1st Year Probation
New Freshman Total Cohort N=4,449 On probation Anytime 1st Year N=200
Probation Rate
N Pct N Pct All Students 4,449 200 4.5%
Native American 34 0.8% 4 2.0% 11.8% African American 130 2.9% 15 7.5% 11.5% Chicano/Latino 477 10.7% 32 16.0% 6.7% Filipino 108 2.4% 5 2.5% 4.6% Asian/Pacific Islander 1,798 40.4% 75 37.5% 4.2% White 1,205 27.1% 46 23.0% 3.8% Decline to State 107 2.4% 6 3.0% 5.6% International 590 13.3% 17 8.5% 2.9% Female 2,311 51.9% 78 39.0% 3.4% Male 2,137 48.0% 122 61.0% 5.7% CA 2,908 65.4% 126 63.0% 4.3% International 590 13.3% 17 8.5% 2.9% Out of State Domestic 951 21.4% 57 28.5% 6.0% Athletes 228 5.1% 25 12.5% 11.0%
Chemistry 191 4.3% 14 7.0% 7.3% Engineering 617 13.9% 39 19.5% 6.3% Environmental Design 99 2.2% 5 2.5% 5.1% Letters & Science 3,138 70.5% 129 64.5% 4.1% Natural Resources 403 9.1% 13 6.5% 3.2%

Demographic Profile of Students on 1st Year Probation (Fall 2011 cohort)
Freshman non-athletes
Total Cohort N=4,449
On probation Anytime 1st Year
N=200 Probation
Rate
N Pct N Pct
All non-athletes 4,220 175 4.2% Native American 29 <1% 3 1.7% 10.3% African American 101 2.4% 10 5.7% 9.9% Chicano/Latino 464 11.0% 30 17.4% 6.5% Filipino 99 2.5% 5 2.9% 2.9% Asian/Pacific Islander 1,780 42.2% 71 40.6% 4.0% White 1,071 25.4% 35 20.0% 3.3% Decline to State 99 2.4% 5 2.9% 5.1% International 556 13.8% 16 9.1% 2.8%

Demographic Profile of Students on 1st Year Probation (Fall 2011 cohort)
New Freshmen Total Cohort N=4,449
On probation Anytime 1st Year
N=200
Probation Rate
N Pct N Pct No High School 157 3.5% 15 7.5% 9.6% Some High School 114 2.6% 9 4.5% 7.9% High School Grad 323 7.3% 20 10.0% 6.2% Some College 244 5.5% 14 7.0% 5.7% 2-Year College Grad 118 2.7% 6 3.0% 5.1% 4-Year College Grad 1,136 25.5% 55 27.5% 4.8% Post Graduate Study 2,288 51.4% 76 38.0% 3.3% Missing 69 1.6% 5 2.5% 7.2%
1st gen college going 594 13.4% 44 22.0% 7.4%
1st gen BA/BS earning 956 21.5% 64 32.0% 6.7%

Demographic Profile of Students on 1st Year Probation (Fall 2011 cohort)
New Freshmen Total Cohort On probation Anytime 1st Year
Probation Rate
N Pct N Pct
Summer Bridge 165 3.7% 25 12.5% 15.2%
Not Athletes (3.5% in SB) 148 89.7% 18 72.0% 12.2%
Athletes (7.5% in SB) 17 10.3% 7 28.0% 41.2%
Not Summer Bridge 4283 96.3% 175 3.9% 4.1%
Not Athletes 4072 95.1% 157 89.7% 3.9%
Athletes 211 4.9% 18 10.3% 8.5%

Demographic Profile of Students on 1st Year Probation (Fall 2011 cohort)
New Transfer Total Cohort N=2,338 On probation Anytime
1st Year N=160 Probation
Rate N Pct N Pct
All Students 2,338 160 6.8% Native American 18 0.8% 0 0.0% 0.0% African American 102 4.4% 11 6.9% 10.8% Chicano/Latino 364 15.6% 15 9.4% 4.1% Filipino 50 2.1% 1 0.6% 2.0% Asian/Pacific Islander 509 21.8% 40 25.0% 7.9% White 810 34.6% 36 22.5% 4.4% Decline to State 76 3.3% 7 4.4% 9.2% International 409 17.5% 50 31.3% 12.2% Female 1,152 49.3% 59 36.9% 5.1% Male 1,185 50.7% 101 63.1% 8.5% CA 1,808 77.3% 104 65.0% 5.8% International 409 17.5% 50 31.3% 12.2% Out of State Domestic 121 5.2% 6 3.8% 5.0% Business 93 4.0% 2 1.3% 2.2% Chemistry 54 2.3% 10 6.3% 18.5% Engineering 204 8.7% 30 18.8% 14.7% Environmental Design 73 3.1% 2 1.3% 2.7% Letters & Science 1,806 77.2% 109 68.1% 6.0% Natural Resources 108 4.6% 7 4.4% 6.5%

Demographic Profile of Students on 1st Year Probation (Fall 2011 cohort)
Transfer Total Cohort N=2,338
On probation Anytime 1st Year
N=160 Probation
Rate
N Pct N Pct No High School 107 2.4% 12 6.0% 11.2% Some High School 107 2.4% 11 5.5% 10.3% High School Grad 390 8.8% 28 14.0% 7.2% Some College 276 6.2% 14 7.0% 5.1% 2-Year College Grad 131 2.9% 9 4.5% 6.9% 4-Year College Grad 637 14.3% 36 18.0% 5.7% Post Graduate Study 611 13.7% 49 24.5% 8.0% Missing 79 1.8% 1 0.5% 1.3%
1st gen college going 604 25.8% 51 31.9% 8.4%
1st gen BA/BS earning 1,011 43.2% 74 46.3% 7.3%

Demographic Profile of Students on 1st Year Probation (Fall 2011 cohort)
Transfer International Total Cohort N=409 On probation Anytime 1st Year N=50 Probation
Rate 12.2% N Pct N Pct Santa Monica College 72 17.6% 14 28.0% 19.4% Diablo Valley College 95 23.2% 10 20.0% 10.5% De Anza College 59 14.4% 7 14.0% 11.9% Laney College 14 3.4% 4 8.0% 28.6% Santa Barbara City College 11 2.7% 2 4.0% 18.2% Oxnard College 2 0.5% 2 4.0% 100.0% Foothill College 22 5.4% 1 2.0% 4.5% Berkeley City College 7 1.7% 1 2.0% 14.3% City College Of San Francisco 6 1.5% 1 2.0% 16.7% Orange Coast College 5 1.2% 1 2.0% 20.0% College Of The Canyons 4 1.0% 1 2.0% 25.0% Las Positas Cmty College 3 0.7% 1 2.0% 33.3% Alfred University 1 0.2% 1 2.0% 100.0% Contra Costa College 1 0.2% 1 2.0% 100.0% Grossmont Cmty College 1 0.2% 1 2.0% 100.0% Univ Minnesota Minneapolis 1 0.2% 1 2.0% 100.0% Vincennes University 1 0.2% 1 2.0% 100.0% East Los Angeles College 10 2.4% 0 0.0% 0.0%

Demographic Profile of Students on 1st Year Probation (Fall 2011 cohort)
Not on Probation
On Probation Freshmen
Parent Income $100,000 $68,000 GPA (unweight) 3.84 3.67 GPA (weighted) 4.29 4.08 SAT Math 700 664 SAT Read 656 616 SAT Write 677 626 SAT Composite 2033 1906 ACT Composite 30 28 Transfers Parent Income $70,492 $52,809 Student Income $16,827 $14,293 Transfer GPA 3.75 3.70
Ttest shows significant difference in all academic indicator means between probation and non-probation groups

Previous Grade Point Average New Students’ Prior GPA is a Major Factor Associated with 1st Year Probation Once at UC Berkeley
0% 3% 6% 9% 12% 15% 18%
1st Year Probation Rate
< than 3.25
3.75 to 4.0
3.5 to 3.74
3.25 to 3.49
High School or Transfer GPA Range
New Freshmen New Transfers• For freshmen in particular, as prior GPA
increases, the likelihood of being placed on 1st year probation decreases
• The probation rate for new freshmen with an unweighted high school GPA of 3.75 to 4.0 is 3%, which is similar to the overall freshmen probation rate of 4%.
• However, for freshmen with a slightly lower GPA range of 3.5 to 3.74 we see an 8% rate.
• This pattern is present for new transfer students, although not as pronounced.

Number of AP/Exam Units New Freshmen who enter with higher numbers of AP/Exam Units have lower probation rates than their freshmen counterparts who enter with fewer AP/Exam Units
10%
8%
5%
3%
3%
0% 3% 6% 9% 12% 15% 18%
Zero Exam Units
6 or fewer
6.1 to 18
18.1 to 30
30.1 and above
1st- Year Probation rate (New Fall 2011 Freshmen), by Range of Exam Units Completed Prior to Entry
1st Year Probation Rate

Past Findings: What do we know from the students themselves? • 1st year students who completed the Spring 2010 UC
Undergraduate Experience Survey indicated that the following had proven to be frequent obstacles to their academic success at Berkeley:
% Somewhat Often, Often, or Very Often

Looking Ahead • In the Summer of 2013, curriculum data will be migrated into
Cal Answers (UC Berkeley’s data warehouse).
• Having curriculum data in Cal Answers will allow us to do more analysis on the course-taking patterns of new Berkeley students who find themselves in academic difficulty.
• We hope to identify additional factors that are associated with academic probation, particularly factors for which the campus can intervene on through academic advising, for example.
• Our goal is to support students, as well as the student services staff who work to ensure the success of our students.
•

Data Resources & Contact Info Cal Answers: http://calanswers.berkeley.edu
Office of Planning and Analysis: http://opa.berkeley.edu
Office of Undergraduate Admissions: http://admissions.berkeley.edu
Sereeta Alexander: [email protected]
Greg Dubrow: [email protected]