Embed Size (px)
Citation preview

FACTORS INFLUENCING THE QUALITY OF DATA FOR TUBERCULOSIS CONTROL PROGRAMME IN OSHAKATI
DISTRICT, NAMIBIA
by
LINDA VUGUTSA KAGASI
Submitted in accordance with the requirements for the degree of
MASTER OF PUBLIC HEALTH
at the
UNIVERSITY OF SOUTH AFRICA
SUPERVISOR: PROF LI ZUNGU
NOVEMBER 2010

Student number: 37324969
DECLARATION
I, Linda Vugutsa Kagasi declare that the dissertation entitled “Factors influencing the
quality of data for tuberculosis control programme in Oshakati District, Namibia”,
is my own work and that all sources used or cited have been indicated and
acknowledged by means of complete referencing. No part of this project may be
reproduced without prior permission of the author and/or the University of South Africa.
06 December 2010 __________________ _____________________ SIGNATURE DATE (LINDA KAGASI)

DECLARATION BY SUPERVISOR This research project has been submitted for examination with my approval as the University Supervisor.
06 December 2010 ____________________ ____________________ SIGNATURE DATE (PROF LINDIWE ZUNGU)

FACTORS INFLUENCING THE QUALITY OF DATA FOR TUBERCULOSIS CONTROL PROGRAMME IN OSHAKATI DISTRICT,
NAMIBIA
STUDENT NUMBER : 37324969 STUDENT : LINDA VUGUTSA KAGASI DEGREE : MASTER OF PUBLIC HEALTH DEPARTMENT : HEALTH STUDIES, UNIVERSITY OF SOUTH AFRICA SUPERVISOR : PROF LINDIWE ZUNGU
ABSTRACT This study investigated factors influencing the quality of data for the Tuberculosis (TB)
control programme in Oshakati District in Namibia. A quantitative, cross-sectional
descriptive survey was conducted using 50 nurses who were sampled from five
departments in Oshakati State Hospital. Data was collected by means of a self-
administered questionnaire.
The results indicated that the majority (90%) of the respondents agreed that TB training
improved correct recording and reporting. Sixty percent of the respondents agreed that
TB trainings influenced the rate of incomplete records in the unit, while 26% of the
respondents disagreed with this statement. This indicates that TB trainings influence the
quality of data reported in the TB programme as it influences correct recording and
completeness of data at operational level.
Participants’ knowledge on TB control guidelines, in particular the use of TB records to,
used to capture the core TB indicators influenced the quality of data in the programme.
The attitudes and practises of respondents affected implementation of TB guidelines
hence, influencing the quality of data in the programme. The findings related to the
influence of the quality of data in the TB programme and its effect to decision-making
demonstrated a positive relationship (p=0.0023) between the attitudes of study
participant on the use of data collected for decision-making.
Knowledge, attitudes and practice are the main factors influencing the quality of data in
the TB control programme in Oshakati District.
Keywords
Factors; data quality; tuberculosis; control programme; Namibia.

ACKNOWLEDGEMENTS
I would like to thank the following persons for their guidance, support and
encouragements, without which I could not have completed this research project:
Professor SP Human, for providing a supportive environment during my studies
at UNISA.
My supervisor, Professor LI Zungu, for constructive criticism, guidance and
support that inspired me to give my best to this research project.
The staff and management of Oshakati State hospital, for their cooperation and
guidance during my research project.
Mr John Mwazemba and Mr David Levey, for professional editing of this
dissertation.
My colleague, Mr Bernard Mugomba, for sharing the relevant knowledge and
related materials that guided me in this research project.
I cherish the love and encouragement you have all given me in my life, particularly
during my studies.

Dedication
This dissertation is dedicated to the Almighty God, for His loving
kindness, wisdom and grace that always abounds all the days of my
life and during this research period. To my parents, John and Edith
Kagasi, for their dedication to my studies, mentorship, inspiration
and being role models in my life. My sister, Juliana, for her silent
love and support and Tim Chindia, for his support during the period
of conducting this research project.

i
Table of contents Page
CHAPTER 1 Orientation to the study 1.1 INTRODUCTION .......................................................................................................................................... 1 1.2 BACKGROUND TO THIS RESEARCH ........................................................................................................ 2 1.2.1 Data quality ................................................................................................................................................... 3 1.2.2 Completeness of data ................................................................................................................................... 4 1.2.3 The Namibian TB control and management programme .............................................................................. 5 1.2.4 Oshakati District TB control and management programme .......................................................................... 6 1.3 PROBLEM STATEMENT ............................................................................................................................. 6 1.4 SIGNIFICANCE OF THE STUDY ................................................................................................................. 7 1.5 AIM OF THE STUDY .................................................................................................................................... 7 1.6 OBJECTIVES OF THE STUDY .................................................................................................................... 7 1.7 DEFINITION OF CONCEPTS ...................................................................................................................... 8 1.8 RESEARCH METHODOLOGY .................................................................................................................... 9 1.8.1 Research design ........................................................................................................................................... 9 1.8.2 Population of the study ................................................................................................................................. 9 1.8.3 Sampling technique used for this study ........................................................................................................ 9 1.8.4 Data collection ............................................................................................................................................ 10 1.8.5 Data analysis .............................................................................................................................................. 10 1.8.6 The concept of validity ............................................................................................................................... 10 1.8.7 The concept of reliability ............................................................................................................................. 10 1.8.8 Ethical consideration .................................................................................................................................. 11 1.9 LIMITATIONS OF THE STUDY .................................................................................................................. 11 1.10 STRUCTURE OF THE DISSERTATION .................................................................................................... 11 1.11 CONCLUSION ............................................................................................................................................ 12
CHAPTER 2 Literature review 2.1 INTRODUCTION ........................................................................................................................................ 13 2.2 DATA QUALITY .......................................................................................................................................... 13 2.3 IMPORTANCE OF THE QUALITY OF DATA ............................................................................................. 14

ii
Table of contents Page 2.4 QUALITY ASSURANCE IN HEALTH CARE .............................................................................................. 15 2.5 KEESLER MODEL ..................................................................................................................................... 15 2.6 QUALITY OF HEALTH CARE SERVICES ................................................................................................. 16 2.6.1 Total quality management/continuous quality improvement ...................................................................... 17 2.6.2 Approaches of measuring quality ............................................................................................................... 17 2.7 FACTORS INFLUENCING DATA QUALITY DATA IN HEALTH PROGRAMMES WITH A FOCUS ON TB PROGRAMMES .................................................................................................................................... 18 2.7.1 Knowledge and training .............................................................................................................................. 18 2.7.2 Attitudes and quality data ........................................................................................................................... 20 2.7.3 Practices and data quality .......................................................................................................................... 21 2.8 CONCEPTUAL FRAMEWORK .................................................................................................................. 23 2.9 CONCLUSION ............................................................................................................................................ 24
CHAPTER 3 Research design and methodology 3.1 INTRODUCTION ........................................................................................................................................ 25 3.2 RESEARCH METHODOLOGY .................................................................................................................. 25 3.2.1 Research design ......................................................................................................................................... 25 3.2.2 Research setting ......................................................................................................................................... 25 3.3 RESEARCH METHOD ............................................................................................................................... 26 3.4 POPULATION ............................................................................................................................................ 26 3.4.1 Sample and sampling technique................................................................................................................. 26 3.5 DATA COLLECTION .................................................................................................................................. 28 3.6 DATA COLLECTION METHOD .................................................................................................................. 28 3.7 DATA COLLECTION PROCESS ................................................................................................................ 29 3.8 PRE-TESTING OF THE INSTRUMENT ..................................................................................................... 30 3.9 DATA ANALYSIS ...................................................................................................................................... 30 3.10 VALIDITY AND RELIABILITY ..................................................................................................................... 31 3.10.1 Reliability of the instrument ........................................................................................................................ 31 3.10.2 Data collection reliability ............................................................................................................................. 31 3.10.3 Validity ........................................................................................................................................................ 32 3.10.4 Content validity ........................................................................................................................................... 32

iii
Table of contents Page 3.10.5 Construct validity of the instrument ............................................................................................................. 32 3.10.6 Face validity ................................................................................................................................................ 32 3.11 ETHICAL CONSIDERATONS .................................................................................................................... 33 3.11.1 Permission to conduct the study ................................................................................................................. 33 3.11.2 Informed consent ........................................................................................................................................ 33 3.11.3 Confidentiality and anonymity ..................................................................................................................... 33 3.11.4 Principle of justice ....................................................................................................................................... 34 3.11.5 Persuasion ................................................................................................................................................. 34 3.12 CONCLUSION ............................................................................................................................................ 34
CHAPTER 4 Data analysis and presentation of findings 4.1 INTRODUCTION ........................................................................................................................................ 35 4.2 RESEARCH RESULTS .............................................................................................................................. 35 4.2.1 Socio-demographic characteristics ............................................................................................................. 35 4.2.2.1 Participants’ distribution per department .................................................................................................... 36 4.2.3 Factors influencing data quality .................................................................................................................. 37 4.2.3.1 Participants’ level of knowledge.................................................................................................................. 37 4.2.3.2 Assessment of knowledge levels on various components related to data collection and data quality ........ 37 4.2.3.3 Knowledge level on use of TB records ....................................................................................................... 38 4.2.3.4 Training received by participants ................................................................................................................ 39 4.2.3.5 Nature of training received by participants ................................................................................................. 40 4.2.3.6 Distribution of nature of training received according to nursing carde and position in department ............. 41 4.2.4 Participants’ attitudes ................................................................................................................................. 41 4.2.4.1 Participants’ views on attitudes as a factor that influence data quality ....................................................... 41 4.2.4.1.1 Training on data management .................................................................................................................... 41 4.2.4.1.2 Number of training events, workshops and meetings by an individual staff member improves data quality in the unit ......................................................................................................................................... 42 4.2.4.1.3 Influence of TB training on rate of incomplete records ............................................................................... 43 4.2.4.2 Attitudes towards the various components influencing the quality of data in the TB programme ............... 44 4.2.4.2.1 Number of training events attended ............................................................................................................ 44 4.2.4.2.2 Type of TB training ..................................................................................................................................... 46 4.2.4.2.3 Number of forms to be filled out for each patient ........................................................................................ 47 4.2.4.2.4 Trusting findings received from the laboratory ............................................................................................ 47 4.2.4.2.5 Data collected is used by decision-makers ................................................................................................. 48 4.2.4.3 Usefulness of TB records in TB management ............................................................................................ 49

iv
Table of contents Page 4.2.5 Effects of practices on quality of data ......................................................................................................... 50 4.2.5.1 Describing data collectors’ practices that influence the quality of data in Oshakati District TB 49 programme ................................................................................................................................................. 50 4.2.5.2 Practices influencing the quality of data in Oshakati District....................................................................... 51 4.2.5.2.1 Time taken to receive sputum results from the laboratory .......................................................................... 51 4.2.5.2.2 Number of supportive supervisions conducted by programme managers .................................................. 51 4.2.5.3 Frequency of activities in Oshakati District ................................................................................................. 52 4.2.5.3.1 Supportive supervision from the regional level ........................................................................................... 52 4.2.5.3.2 Auditing of TB data in the unit..................................................................................................................... 53 4.2.5.4 Use of TB data collection tools ................................................................................................................... 53 4.3 OTHER FACTORS INFLUENCING THE QUALITY OF DATA ................................................................... 54 4.4 CONCLUSION ............................................................................................................................................ 55
CHAPTER 5 Conclusions, recommendations and limitations of the study 5.1 INTRODUCTION ........................................................................................................................................ 56 5.2 SUMMARY OF FINDINGS ......................................................................................................................... 56 5.2.1 Determine the demographic characteristics of nurses involved in TB control programme in Oshakati District, Namibia ......................................................................................................................................... 57 5.2.2 Identify and describe the various factors influencing the quality of data in TB control programme in Oshakati District, Namibia .......................................................................................................................... 57 5.2.3 Measure the association between the demographic characteristics and factors influencing data quality in TB control programme in Oshakati District, Namibia .............................................................................. 58 5.4 CONCLUSIONS ......................................................................................................................................... 60 5.5 RECOMMENDATIONS .............................................................................................................................. 61 5.5.1 Recommendations for further studies ......................................................................................................... 61 5.5.2 Recommendations for practise ................................................................................................................... 62 5.6 LIMITATIONS OF THE STUDY .................................................................................................................. 63 5.7 CONCLUDING REMARKS ......................................................................................................................... 63 BIBLIOGRAPHY .......................................................................................................................................................... 64
v
List of tables Page Table 3.1 Distribution of target population (N=101) ......................................................................................... 27 Table 4.1 Participants’ socio-demographic characteristics (N=50) .................................................................. 36 Table 4.2 Distribution of TB training improving correct recording and reporting (N=50), 1 response missing ......................................................................................................................... 42 Table 4.3 Frequency distribution of training events, workshops and meetings according to work experience (N=50), 1 response missing .......................................................................................... 43 Table 4.4 Frequency distribution related to incomplete records (N=50), 1 response missing ......................... 43 Table 4.5 Distribution of responses related to incomplete records according to nursing cadre (N=50), 1 response missing ......................................................................................................................... 44 Table 4.6 Distribution related to number of training events attended according to nursing cadre (N=50), 1 response missing ......................................................................................................................... 45 Table 4.7 Distribution related to number of training events attended according to years of work experience (N=50), 1 response missing ............................................................................................................ 45 Table 4.8 Distribution related to number of training events attended according to departments (N=50), 1 response missing ......................................................................................................................... 45 Table 4.9 Distribution related to number of training events attended according to position (N=50), 1 response missing ......................................................................................................................... 46 Table 4.10 Distribution related to type of TB training and department to which attached (N=50), 1 response missing ......................................................................................................................... 47 Table 4.11 Distribution related to data collection and use by decision-makers according to nursing cadre (N=50), 1 response missing ............................................................................................................ 48 Table 4.12 Distribution related to data collection and use by decision-makers according to years of work experience (N=50), 1 response missing .......................................................................................... 49 Table 4.13 Distribution related to supportive supervision from the regional level according to departments (N=50), 1 response missing ............................................................................................................ 52 Table 4.14 Distribution of responses related to frequency of use of DOT form according to nursing cadre (N=50), 1 response missing ............................................................................................................ 53 Table 4.15 Distribution of responses related to frequency of use of MDR treatment card according to nursing cadre (N=50), 2 responses missing ................................................................................................. 54 Table 4.16 Distribution of responses related to frequency of use of MDR treatment card according to years of work experience (N=50), 2 responses missing............................................................................ 54

vi
List of figures Page Figure 2.1 Keesler model .................................................................................................................................... 16 Figure 2.2 Conceptual framework ....................................................................................................................... 24 Figure 4.1 Distribution of respondents according to departments (N=50) ........................................................... 37 Figure 4.2 Factors influencing quality of data (N=50), 1 response missing ......................................................... 38 Figure 4.3 Mean scores related to knowledge level reported on the use of TB records (N=50), 1 response missing ............................................................................................................................................... 39 Figure 4.4 Attendance of TB training (N=50), 1 response missing ...................................................................... 40 Figure 4.5 Nature of training received (N=50), 1 response missing .................................................................... 40 Figure 4.6 Distribution of mean scores related to usefulness of TB records according to nursing cadre (N=50), 1 response missing ............................................................................................................................ 50 Figure 4.7 Other factors influencing the quality of data in Oshakati District (N=50), 1 response missing ........... 53
vii
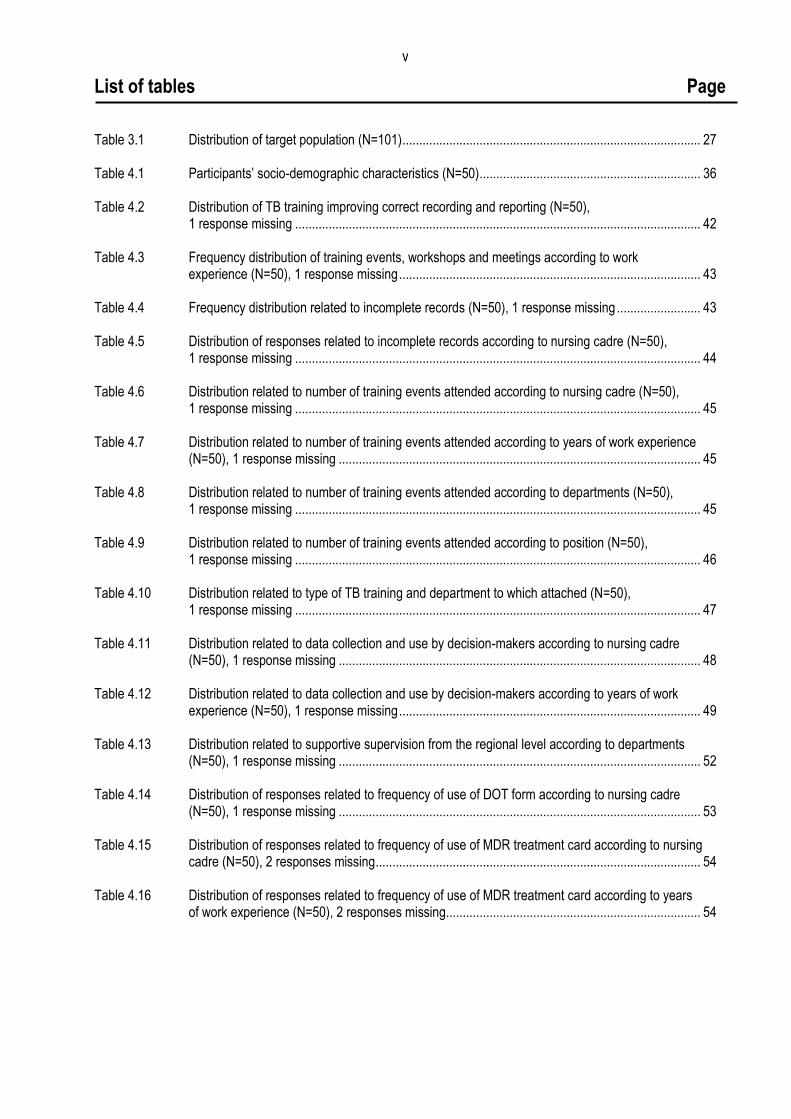
List of abbreviations AIDS Acquired Immune Deficiency Syndrome
CNR Case Notification Rate
CQI Continuous Quality Improvement
DHIS District Health Information System
DOTS Direct Observed Therapy Short Course
DTC District Tuberculosis Coordinator
DTO District Tuberculosis Officer
ETR Electronic Tuberculosis Register
HCW Health Care Workers
HIV Human Immuno-deficiency Virus
HMIS Health Management Information System
KABP Knowledge Attitude Beliefs Practices
MDR-TB Multiple Drug Resistance Tuberculosis
MoHSS Ministry of Health and Social Services
MTP 1 Medium Term Plan One
NTCP National Tuberculosis Control Programme
NTP National Tuberculosis Programme
PALSA Practical Approach to Lung Health in South Africa
PDSA Plan Do Study Act
PHC Primary Health Care
RMT Regional Management Team
SA South Africa
SHPA Special Health Programme Administrator
SPSS Statistical Packages for Social Sciences
TB Tuberculosis
TB R&R Tuberculosis Recording and Reporting
TBCAP Tuberculosis Coalition Assistance Programme
TBCTA Tuberculosis Coalition Technical Assistance
TQM Total Quality Management
UK United Kingdom
UN United Nations
UNISA University of South Africa
USA United States of America
WHO World Health Organization

viii
List of annexures Annexure 1 Letter of permission to conduct the study Annexure 2 Clearance certificate from the Research and Ethics Committee, Department of Health
Studies, Unisa
Annexure 3 Clearance letter from MoHSS, Namibia Annexure 4 Information sheet Annexure 5 Research budget Annexure 6 Consent form for respondents Annexure 7 Map of Namibia showing Oshakati District Annexure 8 Timeline for all activities of the study (2009-2010) Annexure 9 Nursing practitioner’s questionnaire
1
CHAPTER 1
Orientation to the study
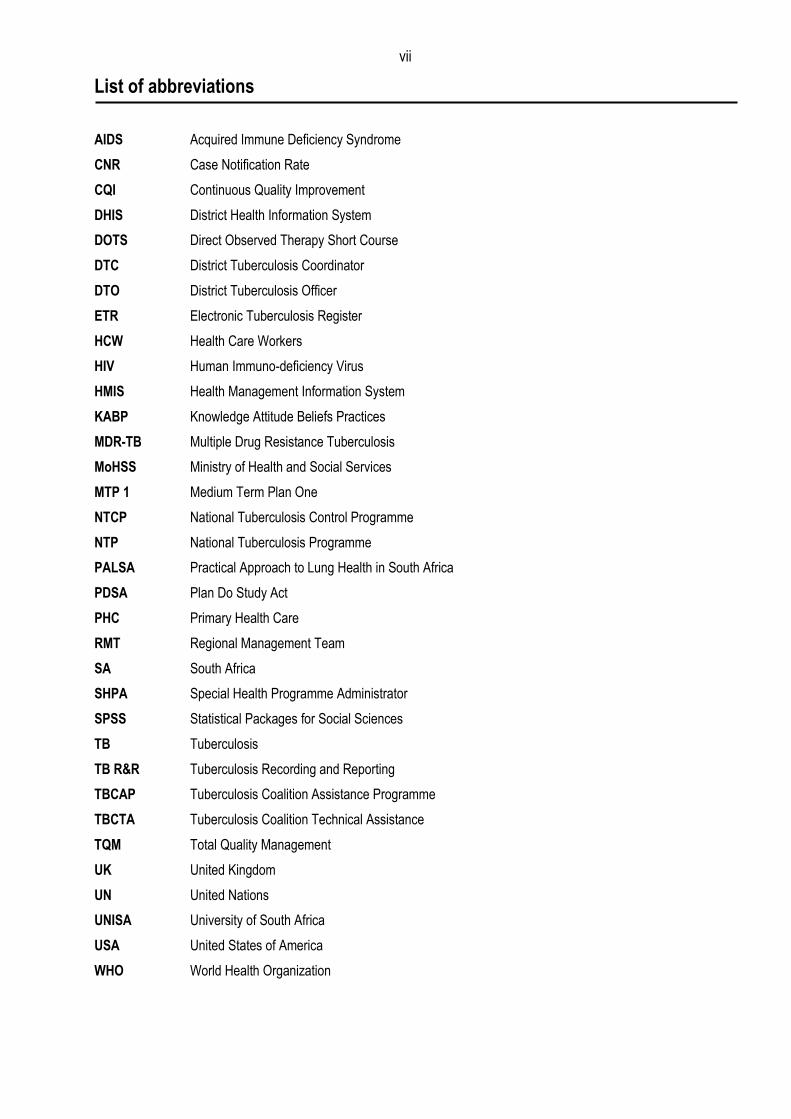
1.1 INTRODUCTION
Tuberculosis (TB) remains a major cause of morbidity and mortality in many countries
and is a significant health problem worldwide (World Health Organization [WHO]
2008a:3). In 2005 the WHO reported that the global incidences of TB were estimated to
be 136 cases per 100 000 members of the population per year. The incidence of TB
ranged from 39 per 100 000 per year in the WHO regions of the Americas to 343 per
100 000 per year in the African region (WHO 2008a:3). The burden of TB in Namibia
was reported to be 765 cases per 100 000 of the population in 2006/2007 (Ministry of
Health and Social Services [MoHSS] 2008a:6).
This is reported to be the second highest Case Notification Rate (CNR) in the world
after Swaziland (MoHSS 2008a:6). The WHO targets for tuberculosis control by 2015
include 100% direct observed therapy short-course (DOTS) coverage, 70% case
detection and 85% treatment success rates (WHO 2006a:6).
Effective TB control relies heavily upon the general health system of the country,
particularly on the well-functioning primary health care (PHC) services. However, in
most countries, TB programmes are an important part of, and are normally well
integrated into the general health systems, especially at the points of services. They
contribute substantially to strengthening the health systems, which include the direct
observed therapy (DOT) strategies. Furthermore in trying to control the incidence of TB,
the WHO developed the “Stop TB Strategy” which consists of the following components,
namely:
Pursuing high-quality DOT expansion and enhancement.
Addressing TB/HIV, Multiple Drug Resistance Tuberculosis (MDR-TB) and other
challenges.
Contributing to health system strengthening.
Engaging all health care providers.
2
Empowering people and communities with TB awareness and control
information.
Enabling and promoting operational research related to TB control (WHO
2006a:8).
Nadol, Stinson, Coggin, Naicker, Wells, Miller and Nelson (2008:58) support the
sentiments that the success of the “Stop TB Strategy” depends on well established
recording and reporting systems for TB surveillance, which according to the authors
should effectively report on the progress of the DOT programmes.
The authors further pointed out that a well-functioning TB surveillance system produces
accurate standardised TB surveillance and enables case detection and outcomes
assessment of TB patients. This provides data that is useful in monitoring and
evaluation of TB control programmes, programme implementation and serving as a
supervisory tool for the National TB Programme (NTP) staff (Nadol et al 2008:58).
Accurate, timely and accessible health care data plays a pivotal role in the planning,
development and maintenance of health services (WHO 2003a:1). It is also known that
different administrative levels in the health system play different roles and hence exhibit
different data needs (WHO 2004:9). For effective communication, data must be valid
and conform to an expected range of values and it the same case, it becomes more
useful if data is accurate (WHO 2003a:10). This study, therefore, seeks to investigate
factors that influence data quality processed in the TB control programme, with a
special focus in Oshakati District, Namibia.
1.2 BACKGROUND TO THIS RESEARCH
According to the “Stop TB Policy” by the WHO, poor quality vital statistics and
demographic information, lack of data on patterns of health care utilisation, weaknesses
in the surveillance system and poor disease notification systems were identified as
major factors influencing the data quality that affect the control and management of TB
programmes (WHO 2008b:1). This is as a result of the data quality collected in the
health system as well as data collected specifically in the TB programmes (WHO
2008b:2).

3
1.2.1 Data quality
Fundamental principles of quality assurance with regards to data quality include five
dimensions, namely; integrity, methodology, soundness, accuracy and reliability of data
collected (WHO 2008c:4).
In health care settings the quality of data is viewed as a continuous process, as
opposed to a one time activity. This is exhibited in the literature reviewed which concurs
with the definition provided in Tomey (2000:382); which indicated that continuous quality
improvement is a preventive, problem-solving process which results in effective and
efficient service. According to Herbst (2002:379), the term data quality suggests data
correctness. Green and Bowie (2005:246) emphasise that the following characteristics
are important in ensuring data quality; namely, accessibility, accuracy, comprehend-
siveness, consistency, definition, granularity, precision, relevance and data timeliness.
One of the attributes of reliable and valid data is its completeness. According to a study
in the United Kingdom (UK), complete data allows governments to be reassured
concerning full disclosure of outcomes by the centre of origins, thus assisting the
process of validation, monitoring and feedback geared towards improving data quality
(Fine, Bruce, Shan, Maria & Mairi 2003:25).
In Namibia, the MoHSS TB guideline clearly describes the flow of data from the facility
level up to the district level, while various reporting forms are clearly illustrated.
However, the guidelines do not provide details regarding data verification processes,
timeliness as regards the information reaching the various management levels, the
frequency of feedback to evaluate the achievements of the programme and gaps
identified during supervisory visits (MoHSS 2006:50).
Well (2000:597) voices the concern that as a result of donor dominance, low income
nations have experienced minimal ownership of their systems. The author further
argues that this customarily leads to limiting the motivation and flexibility of the
response by staff and institutions to local needs.
4
According to the WHO guidelines for developing countries to support them in the
production or maintenance of quality data, the frequency of data submitted to each level
should be clearly stipulated and communicated, assisting in minimising data collection
processes at each level (WHO 2004:13).
As evidenced by South Africa while developing the District Health Information System
(DHIS), a survey conducted in the Eastern Cape Province revealed that health workers
are faced with myriad books and forms, all used to collect information for specific
managers, but with minimal integration and lack of vision for its utilisation at the local
level. The survey further revealed that data collected by clinic staff seemed
inappropriate for adequate management service (Shaw 2005:633).
1.2.2 Completeness of data
Quality improvement and timely dissemination of quality data is essential in assisting
health authorities at all levels to take effective decisions in disease control. Similarly, the
success of the “Stop TB Strategy” depends on reliable recording and reporting systems
of TB surveillance that effectively provide information and reports on the components of
assessing the TB control and management programme (Nadol et al 2008:58).
A consultative meeting which was held in Nairobi, Kenya, in 2002 was called to write the
final report to develop proposals for collaborative TB HIV/AIDS (Human Immuno-
deficiency Virus/Acquired Immune Deficiency Syndrome) programme activities. It further
emphasised the importance of data quality influenced by incomplete data, particularly at
district levels, contributing to delays in timely decision-making regarding the
implementation of TB control and management activities (WHO 2002:8).
The advent of the Electronic Tuberculosis Register (ETR) in data collection relies on
data collection tools at health facilities that significantly influence the quality of data,
which includes the completeness of data collected. The experience in Botswana in this
regard highlights problems in the paper-based TB data collection system (Vranker,
Coulobier, Kenyon, Koosimile, Mavunga, Coggin & Binkin 2002:112). However, this is
attributed to the inability of the District TB Coordinators (DTC) to provide continuing
support to the individual health facilities.

5
An effective TB control programme could be achieved through regular training and
supervision of health personnel. The net result of this may contribute to an information
culture at all levels of staff and further enhance production of quality data, with the
positive results mentioned.
1.2.3 The Namibian TB control and management programme
The Namibian TB programme receives technical support from the Tuberculosis
Coalition Assistance Programme (TBCAP) and funding from the Global Fund. According
to the Tuberculosis Coalition Technical Assistance (TBCTA) 2005 report, the body
provides the following support to the Namibian TB programme. This mainly includes
training of health personnel, reviewing Tuberculosis Recording and Reporting (TB
R&R), providing infrastructure to support case management and strengthening Health
systems by providing ICT equipment (TBCTA 2005 www.tbcta.org/TBCTA_Project/
Results.php 2009-07-31).
The management of the TB programme is decentralised up to the district level. The
Medium Term Plan One (MTP 1) of 2004-2009 indicates that since 1991 the DOT
strategy has been adopted (MoHSS 2004:5). To date, the country has achieved
coverage of 100%; hence all public health facilities are implementing the national the
DOT strategy as part of the National TB control programme.
At the district level, the District TB register and the ETR are the core data collection
tools available (MoHSS 2006:50). These registers are useful in compiling and
comparing progress made at each level. They are valuable in reporting treatment
success rates, assisting in follow up of patients and ensuring treatment adherence. The
district quarterly report on TB case-finding is generated from the individual patient‟s
notification data record in the ETR and district register; this is then aggregated to
regional and national levels. To date, the programme does not employ data clerks
charged specifically with the responsibility of updating the TB registers. However, these
responsibilities are performed by the DTC, who is in charge of the TB programme at
district level. The DTC works under the supervision of the PHC supervisor, who reports
to the Special Programme Health Administrator (SPHA) at the regional level. At the
facility level, the nurses main functions in the TB programme, is to enter data and
6
ensure that data quality is maintained as well as to report monthly to the DTC on the
caseloads in the facility and other treatment outcomes as stipulated in the TB guidelines
(MoHSS 2006:51).
1.2.4 Oshakati District TB control and management programme
According to the 2006/2007 region report, the Oshana region notified 1470 TB cases
and a CNR of 830 per 100,000 populations (MoHSS 2008a:11). The report further
reveals that the region was ranked fifth amongst the 13 regions of Namibia (MoHSS
2008:29). The district participates in the quarterly zonal review meeting for the North
Central regions funded by TBCAP which are TB based. The zonal meetings of the North
Central regions comprise four regions known as “Ovamboland”; this includes
Ohangwena, Oshikoto, Omusati and Oshana regions (National Planning Commission
1997:22).
To date, 12 zonal review meetings have been conducted, with the last being conducted
in the Omusati region in January 2009 (MoHSS 2009:2). One major benefit of these
meetings is to make available opportunities for the regions to share the achievements of
each quarter and to undertake a peer review of each district‟s records. However, the
information shared in these meetings is district based and not facility based. According
to the 12th review meeting, aspects of ensuring data quality were not incorporated in
detail in the presentations by each district. However, one aspect of data quality
highlighted by Oshakati District during this meeting revealed that data on the MDR
situation was not available for assessment of the progress achieved during the reporting
quarter (MoHSS 2009:10).
1.3 PROBLEM STATEMENT
The burden of TB in Namibia was reported to be 765 per 100 000 people in the
2006/2007 annual report (MoHSS 2008a:6). Quality data involves recording and
reporting of existing, newly diagnosed and known TB cases. This fulfils a key role in
strengthening health systems and in improving the quality of data collected that is useful
in monitoring and evaluating programme performance. This is supported by the WHO
Stop TB strategy (2006:11) which emphasises the need for reliable data that supports
monitoring and evaluating the performance of strategies in TB control. There is limited

7
documented information on steps taken to ensure data quality in the TB control
programme in Namibia, particularly in Oshakati District where the prevalence of TB is
high. This is evidenced by the health reports presented during the quarterly review
meetings by the Ministry of Health (MoHSS 2009:10). Therefore this study addressed
factors that influenced the quality of data for TB control management which play a
crucial role when assessing treatment outcomes, early identification of programme
needs as well as identifying gaps in TB management programmes.
1.4 SIGNIFICANCE OF THE STUDY
This study investigated the factors influencing the quality of data in the TB control
programme. The results of the survey will assist in programme planning at all health
operational levels as a basis for TB control and management, specifically the monitoring
and evaluation component, as well as identified implementation gaps. It would assist in
developing monitoring and evaluation tools and revising existing TB guidelines. It would
further improve the data collection tools that are currently being used, assist in revising
related health policies and integrating the existing health systems for efficiency and
effectiveness. Lastly, the information is intended to contribute to strengthening data
collection practices geared towards the strengthening of TB control and management
efforts in Oshakati District.
1.5 AIM OF THE STUDY
The aim of this study was to investigate factors influencing the quality of data in TB
control programmes in Oshakati District, Namibia.
1.6 OBJECTIVES OF THE STUDY
The objectives of this study were to
determine the demographic characteristics of nurses involved in TB control
programme in Oshakati District, Namibia
describe the various factors influencing the quality of data in TB control
programme in Oshakati District, Namibia

8
measure the association between the demographic characteristics and factors
influencing data quality in TB control programme in Oshakati District, Namibia
1.7 DEFINITION OF CONCEPTS
In this study the following words and/or phrases had the following meaning ascribed to
them unless the text indicates otherwise.
Data quality. It refers to the characteristic that describes data excellence which
includes the reliability and accuracy of data collected (Kirch 2008:213).
Completeness of data. It refers to the percentage of data missing at a given period of
time. For example, a medical record must contain all data identifying the patient, all data
from attending doctors, all nursing notes and all data must be signed and dated (Kirch
2008:199).
Data collectors. These are personnel who are assigned the responsibility of collecting
various aspects of health-related information. In health care, they range from doctors,
nurses and laboratory personnel to administrative staff, to mention a few (Kirch
2008:197).
Information systems. This is the collection and integration of various processes of
hardware, software and human resources that meet the data collection, storage,
processing and report generation needs of an organisation or programme (Marin &
Bakken 2001:3).
Health system strengthening. These are guiding principles, processes and tools that,
when taken together, outline a road map for strengthening health information systems
(WHO 2008c:2).
Reporting. This is the culmination of a series of conditional events (eg laboratory
confirmation, laboratory testing) (Novick, Morrow & Mays 2007:409).

9
Recording. This is the orderly process by which one indicates a total plan of
procedures directed towards specific stated goals, each designed to prevent disease or
enhance the health of an individual or community (Kirch 2008:1228).
1.8 RESEARCH METHODOLOGY
1.8.1 Research design
A descriptive, cross-sectional quantitative design was used for this study to describe the
factors influencing the quality of data for TB management in Oshakati District, Namibia.
The advantages of this study design are its appropriateness for describing the status of
phenomena or relationships at a fixed point while bearing in mind the resources
available to conduct the study (Polit & Hungler 1999:162).
1.8.2 Population of the study
The study population can be defined as that group of people, items, objects or elements
who meet the designated set of criteria for the study and about whom one wants to
draw a conclusion(s) (Babbie & Mouton 2003:100).
In this study population involved different cadres of nurses working at the Oshakati
State Hospital from different departments, namely; TB clinic, TB ward, HIV clinic,
medical wards for both male and female patients. Student nurses were also included in
the study since Oshakati State Hospital is a training institution for registered nurses.
The population for this study is fully described in chapter 3 of this dissertation.
1.8.3 Sampling technique used for this study
Random stratified sampling technique was used for this study in order to select a
representative sample of participants from the target population. This technique is
applied, to give every homogenous group of the target population an opportunity to be
represented in proportion to the number of its members in the population. According to
Kothari (2004:77), stratified sampling tends to yield more reliable results and provides
detailed information. In addition, it assists in sharpening the precision and
representativeness of the final sample (Polit, Beck & Hungler 2001:242). The sampling
technique is fully described in chapter 3 of this dissertation.
10
1.8.4 Data collection
Data was collected by means of a semi-structured questionnaire designed by the
researcher. A questionnaire which was written in English was distributed to 50 study
participants. It included both close-ended and open-ended questions. This was done in
order to gather more in-depth information that would not have been captured in the
structured questions. All the questions on the questionnaire were fully explained to
participants. According to Polit et al (2001:269), this method of data collection tends to
be more reliable, since it reduces the chances of misinterpretation by respondents.
1.8.5 Data analysis
Data was coded, entered into an MS Excel spreadsheet and analysed by means of
descriptive statistics which included the use of frequencies and percentages, which
were presented using tables and graphs. In order to determine associations between
demographic characteristics and factors influencing data quality, a chi-square test was
used which also evaluated the level of significance between these variables. The
assistance of Statistical Package for Social Sciences (SPSS) version 3.0 was sought for
analysis.
1.8.6 The concept of validity
Validity is defined as the degree to which an instrument measures what it is supposed
to be measuring (Polit et al 2001:308). To ensure internal validity, all participants were
given the same questionnaire which contained the same questions. The tool was pre-
tested using five nurses who were not included in the main study. The aim was to
ascertain if the tool measured what was intended. In addition the tool was reviewed by
the study supervisor and revisions were made according to recommendations provided.
1.8.7 The concept of reliability
Reliability is the consistency with which a measuring instrument yields certain/similar
results when the entity measured has not changed (Leedy & Ormond 2005:29). The
same questionnaire was applied to collect data from the participants. The researcher
personally undertook data collection with the aim of ensuring the reliability of the
information collected.

11
1.8.8 Ethical consideration
A permission letter (annexure 1) was requested and obtained from the medical
superintendent of the study site to conduct the study. The researcher further ensured
that the research was in line with all ethical guidelines, by obtaining informed consent
from the participants prior to conducting the study but after providing them with a
detailed information about the aim and objectives of the study. This was done to ensure
that participants were aware and willing to be involved in the study.
Scientific honesty on the part of the researcher was insured by obtaining approval from
the Research and Ethics Committee of the Department of Health Studies at the
University of South Africa (Unisa). In addition, consent was obtained from the
management team of Oshakati State Hospital, including informed consent from the
study participants. The final dissertation will be shared by both Unisa and Oshakati
District Management (Emmanuel, Wendler & Grady 2000:2701).
1.9 LIMITATIONS OF THE STUDY
The findings in this study are limited to nurses working at Oshakati State Hospital, as
the main point of entry for diagnosis of TB patients in Oshakati District. Since the study
was done in a specific context, findings cannot be generalised; but the study could be
replicated in other hospitals outside Namibia. Also, the recommendations are based on
the findings and may not be relevant to other areas in Namibia.
1.10 STRUCTURE OF THE DISSERTATION
This study consists of five chapters:
Chapter 1 Orientation to the study
Chapter 2 Literature review
Chapter 3 Research design and methodology
Chapter 4 Data analysis and presentation of data
Chapter 5 Conclusions, recommendations and limitations of the study

12
1.11 CONCLUSION
This chapter outlined the background to the research problem and highlighted the fact
that the success of TB programmes relies on quality data generated at facility level. This
ultimately contributes to monitoring of progress towards achievement of desirable TB
treatment outcomes. The main purpose of the study was to investigate factors
influencing the quality of data in TB control programmes in Oshakati District, Namibia. In
chapter 2, a review of the literature will be provided.
13
CHAPTER 2
Literature review
2.1 INTRODUCTION
This chapter furnishes an in-depth understanding of the concept of data quality, its
historical development, variables, dimensions and consequences. It also outlines the
models and theories explaining the basis of data quality and the independent variables
influencing it. The chapter further critically examines the findings of previous related
studies conducted on this subject. The researcher subsequently illustrates the
conceptual framework of the research and describes the gaps it intends to fill for this
particular study.
2.2 DATA QUALITY
The WHO‟s (2003a:10) guidelines of adopted the definition by Donebedran (1988) who
defined data quality as consisting of the ability to achieve desirable objectives using
legitimate means of data acquisition. In addition, the document provides Adbelbak‟s
(1996) definition which states that quality represents what was intended or defined by
their official source, and that data are objective, unbiased and comply with known
standards.
The WHO‟s (2003a:10) guidelines and Battin and Scannapieco (2006:6) display
similarities regarding the components of data quality which include the following:
Accuracy of the original source data.
Reliability of data must be consistent and information generated must be
understandable.
Completeness of all required data must be presented.
Legibility of data is crucial.
Currency and timeliness which include data recording at the point of
observation.
Accessibility of data to authorised persons when and where needed.

14
Meaningful or usefulness of data collected information is essential (WHO
2003a:10).
2.3 IMPORTANCE OF THE QUALITY OF DATA
A famous statement by Florence Nightingale aptly captures the performance-quality-
management relationship. She stated that “the ultimate goal is to manage quality, but
you cannot manage it until you have a way to measure it if you cannot monitor it” (Arch,
Khazinga & Delnoi 2003:377).
Sound and reliable information forms the foundation of decision-making across all
health systems. The WHO (2008c:3) toolkit draft states that data is essential for all such
systems, specifically in areas such as the policy development and implementation,
governance and regulation, health research, human resource development, health
education and training, service delivery and financing (WHO 2008c:2). The data
collected assists in assessing a programme‟s performance, and therefore, contributes
towards the development of a plan for the improvement of performance (WHO 2008c:4).
This is further emphasised in the 2003 WHO‟s (2003a:10) guidelines which proclaim that
quality data is crucial, not only for use in patient care but also for monitoring the
performance of health services and employees (WHO 2003a:11).
Quality data is gaining visibility daily as an important element in data management.
According to Olson (2003:29), the challenge of the lack of management of the content
of data collected is emerging as a major issue. This has had a negative impact on
organisations where the lack of quality data is causing large losses in money, time and
missed opportunities for effective interventions. This is also applicable in public health,
whereby data is routinely used to identify areas of improvement that will subsequently
assist in the control of diseases in community health services. The author further states
that quality data requires careful attention to the design of systems, constant monitoring
of data collection and aggressive anchors to correct problems that generate or
propagate inaccuracies in data management (Olson 2003:30).

15
2.4 QUALITY ASSURANCE IN HEALTH CARE
Donabedian and Bashshur (2003:1) defined quality assurance as all actions taken to
establish, protect, promote and improve the quality of health care. Quality assurance
also involves monitoring and maintaining of the quality of health programmes and
services. This involves licensing and training of health professionals, licensing of health
facilities and enforcing compliance to set standards and related regulations. Rowitz
(2009:25) concurs with most studies reviewed wherein quality assurance is a term used
interchangeably with continuous quality improvement (CQI).
The main components of quality assurance, according to Donabedian and Bashshur
(2003:3), include
system design and resources
performance monitoring and readjustment
Professional recruitment, training and certification are conducted in terms of system
design and resources. This also includes the number and distribution of items of
equipment and licensing of hospitals and health care facilities. On the other hand,
performance monitoring and readjustment are components wherein information is
obtained about the level of quality produced by the health system and that information is
interpreted so as to take the action needed to protect and improve quality. This may
take two forms, namely (Donabedian & Bashur 2003:4):
Activities meant to educate and motivate persons directly
Readjustment in system resources and design
2.5 KEESLER MODEL
The Keesler model (as shown in figure 2.1) illustrates the importance of constructing an
information management system that requires quality data for quality decision-making
(Hakim 2006:150). This model is used at the Keesler Medical Centre (United States of
America [USA]). This model emphasises that data quality is a mantra of everyone in the
organisation. This supports the production of quality data that assists in ensuring a solid
foundation for decision-making. Ramsaroop, Marion, Doughlas and Beaulieu (2001:149)
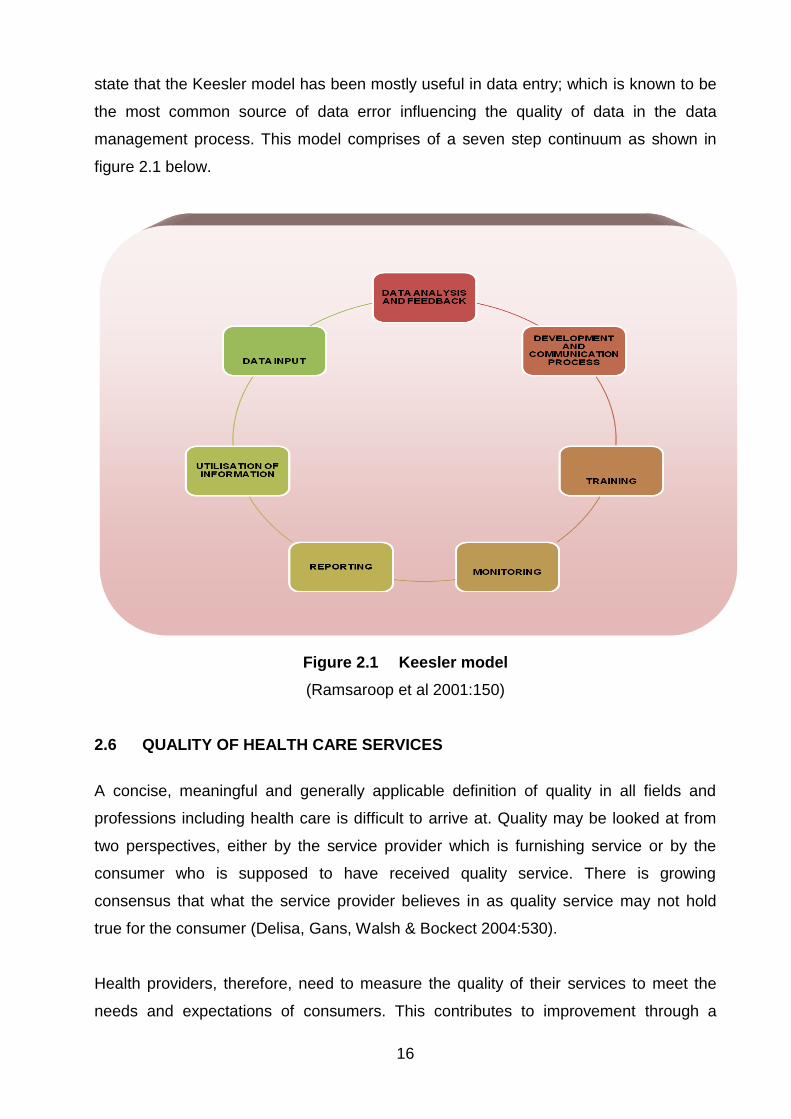
16
state that the Keesler model has been mostly useful in data entry; which is known to be
the most common source of data error influencing the quality of data in the data
management process. This model comprises of a seven step continuum as shown in
figure 2.1 below.
Figure 2.1 Keesler model
(Ramsaroop et al 2001:150)
2.6 QUALITY OF HEALTH CARE SERVICES
A concise, meaningful and generally applicable definition of quality in all fields and
professions including health care is difficult to arrive at. Quality may be looked at from
two perspectives, either by the service provider which is furnishing service or by the
consumer who is supposed to have received quality service. There is growing
consensus that what the service provider believes in as quality service may not hold
true for the consumer (Delisa, Gans, Walsh & Bockect 2004:530).
Health providers, therefore, need to measure the quality of their services to meet the
needs and expectations of consumers. This contributes to improvement through a
17
specific sort of practice, intervention, or policy that aims at the targeted population
through collective means. According to Dawson and Verweij (2007:25), this type of
approach emphasises that public health interventions are not primarily actions of
individual persons, but involve some form of collective action.
2.6.1 Total quality management/continuous quality improvement
Roussel, Swansburg and Swansburg (2006:406) define total quality management
(TQM) as a structured systematic process for planning within an organisation. TQM is
also defined as a state of mind; it is work ethics involving everyone in the company and
involves participative management. The process of making decisions at lower levels
within the organisational hierarchy is also incorporated in this model.
TQM emphasises collective responsibility versus individual responsibility, accountability
versus autonomy, participatory versus administrative control, professional authority and
benchmarking versus responding to complaints; these are common in other styles of
management (Roussel et al 2006:406).
2.6.2 Approaches of measuring quality
There are various approaches that are used to measure quality. Customarily the client
satisfaction method is commonly employed in doing so, which is primarily applied in
health care to measure the quality of care. It should be noted that while using these
tools to measure quality, one should avoid bias; giving customers freedom to complain if
they wish. Delisa et al (2004:1185) stated that the point of these surveys is to gather
information rather than manipulate a response to gain approval. Findings from a
systematic review conducted in the United Kingdom to assess client satisfaction about
the care rendered, recommended that certain issues need to be addressed to improve
quality of data collected during these surveys. Such aspects included the best approach
to be used in conducting such surveys, and strategies to ensure that results are acted
upon (Crow, Gage, Hampson, Hart, Kimber, Storey & Thomas 2002:76).
Furthermore, using the audit tool in staff review committees to measure quality is an
approach described by Gillam, Yates and Budrianath (2007:272), whereby audit tools
are designed to monitor client specific aspects of certain levels of care. They may either
18
be concurrent, which evaluates the quality of ongoing and retrospective care, or take
the form of an outcome audit, which evaluates quality after discharge. Jamtvedt, Young,
Kristoffersen, O‟Brien and Oxman (2006:13), state that audit feedback can be effective
in improving professional practise. Additionally, they emphasise the need to measure
practise with an aim to identify when efforts to change practise are needed.
Anomy, Preece and Ubrany (2002:171), however, stated that clinical audits emphasise
high quality at the lowest cost. They press for greater performance rather than
necessarily the best. The shortcoming for these audits is that they limit patient
involvement, unlike the client satisfaction surveys.
2.7 FACTORS INFLUENCING DATA QUALITY DATA IN HEALTH PROGRAMMES
WITH A FOCUS ON TB PROGRAMMES
Quality data is an important component in ensuring that data used in monitoring and
evaluating programme activities is accurate and valid. Braga (2007:2) insists that good
quality information is essential to evaluate the magnitude of disease transmission in a
country and to define the goal of how many cases will be treated. He further
emphasises that poor quality information hinders one from evaluating whether action
has been taken or whether the data has not been suitably entered into the information
system.
2.7.1 Knowledge and training
Capacity building is a term used by many organisations in their quest to improve the
quality of service. This term is used mainly when referring to improving the knowledge
of individuals. However, a study in Zambia, which was used to assess the impact of the
quality assurance programme, revealed that staff faced „peer inertia‟ in their facilities
(Bouchet, Francisco & Ovretveit 2002:90). This was influenced by the following factors:
The small proportion of staff trained in each facility.
Lack of trainee capacity to transfer their knowledge to their peers.
Lack of authority of the trainee over the rest of the staff.
Lack of follow up and technical supports (Bouchet et al 2002:90).

19
Similar sentiments are also expressed in a cluster randomised control study conducted
in South Africa (SA) between 1996 and 2000 in nurse managed ambulatory primary
care clinics (Lewin, Dick, Zwarenstein & Lombard 2005:250). The authors further
indicated that health services and policy managers often assume that professional
practice can be altered by training. The authors further quote the “Stop TB” Annual
Review of 2003 which reports that 10 out of 22 high burden countries reported major
deficiencies in staffing at the central level. This was further associated with
inappropriate curricula that were not needs-based.
A retrospective study conducted in Zambia to assess the Ministry of Health records on
TB notification was conducted between 1964 and 2001. The study noted a twelve fold
TB case notification increase over the previous two decades. However, researchers
were concerned about the accuracy of the data used which seemed to be dependent on
several factors and a major critical one being a lack of capacity in the Ministry of Health
to analyse data from the records that contained the annual returns from the provinces.
The study further revealed that between 1997 and 1999, there was no data on CNR.
One assumption made by the researchers was that there may have been a lack of
trained staff who would identify this gap early (Moboshe, Chintu, Squire, Nyirende,
Sunkutu & Zumla 2003:150).
There is a prevailing assumption that the more work experience one has gained the
better the quality of care offered. A study relating to medical knowledge and health care
quality revealed that 32 (52%) of 62 evaluations reported decreasing performance of
medical practitioners with increasing years in practice (Choudhry, Fletcher & Soumerai
2005:269). The authors attributed this to the explicit knowledge of the physicians being
outdated, compared to medical advances over time.
Zurovac, Rowe, Ochola, Noor, Midia, English and Snowal (2004:1084) conducted a
study in Kenya to assess the effect of pre-service training aimed at improving the quality
of health worker treatment practices for uncomplicated malaria. They found that
effectiveness of pre-service training depended on the availability of second line drugs.
Several reasons were given for this, one being that health care workers (HCW) may not
be acquainted with how to prescribe second line drugs, and therefore avoid using them.
The study further revealed that the lower cadre of nurses would rather use the treatment
20
algorithms than guidelines; this is unlike the practice of clinical officers and the higher
cadre of nurses. The reason posited for this was that the algorithms employ less
medical vocabulary as opposed to that of the guidelines (Zurovac et al 2004:1089).
2.7.2 Attitudes and quality data
The experience in Peru where a descriptive study was conducted to assess laboratory
information revealed that the staff felt that the design of the information system did not
meet their needs. Lessons learnt emphasised the importance of involving stakeholders
in designing and implementation. Emphasis was placed on constantly consulting the
users‟ questions about the system, the problems faced and on searching for practical
solutions (Blaya, Shin, Yagu Yale, Suarez, Ascencios, Cegielsk & Fraiser 2007:44).
Referring back to the study in the Zambia Quality Assurance Programme discussed in
the previous section, this provides further evidence that health workers‟ attitudes to
quality control affect quality assurance programmes. However, the assessment
revealed that health workers stated that guidelines were of limited use when it came to
changing their everyday practice. One reason given for this was the discomfort of
appearing ignorant if one consulted the guideline in front of a patient (Bouchet et al
2002:89). This further emphasises the assumption noted by Lewin et al (2005:256) in
terms of which health service policy makers and managers often presuppose that
professional practice can be changed by training.
In Malawi, Chaulagai, Kott, Moyo, Sambunkusi, Khunga and Maphini (2005:375)
concluded that no matter how good the design of an information system is, it will be
influenced by an individual‟s attitude. This is as a result of implementation of vertical
programmes that have separate reporting requirements. This affects the health workers
attitudes who feel burdened with the frequent reporting requirements. The attitudes are
further influences their attitudes towards quality data when they do not comprehend how
the data is used in decision making that influences their daily operations. The authors
emphasised the fact that the effectiveness of a system depends on the internal desire,
dedication and commitment of leadership to set an effective health service management
regime in place.

21
Similar sentiments to those stated in Mozambique were expressed in Malawi while
developing its HMIS. In Malawi, the study states that despite the emphasis on
maximising the use of data collected at local levels, the habit of regarding the collection
of data as only being for reporting purposes is still deeply rooted in the system. This has
resulted in Malawi experiencing issues related to completeness of data, affecting the
indicator value generated from routine data; this result in the indicator always being
lower than the actual, leading to reports being adjusted (Chaulagai et al 2005).
An assessment of the roles of laboratories in the effectiveness of TB programmes
acknowledged the need of well trained staff in quality management. Ridderhof, Devin,
Kam, Marayanan and Aziz (2007:354) argue that, without these in place, the result may
be that clinicians forego the results of existing laboratory services in diagnosis and
treatment. This is a common phenomenon where there is lack of trust and credibility
concerning the quality, accuracy and validity of laboratory results.
As noted in the Malawian situation, guidelines are not always consulted due to feelings
of inadequacy in the presence of patients; this contributes to poor quality data. In SA,
Bheekie et al (2006:261) state that there are many factors that would influence the
implementation of guidelines; these authors note that guidelines should be easily
applicable to routine practice which takes into consideration local needs of practitioners.
The study further states that internally produced guidelines and tailored interventions
were found to be more effective than those delivered from the top down. The paper
quotes Harvey and Latson (1996) who emphasise that „ownership‟ is created by
providing a sense of control over the direction of the programme. This eases the
implementation of quality improvement.
According to the systematic review by Choudhry et al (2005:269), cited above, one
reason given for older physicians‟ decline in performance was related to a decrease in
their factual knowledge. It was assumed that perhaps the physicians‟ toolkits received
during training were not regularly updated which resulted in a lack of familiarity with
evidence-based medicine and quality assurance techniques. The more experience they
had, the greater their seeming resistance to changes.

22
2.7.3 Practices and data quality
Practices are a variable that is closely linked to knowledge and attitudes. A good
example is evidenced by views from Mozambique, which showed that daily work at
health facilities is primarily patient-focused so that registration and reporting is viewed
as a secondary task. The primacy given to patient encounters has an adverse impact on
data collection procedures. A study quotes the example of condom or drug distribution,
“often the number of patients seen or condoms and drugs distributed will be estimated
at the end of the day and entered into register books”. This is due to the attitude that
this information is not used for logistics (Baltazaar & Margunn 2004:18).
Lack of infrastructure to support HMIS is noted to affect the relaying of information to
the next level in Mozambique. This resulted in weekly reports being delivered late.
Appropriate books and registers are not supplied, forcing facility staff to revert to other
forms of stationery in which data recorded may vary (Baltazaar & Margunn 2004:19).
A report in Indonesia assessing the extent to which rural communities seek care prior to
diagnosis revealed limitations attributable to the proportion of incomplete data. The
study notes that despite regular feedback that was provided to health workers on gaps
identified, there seemed to be no improvement in the part of health workers in
administering data collection tools correctly. This led to incomplete data, thus delaying
many patients‟ starting on TB treatment (Mahendradhata, Syahrizal & Utarini 2008:396).
In a study conducted in Peru, while implementing their new laboratory information
system, the e-chasque (a system that provides feedback to the user), users became
enthusiastic when they realised that the system would provide them with useful
information. Unlike the previous information system which required health centre
personnel to enter data for reporting without receiving feedback, the new system was
followed by continuous training of system users and assistance in monitoring its use;
this ensured it would continue to meet users‟ needs (Blaya et al 2007:37).
The practice of providing feedback was also applied in the transformation of the
Malawian HMIS. This was supported by quarterly feedback, supportive supervision and
an annual review. The Malawian Health Management Information System (HMIS) faced
23
problems with incorrect diagnosis, as well as wrong coding and entry of incorrect fields.
These problems were gradually minimised through systematic data verification and
feedback on flows and inconsistencies (Chaulagai et al 2005:377).
An assessment of China‟s mortality registration states that a checking system is in
place. This system evaluates timeliness of registration of deaths, completeness of
entries in the registration form and accuracy of data entry. Errors detected from these
checks were corrected through re-inquiry, which enhanced the usability of the datasets
(Yang, Itu, Rao, Ma, Rao & Lopez 2005:10).
The perception of collecting data purely for administrative purposes is common in most
settings. A study by Hangaro, McPake and Vickerman (2005:287) states that data in
most developing countries is mainly collected for such purposes; this results in the
information being viewed as of no value. It is, therefore, perceived as bureaucracy, as
emphasised in the article on the Mozambique Ministry of Health situation (Baltazaar &
Margunn 2004:1).
2.8 CONCEPTUAL FRAMEWORK
The conceptual framework is a pictorial representation of the variable of interest in the
study and relationship between them. In this study, the researcher presents a summary
of literature review which relates to and is pertinent to quality data in special
programmes with emphasis on TB programmes. The literature review is not exhaustive
but the work of various authors indicates that improving knowledge through adopting
appropriate training programmes, change of attitudes of health workers towards data
collection with its relevance to their work and practices that influence data quality.
Feedback and supportive supervision have been found to improve the quality of data of
health programmes.
The main variables in this study are, therefore, knowledge, attitudes and practices.
These variables are considered in the study as independent variables. The variables will
be analysed in relation to quality data, which is the dependent variable. The relationship
between the independent and dependent variables is as summarised below in the
schematic diagram given below.

24
Figure 2.2 Conceptual framework
(Source: Researcher 2009)
2.9 CONCLUSION
This chapter discussed the literature review on factors influencing the quality of data in
TB programmes including similar health programmes. Factors like training, knowledge
on use of existing data collection protocols, attitudes of health workers with regards to
the usefulness of data collected and practises influenced the quality of data.
Chapter 3 will discuss the research design and methodology used in this study.
KNOWLEDGE
ATTITUDES
PRACTISES
QUALITY DATA
INFLUENCES
(INDEPENDENT VARIABLES)
(DEPENDENT VARIABLES)

25
CHAPTER 3
Research design and methodology
3.1 INTRODUCTION
This chapter discusses the research methodology and the study design that was
adopted for this study. The sampling method, data collection tool and procedure are
also presented in this chapter. Ethical considerations, the reliability and validity
measured applied in this study are also presented. Research methodology refers to
methods and procedures used in implementing research designs (Babbie & Mouton
2003:64).
3.2 RESEARCH METHODOLOGY
3.2.1 Research design
Research design is a plan that the researcher follows to be able to answer research
questions and respond to the problem statement (Babbie & Mouton 2001:64).
A descriptive contextual cross-sectional design was used for this study in order to
identify and describe factors influencing data quality for TB control programme in
Oshakati District, Namibia. The study used a quantitative approach. According to Polit
and Hungler (1999:440), cross-sectional studies are appropriate for describing
relationships among phenomena occurring at a fixed point in time.
3.2.2 Research setting
The study was conducted at Oshakati State Hospital, Namibia. According to the current
Oshakati District staff establishment structure (MoHSS 2008c), the district health team is
headed by the principal medical officer who is responsible for all the health services in
the district; this includes both the clinical and primary health care services. The clinical
services are provided by the Oshakati State Hospital and the clinical personnel
comprises of doctors, registered nurses and enrolled nurses. Oshakati District lacks a
district hospital, which is customary in other districts as the state hospital is one of the

26
three intermediate hospitals in the country. Oshakati District was choosen as a study
setting as it houses one of the intermediate hospitals, the Oshakati State Hospital. This
institution serves the four north central region in Namibia and quoted by the National
Planning Commission as the highest populated regions in Namibia (National Planning
Commission 1997:20).
3.3 RESEARCH METHOD
According to Polit and Hungler (1999:440), a research method is composed of steps,
procedures and strategies used by the researcher to investigate a research problem.
The discussion of the research method includes the population, sample and sampling
technique, data collection process and data analysis method.
3.4 POPULATION
The population targeted in this study was that of nursing staff currently working at the
Oshakati State Hospital at the time of the research study. They were sourced from the
following departments at Oshakati State Hospital: TB Clinic, HIV Clinic, TB Wards and
Medical Wards (male and female wards).
These departments were chosen as they are the most common point of entry for TB
diagnosis in Oshakati District. The targeted population was available during working
hours; this is between eight o‟clock in the morning and five o‟clock in the evening.
The Oshakati State Hospital makes use of a staff establishment document that lists all
the staff currently working in the hospital according to their various departments and
nursing cadre. This was duly consulted during this study.
3.4.1 Sample and sampling technique
Sampling is the process of selecting a number of individuals, items, elements or objects
from the larger population of the study in such a manner that they are representative of
the study population from which they are selected (Polit & Beck 2008:339). In this study
stratified random sampling where the targeted population was divided according to
department was used to purposively select a sample focusing on the targeted

27
departments at the Oshakati State Hospital, which served as the sampling frame for the
study.
According to Polit et al (2001:241), this sampling technique can sharpen the precision
and representation of the final sample. Stratified random sampling is further regarded as
desirable to obtain information about subpopulations whose membership is relatively
small (Polit & Beck 2008:346).
A total number of 101 nurses who included student nurses attached to the targeted
departments were identified. As stated in section 1.8.2 Oshakati state hospital and
some departments this contributed to a higher proportion of students nurses compared
to qualified nurses. The study was conducted at a time when the student nurses in the
attached departments had completed their final examination for the year, and winding
up the clinic hours for the course. According to the nurse in charges the student nurses
at this level were able to fill the records with minimal supervision. This was viewed as a
possible area that would contribute to the quality of data in the unit. Table 3.1 below
shows the distribution of the targeted population according to department and nursing
cadre.
Table 3.1 Distribution of target population (N=101)
DEPARTMENT NURSES ON DAY SHIFT
REGISTERED NURSES
ENROLLED NURSES
STUDENT NURSES
TB CLINIC 9 2 2 5
TB WARD 16 6 6 4
HIV CLINIC 12 6 4 2
MALE WARD 20 7 6 7
FEMALE WARD 28 11 10 7
SPECIAL PROGRAMMES/PHC
16 5 7 4
TOTAL 101 37 35 29
(Source: MoHSS 2008C)
The total number of study participants selected from the sampling frame of 101 was 50
nurses. The sample size was chosen at a ratio of 2:1 as stated in the proposal. This
took into consideration the three shifts nurses‟ work in three out of the six targeted
departments (that is morning, afternoon and night shifts) and also the regulation
provided to the researcher of not conducting any interviews after five in the evening.
28
The participants who met the selection criterion were asked to voluntarily participate in
the study, until the required sample size was reached. According to Polit and Hungler
(1999:489), power analysis builds on the concept of effect size: the latter is concerned
with the strength of the relationships among research variables. This assisted the
researcher to choose the most effective sample size that would demonstrate the
relationship statistically.
3.5 DATA COLLECTION
Data collection is a systematic process in which a researcher collects relevant data from
respondents by asking questions or opening a conversation about a phenomenon as
well as reading about a phenomenon under study (Polit & Beck 2008:369).
3.6 DATA COLLECTION METHOD
Data collecting tool used in this study was a questionnaire which consisted of both close
and open-ended questions. This instrument followed the guidelines recommended by
the WHO in developing the knowledge attitudes beliefs and practises surveys (WHO
2008d).
The data collection approach used was face to face interviews. This method was
adopted owing to the different categories of respondents who were part of the study,
with different levels of training and years of working experience. As attested in Sims and
Wright (2000:72) this method of data collection assists in reducing structured complexity
in the questionnaire. Sims and Wright (2000:72) add that face to face interviews assist
in reducing the number of questions omitted, as compared to self-administered
questionnaires. They also provide an opportunity to probe and ask for clarification. Polit
and Beck (2008:415) likewise emphasise that face-to-face interviews increase the
response rate.
The study‟s data collection instrument was limited to the three independent variables
these were knowledge, attitudes and practices that influence the quality of data in the
TB programme in Oshakati District. This assisted in ensuring the validity of the
questionnaire, since the questions were designed to answer the issues related to the
research variables (Wood & Brink 2005:204).
29
Data collection tool was divided in two parts: the first part collected demographic data
which included:
Demographic information
Academic information
Work experience
Department where staff are working
Current position
The second part of the questionnaire gathered data that described factors that
influenced data quality for TB control at Oshakati State Hospital. This section was
limited to knowledge, attitudes and practices related factors and other relevant factors.
The questionnaire for this study is included in annexure 9.
3.7 DATA COLLECTION PROCESS
Data collection process took one month to be completed, as it was influenced by the
workload in the department and the availability of identified study participants during the
month of November 2009.
The study participants were then taken through the study, and were given information
regarding what was involved and how this information would be used. The information
sheet as indicated in annexure 4 was used as a guide during this process. This
document contained the researcher‟s contact details which aimed to address any other
concerns of the study participants. This was then followed by their signing a consent
form before the commencement of the interviews.
Information was then collected using face-to-face interviews in the office assigned by
the nurse in-charge in the respective department. The researcher choose to conduct
face to face interviews as opposed to the study participants filling in the questionnaire
due to the different level of qualifications of the study participants, some study did not
have a good command of the English language and would need further clarification and
rephrasing of the questions. The questions were asked in the exact sequence as it
appears in the final questionnaire.

30
3.8 PRE-TESTING OF THE INSTRUMENT
Pre-testing of the instrument was done using five nurses who from the same hospital
and the selected departments but who were not part of the sample for the main study.
This was done in order to make the tool to be more appropriate and user friendly, to
validate if the questions asked were clear and relevant and also to determine the time
taken to complete the questionnaire. This also enabled the researcher to identify
commonly misunderstood questions. Furthermore, the researcher got feedback on the
validity of questions asked and the validity and reliability of the tool was established and
confirmed.
The main areas that was adjusted was in relation to the options available to the
respondents. The researcher added not sure as a response. This was necessitated as
the respondents in the pre-testing session indicated that that they were sure which
response to provide amongst the options listed; this was in relations to attitudes and
practises. Additionally, the not applicable option was added as some of the options
related to TB training attended did not apply to some respondents. Once the data
collection tool was tested and actual adjustments made, the actual data collection
proceeded.
3.9 DATA ANALYSIS
Data was analysed by means of descriptive statistical methods, which are used when a
study does not intend to generalise beyond the study sample, as indicated by Wood,
Kerr and Brink (2005:247-248). Analysis of the data was done in consultation with a
statistician at the Kenya bureau of statistics, by means of SPSS version 3.0 for
Windows. This statistical package was used to analyse measures of central tendency
calculated which included the means of the individual independent variables as they
occur.
As observed in Polit and Hungler (1999:450), the mean is the most appropriate index in
situations in which the concern is for totals or the combined performance of a group. In
addition, the mean is a stable measure of central tendency and tends to fluctuate less
than the mode and the median (Polit & Hungler 1999:450).

31
The information was also presented using frequency distribution tables and
percentages. Bar and pie charts were used to compare the responses from the study
participants. This assisted clearly represent the proportions of responses with regards to
various aspects influencing the quality of data as guided by the questionnaire. This type
of data presentation is recommended in Gemish and Lacey (2006:422) as being the
most suitable method to present categorised data.
Chi-square test is used to measure the significance of the results generated with the
assistance of the SPSS. On the other hand, linear regression was used to show
association, which would either be positive, negative or no association. As stated in
Polit and Hungler (1999:487), this test is recommended when data is placed in
categories and the research questions concern the proportions of cases that fall into the
various categories.
3.10 VALIDITY AND RELIABILITY
3.10.1 Reliability of the instrument
Reliability refers to the consistency, stability and repeatability with which an instrument
measures the attribute of concern in a research study (Polit et al 2001:305). This means
that if the same questionnaire is administered at different times and intervals the
responses should be the same.
In this study the results of the pre-testing of the instrument were compared with those of
the main study in order to test the reliability of the instrument.
3.10.2 Data collection reliability
To ensure reliability of the instrument the researcher developed the questionnaire in
consultation with the supervisor. The questions that were regarded as not clear were
revised accordingly. According to Babbie and Mouton (2003:250), it is better to ask
other people to complete the questionnaire rather than reading through it to look for
errors. In this case the researcher the pre-tested the questionnaire using face-to-face
interviews with five nurses at Oshakati State Hospital who were not part of the study.

32
3.10.3 Validity
Validity of an instrument is defined as the degree to which an instrument measures what
it is supposed to be measuring (Polit et al 2001:308). Polit et al (2001:193-194) defines
internal validity as the extent to which it is possible to make an inference that the
independent variable is truly influencing the dependent variable. While external validity
refers to generalisability of the research findings to other settings and samples. In this
study, the relevance and validity was ensured by employing content validity, construct
validity of the instrument and face validity as discussed below.
3.10.4 Content validity
Content validity refers to ensuring that all major elements relevant to the construct
which is being measured are included in the method of measurement (Burns and Grove
2003:793).
In order to ensure content validity the researcher had to gather knowledge about the
study phenomenon. This can be achieved by literature review of the area being
researched and reflected in the structure of the instrument.
3.10.5 Construct validity of the instrument
Construct validity is an evaluation of the degree to which an instrument measures the
construct the researcher wishes to measure (Kidder 1986:133). Pre-testing the tool and
the use of constructed groups ensured construct validity in this study. Construct validity
was also ensured by the study groups were mixed with different qualifications, they
were also drawn from different departments and had varied years of work experience.
3.10.6 Face validity
Face validity is defined as measurements which appear to be measuring an item under
study (Woods and Catanzaro 1998:557). In this study face validity was ensured by the
supervisor with expertise in research methods who on reviewing the instrument was
satisfied with its construction and the variables included.

33
3.11 ETHICAL CONSIDERATONS
Polit and Hungler (1999:701) define ethics as a system of moral values that is
concerned with the degree to which research procedures adhere to professional, legal
and social obligation to the study participants.
3.11.1 Permission to conduct the study
Ethical approval for this study was obtained from the Department of Health Studies at
Unisa (annexure 2). Permission was also sought and obtained from the Ministry of
Health in Namibia and the relevant authorities from Oshakati State Hospital (annexure
3). Informed consent was also obtained from the study participants prior to collecting
data (annexure 6). Furthermore, the researcher ensured rights to confidentiality,
anonymity, principles of justice and autonomy was maintained throughout the study.
3.11.2 Informed consent
During the actual data collection, the right to full disclosure of the purposes of the study
was employed, whereby a full description of the study was provided to the study
participants. The researcher also offered an opportunity for study participants to decline,
accept or clarify information before embarking on collecting information. The right to
self-determination and providing full disclosure of information are cited in Polit and
Hungler (1999:136) as two major elements upon which consent is based.
The researcher ensured that honest answers were provided when obtaining informed
consent from study participants. A standard information form adapted from Glatthorn
and Joyner (2005:10) was developed and supplied to all study participants (annexure
4).
3.11.3 Confidentiality and anonymity
Participants were assured that data collected from them would not be made accessible
to any person other than the researcher. This was done in order to maintain
confidentiality. The questionnaire was coded and no identifiable information was used,

34
this was done to ensure anonymity and to ensure that the information provided would
not be linked to a participant.
This practice prevents the researcher or any other person from linking a participant with
information, as emphasised by Polit and Hungler (1999:139).
3.11.4 Principle of justice
In this study participants were fairly selected for inclusion in the study and they were
treated with respect and dignity by using courteous and tactful approaches at all times.
The study participant had ready access to the researcher as contact details for further
enquiry was provided in the information sheet that was given to each respondent before
the beginning of data collection. Additionally, the study participants were selected using
random selection as indicated in section 3.4.1. According to Burns and Groove
(2005:190) random selection reduces biases which enhances fair selection of study
participants.
3.11.5 Persuasion
Participants were not persuaded or coerced to take part in this study, their participation
was voluntary. No financial incentives were given to them. Participants were informed
that they had the right to withdraw from the study or decline to answer any questions
with no consequence or penalties. In addition, the information sheet was used to
provide more information and an opportunity for clarification was provided. This was
done to ensure that the participants were fully informed about the study.
3.12 CONCLUSION
The research design and methodology were discussed in this chapter. The study
population, sampling technique and sample of the research was also discussed as well
as data collection method and process. Measures for ensuring ethical soundness for
this study were also described. The following chapter will present the results of data
analysis for this study.
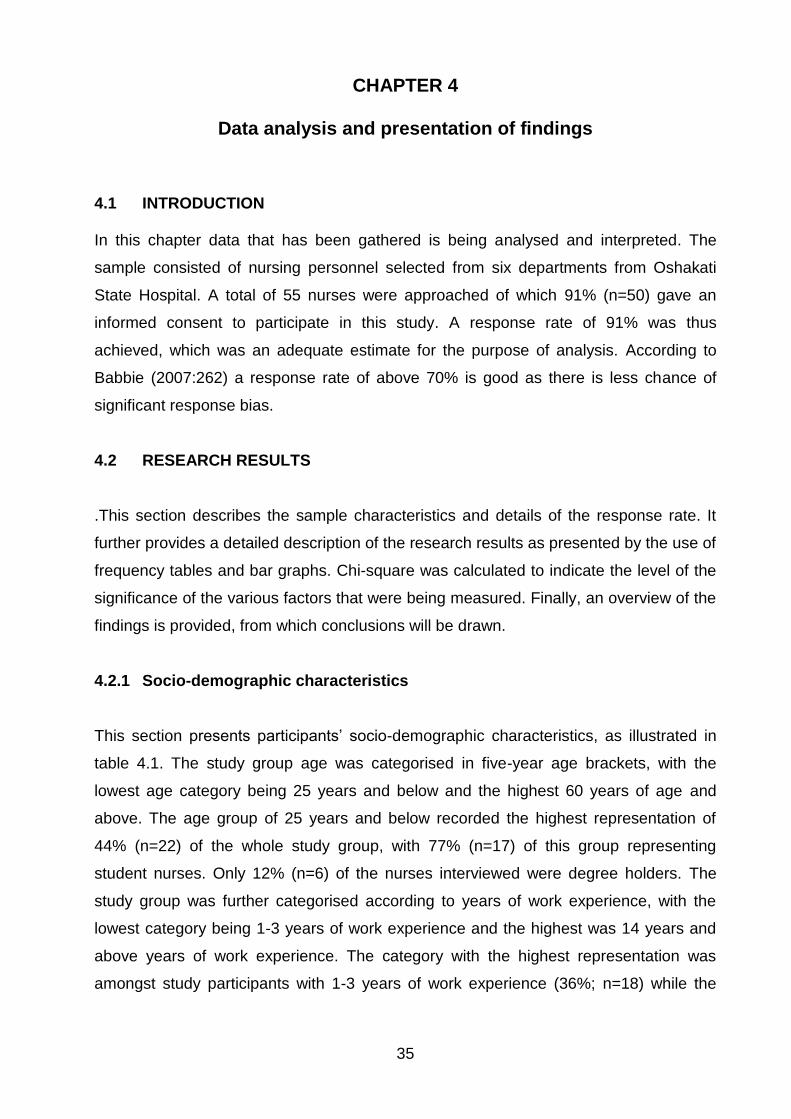
35
CHAPTER 4
Data analysis and presentation of findings
4.1 INTRODUCTION In this chapter data that has been gathered is being analysed and interpreted. The
sample consisted of nursing personnel selected from six departments from Oshakati
State Hospital. A total of 55 nurses were approached of which 91% (n=50) gave an
informed consent to participate in this study. A response rate of 91% was thus
achieved, which was an adequate estimate for the purpose of analysis. According to
Babbie (2007:262) a response rate of above 70% is good as there is less chance of
significant response bias.
4.2 RESEARCH RESULTS
.This section describes the sample characteristics and details of the response rate. It
further provides a detailed description of the research results as presented by the use of
frequency tables and bar graphs. Chi-square was calculated to indicate the level of the
significance of the various factors that were being measured. Finally, an overview of the
findings is provided, from which conclusions will be drawn.
4.2.1 Socio-demographic characteristics
This section presents participants‟ socio-demographic characteristics, as illustrated in
table 4.1. The study group age was categorised in five-year age brackets, with the
lowest age category being 25 years and below and the highest 60 years of age and
above. The age group of 25 years and below recorded the highest representation of
44% (n=22) of the whole study group, with 77% (n=17) of this group representing
student nurses. Only 12% (n=6) of the nurses interviewed were degree holders. The
study group was further categorised according to years of work experience, with the
lowest category being 1-3 years of work experience and the highest was 14 years and
above years of work experience. The category with the highest representation was
amongst study participants with 1-3 years of work experience (36%; n=18) while the
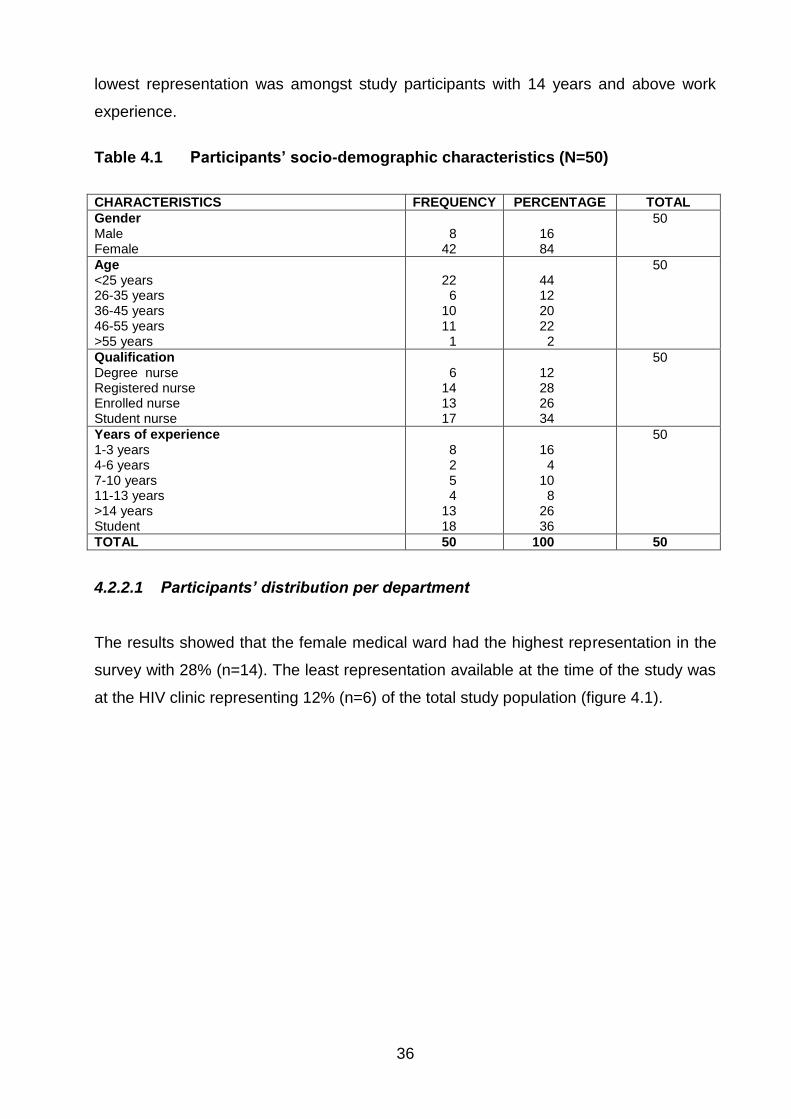
36
lowest representation was amongst study participants with 14 years and above work
experience.
Table 4.1 Participants’ socio-demographic characteristics (N=50)
CHARACTERISTICS FREQUENCY PERCENTAGE TOTAL
Gender Male Female
8
42
16 84
50
Age <25 years 26-35 years 36-45 years 46-55 years >55 years
22
6 10 11
1
44 12 20 22
2
50
Qualification Degree nurse Registered nurse Enrolled nurse Student nurse
6
14 13 17
12 28 26 34
50
Years of experience 1-3 years 4-6 years 7-10 years 11-13 years >14 years Student
8 2 5 4
13 18
16
4 10
8 26 36
50
TOTAL 50 100 50
4.2.2.1 Participants’ distribution per department
The results showed that the female medical ward had the highest representation in the
survey with 28% (n=14). The least representation available at the time of the study was
at the HIV clinic representing 12% (n=6) of the total study population (figure 4.1).

37
Figure 4.1 Distribution of respondents according to departments (N=50)
4.2.3 Factors influencing data quality
4.2.3.1 Participants’ level of knowledge
This section of the questionnaire assesses the knowledge level of respondents related
to components of data quality and the use of data collection tools. The respondents
were asked questions that assessed their knowledge on various components which
influence the quality of data collected in the TB programme.
4.2.3.2 Assessment of knowledge levels on various components related to data
collection and data quality
Study participants were asked to rank their knowledge level in relation to data collection
and data quality, with a score of 7 showing very high knowledge level while 1 to indicate
lack of knowledge. Overall, entering information into the ETR yielded the lowest mean
score of 2.63 and a Standard Deviation (SD) of 1.654, whereas filling in the TB records
led to the highest mean score of 4.69 with a SD of 0.796 (figure 4.2). The results were
however significant with regards to knowledge level reported on the use of TB records
in TB management, when compared according to position in department (p=0.05 and
r=0.054); this denotes a weak positive relationship.
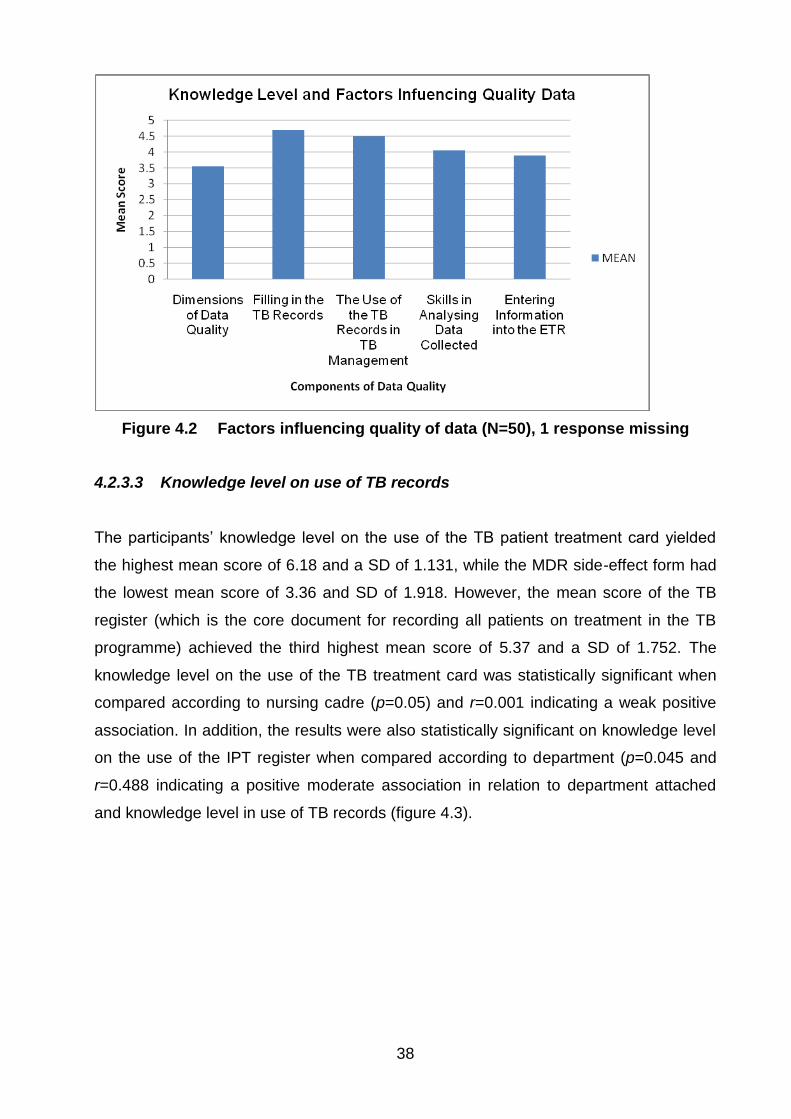
38
Figure 4.2 Factors influencing quality of data (N=50), 1 response missing
4.2.3.3 Knowledge level on use of TB records
The participants‟ knowledge level on the use of the TB patient treatment card yielded
the highest mean score of 6.18 and a SD of 1.131, while the MDR side-effect form had
the lowest mean score of 3.36 and SD of 1.918. However, the mean score of the TB
register (which is the core document for recording all patients on treatment in the TB
programme) achieved the third highest mean score of 5.37 and a SD of 1.752. The
knowledge level on the use of the TB treatment card was statistically significant when
compared according to nursing cadre (p=0.05) and r=0.001 indicating a weak positive
association. In addition, the results were also statistically significant on knowledge level
on the use of the IPT register when compared according to department (p=0.045 and
r=0.488 indicating a positive moderate association in relation to department attached
and knowledge level in use of TB records (figure 4.3).
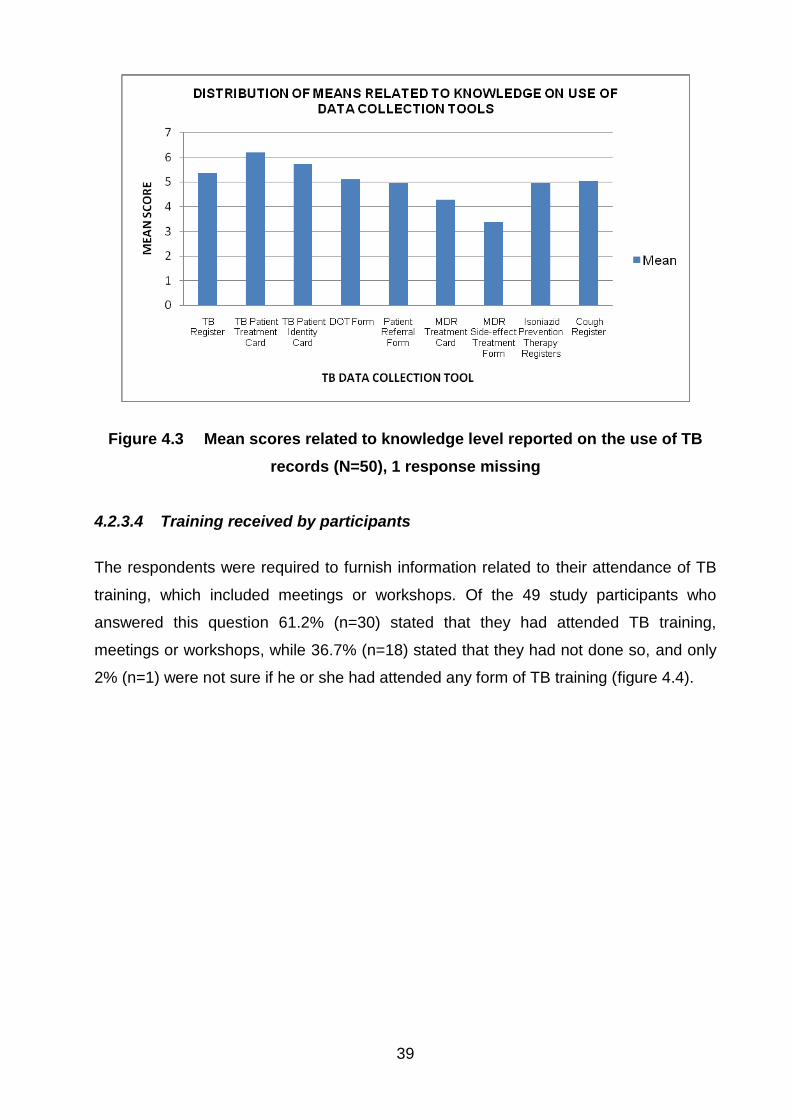
39
Figure 4.3 Mean scores related to knowledge level reported on the use of TB
records (N=50), 1 response missing
4.2.3.4 Training received by participants
The respondents were required to furnish information related to their attendance of TB
training, which included meetings or workshops. Of the 49 study participants who
answered this question 61.2% (n=30) stated that they had attended TB training,
meetings or workshops, while 36.7% (n=18) stated that they had not done so, and only
2% (n=1) were not sure if he or she had attended any form of TB training (figure 4.4).

40
Figure 4.4 Attendance of TB training (N=50), 1 response missing
4.2.3.5 Nature of training received by participants
A high proportion of 49% (n=24) of respondents indicated that they attended in-service
TB training, whereas only 2% (n=1) of respondents had attended „trainer of trainer‟
training. 37% (n=18) of the study participants had not attended any form of TB training.
This was indicated under the option not applicable.
49%
2%2%
6%4%
37%
TYPE OF TB TRAINING ATTENDED
In-service TB training
Trainer of trainer
TB review meetings
National TB meetings
International TB meetings or conferences
Not applicable
Figure 4.5 Nature of training received (N=50), 1 response missing

41
4.2.3.6 Distribution of nature of training received according to nursing carde
and position in department
Comparing the study participants‟ attendance of TB training according to their nursing
cadre, student nurses constituted the highest proportion of respondents with 24.5%
(n=12) who had attended in-service TB training. Enrolled nurses comprised the
category with the highest proportion of respondents of 18.4% (n=9) who had never
attended any form of TB training. The trainer of trainer workshops were only attended
by 2% of respondents categorised as special programmes/PHC nurses. International
meetings were attended by both nurse managers and special programmes/PHC nurses,
also at 2% in each group.
4.2.4 Participants’ attitudes
This section assessed the degree to which the respondents thought that different
attitudes and beliefs affect data quality. This was mainly carried out by ranking the
degree to which they agreed or disagreed with various statements in relation to
influencing the quality of data in Oshakati District.
4.2.4.1 Participants’ views on attitudes as a factor that influence data quality
Participants were asked about their views on various statements, which they provided
by giving a „yes‟, „no‟ or „not sure‟ response. The section will further compare responses
as described below. Frequency tables are presented and the chi-square used to
determine the level of significance of each category.
4.2.4.1.1 Training on data management
This section deals with how TB data is managed at various levels in terms of recording
and reporting. Of the study participants, 90% (n=45) agreed that TB training improves
correct recording and reporting. Only 8% (n=4) of the study participants disagreed with
this statement. There was triangulation of the data: comparing the information according
to the nursing cadre, years of work experience, department to which attached, position

42
in the department and p-values calculated to measure the level of significance of the
responses given (table 4.2).
Table 4.2 Distribution of TB training improving correct recording and reporting
(N=50), 1 response missing
RESPONSE FREQUENCY PERCENT VALID
PERCENT
CUMULATIVE
PERCENT
MISSING
YES 45 90.0 91.8 91.8
NO 4 8.0 8.2 100.0
TOTAL 49 98.0 100.0
SYSTEM 1 2.0
TOTAL 50 100.0
According to their cadre of nursing, 100% (n=14) of the registered nurses agreed with
the statement, that training improves correct recording and reporting. Of the
respondents who did not do so 50% (n=2) were enrolled nurses; p-value 0.377. The p-
value in this section is higher than 0.05, showing the results were not statistically
significant.
4.2.4.1.2 Number of training events, workshops and meetings by an individual staff
member improves data quality in the unit
Seventy six percent (n=38) of the respondents agreed that the number of training
events, workshops and meetings which an individual staff member attends improves the
data quality in the unit. However, 12% (n=6) were not sure.
According to years of experience 100% (n=12) of respondents with 14 years and above
work experience agreed that number of training events, workshops and meetings which
an individual staff member attends improves the data quality in the unit. The results
were statistically significant when compared according to years of work p=0.028 with
r=0.170 indicating a positive association between number of trainings attended and its
influence on quality of data in the TB control programme in Oshakati District (table 4.3).
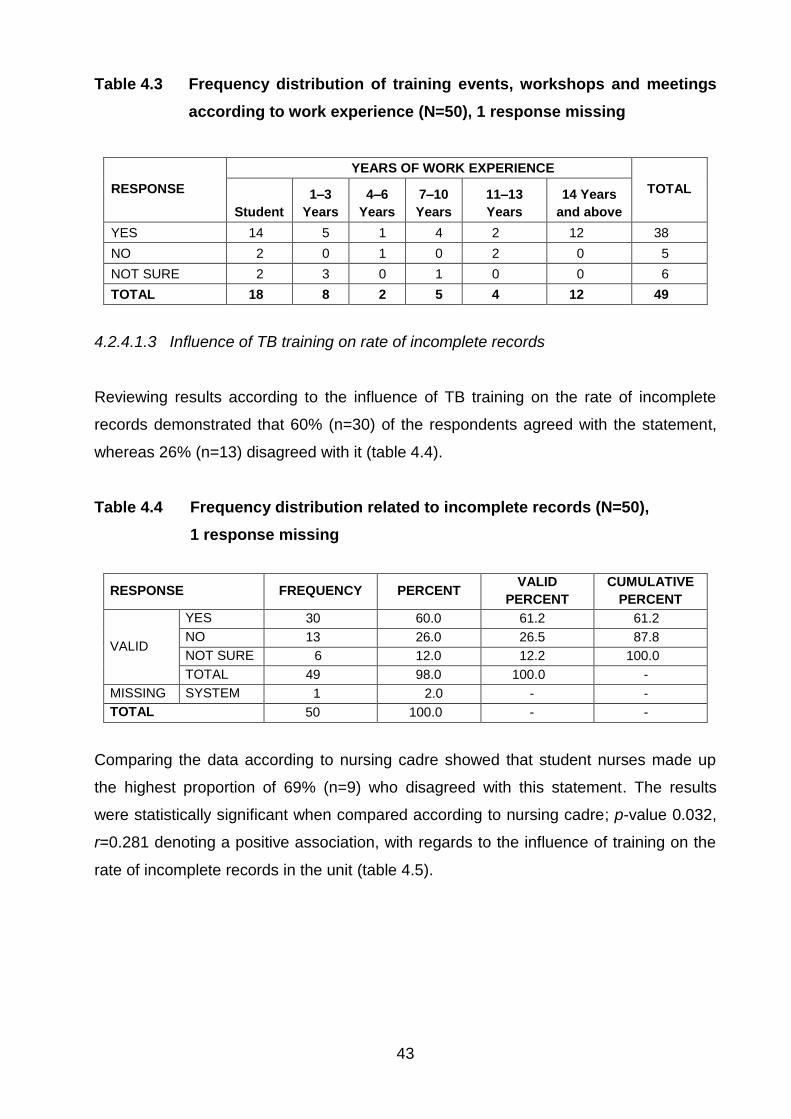
43
Table 4.3 Frequency distribution of training events, workshops and meetings
according to work experience (N=50), 1 response missing
RESPONSE
YEARS OF WORK EXPERIENCE
TOTAL
Student
1–3
Years
4–6
Years
7–10
Years
11–13
Years
14 Years
and above
YES 14 5 1 4 2 12 38
NO 2 0 1 0 2 0 5
NOT SURE 2 3 0 1 0 0 6
TOTAL 18 8 2 5 4 12 49
4.2.4.1.3 Influence of TB training on rate of incomplete records
Reviewing results according to the influence of TB training on the rate of incomplete
records demonstrated that 60% (n=30) of the respondents agreed with the statement,
whereas 26% (n=13) disagreed with it (table 4.4).
Table 4.4 Frequency distribution related to incomplete records (N=50),
1 response missing
RESPONSE FREQUENCY PERCENT VALID
PERCENT
CUMULATIVE
PERCENT
VALID
YES 30 60.0 61.2 61.2
NO 13 26.0 26.5 87.8
NOT SURE 6 12.0 12.2 100.0
TOTAL 49 98.0 100.0 -
MISSING SYSTEM 1 2.0 - -
TOTAL 50 100.0 - -
Comparing the data according to nursing cadre showed that student nurses made up
the highest proportion of 69% (n=9) who disagreed with this statement. The results
were statistically significant when compared according to nursing cadre; p-value 0.032,
r=0.281 denoting a positive association, with regards to the influence of training on the
rate of incomplete records in the unit (table 4.5).
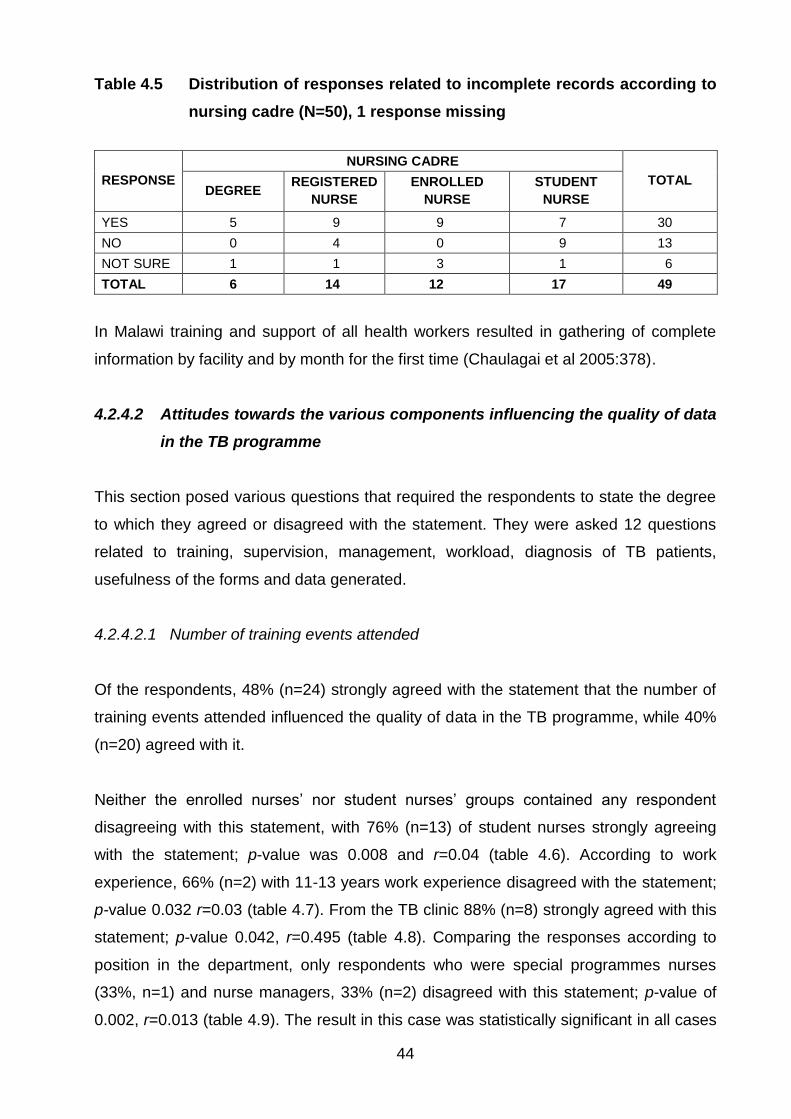
44
Table 4.5 Distribution of responses related to incomplete records according to
nursing cadre (N=50), 1 response missing
RESPONSE
NURSING CADRE
TOTAL DEGREE
REGISTERED
NURSE
ENROLLED
NURSE
STUDENT
NURSE
YES 5 9 9 7 30
NO 0 4 0 9 13
NOT SURE 1 1 3 1 6
TOTAL 6 14 12 17 49
In Malawi training and support of all health workers resulted in gathering of complete
information by facility and by month for the first time (Chaulagai et al 2005:378).
4.2.4.2 Attitudes towards the various components influencing the quality of data
in the TB programme
This section posed various questions that required the respondents to state the degree
to which they agreed or disagreed with the statement. They were asked 12 questions
related to training, supervision, management, workload, diagnosis of TB patients,
usefulness of the forms and data generated.
4.2.4.2.1 Number of training events attended
Of the respondents, 48% (n=24) strongly agreed with the statement that the number of
training events attended influenced the quality of data in the TB programme, while 40%
(n=20) agreed with it.
Neither the enrolled nurses‟ nor student nurses‟ groups contained any respondent
disagreeing with this statement, with 76% (n=13) of student nurses strongly agreeing
with the statement; p-value was 0.008 and r=0.04 (table 4.6). According to work
experience, 66% (n=2) with 11-13 years work experience disagreed with the statement;
p-value 0.032 r=0.03 (table 4.7). From the TB clinic 88% (n=8) strongly agreed with this
statement; p-value 0.042, r=0.495 (table 4.8). Comparing the responses according to
position in the department, only respondents who were special programmes nurses
(33%, n=1) and nurse managers, 33% (n=2) disagreed with this statement; p-value of
0.002, r=0.013 (table 4.9). The result in this case was statistically significant in all cases

45
denoting a strong positive association between the number of training events attended
and its influence on the quality of data in the TB programme in Oshakati District.
Table 4.6 Distribution related to number of training events attended according
to nursing cadre (N=50), 1 response missing
RESPONSE NURSING CADRE
TOTAL DEGREE IN
NURSING
REGISTERED
NURSE
ENROLLED
NURSE
STUDENT
NURSE
NOT SURE 0 0 2 0 2
DISAGREE 2 1 0 0 3
AGREE 2 7 7 4 20
STRONGLY
AGREE 2 6 3 13 24
TOTAL 6 14 12 17 49
Table 4.7 Distribution related to number of training events attended according
to years of work experience (N=50), 1 response missing
RESPONSE
YEAR OF WORK EXPERIENCE
TOTAL STUDENT
1–3
YEARS
4–6
YEARS
7–10
YEARS
11–13
YEARS
14 YEARS
AND ABOVE
NOT SURE 0 1 0 0 0 1 2
DISAGREE 0 0 0 0 2 1 3
AGREE 5 4 2 3 0 6 20
STRONGLY
AGREE 13 3 0 2 2 4 24
TOTAL 18 8 2 5 4 12 49
Table 4.8 Distribution related to number of training events attended according
to departments (N=50), 1 response missing
RESPONSE
DEPARTMENTS
TOTAL TB
CLINIC
TB
WARD
HIV
CLINIC
MEDICAL
WARD
(MALE)
MEDICAL
WARD
(FEMALE)
SPECIAL
PROGRAMMES/
PHC
NOT SURE 1 0 0 1 0 0 2
DISAGREE 0 0 1 0 0 2 3
AGREE 0 4 2 5 7 2 20
STRONGLY
AGREE 8 1 3 1 7 4 24
TOTAL 9 5 6 7 14 8 49

46
Table 4.9 Distribution related to number of training events attended according
to position (N=50), 1 response missing
RESPONSE
POSITION
TOTAL NURSE
MANAGER
SPECIAL
PROGRAM-
MES NURSE
REGISTERED
NURSE
ENROLLED
NURSE
STUDENT
NURSE
NOT SURE 0 1 0 1 0 2
DISAGREE 2 1 0 0 0 3
AGREE 1 0 7 7 5 20
STRONGLY
AGREE 3 1 4 3 13 24
TOTAL 6 3 11 11 18 49
According to Blaya et al (2007:44) the user of the newly designed laboratory information
system believed that frequency of training would support the collection of quality data.
4.2.4.2.2 Type of TB training
With regards to type of TB training attended and its influence on the quality of data, 47%
(n=23) of the respondents agreed with the statement whereas 14% (n=7) disagreed.
Analysing results according to departments, it was clear that respondents who strongly
disagreed with this statement were all from the medical ward (male) (n=2). The results
were statistically significant when compared according to department; p-value 0.003
r=0.820, indicating a strong positive association between quality of data and type of TB
training attended (table 4.10).
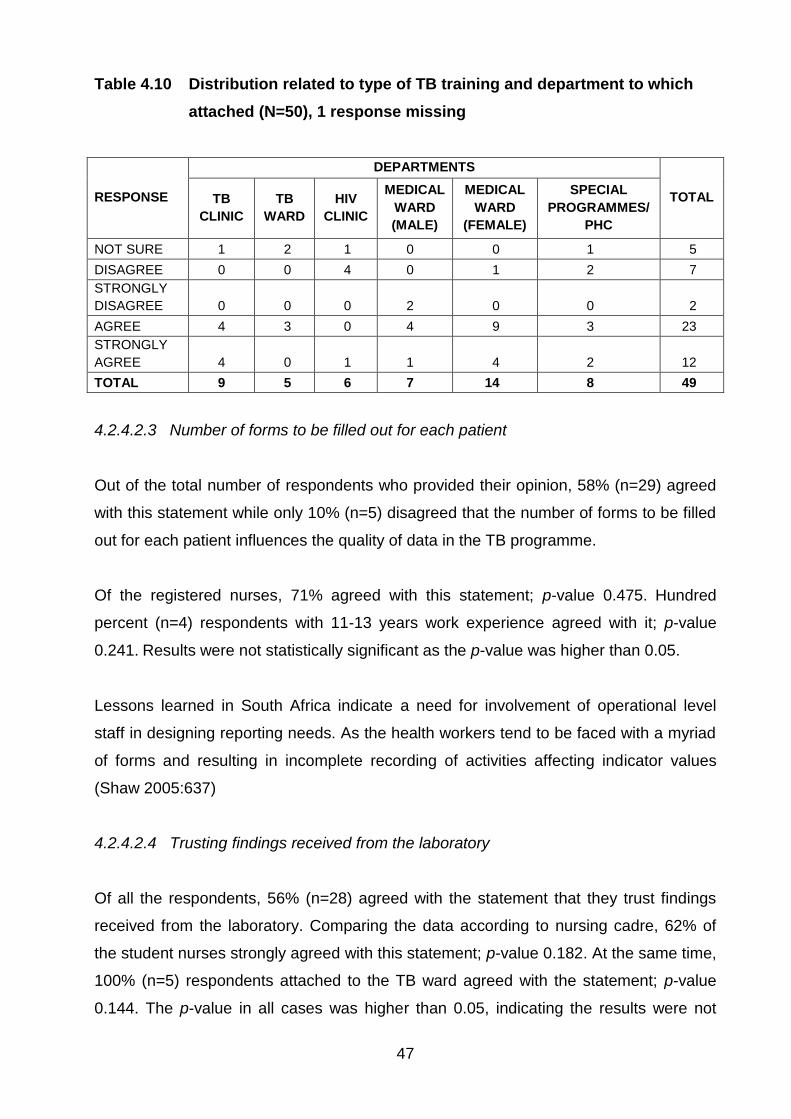
47
Table 4.10 Distribution related to type of TB training and department to which
attached (N=50), 1 response missing
RESPONSE
DEPARTMENTS
TOTAL TB
CLINIC
TB
WARD
HIV
CLINIC
MEDICAL
WARD
(MALE)
MEDICAL
WARD
(FEMALE)
SPECIAL
PROGRAMMES/
PHC
NOT SURE 1 2 1 0 0 1 5
DISAGREE 0 0 4 0 1 2 7
STRONGLY
DISAGREE 0 0 0 2 0 0 2
AGREE 4 3 0 4 9 3 23
STRONGLY
AGREE 4 0 1 1 4 2 12
TOTAL 9 5 6 7 14 8 49
4.2.4.2.3 Number of forms to be filled out for each patient
Out of the total number of respondents who provided their opinion, 58% (n=29) agreed
with this statement while only 10% (n=5) disagreed that the number of forms to be filled
out for each patient influences the quality of data in the TB programme.
Of the registered nurses, 71% agreed with this statement; p-value 0.475. Hundred
percent (n=4) respondents with 11-13 years work experience agreed with it; p-value
0.241. Results were not statistically significant as the p-value was higher than 0.05.
Lessons learned in South Africa indicate a need for involvement of operational level
staff in designing reporting needs. As the health workers tend to be faced with a myriad
of forms and resulting in incomplete recording of activities affecting indicator values
(Shaw 2005:637)
4.2.4.2.4 Trusting findings received from the laboratory
Of all the respondents, 56% (n=28) agreed with the statement that they trust findings
received from the laboratory. Comparing the data according to nursing cadre, 62% of
the student nurses strongly agreed with this statement; p-value 0.182. At the same time,
100% (n=5) respondents attached to the TB ward agreed with the statement; p-value
0.144. The p-value in all cases was higher than 0.05, indicating the results were not
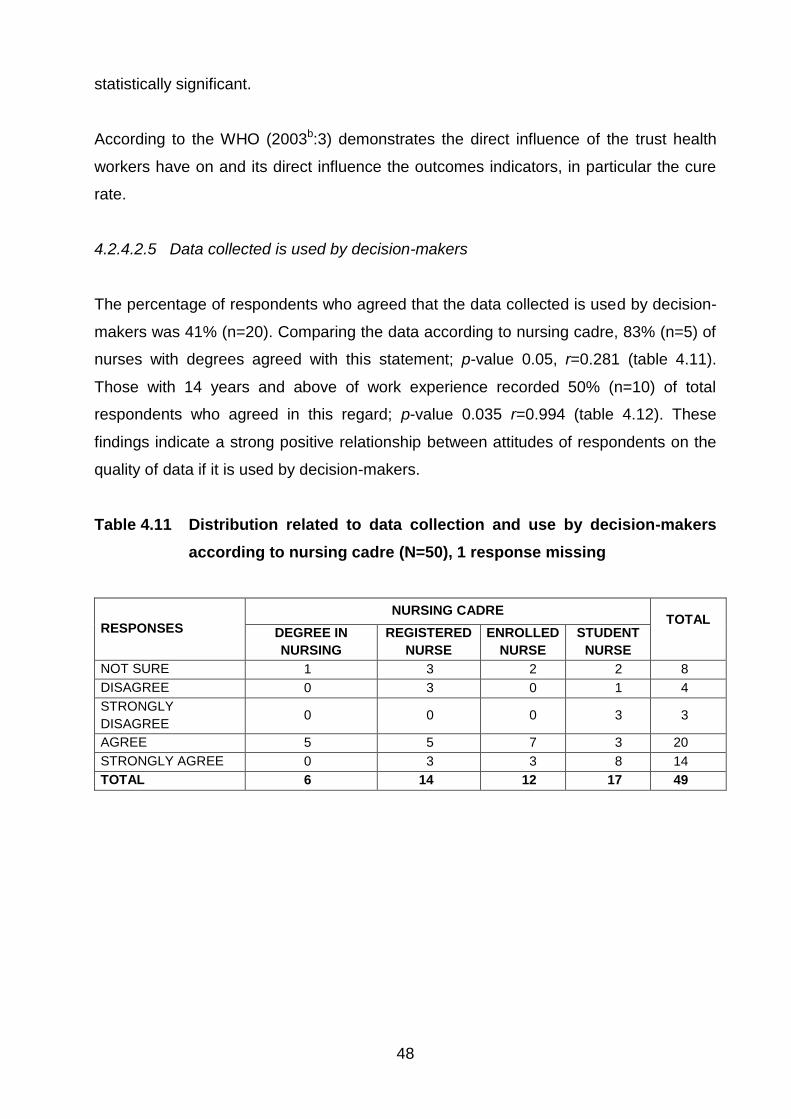
48
statistically significant.
According to the WHO (2003b:3) demonstrates the direct influence of the trust health
workers have on and its direct influence the outcomes indicators, in particular the cure
rate.
4.2.4.2.5 Data collected is used by decision-makers
The percentage of respondents who agreed that the data collected is used by decision-
makers was 41% (n=20). Comparing the data according to nursing cadre, 83% (n=5) of
nurses with degrees agreed with this statement; p-value 0.05, r=0.281 (table 4.11).
Those with 14 years and above of work experience recorded 50% (n=10) of total
respondents who agreed in this regard; p-value 0.035 r=0.994 (table 4.12). These
findings indicate a strong positive relationship between attitudes of respondents on the
quality of data if it is used by decision-makers.
Table 4.11 Distribution related to data collection and use by decision-makers
according to nursing cadre (N=50), 1 response missing
RESPONSES
NURSING CADRE TOTAL
DEGREE IN
NURSING
REGISTERED
NURSE
ENROLLED
NURSE
STUDENT
NURSE
NOT SURE 1 3 2 2 8
DISAGREE 0 3 0 1 4
STRONGLY
DISAGREE 0 0 0 3 3
AGREE 5 5 7 3 20
STRONGLY AGREE 0 3 3 8 14
TOTAL 6 14 12 17 49

49
Table 4.12 Distribution related to data collection and use by decision-makers
according to years of work experience (N=50), 1 response missing
RESPONSE
YEARS OF WORK EXPERIENCE
TOTAL STUDENT
1–3
YEARS
4–6
YEARS
7–10
YEARS
11–13
YEARS
14 YEARS
AND
ABOVE
NOT SURE 2 2 1 2 0 1 8
DISAGREE 1 1 0 2 0 0 4
STRONGLY
DISAGREE 3 0 0 0 0 0 3
AGREE 4 2 1 0 3 10 20
STRONGLY
AGREE 8 3 0 1 1 1 14
TOTAL 18 8 2 5 4 12 49
The situation in Mozambique indicates that the attitudes of the workforce towards
recording and reporting directly influences the quality of data in health programmes, as
evidenced by incomplete forms in used to regulate stock (Baltazaar and Margunn
2004:1). In addition, Chaulagai et al (2005:375) cited that the attitudes related to the
utilisation of information collected for taking decisions and management, resulted in little
improvement producing complete records, which were used to generate programme
reports.
4.2.4.3 Usefulness of TB records in TB management
This section of the questionnaire asked the study participants to rate the TB records
according to how useful they are in TB management.
The TB treatment card singled out as the most useful data collection tool across all the
categories the data was compared against. The highest mean score stemmed from the
respondents categorised as nurses with degrees (mean score 7 and a SD of 0). The
least useful data collection tool in the TB programme was the MDR side-effect form.
According to nursing cadre, the lowest score stemmed from the enrolled nurses (mean
score 2.82 and a SD of 1.99). The data was analysed further using the chi-square test,
which revealed a strong positive association (p=0.002, r=0.622), related to attitudes of
study participants and usefulness of the MDR- Side effect when compared according to
nursing cadre (figure 4.6).
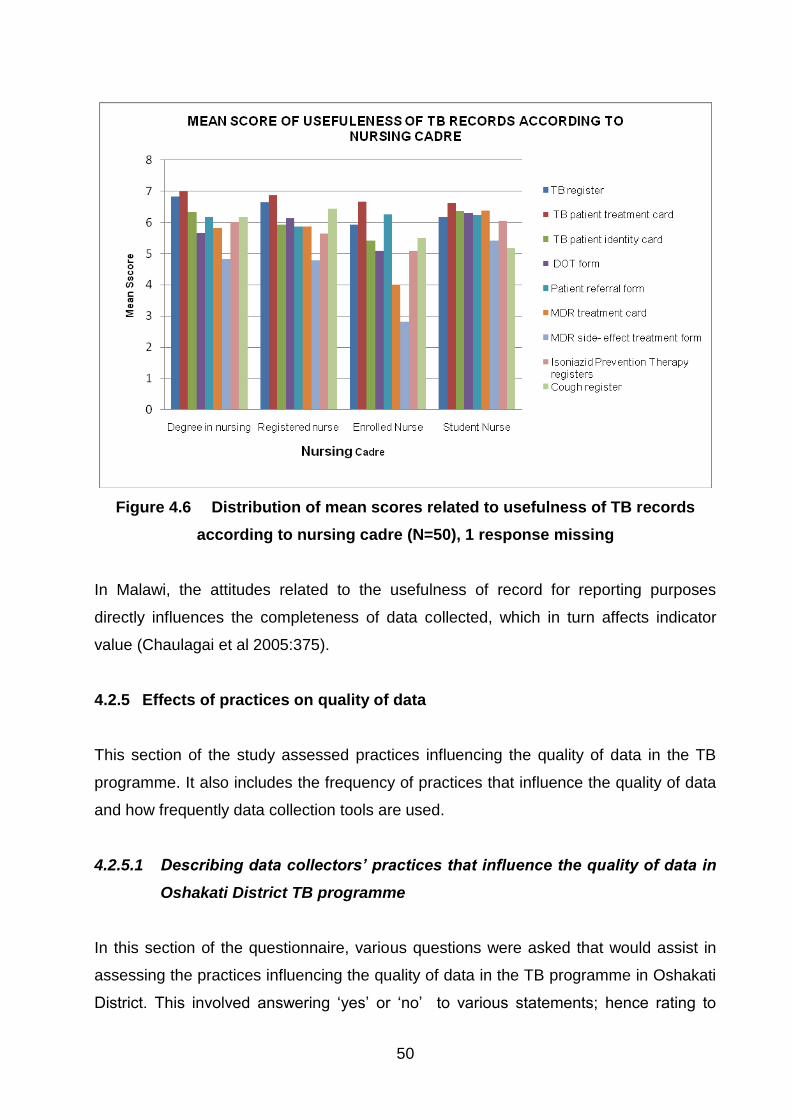
50
Figure 4.6 Distribution of mean scores related to usefulness of TB records
according to nursing cadre (N=50), 1 response missing
In Malawi, the attitudes related to the usefulness of record for reporting purposes
directly influences the completeness of data collected, which in turn affects indicator
value (Chaulagai et al 2005:375).
4.2.5 Effects of practices on quality of data
This section of the study assessed practices influencing the quality of data in the TB
programme. It also includes the frequency of practices that influence the quality of data
and how frequently data collection tools are used.
4.2.5.1 Describing data collectors’ practices that influence the quality of data in
Oshakati District TB programme
In this section of the questionnaire, various questions were asked that would assist in
assessing the practices influencing the quality of data in the TB programme in Oshakati
District. This involved answering „yes‟ or „no‟ to various statements; hence rating to

51
which degree the listed practice influenced the quality of data and how frequently the
data collection tools were used in TB management.
4.2.5.2 Practices influencing the quality of data in Oshakati District
The study participants were asked to respond to statements regarding practices that
influence the quality of data. The options presented to the respondents were „yes‟, „no‟
or „not sure‟.
4.2.5.2.1 Time taken to receive sputum results from the laboratory
With regards to the time taken to receive results from the lab, 82% (n=41) of
respondents agreed with this statement. According to the nursing cadre, 93% (n=13) of
the registered nurses agreed that the time taken to receive sputum results affects the
quality of data; p-value 0.351. These results were not statistically significant as the p-
value is higher than 0.05 in all cases.
According to the WHO, quality assurance programmes shows that the time it takes to
receive sputum results influenced indicator value of treatment outcomes and correct
categorisation of TB patients (WHO 2003b:3).
4.2.5.2.2 Number of supportive supervisions conducted by programme managers
In this regard, 58% (n=29) agreed that the number of supportive supervisions influenced
the quality of data in the TB programme. According to years of work experience, 88%
(n=7) of respondents with 1-3 years work experience agreed that supportive supervision
conducted by programme managers influenced the quality of data; p-value 0.286. The
department with the highest proportion of respondents who agreed that supportive
supervision by programme managers influenced the quality of data was the medical
ward (female, 86%; n=6); p-value 0.551. The results were not statistically significant as
the p-value was higher than 0.05.
In Malawi conducting supportive supervision and an annual review, minimised wrong
coding and incomplete fields in the HMIS (Chaulagai et al 2005:375).

52
4.2.5.3 Frequency of activities in Oshakati District
In this section, study participants were asked the frequency of activities thought to
influence the quality of data collected in the TB programme in Oshakati District.
4.2.5.3.1 Supportive supervision from the regional level
Of all the respondents, 34% (n=17) stated that supportive supervision from the regional
level is conducted sometimes, while 28% (n=14) of the respondents were not sure of
the frequency of this activity.
According to the results, 80% (n=4) of the respondents attached to the TB department
stated that supportive supervision from the regional level is undertaken sometimes; p-
value 0.002 and r=0.296 (table 4.13). Results were statistically significant when
compared according to departments, this indicates a positive association between the
influence of supportive supervision at regional level and quality of data in the TB
programme.
Table 4.13 Distribution related to supportive supervision from the regional level
according to departments (N=50), 1 response missing
RESPONSE
DEPARTMENT
TOTAL
TB
CLINIC
TB
WARD
HIV
CLINIC
MEDICAL
WARD
(MALE)
MEDICAL
WARD
(FEMALE)
SPECIAL
PROGRAM-
MES/PHC
NOT SURE 2 0 4 3 4 1 14
NOT DONE 3 0 0 0 0 0 3
SOMETIMES 2 4 1 2 3 5 17
FREQUENTLY 2 1 1 2 7 2 15
TOTAL 9 5 6 7 14 8 49
In Indonesia the health workers were provided regular feedback seemed not to have
any improvement in administering data collection tools; this led to incomplete data
(Mahendradhata et al 2008:396).
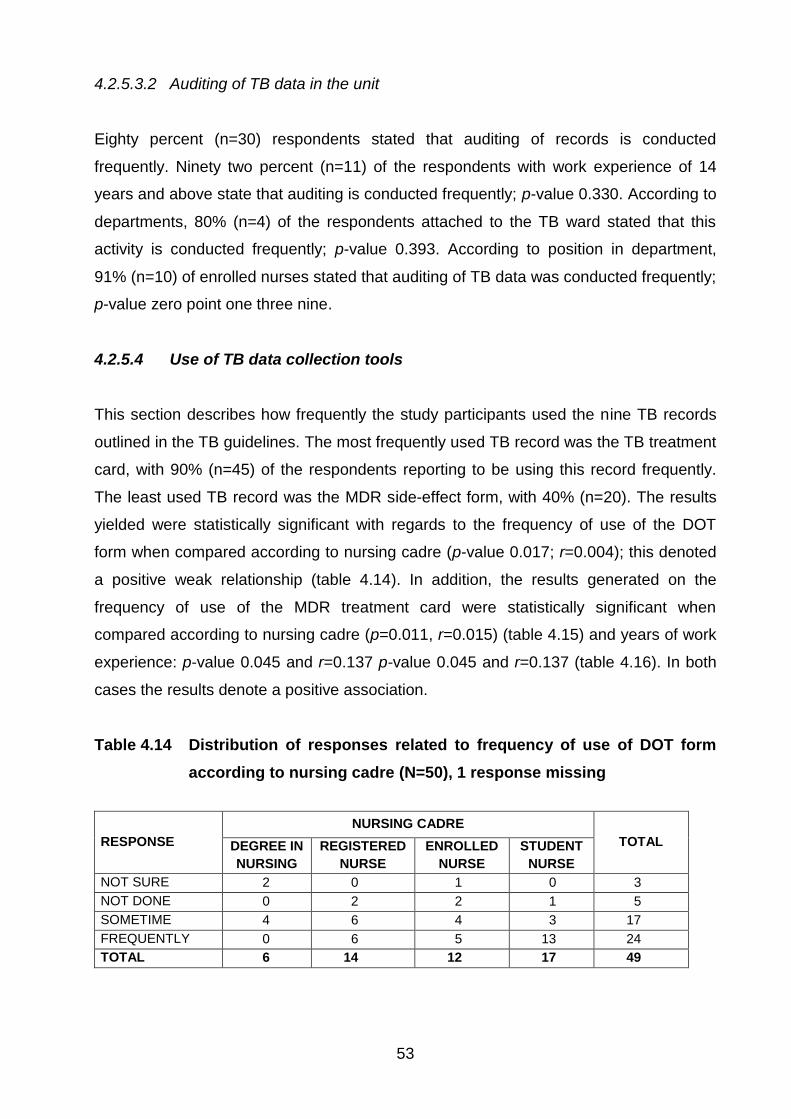
53
4.2.5.3.2 Auditing of TB data in the unit
Eighty percent (n=30) respondents stated that auditing of records is conducted
frequently. Ninety two percent (n=11) of the respondents with work experience of 14
years and above state that auditing is conducted frequently; p-value 0.330. According to
departments, 80% (n=4) of the respondents attached to the TB ward stated that this
activity is conducted frequently; p-value 0.393. According to position in department,
91% (n=10) of enrolled nurses stated that auditing of TB data was conducted frequently;
p-value zero point one three nine.
4.2.5.4 Use of TB data collection tools
This section describes how frequently the study participants used the nine TB records
outlined in the TB guidelines. The most frequently used TB record was the TB treatment
card, with 90% (n=45) of the respondents reporting to be using this record frequently.
The least used TB record was the MDR side-effect form, with 40% (n=20). The results
yielded were statistically significant with regards to the frequency of use of the DOT
form when compared according to nursing cadre (p-value 0.017; r=0.004); this denoted
a positive weak relationship (table 4.14). In addition, the results generated on the
frequency of use of the MDR treatment card were statistically significant when
compared according to nursing cadre (p=0.011, r=0.015) (table 4.15) and years of work
experience: p-value 0.045 and r=0.137 p-value 0.045 and r=0.137 (table 4.16). In both
cases the results denote a positive association.
Table 4.14 Distribution of responses related to frequency of use of DOT form
according to nursing cadre (N=50), 1 response missing
RESPONSE
NURSING CADRE
TOTAL DEGREE IN
NURSING
REGISTERED
NURSE
ENROLLED
NURSE
STUDENT
NURSE
NOT SURE 2 0 1 0 3
NOT DONE 0 2 2 1 5
SOMETIME 4 6 4 3 17
FREQUENTLY 0 6 5 13 24
TOTAL 6 14 12 17 49

54
Table 4.15 Distribution of responses related to frequency of use of MDR
treatment card according to nursing cadre (N=50), 2 responses
missing
RESPONSE
NURSING CADRE
TOTAL DEGREE
IN
NURSING
REGISTERED
NURSE
ENROLLED
NURSE
STUDENT
NURSE
NOT SURE 4 4 4 0 12
NOT USED 0 2 3 1 6
SOMETIMES 0 1 0 6 7
FREQUENTLY 2 7 4 10 23
TOTAL 6 14 11 17 48
Table 4.16 Distribution of responses related to frequency of use of MDR
treatment card according to years of work experience (N=50), 2
responses missing
RESPONSE YEARS OF WORK EXPERIENCE
TOTAL STUDENT
1–3
YEARS
4–6
YEARS
7–10
YEARS
11–13
YEARS
14 YEARS
AND ABOVE
NOT SURE 1 3 2 0 1 5 12
NOT USED 1 2 0 1 0 2 6
SOMETIME 6 1 0 0 0 0 7
FREQUENTLY 10 2 0 4 3 4 23
TOTAL 18 8 2 5 4 11 48
4.3 OTHER FACTORS INFLUENCING THE QUALITY OF DATA
The last section of the questionnaire contained an open-ended question which
requested participants to identify other factors that influenced data quality at Oshakati
State Hospital in relation to TB control programme. As shown in figure 4.7 the results
revealed that 9 factors were reported by participants, of which the lack of resources
and receiving training related to TB control and management had equal proportions of
66% (n=33).

55
Figure 4.7 Other factors influencing the quality of data in Oshakati District (N=50), 1 response missing
Other factors that directly impacted on the quality of data for TB control programme as
reported by participants included the following:
Defaulting on TB treatment 6% (n=3)
Delay in seeking TB care 5% (n=2.5)
Cultural beliefs, values and practices 2% (n=1)
Alcohol abuse in the community 4% (n=2)
4.4 CONCLUSION
This chapter presented the research findings about the factors that influenced the
quality of data in TB control programme in Oshakati District, Namibia. It was evident
from the gathered data that the factors such as the level of knowledge and attitudes of
data collectors as well as the type of TB related training received, does influence the
quality of data with regards to TB control programme.
The following chapter will discuss the conclusions drawn based on the findings of this
study, limitations and recommendations of the study.

56
CHAPTER 5
Conclusions, recommendations and limitations of the study
5.1 INTRODUCTION
This chapter summarises the study, and draws conclusions based on the findings of this
study. Study limitations are described and the recommendations based on the findings.
The aim of the study was to investigate factors influencing the quality of data for the TB
control programme in Oshakati District, Namibia.
The researcher extensively consulted literature to gain insight into factors that influence
the quality of data collected in TB programmes and other health programmes within the
health system; this was both nationally and international.
The objectives of the study were to
determine the demographic characteristics of nurses involved in TB control
programme in Oshakati District, Namibia
identify and describe the various factors influencing the quality of data in TB
control programme in Oshakati District, Namibia
measure the association between the demographic characteristics and factors
influencing data quality in TB control programme in Oshakati District, Namibia
5.2 SUMMARY OF FINDINGS
Findings are discussed according to the three study objectives.
57
5.2.1 Determine the demographic characteristics of nurses involved in TB
control programmme in Oshakati District, Namibia
The age group of 25 years and below recorded the highest representation of 44%
(n=22) of the whole study group, with 77% (n=17) of this group representing student
nurses. According to qualification the nurses who reported to have a degree in nursing
were12% (n=6). The category with the highest representation according to years of
work experience was amongst study participants with 1-3 years of work experience
(36%, n=18) while the lowest representation was amongst study participants with 14
years and above work experience.
The study revealed that more than half (61.2%; n=31) of the total respondents had
attended some form of TB - related training. However, comparing the data according to
nursing cadre, years of experience, department to which attached and position in
department, it was found that the distribution of training attended in these categories
was not equal; it ranged from 28.6% (n=14) to 2% (n=1). Similar results were noted with
regards to then nature of TB training attended with a 49% (n=15) attending the in-
service training, while 2% (n=1) respondents attended trainer of trainer workshops.
5.2.2 Identify and describe the various factors influencing the quality of data in
TB control programme in Oshakati District, Namibia
The results indicated that the majority (90%; n=45) of the respondents agreed that TB
training improved correct recording and reporting. Sixty percent (n=30) of the
respondents agreed that TB trainings influenced the rate of incomplete records in the
unit, while 26% (n=13) of the respondents disagreed with this statement. This indicates
that TB trainings influence the quality of data reported in the TB programme as it
influences correct recording and completeness of data at operational level.
In relation to the attitudes related to usefulness of data collection tool the TB treatment
card was rated as the most useful TB record in TB management, with 67% (n=33) of the
total respondents ranking it thus. On the other hand, the MDR side-effects form was
ranked as the least useful record with only 31% (n=14) of respondents ranking it as the
most useful document.

58
This indicates that some records are not viewed as useful in TB control and
management. The possible spill over effect on some TB indicators that rely on the
information recorded. Nilmini, Jatinder and Sushi (2005:6) emphasise that data quality
should not be compromised; this is because low quality health data will exert a major
negative impact on the decision making process. It is also known to exert a tremendous
spill over effect on patient management. The authors further emphasise the
consequences: that errors or incomplete information contribute to loss of life and also
embarrass an organisation (Nilmini et al 2005:6).
Seventy six percent (n=38) of the respondents agreed that the time between reviewing
the patient and entering information into TB records influenced the quality of data. As
stated in Baltazaar and Margunn (2004:18), where the practice of giving priority to
reviewing patients influenced the quality of data collected in Mozambique.
Other factors that respondents identified to influence the quality of data in the TB
programme in Oshakati District were lack of resources (66%; n=33).
5.2.3 Measure the association between the demographic characteristics and
factors influencing data quality in TB control programme in Oshakati
District, Namibia
The results were statistically significant with regards to knowledge level and use of TB
records in TB management when compared according to position of participants in the
department The mean score in this case was 4.49, a SD of 0.916 and a p-value of 0.05
(statistically significant at level 0.05). These results are in line with recommendations
made in Norval et al (2007:517), which state that training in use of TB forms is essential
before utilisation of the forms in TB management, since a lack of well-trained staff in this
respect was identified.
The findings revealed a relationship between knowledge level and use of data collection
tools, particularly the use of the TB treatment card in respect to nursing cadre, with a
mean score of 6.18, a SD of 1.131. The results were statistically significant with a p-
value of 0.05.

59
Responses from the study revealed a relationship between attitude and its influence on
quality of data in relation to the number of training events attended by an individual. The
data was statistically significant when compared according to years of work experience
p=0.028 (statistically significant at 0.05 level). The results showed a reduction in the
proportion of respondents who agreed with this statement in line with fewer years of
work experience. The results contradict the study by Choudhry et al (2005:269), which
found a decrease in performance with years in practice.
It was revealed that there was a relationship between attitudes towards the influence of
TB training and rate of incomplete records in the unit. The results were significant when
compared according to nursing cadre, p=0.0032 (statistically significant at 0.05). The
results showed a decrease in the proportion of respondents who agreed that training
influenced the rate of incomplete records in the unit. These results are in line with the
experience reported in Chaulagai et al (2005:378), whereby attitudes towards the use of
HMIS affected the completeness of data. This was linked more to the will and
determination of staff to ensure the quality of data collected in the programme is
maintained.
The findings revealed a strong relationship between responses related to the number of
training events attended and influence on data quality in all categories where the results
were compared. The p-values in all categories were as follows, according to nursing
cadre (p=0.008), while according to years of work experience (p=0.032). According to
department the (p=0.042). The strongest relation was according to position in
department with the least (p=0.002). These results suggest a strong relationship
between number of training events attended and their influence on the quality of data.
The results also revealed a relationship between the type of TB training attended and its
influence on quality of data. When the data was compared according to the department
to which respondents were attached, (p=0.003), indicating a statistically significant
association. These findings concur with the findings of Chalugai et al (2005:375) and
Bheekie et al (2006:262) that emphasise the importance of the cascade approach in TB
training. This is believed to assist in an effective transfer of skills to fellow health
workers through training and mentorship.
60
The findings related to the influence of the quality of data in the TB programme and its
effect to decision making demonstrated a relationship between the attitudes of study
participant on the use of data collected for decision-making. The results were
statistically significant when compared according to nursing care, with a (p=0.028) and
(p=0.0023) according to department. The strongest association was generated when
the data was compared according to years of work experience (p=0.002).
The study revealed a strong relationship between the usefulness of the TB treatment
card and nursing cadre (p=0.05). These results suggest that opinions related to the
study participants‟ attitudes were related to the usefulness of TB records. The results
were also statistically significant on the usefulness of the IPT record and department to
which the person was attached to (p=0.045).
On the contrary a Malawian study revealed that systematic data verification and
feedback improved the quality of data (Chaulagai et al 2005:375). However, the
revealed a strong relationship between the frequency of supportive supervision from the
regional level and the department to which a nurse was attached (p=0.002).
A strong relationship with regards to the frequency of the use of the MDR treatment
card was indicated by the (p=0.045) according to years of work experience and
(p=0.011) according to nursing cadre. The results also demonstrated a strong
association between the frequencies of the use of the DOT system and the nursing
cadre (p=0.017).
5.4 CONCLUSIONS
The findings of the study demonstrated that knowledge, attitudes and practise were
factors influencing the quality of data reported in the TB Programme in Oshakati District
as discussed.
Participants TB related training; the proportion of staff members who have received TB-
related training and the nature of TB-related training attended influenced the quality of
data. This influences the capacity building of staff in the district and skills transfer at
departmental level. Participants‟ knowledge on TB control guidelines, in particular the
61
use of TB records to, used to capture the core TB indicators influenced the quality of
data in the programme. The attitudes and practises of respondents affected
implementation of TB guidelines hence, influencing the quality of data in the
programme.
This was in relation to completing TB records, frequency of use of TB records and the
participants‟ attitudes towards the use of the TB records for decision-making. Lastly
frequency of supervision was also shown to influence the quality of data in the TB
programme. The above factors, identified by the study, contribute towards improving the
quality of data in the TB programme in Oshakati District. As a result, this decreases
transmission rates and the TB disease burden in Oshakati District.
5.5 RECOMMENDATIONS
5.5.1 Recommendations for further studies
A comparative study to be conducted targeting nurses in the district to assess the
impact of training conducted to determine if the training has been put into
practices. This should also incorporate a comparison of data collection in private
and public institutions in the region.
A comparative study should be done targeting the collection of data in the special
programmes, particularly the HIV/AIDS Programme, to compare the data
collection of the TB programme and these programmes and the impact on
improvement of health in the region.
In-depth studies should be conducted to assess the effect of the flow of
information between the lab and health workers and its effect on TB
management.
Conducting a qualitative research will assist identify in-depth factors that
influence knowledge level, attitudes and use of data collection tools and
components that influence the quality of data.

62
5.5.2 Recommendations for practise
Based on the findings and suggestions from the study participants, the following
recommendations can be made for improving the quality of data in the TB programme in
Oshakati District.
To adopt the cascade approach of training both during in-service training and in
training of registered nurses as they are expected to be able to mentor student
nurses after qualifying as a registered nurse. This will contribute towards
continuous training and transfer of skills at departmental level. This will, in turn,
improve monitoring and evaluation at all levels. Further, it will assist in
strengthening the recording and reporting of TB activities and assessment of the
impact of TB control activities in the district. Increasing the number of trainers of
trainers in each department will further assist in developing a training schedule
that will not need external resources as well as implementing training that is
tailor-made to suit the needs of the department.
To advocate capacity building of all cadres of staff in the district with respect to
TB programme data in order to enhance data collection – to include the use of
the ETR, maintenance and data analysis. This will improve their practices and
attitude towards the TB programme, thus positively affecting the collection of
data on TB treatment and monitoring of TB patients in Oshakati District.
To improve the positive attitude towards quality data in the TB programme by
involving all staff in reviewing TB records in each department in Oshakati District.
This will assist in creating awareness regarding the importance and usefulness of
the data collected and the effect of its quality in TB control in the district.
To promote practices that improve the quality of data in the TB programme in
Oshakati District, conducting frequent audits and review meetings that will
involve both clinicians and laboratory technologists; this will assist in the correct
use of TB records and promote practices that improve the quality of data
collected.
To increase coverage of automated collection of data in the TB programme. This
will improve the timely collection of data and analysis. It will also enhance the
follow up of TB patients. This will render it easier and faster to share TB data and
63
information with other regions in Namibia, thus improving the treatment of TB in
the region and the country as a whole.
The above recommendations will be implemented through creating awareness and
advocating for changes by sharing the research report with the relevant stakeholders.
This include engagement with the National TB and Leprosy Programme, University of
Namibia school of nursing, department of nursing services, department of training in the
MoHSS. This will be during the quarterly TB review meetings held at regional and
national level, presentation of abstracts for at conferences sponsored by the MoHSS
annually and publication of the report in daily newspapers and other public health
journals.
5.6 LIMITATIONS OF THE STUDY
The study was conducted at Oshakati State Hospital and is context-specific using a
small sample. This may affect the generalisability of the findings to other similar
settings. The results will only be relevant to Oshakati District.
Another limitation is that the study involved nurses only and did not include other health
professionals who are also involved in collecting data relating to TB control and who
also may be influencing the quality of data in Oshakati District.
5.7 CONCLUDING REMARKS
It is hoped that the findings in this study will contribute towards improving recording and
reporting practices in the given TB programme. This should, in turn, assist in improving
the quality of data generated in the TB programme, which in turn should enhance TB
management and the effective implementation of TB control activities in Oshakati
District, Namibia.

64
BIBLIOGRAPHY Anomy, J, Preece, D & Ubrany, N. 2002. Understanding, managing and implementing quality: frameworks, techniques and cases. London: Routledge. Arch, OA, Khazinga, NS & Delnoi, DM. 2003. conceptual frameworks for health systems performance: a quest for effectiveness, quality and improvement. International Journal for Quality and Health Care 15:377-398. Awofeso, N, Schelokova, I & Dalhatu, A. 2008. Training of frontline health workers for tuberculosis control: lessons for Nigeria and Kyrgyzstan; Human Resource for Health. Bio Medical Central 6(20):1-9. Babbie, E 2007. The practice of social research. 11th edition. Carlifonia: Thomson Higher Education Babbie, E & Mouton, J. 2001. The practice of social research. Cape Town: Oxford University Press. Babbie E & Mouton J. 2003. The practice of social research. Cape Town: Oxford University Press. Baltazaar, C & Margunn, A. 2004. Negotiating multiple rationalities in the process of integrating the information systems of disease-specific health programmes. Electronic Journal on Information Systems in Developing Countries 20(2):1-28. Battin, C & Scannapieco, M. 2006. Data quality: concepts, methodologies and techniques. New York: Springer. Bauer, JE, Duffy, GL & Westcott, R (eds). 2006. The quality improvement handbook. 2nd edition. Wisconsin: American Society for Quality (ASQ). Bheekie, A, Pharm, D, Buskens, I, Allens, S, English, R, Mayers, P, Fairall, L, Majora, B, Bateman, I, Zwarestein, M & Bachmann, M. 2006. The practical approach to lung health in South Africa (PALSA) intervention: respiratory guidelines implementation for nurse trainers. International Nursing Review 53(4):261-268. Blaya, JA, Shin, SS, Yagu, MJ, Yale, G, Suarez, ZC, Ascencios, L, Cegielsk, PJ & Fraiser, HSE. 2007. A web-based laboratory information system to improve quality of care of tuberculosis patients in Peru: functional requirements, implementation and usage statistics. BMC Medical Informatics Decision Making 7:33-41. Bouchet, B, Francisco, M & Ovretveit, J. 2002. The Zambian quality assurance programme, success and challenges. International Journal of Quality Health Care 14(1):89-95. Braga, JU. 2007. Tuberculosis surveillance and health information system in Brazil: 2001-2003. From: http://www.scielo.br/pdf/rsp/v41s1/en_6494.pdf (accessed on 2009-07-21). Burns, N & Grove, SK. 2003. Social research. New York: MacMillan.

65
Burns, N &Groove SK. 2005. The practise of nursing research: conduct, critique and utilization. Missouri: Elsevier Saunders. Chaulagai, C, Kott, J, Moyo, BN, Sambunkusi, TC, Khunga, FN & Maphini, PD. 2005. Design and implementation of a health management information system in Malawi: issues, innovation and results. Health Policy and Planning 20(6):375-384. Choudhry, NK, Fletcher, RH & Soumerai, SB. 2005. Systematic review: the relationship between clinical experience and quality of health care. Annals Internal Medicine 142:260-273. Crow, R, Gage, H, Hampson, S, Hart, J, Kimber, A, Storey, L & Thomas, H. 2002. The measurement of satisfaction with healthcare: implications for practise from a systematic review of the literature. Health Technology Assessment. NHS R&D vol 2. Dawson, A & Verweij, M (eds). 2007. Ethics, prevention and public health. New York: Oxford University Press. Delisa, J, Gans, BN, Walsh, NE & Bockect, W (eds). 2004. Physical medicine and rehabilitation: principles and practise. 4th edition. Philadelphia: Lippincott Williams and Wilkins. Donabedian, A & Bashshur, R. 2003. An introduction to quality assurance in health care. New York: Oxford University Press. Elleithy, K, Sobht, T, Mahmood, A, Iskander, M & Karim, M (eds). 2006. Advances in computer information and systems sciences and engineering. Dordrecht, Netherlands: Springer. Emmanuel, EJ, Wendler, D & Grady, C. 2000. What makes clinical research ethical? Journal of American Medical Association 283:2701-2711. Espinal, AM, Laszlo, A, Simonsen, L, Boulahbal, F, Kim, JS, Reniero, A, Hoffner, S, Rieder, H, Binkin, N, Dye, C, Williams, R & Raviglione, CM. 2001. Global trends in resistance to anti-tuberculosis drugs. New England Medical Journal 344(17):1294-1303. Fine, LG, Bruce, EK, Shan, C, Maria, O & Mairi, MG. 2003. How to evaluate and improve the quality and credibility of an outcomes database, validation and feedback: study on the UK cardiac surgery experience. British Medical Journal 326:25-28. Gemish, K & Lacey, A (eds). 2006. The research process in nursing. 5th edition. Missouri: Blackwell. Gillam, S, Yates, J & Budrianath, P (eds). 2007. Essential public health: theory and practice. New York: Cambridge University Press. Gitlow, HS. 2000. Quality management systems: a practical guide. Florida: CRC Press. Glatthorn, A & Joyner, R. 2005. Writing the winning dissertation: a step by step guide. 2nd edition. California: Corwin Press.

66
Green, M & Bowie, M. 2005. Essentials of health information management: principles and practices. New York: Cengage Learning. Hakim, A. 2006. Data quality management theory and applications. Pennsylvania: IGI Publishing. Hangaro, C, McPake, B & Vickerman, P. 2005. Measuring quality of hospital tuberculosis services: a prospective study in four Zimbabwe hospitals. International Journal of Health Care 17(4):287-292. Harries, AD, Zachariah, R, Bergstrom, K, Blanc, L, Salaniponi, M & Elzing, G. 2005. Human resource for control of TB and HIV associated tuberculosis. International Journal of Tuberculosis and Lung disease 9(2):128-137. Herbst, AJ. 2002. Health informatics, lecture notes. Department of Community Health, Nelson R Mandela Medical School, University of Natal: South Africa. Jamtvedt, G, Young, JM, Kristoffersen, DT, O‟Brien, MA & Oxman, AD. 2006. Audit and feedback: effects on professional practice and health care outcomes (review). Cochrane database of systematic review. Issue 2. Art NO.: CD000259. DOI: 10.1002/14651858. CD000259. Pub 2. Jan, D. 2001. Country Health Brief Paper. London: DFID. Kidder, LH. 1986. Research methods in social relations. 5th edition. New York: CBS. Kirch,W. 2008 (ed). Encyclopedia of public health. Vol 1. New York: Springer. Kothari, CR. 2004. Research methodology, methods and techniques. India: Wishwa Prakashan. Leedy, PD. 1993. Research methods in social relations. 5th edition. New York: CBS. Leedy, PD & Ormond, JE. 2005. Practical research: planning and design. New York: MacMillan. Lewin, S, Dick, J, Zwarenstein, M & Lombard, CJ. 2005. Staff training and ambulatory tuberculosis treatment outcomes: a cluster randomised controlled trial in South Africa. Bulletin of WHO 83:250-259. Mahendradhata, Y, Syahrizal, B & Utarini, A. 2008. Delayed treatment of tuberculosis patients in rural areas Yogyakarta Province Indonesia. BMC Public Health 8:393. Marin, H & Bakken, S. 2001. Building standard-based nursing information systems. Pan America Regional Office: World Health Organization. Ministry of Health and Social Services. 2004. The national strategic plan on tuberculosis. Medium Term Plan 1 (TB-MTP 1) 2004-2009. Windhoek. Ministry of Health and Social Services. 2006. National guidelines for the management of tuberculosis. 2nd edition. Windhoek.

67
Ministry of Health and Social Services. 2008a. National tuberculosis and leprosy control programme, Annual Report 2006/2007. Windhoek. Ministry of Health and Social Services. 2008b. Management organisational sustainable tuberculosis programme (MOST). Workshop from October to November. Windhoek. Ministry of Health and Social Services. 2008c. Staff establishment. Oshakati District. Ministry of Health and Social Services. 2009. The twelfth zonal TB meeting report, Outapi Town Lodge. Omusati. MoHSS see Ministry of Health and Social Services. Moboshe, M, Chintu, C, Squire, B, Nyirende, S, Sunkutu, R & Zumla, T. 2003. The relentless spread of tuberculosis in Zambia: trends over the past 37 years (1964-2000). South African Medical Journal 93(2):149-152. Nadol, P, Stinson, KW, Coggin, W, Naicker, M, Wells, DC, Miller, B & Nelson, LJ. 2008. Electronic tuberculosis surveillance systems: a tool for managing today‟s TB programmes. International Journal of Tuberculosis and Lung Diseases 12(3):58-59. National Planning Commission. 1997. National population policy for sustainable development. Windhoek. Nilmini, W, Jatinder, ND & Sushi, KS. 2005. Creating knowledge-based health care organizations. Pennsylvania: IGI Publishing Norbert, D, Carmen, D, Mario, R, Goubarev, A, Adams, O, Anegawi, M, Bergstrorm, K, Fogstad, H, Shenat, D, Linkins, J, Scherbier, R & Fox, MY. 2005. An approach to estimating human resource requirements to achieve the MDGs. Health Policy and Planning 20(5):267-276. Norval, PY, Heldal, E, Herminez, L, Laserson, K & Godfrey, A. 2008. Revising the tuberculosis recording and reporting information system. International Journal of Tuberculosis and Lung Disease 12(3):517-510. Novick, L, Morrow, C & Mays, G. 2007. Public health administration: principles for population based management. 2nd edition. Massachusetts: Jones & Bartlett. Ntoburi, S, Wagai, J, Irimu, G & English, M. 2008. Debating the quality and performance of health systems at a global level is not enough: national debates are essential for progress. Tropical Medicine and International Health 13(4):444-447. Olson, J. 2003. Data quality: the accuracy dimension. California: Marg Kaufman. Polit, D & Beck, C. 2008. Nursing research: generating and assessing evidence for nursing practice. 8th edition. New York: Lippincott Williams & Wilkins. Polit, D, Beck, CT & Hungler, B. 2001. Essentials of nursing research, methods and appraisal, and utilization. 5th edition. New York: Lippincott Williams & Wilkins.

68
Polit, D & Hungler, B. 1999. Nursing research principles and methods. 6th edition. New York: Lippincott. Pringle, M, Wilson, T & Grol, R. 2002. Measuring „goodness‟ in individual and healthcare systems. British Medical Journal:704-707. Ramsaroop, P, Marion, J, Doughlas, J & Beaulieu, D (eds). 2001. Advancing federal sector health care: a model for technology transfer. New York: Springer. Rice R. 2006. Home care nursing practice: concepts and application. 4th edition. Missouri: Elseviers Health. Ridderhof, JC, Devin, AV, Kam, KM, Marayanan, PR & Aziz, AM 2007. Roles of laboratories and effective tuberculosis programmes. Bulletin of WHO 85:354-359. Roussel, L, Swansburg, R & Swansburg, RJ. 2006. Management and leadership for nurse administrators. 4th edition. Massachusetts: Jones & Bartlett. Rowitz, L. 2009. Public health leadership: putting principles into practice. 2nd edition. Onatario: Jones & Bartlett. Shaw, V. 2005. Health information systems in South Africa: developing an essential data set. Bulletin of World Health Organisation 83:632-639. Sims, J & Wright, C. 2000. Research in health care – concepts, designs and methods. London: Nelson Thornes. Stanhope, M & Lancaster, J. 2006. Foundations of nursing in the community: community-oriented practice. Missouri: Mosby Elsevier. TBCAP 2005-2010 Namibia Country Report. From: www.tbcta.org/TBCTA_Project/Results.php (accessed on 2009-07-31). Tomey, AM. 2000. Guide to nursing management and leadership. 6th edition. Missouri: Mosby. Vranker, P, Coulobier, D, Kenyon, T, Koosimile, B, Mavunga, T, Coggin, W & Binkin, N. 2002. A computerized tb register for automated generation of case finding, sputum conversion and treatment outcomes report. International Journal of Tuberculosis and Lung Diseases 6(2):111-120. Wakibi, S. 2008. Data quality considerations in human resources information systems (HRIS). Capacity Project Knowledge Sharing Technical Brief 10 USAID. Webb, P, Bain, C & Pirozzo, S. 2005. Essential epidemiology and introduction for students and health professions. New York: Cambridge University Press. Well, DEC. 2000. Advancing TB control within a reforming health system. International Journal of Tuberculosis and Lung Diseases 4(7):597-605. WHO see World Health Organization.

69
World Health Organization. 2002. Final report on a workshop to develop proposals for collaborative TB HIV/AIDS programme activities. Nairobi, Kenya: WHO. World Health Organization. 2003a. Improving data quality: a guide for developing countries. Manila, Philippines: WHO. World Health Organization. 2003b Stop TB special project. Quality assurances of sputum microscopy in DOTS programmes. WHO, Regional Guidelines for Countries in Western Pacific, 2003. World Health Organization. 2004. Developing health management information systems: a practical guide for developing countries. Geneva: WHO. World Health Organization. 2006. The stop TB strategy. Building on and enhancing DOTS to meet TB-related millennium development goals. Geneva: WHO. World Health Organization. 2007. Country cooperation strategy Republic of Namibia 2004-2007. Namibia: WHO. World Health Organization. 2008a. Implementing the STOP TB strategy: a handbook for the national TB control programme. Geneva: WHO. World Health Organization. 2008b. Stop TB policy paper. Contributing to health system strengthening. guiding principles for national TB programmes. Geneva: WHO. World Health Organization. 2008c. Toolkit on monitoring health systems strengthening. Health information systems. Geneva: WHO. World Health Organization. 2008d. Stop TB partnership. Advocacy, communication, and social mobilisation for TB Control: a guide to knowledge attitude and practice surveys. Geneva: WHO. Williamson, L & Stoops, N. 2001. Using information for health chapter 6. South African health review. Durban: Health System Trust. Wood, M, Kerr, J & Brink, P. 2005. Basic steps in planning nursing research from questions to proposal. 6th edition. Toronto: Jones & Bartlett. Woods, NF & Catanzaro, M. 1988. Nursing research, theory and practice. St Louis: Mosby. Yagui, M, Perales, T, Asencios, L, Vergara, L, Suarez, C, Yale, G, Salazar. C, Saavedra, M, Shin, S, Ferrousier, O & Cegielski, P. 2006. Timely diagnosis of MDR-TB under programme condition: is rapid drug susceptibility testing sufficient? International Journal of Tuberculosis and Lung Disease 10(8):834-843. Yang, G, Itu, J, Rao, QK, Ma, I, Rao, C & Lopez, DA. 2005. Mortality registration and surveillance in China: History, current situation and challenges. Population Health Metrics-BMC 3:3.

70
Zurovac, D, Rowe, AK, Ochola, SA, Noor, AM, Midia, B, English, M & Snow, RW. 2004. Predictors of the quality of healthworker treatment practices for uncomplicated malaria at government health facilities in Kenya. International Journal of Epidemiology 33:1080-1091.
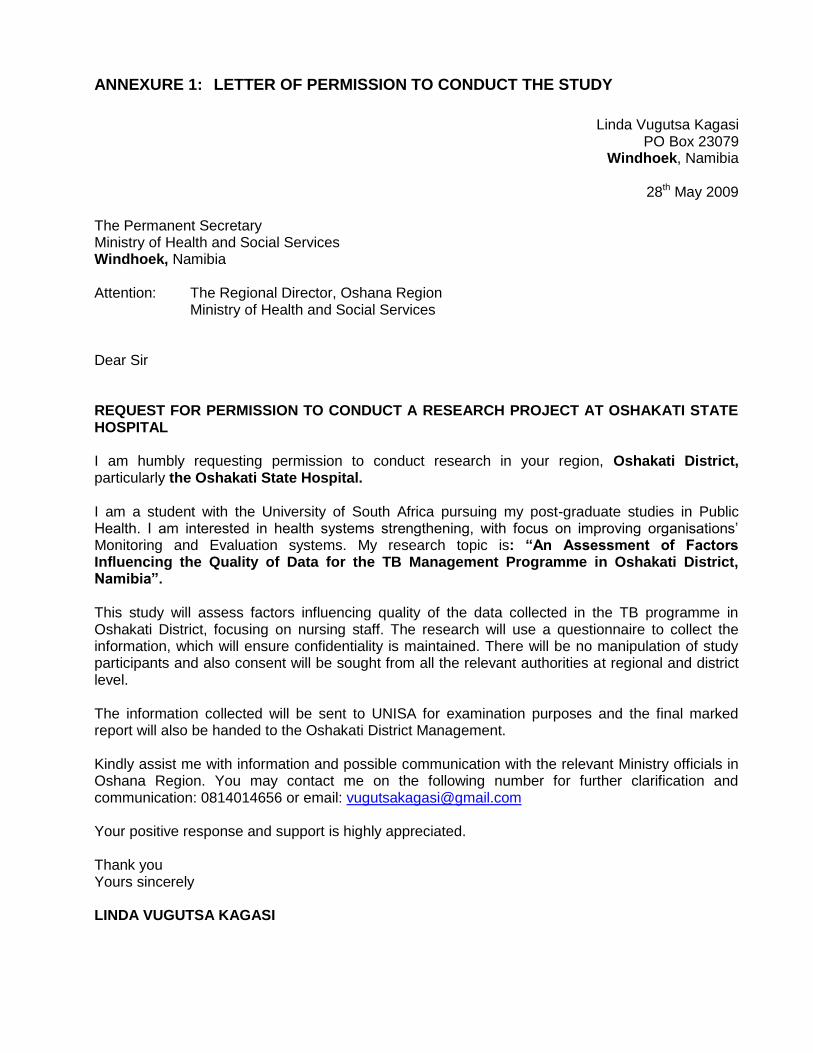
ANNEXURE 1: LETTER OF PERMISSION TO CONDUCT THE STUDY
Linda Vugutsa Kagasi PO Box 23079
Windhoek, Namibia
28th May 2009 The Permanent Secretary Ministry of Health and Social Services Windhoek, Namibia Attention: The Regional Director, Oshana Region Ministry of Health and Social Services Dear Sir REQUEST FOR PERMISSION TO CONDUCT A RESEARCH PROJECT AT OSHAKATI STATE HOSPITAL I am humbly requesting permission to conduct research in your region, Oshakati District, particularly the Oshakati State Hospital. I am a student with the University of South Africa pursuing my post-graduate studies in Public Health. I am interested in health systems strengthening, with focus on improving organisations’ Monitoring and Evaluation systems. My research topic is: “An Assessment of Factors Influencing the Quality of Data for the TB Management Programme in Oshakati District, Namibia”. This study will assess factors influencing quality of the data collected in the TB programme in Oshakati District, focusing on nursing staff. The research will use a questionnaire to collect the information, which will ensure confidentiality is maintained. There will be no manipulation of study participants and also consent will be sought from all the relevant authorities at regional and district level. The information collected will be sent to UNISA for examination purposes and the final marked report will also be handed to the Oshakati District Management. Kindly assist me with information and possible communication with the relevant Ministry officials in Oshana Region. You may contact me on the following number for further clarification and communication: 0814014656 or email: [email protected] Your positive response and support is highly appreciated. Thank you Yours sincerely LINDA VUGUTSA KAGASI

ANNEXURE 2: CLEARANCE CERTIFICATE FROM THE RESEARCH AND ETHICS
COMMITTEE, DEPARTMENT OF HEALTH STUDIES, UNISA
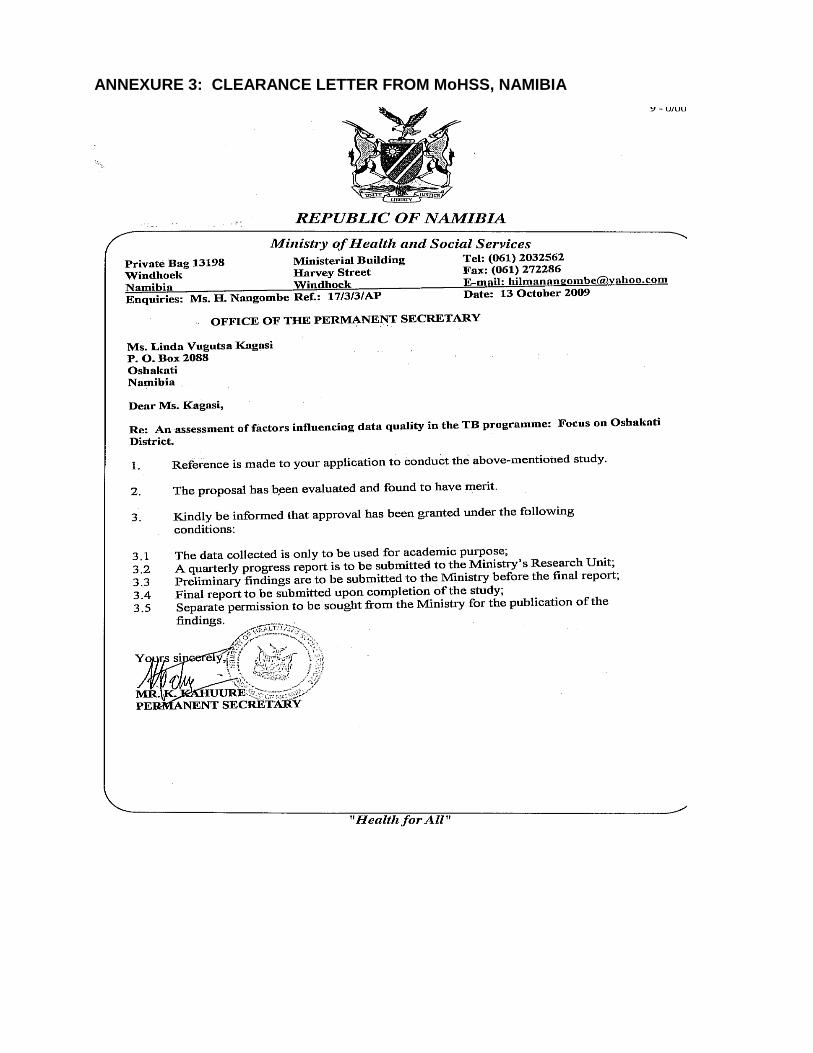
ANNEXURE 3: CLEARANCE LETTER FROM MoHSS, NAMIBIA

1
ANNEXURE 4: INFORMATION SHEET
Dear Participant
Thank you for your willingness to hear about this study. I am a student at the University of South
Africa. I am conducting a research study in Oshakati District in which you are a potential
participant. This is a requirement for the Masters Degree in Public Health which I am busy
completing.
Title of the research
An assessment of factors influencing the quality of data for the TB control programme in
Oshakati District, Namibia.
Purpose of the study
The study aims to identify components related to knowledge and attitudes influencing the quality
of data in the TB programme. It will also describe the practices identified in the literature review
which have been found to influence the quality of data in the monitoring and evaluation in the
TB programme in Oshakati District. This will assist to identify gaps and weaknesses that affect
data collection at the operational level, thus contributing in programme planning and
development of suitable Monitoring and Evaluation data collection tools.
What is your involvement?
You will be asked to answer questions that will include your general information such as gender,
nursing cadre, age, years of experience as a nurse, department to which attached, and current
position in the department. You will also be asked questions related to your knowledge and
training with regards to TB, attitudes related to components that influence the quality of data and
finally, you will be asked to describe practices that are thought to influence the quality of data in
the TB programme in your current department. The whole interview will take 20 to 30 minutes of
your time.
How will you benefit from the study?
You will benefit from this study by providing essential information that will help in introducing
appropriate intervention to improve the Monitoring and Evaluation of the programme and identify
gaps that will result in early interventions to be put in place; this in turn will improve the TB control
activities not only in your district but also in the country.

2
Any risk involved?
Some questions may make you feel as though you are undergoing a performance review.
Confidentiality
Your name will be kept confidential at all times. I will keep all records of your participation,
including a signed consent form which I will need from you, should you agree to participate in this
study, locked at all times and destroy them when the research is completed.
Can you withdraw from the study?
Your participation is totally voluntary. If you choose not to participate, to withdraw, or not to
answer a specific question, you can do that without providing any reason.
Informed consent
What follows now is an informed consent to participate in this study, before I proceed with the
interview. You will be able to review the consent form and then decide to or not to participate.
Further questions
Should you have further questions or wish to know more, I can be contacted through the following
details:
Student Name: Linda Vugutsa Kagasi
Student Number: 37324969
Mobile phone: 0814014656
E-mail: [email protected]
Telephone at work: 065-230525
Fax number: 065-230545
I am accountable to Prof. Lindiwe Zungu, my supervisor at the University of South Africa. Her
contact details are +2712 429 6588 (office), Department of Health Studies: e-mail:

ANNEXURE 5: RESEARCH BUDGET
ITEM DESCRIPTION
COST PER UNIT
(RANDS)
QUANTITY REQUIRED
AMOUNT (RANDS)
1 Stationery 800
2 Travelling Expenses
.97 per litre 220 800
3 Printing 200 paper copies
800 6,000
4 Photocopying 50 cents per page
1000 1,000
5 Binding 30 4 120
7 Miscellaneous Expenses
2000
TOTAL 10720

ANNEXURE 6: CONSENT FORM FOR RESPONDENTS
Title of Research Project:
AN ASSESSMENT OF FACTORS INFLUENCING THE QUALITY OF DATA FOR THE
TB MANAGEMENT PROGRAMME IN OSHAKATI DISTRICT, NAMIBIA
An assessment of factors influencing the quality of data for the TB management
programme in Oshakati District, Namibia.
This study has been described to me in detail and I clearly understand my role in this
study. I freely and voluntarily agree to participate. I understand that my identity will not
be disclosed and the consent I am going to give will be kept confidential. I may choose
to withdraw or not answer specific questions in this study without giving a reason at any
time and this will not negatively affect me in any way.
Participant’s Name____________________________ Date_________________
Participant’s Signature__________________________ Date_________________
Interviewer’s Name____________________________ Date_________________
Interviewer’s Signature_________________________ Date________________

ANNEXURE 7: MAP OF NAMIBIA SHOWING OSHAKATI DISTRICT
Source: www.mapsofworld.com
Oshakati
District

ANNEXURE 8: TIMELINE FOR ALL ACTIVITIES OF THE STUDY (2009-2010)
ACTIVITY TIME FRAME
Research Proposal is Approved 1st October – 15th October (2009)
Permission Obtained from the MoHSS to Conduct the Study
16th October -25th October
Testing of the Questionnaire and Revision 26th October - 1st November
Data Collection 5th November - 30th November
Code and Prepare for Analysis 1st December -31st December
Data Analysed 1st January -28th February (2010)
Prepare Report 1st February -15th June
Report Handed to UNISA 31st July –30th Ocotoberst
Report Revised and Finalised 30th Octoberl-30th November
Final Report Approved and Prepared to be Archived
1st January- 30th March 2011
Final Report Shared By the MoHSS Oshakati District
1st May 2011

1
ANNEXURE 9: NURSING PRACTITIONER’S QUESTIONNAIRE
Year of study Y Y Y y
Interview date D D M M Y y Y Y
Respondent number
PART A GENERAL INFORMATION
1. What is your gender?
01 Male
02 Female
2. What is your highest nursing rank?
01 Enrolled Nurse
02 Registered Nurse
03
Student Nurse
3. In which age bracket to you fall under?
01 Less than 25 years
02 26 – 35 years
03 36 – 45 years
04 46 – 55 years
05
55-60 years
06 60 years and above

2
4. What are your years of experience as a nurse?
01 Student (indicate your year of study)
02 1 – 3 years
03 4 – 6 years
04 7 – 10 years
05 11 – 13 years
06 14 years and above
5. Which department are you currently attached to?
01 TB Clinic
02 TB Ward
03 HIV Clinic
04 Medical Ward (male)
05 Medical Ward (female)
06 Administration
06
Special Programmes
6. What is your current position in your department?
01- Nurse Manager
02- Special Programmes Nurse
03- Registered Nurse
04- Enrolled Nurse
05- Student Nurse

3
SECTION B: KNOWLEDGE, ATTITUDES AND PRACTICES: FACTORS RELATED TO QUALITY OF
DATA
B.1 KNOWLEDGE
1. Have you ever attended a TB workshop, training or meeting?
01- Yes
02- No
03- Not sure
2. With regards to TB, when was the last time you attended a TB related workshop, training or meeting?
01 Less than 3 months ago
02 3-6 months ago
03 6 months- 1 year ago
04 1-2 years ago
05 Over 2 years ago
06 Never attended one
07 Not sure
3. Which type of TB workshop, training or meeting have you attended?
01 In-service TB training
02 Trainer of trainer
03 TB review meetings
04 National TB meetings
05 International TB meetings or conferences
06 Not applicable

4
4. Rate your knowledge level in the following components using the following key to guide you
VH- Very High (5)
H- High (4)
M- Moderate (3)
L- Low (2)
VL- Very Low (1)
VH
5
H
4
M
3
L
2
VL
1
Dimensions of data quality
Filling in the TB records
The use of the TB records in TB management
Assessing the quality of data collected
Skills in analysing data collected
Entering information into the ETR
5. Rank the following TB data collection tools according to the one where you understand its use and how
to fill it in. Score them from 1 to 7 with 7 being the highest score.
TB register TB patient treatment card TB patient identity card DOT form Patient referral form MDR treatment card MDR side-effect treatment form Isoniazid Prevention Therapy registers Cough register

5
B.2 ATTITUDES
1. Indicate the most appropriate option highlighted in bold
Yes
1
No
2
Not sure
3
TB training events conducted improve understanding of correct recording and reporting
Number of training events, workshops and meetings attended by an individual staff improves data quality in the unit
Type of TB training attended contributes to improvement of data quality
TB training events influence the rate of incomplete records in the unit
2. For each item, which is the code that best represents the extent to which you believe it influences the
quality of data in the TB programme? The following key will guide you:
SA – Strongly Agree (5) A – Agree (4) SD – Strongly Disagree (3) D – Disagree (2) NS – Not Sure (1)
Item
SA
5
A
4
SD
3
D
2
NS
1
Number of training events attended
Type of TB training attended
Frequency of supervision
Number of staff trained in a unit on data collection influences the quality of data collected
Number of forms to be filled in for each patient
Relevance of data to daily work in the unit
Data collected assists in decision making
Data collected eases workload
Data collected improves patient management
All the forms are useful in TB management
Trust the findings received from the lab
Data quality assists in timely diagnosis of the patient
Data collected is used by decision makers

6
3. Rank the following TB data collection tools according to the one you believe is useful in managing the
TB programme in Oshakati District. Score them from 1 to 7 with 7 being the highest score.
TB register TB patient treatment card TB patient identity card DOT form Patient referral form MDR treatment card MDR side- effect treatment form Isoniazid Prevention Therapy registers Cough register
B.3 PRACTICES
1. Which practices influence the quality of data in the TB programme in Oshakati State Hospital?
Practice Yes
1
No
2
Not sure
3
Time between reviewing patient and entering information into the TB records
Time taken to receive sputum results from the lab
Referring to the TB guidelines before conducting any activity
Number of supportive supervisions conducted by Programme Managers
Frequency of auditing the TB records
The number of incomplete records

7
2. How would you rate the frequency of the following activities? Use the guide below to indicate the option
that best suits you.
F – Frequently (4) S – Sometimes (3) ND - Not Done (2) NU- Not Used (2) only applicable to question 3 in this section NS - Not Sure (1)
Activity F
4
S
3
ND
2
NS
1
Supportive supervision from the district level
Supportive supervision from the regional level
Supportive supervision from the national level
Referring to the TB guidelines before conducting any activity
Feedback from TB zonal review meetings and district review meetings
Feedback from staff who attend workshops, trainings or TB meetings
Auditing of TB data in the unit
Use of TB records to determine supplies to be ordered
Use of data collected for decision making
3. Rate the use of the following TB records in TB management
Records F
4
S
3
NU
2
NS
1
TB registers
TB patient treatment card
TB identity cards
DOT forms
Patient referral form
MDR treatment card
MDR side-effect treatment form
Isoniazid Prevention Therapy register
Cough register

8
4. What other factors do you think influence the quality of data in the TB programme at Oshakati District?
Please describe them in the space provided below:
______________________________________________________________________
______________________________________________________________________
______________________________________________________________________
______________________________________________________________________
______________________________________________________________________
______________________________________________________________________
______________________________________________________________________
______________________________________________________________________